Embed Size (px)
Citation preview

UTC Investor and Analyst Meeting
March 10, 2016

Note: All results and expectations in this presentation reflect continuing operations unless otherwise noted.
Cautionary Statement:
This presentation includes statements that constitute “forward-looking statements” under the securities laws. Forward-looking statements often contain words such as “believe,” “expect,”
“expectations,” “plans,” “strategy,” “project,” “prospects,” “estimate,” “target,” “anticipate,” “will,” “should,” “see,” “guidance,” “confident” and similar terms. Forward-looking statements may include,
among other things, statements relating to future sales, earnings, cash flow, results of operations, uses of cash, share repurchases and other measures of financial performance or potential future
plans, strategies or transactions. All forward-looking statements involve risks, uncertainties and other factors that may cause actual results to differ materially from those expressed or implied in the
forward-looking statements. Such risks, uncertainties and other factors include, without limitation: the effect of economic conditions in the industries and markets in which we operate in the U.S. and
globally and any changes therein, including financial market conditions, fluctuations in commodity prices, interest rates and foreign currency exchange rates, levels of end market demand in
construction and in both the commercial and defense segments of the aerospace industry, levels of air travel, financial condition of commercial airlines, changes in government procurement priorities
and funding, the impact of weather conditions and natural disasters and the financial condition of our customers and suppliers; challenges in the development, production, delivery, support,
performance and realization of the anticipated benefits of advanced technologies and new products and services; future levels of indebtedness and capital spending and research and development
spending; future availability of credit and factors that may affect such availability, including credit market conditions and our capital structure; delays and disruption in delivery of materials and services
from suppliers; customer- and company-directed cost reduction efforts and restructuring costs and savings and other consequences thereof; the scope, nature, impact or timing of acquisition and
divestiture activity, including among other things integration of acquired businesses into our existing businesses and realization of synergies and opportunities for growth and innovation; new business
opportunities; our ability to realize the intended benefits of organizational changes; the anticipated benefits of diversification and balance of operations across product lines, regions and industries; the
timing and scope of future repurchases of our common stock; the outcome of legal proceedings, investigations and other contingencies; pension plan assumptions and future contributions; the impact
of the negotiation of collective bargaining agreements and labor disputes; the effect of changes in political conditions in the U.S. and other countries in which we operate; and the effect of changes in
tax, environmental, regulatory (including among other things import/export) and other laws and regulations in the U.S. and other countries in which we operate. The forward-looking statements speak
only as of the date of this presentation and we undertake no obligation to update or revise any forward-looking statements, whether as a result of new information, future events or otherwise, except as
required by applicable law. Additional information as to factors that may cause actual results to differ materially from those expressed or implied in the forward-looking statements is disclosed from time
to time in our reports on Forms 10-K, 10-Q and 8-K filed with or furnished to the SEC from time to time, including, but not limited to, the information included in UTC's Forms 10-K and 10-Q under the
headings “Business,” “Risk Factors,” “Management's Discussion and Analysis of Financial Condition and Results of Operations” and “Legal Proceedings” and in the notes to the financial statements
included in UTC's Forms 10-K and 10-Q.


United Technologies
Priorities Flawless execution
Innovation for growth
Structural cost reduction
Disciplined capital allocation

2:00 – 2:05 Opening Remarks Hayes
2:05 – 2:20 Financial Overview Johri
2:20 – 2:50 Otis / Q&A Delpech
2:50 – 3:20 CCS / Q&A McDonough
3:20 – 3:35 Break
3:35 – 4:05 UTAS / Q&A Gitlin
4:05 – 4:35 Pratt & Whitney / Q&A Leduc
4:35 – 5:00 Closing Remarks / Q&A Hayes / Johri
5:00 – 6:00 Reception All
United Technologies Agenda

Akhil Johri
March 10, 2016
Chief Financial Officer

Positioned for Growth Mega-trends
Source: United Nations: World Urbanization Prospects, 2014 revision; The Brookings Institution; Airline Monitor
Powerful mega-trends provide significant growth opportunities for UTC core business segments
Urban Population Mega-cities (population >1 million) (billions) (billions)
27%
58%
2010 2015E 2020E 2025E 2030E
~225
~360
~500
~660
1985 2000 2015E 2030E
3.6 4.0
4.3 4.7
0
1,000
2,000
3,000
4,000
5,000
6,000
7,000
8,000
9,000
1970 1980 1990 2000 2010 2020E 2030E
~6% CAGR
Middle class ~6% CAGR
5.1
Revenue Passenger Miles
1

Positioned for Growth Organic Sales Outlook
10%+
5 - 7%
4 - 5%
• ~7,000 engine orders* with industry leading GTF technology
• 30+ systems nose to tail… content per platform up 2x
4 - 5% • Leveraging global scale… with increased innovation spending
• World-class brands… strong replacement demand
See appendix for definition and reconciliation of organic sales *Announced and unannounced firm & option orders
(2016E - 2020E CAGR)
2

Growth / Productivity Achieving Competitive Excellence (ACE)
Operating management system driving continuous improvement
72 74
79
2013 2014 2015
ACE Sites
Supplier Gold
Competency
2013 2014 2015
Performing / Gold
Progressing / Underperforming
(% Gold & Silver)
Customers
SIPOC
Roadmap
Control Tower
0
5
135
Impact/Maturity
D I V E
Turnback Trend
Feedback Comments
3

Productivity
Source: Public company records and internal estimates *Excludes restructuring and other significant items of a non-recurring and/or non-operational nature (referred to as “other significant items”). excludes Sikorsky and years 1996 - 2007 have not been restated for discontinued operations for businesses disposed in 2012 - 2015
Restructuring 2015 – 2018E Cumulative cost ~$1.5B
Annualized savings ~$900M
SG&A Productivity
10.5%
13.0% 13.7%
17.2%
20.4%
23.2%
15.1%
(2015 % of sales)
0.0
1.0
2.0
3.0
4.0
5.0
6.0
7.0
96 97 98 99 00 01 02 03 04 05 06 07 08 09 10 11 12 13 14 15
(% indexed to 1996*)
Segment profit
Segment sales
Headcount
(Industrial)
4

Productivity
*1995 & 2005 reported operating margins, 1995 & 2005 have not been restated for discontinued operations for businesses disposed of in 2012-2015; 2015 adjusted for restructuring and other significant items. See appendix for reconciliation.
World-class margins — with upside
8%
13%
17%
1995 2005 2015
(% operating margin*)
0 5 10 15 20 25
P&W
UTAS
CCS
Otis
Highest peer (% operating margin*)
2015 Operating Margins UTC Segment Margins
Source: Public company records and internal estimates 5

Cash Generation
Years 1996 - 2007 have not been restated for discontinued operations for businesses disposed in 2012- 2015 See free cash flow definition and reconciliation in appendix
80%
100%
120%
140%
160%
180%
2011 2012 2013 2014 2015
0
2
4
6
8
10
2011 2012 2013 2014 2015
0%
20%
40%
60%
80%
100%
120%
2006 2007 2008 2009 2010 2011 2012 2013 2014 2015
Strong cash generator through the investment cycles
Free Cash Flow to Net Income (%) % Capex / Depreciation
Net Inventory Turns
6

~$8 / share
Capital Allocation
'00 - 02 '03 - 05 '06 - 08 '09 - 11 '12 - 14 '15 - 17E
Dividends Share repurchase
3
10 10
22
($ billions)
*Based on ~7000 firm and option GTF orders to date
5
9
6
16
(~10B)
~7B
P/E view Cash flow view
Disciplined capital deployment
Pratt & Whitney large commercial engines* Value Disconnect Return to Shareholders
~($12) / share
7

Shareholder Value Creation
• Focused portfolio of global franchises
• Resilient business model
• Innovative products and services
• Strong performance culture
• Disciplined capital allocation
8

2016 outlook reaffirmed Sales $56 - $58B (organic growth 1 - 3%)
Adjusted EPS** range $6.30 - $6.60 Free cash flow*** 90 - 100% of net income attributable to common shareowners
See appendix for definition of organic growth *Excludes refrigeration **Adjusted for restructuring and other significant items. See appendix for reconciliation. ***See free cash flow reconciliation and definition in appendix
(% VPY)
2016 Organic Sales Expectations
4 - 6%
1 - 3%
2 - 4%
5 - 7%
0 - 2%
4 - 6%
(7) – (10%)
Americas
Commercial OE
EMEA
Commercial*
Aerospace
China
6%
(5%)
6%
(5%)
1%
5%
(2%)
Asia (ex-China)
Commercial aftermarket
Military
2015 2016E
9

Philippe Delpech
March 10, 2016
President Otis

Note: A, B, C represent industry peers Source: Public company reports & internal estimates *Otis operating profit adjusted for restructuring and other significant items. See appendix for reconciliation.
2015: ~$65 billion
A
B C
All others
18%
Industry Leadership 2015
12.0 9.6 9.1 8.0
1.9 1.4 1.2 1.1
2.4
1.4 1.0 0.9
20% 14% 11% 11%
($ billions) (units, millions) ($ billions) +25% +36%
+6 pts +71%
A B C B C A A C B A B C
($ billions)
Sales Portfolio EBIT ROS
* *
Industry
EBIT
1

6.1
12.0
12%
20%
2000 2005 2010* 2015*
Global scale and balance
Otis
Operating profit % Sales ($ billions)
Industry leader
Large and growing maintenance base
Productivity runway on service
Attractive growth fundamentals
Best-in-class cash flow
*Adjusted for restructuring and other significant items. See appendix for reconciliation.
(@ afx)
2

Challenges
Service Service conversion 15-30 year
lifecycle with retention
Repair
Maintenance
Modernization
New equipment
Source: Internal estimates
100 83
115
2010 20152010 2015
Otis Otis ROW Otis Europe
Service Profit (indexed)
Share of Segment (in units)
3

Accelerate innovation
Service transformation
Operations excellence
New equipment growth
Strategic Initiatives
4

New Equipment Growth – China
ROW
2015: ~$35B Continued urbanization Infrastructure development
Source: Internal estimates
China
Otis position
#1 #2
Global Segment
• Strengthen core brands
• Leverage scale
• Customer segment focus
China Transformation
5

• Expand sales coverage
• Enhance product offering
• Align incentives for profitable growth
53%
24%
15%
MEA Americas Europe Asia(ex. China)
(1%)
Otis ex. China 17%
Asia (ex. China)
Europe
Americas
MEA
(@ cfx)
New Equipment Growth – Rest of World
Growth Strategy
2015: ~$17B
#1
#1
#1
#1
Source: Internal estimates
ROW Segment
Otis position
2015 Orders VPY
6

2010 2015 2020E
(R&D spend, $ millions, @ cfx)
(% of sales)
1.1%
130
Innovation
• Leverage capabilities
• Accelerate programs
• Address product gaps
• Design for service
Priorities
New lead design center in China
Design next generation elevator
7

Service Transformation
Differentiated offerings Field productivity Customer retention
Deploy enhanced digital tools
Value added
Non-value added
Mechanic Time
8

2005 2010 2015
1.0x
5.8x
Service Transformation – China
Service Base (units, indexed 2005 = 1.0)
• Service conversion
• Segmented offering
• Repair and modernization growth
• Portfolio acquisitions
Regulations & enforcement
Higher customer expectations
Industry fragmentation
Priorities
Service Segment
Source: Internal estimates *Independent service providers
Otis portfolio Segment
ISP’s* and OEM agents
Major OEM’s
9

France Rest of Europe
Europe Field Sourcing(% centralized procurement)
China Supply Base(# of suppliers)
Commonacross Otis
Operations Excellence
Factories
Sub-systems
Global Factory Footprint
Highcost
Lowcost
Sourcing
10

2010 2015 2020E
2010 2015 2020E2010 2015 2020E
2010 2015 2020E
(units)
8%
33%
2%
>50%
~3%
2% ~15% China flat ROW ~5%
(5-year CAGR)
Key Metrics (@ cfx)
24%
(@ cfx) New Equipment Growth
(orders)
Service Transformation (maintenance portfolio)
Service Transformation (China service conversion rate)
Accelerate Innovation (R&D investment) (5-year CAGR)
(5-year CAGR)
11
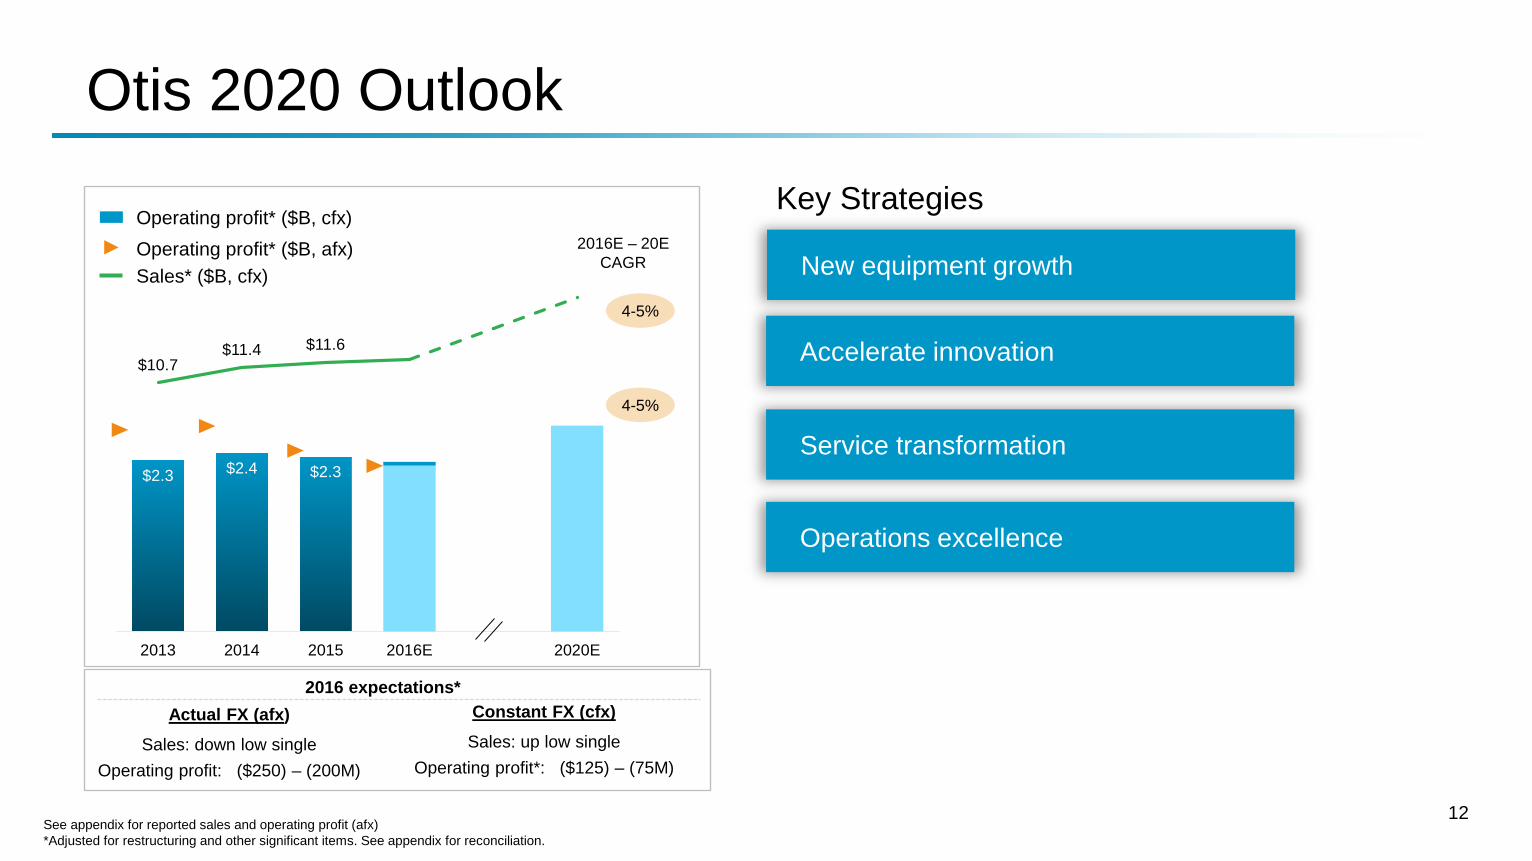
$2.3 $2.4 $2.3
$10.7 $11.4 $11.6
-
2.0
4.0
6.0
8.0
10.0
12.0
14.0
16.0
18.0
2013 2014 2015 2016E 2020E
Operating profit* ($B, cfx)
2016-20 CAGR
4-5%
4-5%
Sales* ($B, cfx)
Otis 2020 Outlook Key Strategies
Accelerate innovation
Service transformation
Operations excellence
New equipment growth 2016E – 20E
CAGR Operating profit* ($B, afx)
See appendix for reported sales and operating profit (afx) *Adjusted for restructuring and other significant items. See appendix for reconciliation.
Actual FX (afx) Sales: down low single
Operating profit: ($250) – (200M)
Constant FX (cfx) Sales: up low single
Operating profit*: ($125) – (75M)
2016 expectations*
12

Bob McDonough
March 10, 2016
President UTC Climate, Controls & Security

Sales $16.7 billion
Operating profit* $2.9 billion
Operating profit* % 17.5%
Employees 55,000
UTC Climate, Controls & Security
Asia
EMEA Americas
New equipment
Field services
• North America Residential HVAC
• Commercial HVAC
• Refrigeration
• Fire & Security
(2015 sales @ afx)
*Adjusted for restructuring and other significant items. See appendix for reconciliation.
F&S products
Transicold
F&S field
Commercial refrigeration
Residential HVAC
Commercial HVAC
1

Operating profit*
Operating profit* (%)
1.9
2.3 2.4 2.6
2.9 2.9 10.8%
12.2%
14.1%
15.7% 17.0%
17.5%
2010 2011 2012 2013 2014 2015 2016E
$175 – 225M @ cfx $100 – 150M @ afx
VPY @ cfx 7% 11% 10% 7% 7% 18%
CAGR ‘10-’15
Organic 3%
Profit* 9%
CCS Priorities
($ billions)
*Adjusted for restructuring and other significant items. See appendix for reconciliation.
Organic growth
Innovation
Cash generation
Cost leadership
2016 profit expectations*
2

up mid single digit
up low single digit
up mid single
up slightly Refrigeration
Americas
EMEA
Asia ex China
China
2016 Outlook
Transport refrigeration
Commercial refrigeration
F&S field
F&S products
Commercial HVAC
NA Residential HVAC up mid single digit
up low single digit
up low single digit
up slightly
up mid single digit
flat
2016 expectations Organic sales: up low single digit
Operating profit* (cfx): $175 – 225M Operating profit* (afx): $100 – 150M
CCS Sales Organic Sales Growth
*Adjusted for restructuring and other significant items. See appendix for reconciliation.
3

Iconic brands Building solutions M&A opportunities Innovation
Value Creation Growth
Cost leadership Operations excellence Cash generation Market fundamentals
Performance
Low cost manufacturing
Lower cost (hours)
Higher cost (hours)
Footprint reduction (2011–15)
R&D centers Factories Branches
28% 23%
15%
2012 2013 2014 2015 2016E
Free cash flow*
~100% of NI
*See free cash flow definition and reconciliation in appendix
4

Source: United Nations: World Urbanization Prospects, 2014 revision; Green Market Size: McGraw Hill Construction Dodge, 2014; internal estimates
2.6 2.9
3.2 3.6
4.0 4.3
4.7
95 00 05 10 15E 20E 25E
0
120
2005 2010 20150
25
50
75
100
75 80 85 90 95 00 05 10 15
U.S. Europe China
Market Growth Fundamentals Urbanization
Replacement (U.S. splits installed base, units in millions)
Energy Efficiency (U.S. green building construction, $ billions)
Adoption (commercial fire detection spend per capita) (global urban population, billions)
5

0.0
0.8
1.6
2.4
00 03 06 09 12 15
0
2
4
6
8
75 80 85 90 95 00 05 10 15
• Industry-leading brands
• Innovation
• Low-cost footprint
• Best-in-class distribution
Source: U.S. Census Bureau; Global Insight; internal estimates
North America Residential HVAC Growth Drivers
Housing Starts (units, millions)
Industry Shipments (U.S. splits, units in millions)
Add-on / replacement New construction
Market Fundamentals
6

Global Green Buildings
Urbanization
2.6 2.9
3.2 3.6
4.0 4.3
4.7
1995 2000 2005 2010 2015E 2020E 2025E
0%
40%
2012 2015 2018E
2X
2X
(respondents with >60% green building projects)
Source: United Nations: World Urbanization Prospects, 2014 revision; World Green Building Trends 2016, Dodge Data & Analytics
Commercial HVAC
• Innovation and efficiency
• Product breadth
• Global footprint
• Automation and controls
(global urban population, billions)
Growth Drivers Market Fundamentals
7

U.S. Europe China India
Refrigeration Spend Per Capita
0
25
50
75
100
125
06 07 08 09 10 11 12 13 14 15
Refrigerated Seaborne Trade (tons, millions)
Source: Global Insight; internal estimates
Refrigeration
• Innovation
• Commercial refrigeration capability
• Product line expansion
Growth Drivers Market Fundamentals
8

U.S. Europe China
U.S. Europe China
(spend per capita) Access Control Adoption
Source: internal estimates
Fire & Security
• High technology products
• Field footprint
• Security product breadth
• Strong brand portfolio
Commercial Fire Control Adoption (spend per capita)
Growth Drivers Market Fundamentals
9

• Consultative selling
• Strategic accounts
• Integrated solutions
Building Solutions Growth Intelligent products Connected systems Integrated buildings
10

$2.4 $2.7
$2.9
$15.3 $15.5 $16.4
-
5.00
10.00
15.00
20.00
-
0.0
0.0
0.0
0.0
0.0
0.0
2013 2014 2015 2016E 2020E
2016E – 20E CAGR
4 - 5%
7 - 8%
CCS 2020 Outlook ($ billions)
Operating profit* (cfx)
Sales* (cfx)
Operating profit* (afx)
Actual FX (afx) Sales: flat
Operating profit: $100 – 150M
Constant FX (cfx) Sales: up low single
Operating profit: $175 – 225M
*Adjusted for restructuring and other significant items. See appendix for reconciliation. See appendix for sales and operating profit at actual FX (afx)
2016 expectations*
Organic growth
Innovation
Cash generation
Cost leadership
M&A actions
Key Strategies
11

Dave Gitlin
March 10, 2016
President UTC Aerospace Systems

UTC Aerospace Systems
1
90 product lines supporting 1,500 operators on 70,000 aircraft
Industry-leading portfolio
Well-positioned on new platforms
Deep customer relationships
Proven track record to drive continued cost reduction
Strategies in place position us for long-term growth

Sales Drivers
2015 sales: $14.3B* Driver Trend
Mili
tary
RPMs
Fuel prices / airline profitability
New program EIS
Surplus availability
Military OEM platforms
ISR
Defense spending
CAGR 2016E – 2020E
Mid to high single digit
Com
m A
M
Mid single digit
Low single digit
Commercial OEM
Commercial aftermarket
Military
Driver Trend
Driver Trend
Com
m O
EM
Large commercial
Regional
Bizjet / rotorcraft
*Adjusted for restructuring and other significant items. See appendix for reconciliation.
2

Program Execution
$240B+ expected life of program sales
A321neo A350-1000
737MAX
A330neo
C919
B777X
KC-46A
787-10
MC-21 CSeries
MRJ
E2
G500/600 KC-390 CH-53K
3

New Program Introduction
2015 2016E 2017E 2018E
Legacy programs
New programs
Large commercial / regional aircraft sales
175
350
500
2016E 2017E 2018E
($ millions)
OEM Mix Cost Reduction Target
4

Productivity Footprint Supply Chain
Cost Reduction
1 25 5 10 15 20 Year
Nac
elle
shi
pset
cos
t (in
dexe
d)
Wroclaw, Poland
• Center of excellence model • Low-cost make
• Localized supply base • Low-cost buy
Poland
New program Legacy program UTAS COE
UTAS supplier
5

Commercial Aftermarket
2015 2016E 2017E 2018E
$4.4B
Provisioning
Repair
Spare parts
Sustained Growth Key Strategies
CAGR
5 - 7%
3 - 5%
2 - 4%
4 - 6% • Expand surplus capability
• Increase operator long-term agreements
• Grow partnerships with independent
service providers (ISPs)
• Provide more comprehensive offerings
6

Growth
$240B+ expected life of program sales
Advanced nacelle
Variable-speed constant frequency generator
Blended night vision goggles
Next-generation ejection seats
Platforms Technology Advancements Military / Retrofits
7

Growth
$1B sales $6B sales $15B sales
Components
15 product lines 40 product lines 90 product lines
Systems Integrated systems
B767 – 2 systems B777 – 6 systems B787 – 26 systems
Hamilton Standard Hamilton Sundstrand UTC Aerospace Systems
What’s next: Continued focus on expanding aerospace systems offerings
8

$2.1 $2.4 $2.4
$13.3 $14.2 $14.3
-
5.00
10.00
15.00
20.00
25.00
0
5E-10
1E-09
1.5E-09
2E-09
2.5E-09
3E-09
3.5E-09
4E-09
4.5E-09
2013 2014 2015 2016E 2020E
UTC Aerospace Systems 2020 Outlook
5 - 7%
7 - 9%
2016E – 20E CAGR
Sales* ($B)
Operating profit* ($B)
*Adjusted for restructuring and other significant items. See appendix for reconciliation.
2016 expectations* Sales: up low single digit
Operating profit: ($50) – 0M
Key Strategies
Industry-leading portfolio
Well-positioned on new platforms
Deep customer relationships
Proven track record to drive continued cost reduction
Strategies in place position us for long-term growth
9

Bob Leduc
March 10, 2016
President Pratt & Whitney

Pratt & Whitney
High quality and diverse backlog
Extensive aftermarket services network
Industry leading technologies
Positioned on leading platforms
1

2
Accomplishments in Last 15 Months
C Series certified
E-Jets E2 roll out ceremony MRJ first flight
First A320neo deliveries to IndiGo and Lufthansa
Large Commercial Engines
F-35B Initial Operational Capability
KC-46A Tanker first refueling flight
Military Engines
Photo: Dassault
Dassault Falcon 8X first flight
Gulfstream G500 first flight
Pratt & Whitney Canada
Photo: Lockheed Martin
Photo: Gulfstream Photo: Airbus Photo: Bombardier

3
18
32
59
2016E 2017E 2018E2008 2009 2010 2011 2012 2013 2014 2015 2016
YTD
High Quality and Diverse Backlog GTF Engine Orders Orders by Platform
*Announced and unannounced firm engine orders, including options
~7,000
~7,000
New customers
Existing customers
A320neo
E-Jets E2
CSeries
MRJ
MC-21
Cumulative Customer Launches
(number of Geared TurbofanTM engines*)

4
P&W legacy
V2500
GP7000
GTF
0
5,000
10,000
15,000
20,000
25,000
2000 2005 2010 2015 2020E 2025E 2030E2015 2016E 2020E
Commercial Engines
GTF
V2500
All other
2015-2020E CAGR ~19%
~650
558
~1,200
Objective Actual engine cost/ engine
Engines
87% learning curve
54%
0 250 500 1250 750
Large Engine Shipments Cost Reduction Installed Base (number of engines)
(number of large commercial engines) (PW1100G-JM engine cost)

5
Pratt & Whitney Canada
Growth platforms
#2
PW800
Cessna Latitude
Gulfstream G500/G600
PW300
#1
AT502XP
ATR72-600 PW100
PT6A
#1
PW210
H135
AW169
PW206
#2
B787
A320ceo family APS3200
APS5000
Position
Business Aviation
Turboprop / General Aviation
Civil Helicopter
Auxiliary Power Unit
Photo: © ATR Photo: Airbus
Photo: Gulfstream Photo: © Air Tractor Photo: Boeing

6
Pratt & Whitney Canada
-
10,000
20,000
30,000
40,000
50,000
60,000
70,000
80,000
2000 2010 2020E
General aviation
Regional
Business jet
Helicopter
APU
2030E
3,005 ~2,850
~3,500
2015 2016E 2020E
2015-2020E CAGR ~4%
APU Helicopter Business jet Regional General aviation
Engine Shipments Installed Engine Base

7
Long Range Strike Bomber
Pratt & Whitney Military Engines
UAV
Helicopters
F-35 Joint Strike Fighter
F-15 / F-16
F-22 Raptor
C-17 Globemaster
KC-46A Pegasus
KC-390 V-22 Osprey
A400M Atlas
CH-53K King Stallion
Future Opportunities Tactical Mobility / Tanker Auxiliary Power Unit
Photo: Lockheed Martin
Photo: Sikorsky
Photo: Embraer
Photo: Airbus

8
2015 2016E 2020E 0 50 100 150 200 250 300 350 400
Objective Actual engine cost / engine
0
2,000
4,000
6,000
8,000
10,000
2010 2015 2020E
Legacy bomber / special mission / trainers
Tactical
Mobility / tanker
Engines
49%
89% learning curve
Pratt & Whitney Military Engines
2015-2020E CAGR ~17%
*Excludes 8,800 APUs growing to 15,500 in 2020
F100 Tanker F117 F135
Engine Shipments Installed Base Cost Reduction (engines)
(engines*)
(F135 engine cost)
18.8%
~100
~200
96

9
40%
60%
75%
80%
PW4000 V2500 GP7000 GTF
Aftermarket – Growing Engine Services
P&W PROPRIETARY This document/page does not contain any export regulated technical data
Average engine age (years)
new 3 8 17
Shop Visits Global Service Network Service Model (number of shop visits)
2015 2016E 2020E
8,071 ~8,400
GTF
Legacy
V2500 GP7000
Biz
APU
Helo
GA
Regional
2016E-2020E CAGR ~3%
Aftermarket service centers Large commercial engine Pratt & Whitney Canada
~12,400 Operators
~70,000 Engines in
service
(commercial fleet coverage)

10
Q1 Q2 Q3 Q4
~185
Operations – Delivery Assurance
P&W PROPRIETARY This document/page does not contain any export regulated technical data
99%
~1,500 GTF engine part numbers
1%
Strategic buffer in place
Building a buffer
JSF Legacy V2500 GTF
Large Engine Shipments Part Buffer (average % availability)
26% 22% 10%
17% 18%
15%
34% 39% 54%
23% 21% 21%
2014 2015 2016E
Gold
Performing
Under- performing
Suppliers in program 264 413 ~425
~220
~190 ~190
Progressing
(2016E) Supplier Gold
(% of spend in program)

11
Constant FX (cfx) Sales: up low single
Operating profit: ($125) – (75M)
Pratt & Whitney 2020 Outlook
Industrial plan execution
$1.9
$2.1 $1.9
$14.5 $14.5 $14.2
-
5.00
10.00
15.00
20.00
25.00
-
0.0
0.0
0.0
0.0
0.0
0.0
0.0
0.0
0.0
2013 2014 2015 2016E 2020E
10+%
6 - 8%
Sales* Operating profit*
($ billions)
2016E - 20E CAGR
Key Strategies
Successful IOC / service entries
Manufacturing cost reduction
E&D stabilization
Aftermarket growth
*Adjusted for restructuring and other significant items. See appendix for reconciliation.
Actual FX (afx) Sales: up low single
Operating profit: ($50) – 0M
2016 expectations*

Appendix

2016 Segment Outlook
1 *Excludes restructuring & certain other items
Organic sales change
Reported sales change
Operating profit change*
(ex FX)
Operating profit change*
Climate, Controls & Security up low single digit flat $175 – 225M $100 – 150M
Otis up low single digit down low single digit ($125) – (75M)
($250) – (200M)
Pratt & Whitney up low single digit up low single digit ($125) – (75M) ($50) – 0M
Aerospace Systems up low single digit up low single digit ($50) – 0M ($50) – 0M
*Adjusted for restructuring and other significant items

up high single digit
up slightly
down low single digit Americas
EMEA
Asia
up low single digit
Asia
EMEA
Americas
Service
Asia*
EMEA
Americas
New equipment flat
~ 10%
up low single digit
down high single digit
up low single digit
up mid single digit
up high single digit
flat
* China down ~10%
(% organic sales change)
2016 Otis Sales Expectations Outlook

Profit Drivers
Operating Profit
Sales
Constant FX ($125) – (75M)
Actual FX ($250) – (200M)
Volume + 25 – 75
Net productivity / restructuring + ~125
Pension + ~25
Price / mix – ~250
R&D / other – ~50
Constant FX – ($125) – (75M)
FX – ~ 125M
Actual FX – ($250) – (200M)
Organic up low single digit
Actual FX down low single digit
Otis 2016 Expectations
Adjusted for restructuring and other significant items
($ millions)

Profit Drivers
Operating Profit
Sales
Constant FX + $175 – 225M
Actual FX + $100 – 150M
Organic volume / mix + 50 – 100
Net productivity / restructuring + ~75
Commodities / price + ~50
Pension + ~50
Non-recurring / other – ~50
Constant FX + $175 – 225M
FX – ~ 75M
Actual FX + $100 – 150M
Organic up low single digit
Actual FX flat
CCS 2016 Expectations
Adjusted for restructuring and other significant items
($ millions)

Operating Profit
down $0 – 50M
Sales
up low-single digit
Pratt & Whitney 2016 Expectations ($ millions)
Pension
E&D
Commercial aftermarket
Commercial OE mix
Military
2016 expectations (@ constant FX)
FX
2016 expectations
+ ~175
+ 0 – 25
+ 0 – 25
– ~225
– ~75
($125) – (75M)
+ 75M
($50) – 0M
Military AM
Military OE
Commercial AM*
Commercial OE*up low
single digits
flat
up high single digits
up double digits
Adjusted for restructuring and other significant items. *Includes large commercial and P&W Canada

– 325 – 300
+ 175 – 200
– ~150 + ~125
+ ~125
Aerospace Systems 2016 Expectations
Military AM
Military OE
Commercial AM
Commercial OE up mid single digit
up low single digit
down low single digit
down high single digit
Adjusted for restructuring and other significant items.
Volume / mix
Product cost reduction
2015 contract / license agreements
R&D / cost actions
Pension
Operating Profit
down $0 – 50M
Sales
up low-single digit
($ millions)

2015 Full Year Sales Change
Total Organic FX Net Acquisitions Other Otis (8%) 1% (9%) 0% 0%
CCS (1%) 3% (6%) 2% 0%
Pratt & Whitney (3%) (1%) (1%) 0% (1%) Aerospace Systems (1%) 3% (2%) (1%) (1%) Total UTC* (3%) 1% (4%) 1% (1%)
Organic sales growth represents the total reported consolidated net sales increase/(decrease) within the Corporation’s ongoing businesses less the impact of foreign currency translation, and acquisitions and divestitures completed in the preceding twelve months and significant items of a non-recurring and/or non-operational nature. Organic growth includes the net impact of transactional foreign exchange hedging. *Reflects consolidated net sales

Free Cash Flow Reconciliation
Free cash flow represents cash flow from operations less capital expenditures. Management believes free cash flow provides a relevant measure of liquidity and a useful basis for assessing the Corporation’s ability to fund its activities, including the financing of acquisitions, debt service, repurchases of the Corporation’s Common Stock and distribution of earnings to shareholders. Others that use the term free cash flow may calculate it differently. The reconciliation of net cash flow provided by operating activities prepared in accordance with Generally Accepted Accounting Principles to free cash flow is above.
FY 15 FY14 Net income attributable to common shareowners from continuing operations
3,996 6,066
Depreciation & amortization 1,863 1,820
Change in working capital (847) (729)
Other 1,686 (163)
Cash flow from operations 6,698 6,994
Capital expenditures (1,652) (1,594)
Free cash flow 5,046 5,400
Free cash flow as a % of net income attributable to common shareowners from continuing operations
126% 89%
($ millions)

UTC Operating Results Reconciliation
2008 2009 2010 2011 2012 2013 2014 2015Segment Sales 1 51,932 44,586 46,004 48,772 51,443 57,141 58,528 56,863Other significant items of a non-recurring/non-operational nature 2 - - - - - - - 352Segment sales - adjusted 51,932 44,586 46,004 48,772 51,443 57,141 58,528 57,215
Segment operating profit 7,230 6,074 6,890 7,653 7,470 9,074 9,777 8,023Other significant items of a non-recurring/non-operational nature 2 (129) (136) 33 (84) (157) (223) (31) 1,182Restructuring 327 718 359 262 518 431 349 375Segment operating profit - adjusted 7,428 6,656 7,282 7,831 7,831 9,282 10,095 9,580
Segment operating margin 13.9% 13.6% 15.0% 15.7% 14.5% 15.9% 16.7% 14.1%Segment operating margin - adjusted 14.3% 14.9% 15.8% 16.1% 15.2% 16.2% 17.2% 16.7%
1 Segment sales for periods prior to 2009 reflect the retrospective adoption of Accounting for Collaborative Arrangements.
2 Details of other significant items of a non-recurring/non-operational nature See Segment operating results reconciliation slides for additional information.
($ millions)

Otis Operating Results Reconciliation 2008 2009 2010 2011 2012 2013 2014 2015
Segment Sales 12,884 11,723 11,579 12,437 12,056 12,484 12,982 11,980Other significant items of a non-recurring/non-operational nature - - - - - - - -Segment sales - adjusted 12,884 11,723 11,579 12,437 12,056 12,484 12,982 11,980
Segment operating profit 2,477 2,447 2,575 2,815 2,512 2,590 2,640 2,338Other significant items of a non-recurring/non-operational nature 1 - (52) - - - - - -Restructuring 21 158 83 73 164 88 87 51Segment operating profit - adjusted 2,498 2,553 2,658 2,888 2,676 2,678 2,727 2,389
Segment operating margin 19.2% 20.9% 22.2% 22.6% 20.8% 20.7% 20.3% 19.5%Segment operating margin - adjusted 19.4% 21.8% 23.0% 23.2% 22.2% 21.5% 21.0% 19.9%
1 Details of other significant items of a non-recurring/non-operational nature 2009: Approximately $52 million non-cash, non-taxable gain recognized on the remeasurement to fair value of a previously held equity interest in a joint venture resulting from the purchase of a controlling interest.
($ millions)

CCS Operating Results Reconciliation 2008 2009 2010 2011 2012 2013 2014 2015
Segment Sales 21,263 16,838 17,876 18,864 17,090 16,809 16,823 16,707Other significant items of a non-recurring/non-operational nature 1 - - - - - - - -Segment sales - adjusted 21,263 16,838 17,876 18,864 17,090 16,809 16,823 16,707
Segment operating profit 1,858 1,233 1,776 2,212 2,425 2,590 2,782 2,936Other significant items of a non-recurring/non-operational nature 1 (67) (84) 5 (43) (157) (55) (30) (121)Restructuring 203 322 153 126 143 97 116 108Segment operating profit - adjusted 1,994 1,471 1,934 2,295 2,411 2,632 2,868 2,923
Segment operating margin 8.7% 7.3% 9.9% 11.7% 14.2% 15.4% 16.5% 17.6%Segment operating margin - adjusted 9.4% 8.7% 10.8% 12.2% 14.1% 15.7% 17.0% 17.5%
1 Details of other significant items of a non-recurring/non-operational nature 2008: Approximately $67 million gain from the contribution of a business into a new venture operating in the Middle East and the Commonwealth of Independent States.
2009: Approximately $57 million gain recognized from the contribution of the majority of Carrier’s U.S. residential sales and distribution business into a new venture formed with Watsco, Inc. and approximately $27 million of gains related to divesiture activity.
2010: Approximately $47 million net charge resulting from dispositions associated with Carrier’s ongoing portfolio transformation. Included in this net charge is an approximately $58 million asset impairment charge associated with the expected disposition of a business, partially offset by an approximately $11 million gain on the sale of another business. Approximately $42 million net gain resulting from dispositions associated with Carrier’s ongoing portfolio transformation.
2011: Approximately $28 million net gain resulting from dispositions associated with Carrier’s ongoing portfolio transformation. Approximately $81 million net gain resulting from Carrier’s ongoing portfolio transformation primarily as a result of the contribution by Carrier's heating, air-conditioning and ventilation operations in Brazil, Argentina and Chile into a new joint venture controlled by Midea Group of China. Approximately $20 million other-than-temporary impairment charge on an equity investment. Approximately $46 million other-than-temporary impairment charge on an equity investment.
2012: Approximately $112 million net gain from UTC Climate, Controls & Security’s ongoing portfolio transformation. This net gain includes approximately $215 million from the sale of a majority interest in a manufacturing and distribution joint venture in Asia, partially offset by $103 million of impairment charges related to planned business dispositions. Approximately $110 million net gain from UTC Climate, Controls & Security’s ongoing portfolio transformation. This net gain includes approximately $142 million from the sale of a controlling interest in its Canadian distribution business, partially offset by $32 million loss on the disposition of its U.S. fire and security branch operations. Approximately $65 million net charge from UTC Climate, Controls & Security’s ongoing portfolio transformation. This net charge includes approximately $24 million of pension settlement charges.
2013: Approximately $38 million net gain from UTC Climate, Controls & Security's ongoing portfolio transformation. This net gain primarily relates to the sale of a business in Hong Kong. Approximately $17 million net gain from UTC Climate, Controls & Security's ongoing portfolio transformation, primarily due to a gain on the sale of a business in Australia.
2014: Approximately $30 million net gain from UTC Climate, Controls & Security's ongoing portfolio transformation, primarily due to a gain on the sale of an interest in a joint venture in North America.
2015: Approximately $126 million gain as a result of a fair value adjustment related to the acquisition of a controlling interest in a UTC Climate, Controls & Security joint venture investment. Approximately $5 million charge related to UTC Climate, Controls & Security acquisitions and integration costs.
($ millions)

Pratt & Whitney Operating Results Reconciliation 2008 2009 2010 2011 2012 2013 2014 2015
Segment Sales 1 13,053 11,584 12,150 12,711 13,964 14,501 14,508 14,082Other significant items of a non-recurring/non-operational nature 2 - - - - - - - 142Segment sales - adjusted 13,053 11,584 12,150 12,711 13,964 14,501 14,508 14,224
Segment operating profit 1 2,047 1,735 1,885 1,867 1,589 1,876 2,000 861Other significant items of a non-recurring/non-operational nature 2 (37) - - (41) - (168) (1) 947Restructuring 94 181 99 52 96 154 64 105Segment operating profit - adjusted 2,104 1,916 1,984 1,878 1,685 1,862 2,063 1,913
Segment operating margin 15.7% 15.0% 15.5% 14.7% 11.4% 12.9% 13.8% 6.1%Segment operating margin - adjusted 16.1% 16.5% 16.3% 14.8% 12.1% 12.8% 14.2% 13.4%
1 Segment sales for periods prior to 2009 reflect the retrospective adoption of Accounting for Collaborative Arrangements.
2 Details of other significant items of a non-recurring/non-operational nature 2008: Approximately $37 million non-cash gain on a partial sale of an investment.
2011: Approximately $41 million gain recognized from the sale of an equity investment.
2013: Approximately $193 million gain from the sale of the Pratt & Whitney Power Systems business. This gain was not reclassified to "Discontinued Operations" due to our expected level of continuing involvement in the business post disposition.
2014: Approximately $83 million net gain, primarily as a result of fair value adjustments related to a business acquisition. Approximately $60 million charge to adjust the fair value of a Pratt & Whitney joint venture investment. Approximately $22 million charge for impairment of assets related to a joint venture.
2015: Approximately $142 million to record in sales and $80 million in losses from Pratt & Whitney customer contract renegotiations. Approximately $867 million charge related to a Pratt & Whitney research and development support agreements with Canadian government agencies.
($ millions)

UTAS Operating Results Reconciliation 2008 2009 2010 2011 2012 2013 2014 2015
Segment Sales 4,732 4,441 4,399 4,760 8,334 13,347 14,215 14,094Other significant items of a non-recurring/non-operational nature 1 - - - - - - - 210Segment sales - adjusted 4,732 4,441 4,399 4,760 8,334 13,347 14,215 14,304
Segment operating profit 848 659 654 759 944 2,018 2,355 1,888Other significant items of a non-recurring/non-operational nature 1 (25) - 28 - - - - 356Restructuring 9 57 24 11 115 92 82 111Segment operating profit - adjusted 832 716 706 770 1,059 2,110 2,437 2,355
Segment operating margin 17.9% 14.8% 14.9% 15.9% 11.3% 15.1% 16.6% 13.4%Segment operating margin - adjusted 17.6% 16.1% 16.0% 16.2% 12.7% 15.8% 17.1% 16.5%
1 Details of other significant items of a non-recurring/non-operational nature 2008: Approximately $25 million gain on the completion of a divestiture of a business.
2010: Approximately $28 million of asset impairment charges related primarily to the expected disposition of an aerospace business as part of Hamilton Sundstrand’s ongoing low cost sourcing initiatives.
2015: Approximately $210 million to record in sales and $295 million in losses from UTC Aerospace Systems customer contract renegotiations. Approximately $61 million charge to UTC Aerospace Systems for impairment of assets held for sale.
($ millions)

2015 Adjusted EPS United Technologies CorporationReconciliation of Diluted Earnings per Share to Adjusted Diluted Earnings per Share
(dollars in millions, except share amounts)
Diluted earnings per share--Net income from continuing operations attributable to common shareowners $ 1.51 $ 1.64 $ 1.61 $ (0.30 ) $ 4.53
Net income from continuing attributable to common shareowners $ 1,364 $ 1,461 $ 1,427 $ (256 ) $ 3,996Adjustments to net income from continuing operations attributable to common shareowners:
Restructuring costsGain on fair value adjustment on acquisition of controlling interest in a joint venture
) )
Acquisition and integration costs related to current period acquisitions - - - 5 5
Charge related to a research and development support agreement with Canadian government agencies
- - - 867 867
Charge resulting from customer contract negotiations - - - 375 375Charge for impairment of assets held for sale -Charge for pending and future asbestos-related claims -Charge (gain) from agreement with a state taxing authority for monetization of tax credits
-
Income tax expense (benefit) on restructuring costs and significant non-recurring and non-operational items
) ) ) ) )
Significant non-recurring and non-operational charges (gains) recorded within income tax expense
- - - 342 342
Total adjustments to net income from continuing operations attributable to common shareowners
)
Adjusted net income from continuing operations attributable to common shareowners $ 1,301 $ 1,485 $ 1,479 $ 1,298 $ 5,563
Less: Impact of total adjustments on diluted earnings per share $ 0.07 $ (0.03 ) $ (0.06 ) $ (1.83 ) $ (1.77 )Adjusted diluted earnings per share--Net income from continuing operations attributable to common shareowners $ 1.44 $ 1.67 $ 1.67 $ 1.53 $ 6.30
(126(126 - - -
61237
27
(617
1,567
27
Full Year 2015
396
(63 24 52 1,554
(30 (15 (21 (551
- - 237
- -
- - 61
93 39 73 191
Q 1 2015 Q 2 2015 Q 3 2015 Q 4 2015

Segment Data SEGMENT DATA - Reported($ Millions except per share amounts)
Q1 Q2 Q3 Q4 2015 YTD Q1 Q2 Q3 Q4 2014 YTDOtis Net Sales 2,745 3,098 3,043 3,094 11,980 2,955 3,365 3,326 3,336 12,982 Operating Profit (a) 527 627 642 542 2,338 570 693 703 674 2,640 Operating Profit % 19.2% 20.2% 21.1% 17.5% 19.5% 19.3% 20.6% 21.1% 20.2% 20.3%
UTC Climate, Controls & Security Net Sales 3,852 4,454 4,279 4,122 16,707 3,851 4,429 4,351 4,192 16,823 Operating Profit (a), (i), (q), (t) 729 823 771 613 2,936 537 815 807 623 2,782 Operating Profit % 18.9% 18.5% 18.0% 14.9% 17.6% 13.9% 18.4% 18.5% 14.9% 16.5%
Pratt & Whitney Net Sales (v) 3,332 3,677 3,234 3,839 14,082 3,329 3,592 3,564 4,023 14,508 Operating Profit (a), (b), (c), (j), (u), (v) 419 487 419 (464) 861 388 432 633 547 2,000 Operating Profit % 12.6% 13.2% 13.0% -12.1% 6.1% 11.7% 12.0% 17.8% 13.6% 13.8%
UTC Aerospace Systems Net Sales (w) 3,548 3,632 3,457 3,457 14,094 3,450 3,636 3,535 3,594 14,215 Operating Profit (a), (w), (x) 569 580 572 167 1,888 590 602 575 588 2,355 Operating Profit % 16.0% 16.0% 16.5% 4.8% 13.4% 17.1% 16.6% 16.3% 16.4% 16.6%
Total Segments Net Sales 13,477 14,861 14,013 14,512 56,863 13,585 15,022 14,776 15,145 58,528 Operating Profit 2,244 2,517 2,404 858 8,023 2,085 2,542 2,718 2,432 9,777 Operating Profit % 16.7% 16.9% 17.2% 5.9% 14.1% 15.3% 16.9% 18.4% 16.1% 16.7%
Corporate, Eliminations, and Other Net Sales: Other (157) (171) (225) (212) (765) (146) (154) (163) (165) (628) Operating Profit: General corporate expenses (110) (120) (101) (133) (464) (112) (119) (124) (133) (488) Eliminations and other (a), (f), (y), (z) 48 18 (1) (333) (268) 48 257 18 (19) 304
Consolidated Net Sales 13,320 14,690 13,788 14,300 56,098 13,439 14,868 14,613 14,980 57,900 Operating Profit 2,182 2,415 2,302 392 7,291 2,021 2,680 2,612 2,280 9,593 Operating Profit % 16.4% 16.4% 16.7% 2.7% 13.0% 15.0% 18.0% 17.9% 15.2% 16.6%
Interest expense, net (g), (k), (m), (n) (217) (217) (184) (206) (824) (224) (206) (185) (266) (881)
Income from continuing operations before income taxes 1,965 2,198 2,118 186 6,467 1,797 2,474 2,427 2,014 8,712
Income tax expense (h), (l), (o), (p), (aa), (bb) (530) (626) (592) (363) (2,111) (549) (486) (575) (634) (2,244)
Income from continuing operations 1,435 1,572 1,526 (177) 4,356 1,248 1,988 1,852 1,380 6,468 Income (loss) from discontinued operations (d), (e), (r), (s) 63 80 (65) 3,532 3,610 58 (198) 100 195 155
Net income 1,498 1,652 1,461 3,355 7,966 1,306 1,790 1,952 1,575 6,623 Less: Noncontrolling interest in subsidiaries' earnings (72) (110) (98) (78) (358) (93) (110) (98) (102) (403)
Net income attributable to common shareowners 1,426 1,542 1,363 3,277 7,608 1,213 1,680 1,854 1,473 6,220
Net income attributable to common shareowners: Income from continuing operations 1,364 1,461 1,427 (256) 3,996 1,155 1,878 1,755 1,278 6,066 Income (loss) from discontinued operations 62 81 (64) 3,533 3,612 58 (198) 99 195 154
Q1 Q2 Q3 Q4 2015 YTD Q1 Q2 Q3 Q4 2014 YTDContinuing Operations Earnings per share - basic 1.53 1.66$ 1.63$ (0.30)$ 4.58 1.28 2.09 1.96 1.43 6.75 Earnings per share - diluted 1.51 1.64 1.61 (0.30)$ 4.53 1.26 2.05 1.93 1.41 6.65
Discontinued Operations Earnings (loss) per share - basic 0.07$ 0.09$ (0.07)$ 4.16$ 4.14 0.07 (0.22) 0.11 0.22 0.17 Earnings (loss) per share - diluted 0.07 0.09 (0.07) 4.16 4.09 0.06 (0.22) 0.11 0.22 0.17
Weighted average number of shares outstanding: (In Millions) Basic shares 890.3 877.3 876.4 849.6 872.7 900.9 900.1 897.7 895.4 898.3 Diluted shares 904.2 889.4 885.0 849.6 883.1776 917.0 914.7 910.3 907.3 911.6
Q1 Q2 Q3 Q4 Total YTD Q1 Q2 Q3 Q4 Total YTDEffective Tax Rate - continuing ops 27.0% 28.5% 28.0% 194.8% 32.6% 30.6% 19.6% 23.7% 31.5% 25.8%
20142015

Segment Data – Notes The earnings release and conference-call discussion adjust 2015 and 2014 segment results for restructuring costs as well as significant items of a non-recurring and/or non-operational nature.
The following items are included in current and prior year results:
(a) Restructuring costs as included in 2015 and 2014 results:2014
Restructuring Costs Restructuring CostsQ1 Q2 Q3 Q4 Total YTD Q1 Q2 Q3 Q4 Total YTD
Operating Profit: Otis 6 8 18 19 51 17 21 15 34 87 UTC Climate, Controls & Security 24 28 15 41 108 43 25 14 34 116 Pratt & Whitney 13 2 22 68 105 42 5 8 9 64 UTC Aerospace Systems 50 - 14 47 111 6 4 26 46 82
Total Segments 93 38 69 175 375 108 55 63 123 349 General corporate expenses - - 4 5 9 - - - 4 4 Eliminations and other - 1 - 11 12 - - - 1 1
Total within continuing operations 93 39 73 191 396 108 55 63 128 354 Total within discontinued operations - 23 116 - 139 17 - - (3) 14
Total UTC 93 62 189 191 535 125 55 63 125 368
(b) Q2 2014: Approximately $60 million charge to adjust the fair value of a Pratt & Whitney joint venture investment.(c) Q2 2014: Approximately $22 million charge for impairment of assets related to a joint venture.
(e) Q2 1014: Approximately $28 million charge for the impairment of a Sikorsky joint venture investment.(f) Q2 2014: Approximately $220 million gain on an agreement with a state taxing authority for the monetization of tax credits.
related to the disposition of the Hamilton Sundstrand Industrials (i) Q3 2014: Approximately $30 million net gain from UTC Climate, Controls & Security's ongoing portfolio transformation, primarily due to a gain on the sale of an interest in a joint venture in North America.
(j) Q3 2014: Approximately $83 million net gain, primarily as a result of fair value adjustments related to a business acquisition.
(p) Q4 2014: Approximately $180 million favorable tax adjustment primarily associated with management’s decision to repatriate additional high taxed dividends in 2014.
(s) Q3 2015: Approximately $68 million of tax provision related to the undistributed earnings of Sikorsky's foreign subsidiaries, which will no longer be permanently reinvested as a result of the announced sale of Sikorsky to Lockheed Martin Corp.
(u) Q4 2015: Approximately $867 million charge related to a Pratt & Whitney research and development support agreements with Canadian government agencies.(v) Q4 2015: Approximately $142 million to record in sales and $80 million in losses from Pratt & Whitney customer contract renegotiations.(w) Q4 2015: Approximately $210 million to record in sales and $295 million in losses from UTC Aerospace Systems customer contract renegotiations.
(d) Q2 2014: A cumulative adjustment to record $830 million in sales and $438 million in losses based upon the change in estimate required for the contractual amendments signed with the Canadian Government on theMaritime Helicopter program.
(o) Q4 2014: Approximately $267 million of unfavorable income tax accruals related to the ongoing dispute with German tax authorities concerning a 1998 reorganization of the corporate structure of Otis operations in Germany.
(r) Q2 2015: Approximately $28 million of transaction and separation costs related to the planned sale or spin-off of Sikorsky.
2015
(aa) Q4 2015: Approximately $274 million of unfavorable income tax accruals related to the repatriation of foreign earnings.(bb) Q4 2015: Approximately $69 million of unfavorable income tax accruals related to a change in tax laws.
(n) Q4 2014: Approximately $88 million of favorable pre-tax interest adjustments, primarily related to conclusion of litigation and the resolution of disputes with the Appeals Division of the IRS regarding Goodrich Corporation’s
(g) Q2 2014: Approximately $21 million of favorable pre-tax interest adjustments, primarily related to the conclusion of the IRS's examination of the Company's 2009 and 2010 tax years.(h) Q2 2014: Approximately $253 million of favorable income tax adjustments related to the conclusion of the IRS's examination of the Company's 2009 and 2010 tax years, as well as the settlement of state income taxes
(k) Q3 2014: Approximately $23 million of favorable pre-tax interest adjustments, primarily related to the resolution of disputes with the Appeals Division of the IRS for the Company's 2006 - 2008 tax years.
(m) Q4 2014: Approximately $143 million of unfavorable pre-tax interest accruals related to the ongoing dispute with German tax authorities concerning a 1998 reorganization of the corporate structure of Otis operations in Germany.
(l) Q3 2014: Approximately $118 million of favorable income tax adjustments, primarily related to the resolution of disputes with the Appeals Division of the IRS for the Company's 2006 - 2008 tax years.
(y) Q4 2015: Approximately $237 million charge for pending and future asbestos-related claims.(z) Q4 2015: Approximately $27 million charge from agreement with a state taxing authority for monetization of tax credits.
(t) Q4 2015: Approximately $5 million charge related to UTC Climate, Controls & Security acquisitions and integration costs.
(x) Q4 2015: Approximately $61 million charge to UTC Aerospace Systems for impairment of assets held for sale.
2000 to 2010 tax years.
(q) Q1 2015: Approximately $126 million gain as a result of a fair value adjustment related to the acquisition of a controlling interest in a UTC Climate, Controls & Security joint venture investment.

Climate, Controls & Security Financials
*afx is at actual FX**cfx is at constant FX
CCS Sales & Operating Profit
2013 2014 2015Sales @ afx* 16.8 16.8 16.7 Op profit @ afx 2.6 2.9 2.9
Sales @ cfx** 15.3 15.5 16.4 Op profit @ cfx 2.4 2.7 2.9

Otis Financials
*afx is at actual FX**cfx is at constant FX
Otis Sales & Operating Profit
2013 2014 2015Sales @ afx* 12.5 13.0 12.0 Op profit @ afx 2.7 2.7 2.4
Sales @ cfx** 10.7 11.4 11.6 Op profit @ cfx 2.3 2.4 2.3