Embed Size (px)
Citation preview
Utah Renewable Energy Zones Task ForcePhase I Report
Renewable Energy Zone Resource IdentificationPrepared by: Jason Berry, David Hurlbut, Richard Simon, Joseph Moore, and Robert Blackett
MISCELLANEOUS PUBLICATION 09-1 UTAH GEOLOGICAL SURVEY
a division ofUTAH DEPARTMENT OF NATURAL RESOURCES
2009
Utah Geological Survey

Utah Renewable Energy Zones Task ForcePhase I Report
Renewable Energy Zone Resource Identification
Prepared for:
Utah Renewable Energy Zone Task Force
Prepared by:
Jason BerryUtah Geological Survey State Energy Program
David HurlbutU.S. Department of Energy
National Renewable Energy Laboratory
Richard SimonSandbar Explorations, LLC
Joseph MooreEnergy & Geoscience Institute
University of Utah
Robert BlackettUtah Geological Survey
MISCELLANEOUS PUBLICATION 09-1 UTAH GEOLOGICAL SURVEY
a division of UTAH DEPARTMENT OF NATURAL RESOURCES
2009
Utah Geological Survey
ISBN 1-55791-808-2
Task Force Members
Rick Allis, Co-Chair Dianne R. Nielson, Co-Chair Layne AshtonKen Bullock Jim Byrne Kim Christy Brent Gardner Holly Gordon Carol Hunter Tracy Livingston Al McKee Mike Peterson Leon Pexton Phil Powlick Ted Rampton Dennis E. Stowell Tim Wagner Larry Wiley Becky Wilson Sarah Wright
Utah Geological Survey Governor’s Energy Advisor Raser Technologies, Inc. Utah League of Cities & Towns Western Grid Group Utah School & Institutional Trust Lands Admin. Utah Association of Counties Ausra, Inc. Rocky Mountain Power Wasatch Wind U.S. Bureau of Land Management Utah Rural Electric Association Utah Municipal Power Agency Utah Division of Public Utilities Utah Associated Municipal Power Systems Senator, Utah State Legislature Utah Chapter Sierra Club Representative, Utah State Legislature Utah Public Service Commission Utah Clean Energy
Principal Investigators
Jason Berry, Utah Geological Survey, State Energy ProgramRobert Blackett, P.G., Utah Geological Survey, Energy and Minerals ProgramDavid Hurlbut, Ph.D., U.S. Department of Energy, National Renewable Energy Laboratory Joseph Moore, Ph.D., Energy and Geoscience Institute, University of UtahRichard Simon, M.S., Sandbar Explorations, LLC
UREZ Staff
Cherie Anderson Jason Berry Elise Brown Mary Ann Wright
Energy Advisor’s Office State Energy Program State Energy Program Energy Advisor’s Office
Acknowledgements
National Governors Association
Utah Automated Geographic Reference Center
Dennis GorehamBert GranbergZach Beck

STATE OF UTAHJon Huntsman, Jr., Governor
DEPARTMENT OF NATURAL RESOURCESMichael Styler, Executive Director
UTAH GEOLOGICAL SURVEYRichard G. Allis, Director
PUBLICATIONScontact
Natural Resources Map & Bookstore1594 W. North Temple
telephone: 801-537-3320toll-free: 1-888-UTAH MAPWeb site: mapstore.utah.govemail: [email protected]
UTAH GEOLOGICAL SURVEYcontact
1594 W. North Temple, Suite 3110Salt Lake City, UT 84114telephone: 801-537-3300
Web site: geology.utah.gov
This Miscellaneous Publication makes information available to the public that may not conform to UGS technical, editorial, or policy standards; this should be considered by an individual or group planning to take action based on the contents of this report. The Utah Department of Natural Resources, Utah Geological Survey, makes no warranty, expressed or implied, regarding its suitability for a par-ticular use. The Utah Department of Natural Resources, Utah Geological Survey, shall not be liable under any circumstances for any direct, indirect, special, incidental, or consequential damages with respect to claims by users of this product.

CONTENTS
EXECUTIVE SUMMARY ..........................................................................................................................................................................1 Overview ................................................................................................................................................................................................1 Background and Objective .....................................................................................................................................................................1 Collaboration ..........................................................................................................................................................................................1 Renewable Energy Technology..............................................................................................................................................................2 Renewable Resource Assessment ..........................................................................................................................................................2 Solar ...............................................................................................................................................................................................2 Wind ..............................................................................................................................................................................................2 Geothermal ....................................................................................................................................................................................2 Conclusions ............................................................................................................................................................................................3 Next Steps ..............................................................................................................................................................................................3INTRODUCTION ......................................................................................................................................................................................3 Background and Objective .....................................................................................................................................................................3 National Governors Association Grant ..................................................................................................................................................4 Renewable Energy Technology..............................................................................................................................................................4 Approach ................................................................................................................................................................................................4 Work Group Chairs ...............................................................................................................................................................................4 Solar ..............................................................................................................................................................................................4 Wind ..............................................................................................................................................................................................4 Geothermal ....................................................................................................................................................................................5 Current Energy Portfolio in Utah ...........................................................................................................................................................5 Existing and Announced Utility-Scale Renewable Energy Projects ......................................................................................................6 Utah’s Energy Resource and Carbon Emission Reduction Initiative ....................................................................................................7 Assessment of Renewable Energy Technology ....................................................................................................................................7 Solar ...............................................................................................................................................................................................7 Wind ..............................................................................................................................................................................................8 Geothermal ..................................................................................................................................................................................10 General Resource Screening: Exclusionary and Informational Data Layers .......................................................................................10SOLAR RESOURCE ASSESSMENT ......................................................................................................................................................11 Methods ..............................................................................................................................................................................................11 Assumptions .........................................................................................................................................................................................12 Solar Zones Identified ..........................................................................................................................................................................15WIND RESOURCE ASSESSMENT .......................................................................................................................................................16 Methods and Assumptions ...................................................................................................................................................................16 Exclusion Areas ..................................................................................................................................................................................20 Wind Sites Identified ...........................................................................................................................................................................22 Identified Wind Zones ..........................................................................................................................................................................24 Wind Zone Identification and Quantification—Uncertainties and Confidence Levels ........................................................................24GEOTHERMAL RESOURCE ASSESSMENT ........................................................................................................................................27 Objectives ............................................................................................................................................................................................27 Hydrothermal Convection Systems of the Basin & Range ..................................................................................................................27 Cove Fort-Sulphurdale Development .................................................................................................................................................30 Thermo Hot Springs Development ......................................................................................................................................................30 Magmatic-Hydrothermal System at Roosevelt Hot Springs ................................................................................................................30 Conduction-Dominated Deep Basins ...................................................................................................................................................33 Northern Wasatch Front Valleys .........................................................................................................................................................35 Enhanced Geothermal Systems (EGS) ................................................................................................................................................35 Assessment of the Electrical Potential of Utah’s Geothermal Resources ...........................................................................................36 Summary of Analysis ...........................................................................................................................................................................38PHASE I CONCLUSIONS........................................................................................................................................................................38NEXT STEPS ............................................................................................................................................................................................41REFERENCES ..........................................................................................................................................................................................41APPENDICES ...........................................................................................................................................................................................43 APPENDIX A. NREL Tools for Assessing Solar Power Potential ......................................................................................................45 APPENDIX B. Wind-Related Definitions ..........................................................................................................................................47 APPENDIX C. Wind Energy Zones ....................................................................................................................................................50 APPENDIX D. USEP Wind Sites by Geography ................................................................................................................................54 APPENDIX E. Additional Information ...............................................................................................................................................56

FIGURES
Figure 1. Net generation of electricity in Utah by energy source, 1960-2006 .............................................................................................5Figure 2. Net generation (percent) of electricity in Utah by energy source, 1960-2006 .............................................................................6Figure 3. 2007 Rocky Mountain Power energy portfolio ............................................................................................................................6Figure 4. Sales of electricity in Utah by class of service, 1960-2007 ..........................................................................................................7Figure 5. Concentrating solar thermal system; parabolic trough design .....................................................................................................8Figure 6. Potential locations for concentrating solar power plants in the Southwest ..................................................................................9Figure 7. Installed U.S. wind capacity .........................................................................................................................................................9Figure 8. Geothermal resources in the U.S. ...............................................................................................................................................10Figure 9. Solar resource areas with slope less than one percent ................................................................................................................13Figure 10. Solar resource areas with slope less than three percent ............................................................................................................14Figure 11. Utah’s estimated potential for solar power, by quality of site ..................................................................................................15Figure 12. State Energy Program’s anemometer loan program site locations ...........................................................................................23Figure 13. Identified Utah wind renewable energy zones ..........................................................................................................................25Figure 14. Wind zone confidence levels ....................................................................................................................................................26Figure 15. Physiographic regions and significant geothermal areas in Utah .............................................................................................29Figure 16. Features of the Cove Fort-Sulphurdale geothermal area and vicinity ......................................................................................31Figure 17. The Cove Fort-Sulphurdale area showing geothermal wells, geophysical anomalies, and suspected faults ...........................32Figure 18. Thermo Hot Springs Known Geothermal Resource Area ........................................................................................................33Figure 19. Geology and thermal features of the Roosevelt Hot Springs Known Geothermal Resource Area ..........................................34Figure 20. Uinta Basin oil and gas fields showing bottom-hole temperatures for wells ...........................................................................35Figure 21. Temperatures at a depth of 3 kilometers (1.9 miles) within the earth ......................................................................................37Figure 22. Identified Utah geothermal energy zones .................................................................................................................................39Figure 23. Overlay of identified solar, wind, and geothermal REZs .......................................................................................................................40
TABLES
Table 1. Exclusionary screening criteria ....................................................................................................................................................11Table 2. Informational layers .....................................................................................................................................................................11Table 3. USEP sites with estimated annual wind speeds of less than 4 mps .............................................................................................16Table 4. USEP sites with estimated annual wind speeds of 4-5 mps .........................................................................................................16Table 5. USEP sites with estimated annual wind speeds of 5-6 mps .........................................................................................................17Table 6. USEP sites with estimated annual wind speeds of 6-7 mps .........................................................................................................17Table 7. USEP sites with estimated annual wind speeds greater than 7 mps. ............................................................................................17Table 8. Identified Utah wind energy sites .................................................................................................................................................18Table 9. Sites with estimated gross capacity factors of 30% and greater ..................................................................................................20Table 10. Sites with estimated gross capacity factors of 25% to 30% .......................................................................................................21Table 11. Sites with estimated gross capacity factors of 20% to 25% .......................................................................................................22Table 12. Electrical generating potential of geothermal areas in Utah ......................................................................................................28
EXECUTIVE SUMMARY
Overview
Utah has abundant renewable energy resources that have the po-tential to be suitable for electricity generation. Although most counties have some solar, wind, or geothermal energy, significant quantities of all three resources were found co-located in south-west Utah. In addition, large concentrations of wind resources were identified along the Utah and Wyoming border. These find-ings highlight a need for a follow-up economic analysis of electric-ity generation from the renewable energy concentrations and the associated transmission opportunities and barriers.
Background and Objective
The state of Utah is fortunate to have its own indigenous energy resources for the production of electrical energy. In 2006, 97.7 percent of electricity produced in Utah was from traditional coal, natural gas, and petroleum resources (Utah Geological Survey, 2008a, table 1.10). Renewable resources such as hydroelectric and geothermal contributed only 2.3 percent of electricity in Utah. To promote the development of carbon-free energy resources, the 2008 Utah State Legislature passed and Governor Jon Huntsman, Jr., signed into law The Energy Resource and Carbon Emission Reduction Initiative (Utah Code 54-17-602). Utah Code 54-17-602 set a target for Utah’s municipal, investor-owned, and coop-erative utilities to provide 20 percent of their adjusted retail sales from qualifying non-carbon based energy resources by 2025 if cost-effective. Utilities are not required to purchase power from Utah based projects. Power may be purchased from projects within the Western Electricity Coordinating Council (WECC) region. The WECC region is made up of the following states and provinces: Arizona, California, Colorado, Idaho, Montana, Nebraska, Ne-vada, New Mexico, North Dakota, South Dakota, Oregon, Utah, Washington, Wyoming, Alberta, British Columbia, and Baja Cali-fornia.
In order to promote and identify Utah’s utility-scale electrical re-newable energy resources and to assess transmission to bring those resources to load centers in Utah, Governor Huntsman commis-sioned the Utah Renewable Energy Zones (UREZ) Task Force to (1) identify areas in Utah where utility-scale renewable energy de-
velopment could occur; (2) assess the electrical generation poten-tial of wind, solar, and geothermal technologies; and (3) identify new and existing transmission needed to bring renewable energy generation sources to market.
UREZ Phase I is a screening-level study that identifies geo-graphical locations of renewable resources and estimates the theoretical potential of electrical energy capacity from proxy technologies. This report is not an attempt to provide a proj-ect-level assessment of the energy resource quality or project development potential. Interested individuals should consult with industry professionals about developments at the project level.
The UREZ research will be broken down into multiple phases. This report, Phase I, identifies areas that have the theoretical potential to become Renewable Energy Zones. Phase II and later phases will: (1) identify opportunities and barriers to developing transmission from the Phase I identified zones, (2) further analyze the techni-cal and economic characteristics of Phase I areas, (3) assess what existing transmission upgrades and/or new transmission may be required to develop an area, and (4) report final identification of UREZs.
Collaboration
The UREZ Phase I report is a collaborative effort among vari-ous stakeholders in and outside of Utah. In addition to the diverse makeup of the UREZ Task Force, stakeholders actively participat-ed in the Solar, Wind, and Geothermal Zone Identification Work Groups. Stakeholders include federal, state, and local government leaders, state and federal regulatory agencies, utilities, energy de-velopers and generators, and public interest and environmental groups.
Phase III: Final Zone
Identification
Phase II: Transmission and
Resource Valuation (Cost-
effectiveness)
Phase I: Resource
Identification and Theoretical Energy
Assessment
Utah Renewable Energy Zones Task ForcePhase I Report
Renewable Energy Zone Resource IdentificationPrepared by: Jason Berry, David Hurlbut, Richard Simon, Joseph Moore, and Robert Blackett
Utah Geological Survey2
Renewable Energy Technology
The intent of the UREZ process is to identify geographical areas that will have the potential of providing significant quantities of renewable electrical energy. Wind, solar, and geothermal technolo-gies were identified as the primary technologies that are likely to provide large quantities of energy at costs that are competitive in energy markets. While other renewable resources and technologies are available, they were not addressed in this analysis, given their limited potential to produce the same quantities of electricity as the other three with today’s technology.
Renewable Resource Assessment
Solar
This analysis estimates Utah’s theoretical potential for deriving electric power from solar resources. Utah’s solar resources are clearly abundant. The analysis identified 6,371 square miles of land that has a theoretical potential of about 826 gigawatts (GW) of utility-scale capacity. The solar analysis used several criteria to shape the methodology: (1) measurements of Direct Normal Ir-radiance (DNI), with a threshold value of 6.0 kilowatt hours per meter squared (kWh/m2)/day or greater, (2) screening out steeper areas (slopes of 3% or greater) unable to accommodate a large solar collection field, (3) screening out environmentally sensitive areas such as national parks, wilderness areas, wetlands, etc., that are not available for development, and (4) applying proxy technol-ogy, of a 50 megawatt (MW) parabolic trough concentrating solar thermal power plant, to estimate electrical energy capacity. Major findings from the solar assessment are:
Sixteen thousand five hundred (16,500) theoretically • potential 50 MW solar REZ areas (1 km square zones) were identified (826 GW).
The geospatial distribution of the quality of the solar • resource follows a simple north to south trend.
Southern Utah has the higher quality resources (6.5 • kWh/m2/day or greater), while northern Utah has a slightly lower quality solar resource (6.0 kWh/m2/day or less).
The prime solar Renewable Energy Zone (REZ) areas • constitute less than 1.5% of the identified sites, while the majority of the sites (43.2%) have a lower resource potential.
The total area of the solar REZs is 6,371 square miles.• Wind
This analysis estimates Utah’s theoretical potential for deriving electric power from wind resources. Utah’s extreme diversity in landscape and climate are well known. These factors significantly
affect Utah’s wind resources. As a result, Utah has a wide array of locations that may be viable options for wind energy development. The resource analysis to identify REZs was based upon wind data collected from 109 anemometer towers stationed throughout the state.
The wind resource analysis incorporated several criteria to shape the methodology: (1) screening out environmentally sensitive areas, (2) setting a maximum elevation of 9,500 feet, (3) eliminat-ing land too rugged for development, (4) deleting military operat-ing airspace, and (5) using a proxy wind turbine, General Electric 1.5 sle model, to estimate electrical energy capacity from identi-fied sites.
Major findings from the wind assessment are:
The combined technical electrical generating capacity • is approximately 9,145 MW from the 51 wind REZs.
The estimated annual average gross capacity factor for • the 51 REZ sites is 27.4%.
Twelve sites have expected gross capacity factors of • at least 30%, accounting for 1,830 MW or greater of generating capacity.
Eleven sites have an estimated installed capacity of at • least 250 MW each (2,750 MW).
The greatest concentration of wind resources is located • near Milford with an estimated installed capacity of 2,500 MW.
Twenty-four of Utah’s 29 counties contain wind • REZs.
Total area of the 51 wind sites is 1,838 square miles.• Geothermal
In this analysis, the authors estimate the theoretical development potential for deriving electric power from geothermal resources in Utah. Although a number of power projects are currently un-derway, there is a general lack of subsurface drill-hole informa-tion for individual resource areas. The effort described here uses published information from various sources, but mostly relies on deep well data and shallow thermal-gradient information. Utah’s identified higher quality geothermal resources lie within a 50-mile-wide corridor along the eastern margin of the Basin and Range Province – a corridor that also parallels Interstate 15. Geothermal power generation projects are underway in south-central and southwestern Utah. Another project prepares to get underway along the northern Wasatch Front in Box Elder County. The geothermal analysis incorporated the following criteria to shape the methodology: (1) screening out environmentally sen-sitive areas not available for development, (2) calculating reser-voir volume, and (3) factoring in porosity and sweep efficiency, which characterize the ability of the reservoir to transfer heat.
Utah Renewable Energy Zones Task Force Phase I Report: Renewable Energy Zone Resource Identification 3
Major findings from the geothermal assessment are:
A total of 2,166 MW of geothermal development • potential exsists within the state.
Utah’s identified higher-quality geothermal resources • lie within a 50-mile-wide corridor along the eastern margin of the Basin and Range Province – a corridor that parallels Interstate-15.
The estimated potential for electric generation from • identified geothermal systems is approximately 754 MW.
The total estimated potential from undiscovered • geothermal systems is approximately 1,413 MW.
The total area of the four major geothermal REZ areas • (Uinta Basin included) is 5,053 square miles.
Conclusions
The findings from this study are two-fold: Utah’s theoretical po-tential for renewable energy generation is great (figure 23), but development of these resources is constrained due to limited data and a multitude of factors that are unknown at this time. Phase I identified REZs totaling approximately 13,262 square miles and an estimated 837 gigawatts (GW) of electrical generating capacity. The multitude of factors that could not be taken into account at this point of the assessment includes: project level resource data, site specific land use and environmental restrictions, and federal, state, and local regulatory policies that may complicate or restrict development.
Although most counties have some solar, wind, or geothermal en-ergy, significant quantities of all three resources were found co-lo-cated in southwest Utah. In addition, large concentrations of wind resources were identified along the Utah and Wyoming border.
The scope of work for Phase I of the UREZ process was not to assess the development potential from an economic perspective. Rather, analogous to estimating resources and reserves in the oil and gas industry, this project’s scope of work was to identify the potential resources, within reason, for short-term (~<10 years) and long-term (~>10 years) potential. Again, similar to estimating conventional natural resource reserves, the quantity is a constantly changing value. More importantly, this macro-level assessment will identify likely areas of multiple resource zones that may have utility-scale generation potential.
Next Steps
Having identified renewable energy zones that have a theoretical potential for utility-scale development in Utah, Phase II will focus on and critically analyze other factors such as:
transmission, regulation, access, and development •
(barriers and opportunities);
other related local, state, and federal regulatory issues;•
resource and technology viability given current and • future market trends;
land use and/or environmental issues not identified in • Phase I.
The results from Phase II and beyond will serve as a screening tool to further refine the zone identification process and thus eliminate additional areas among the REZs identified in Phase I. This refine-ment process is a logical method that will eventually lead to iden-tifying and estimating zones in Utah having the greatest potential for utility-scale renewable energy development.
INTRODUCTION
The Utah Geological Survey’s State Energy Program has prepared this report on behalf of Governor Huntsman’s Utah Renewable Energy Zone Task Force. The objective of this Phase I report is to identify areas and assess the potential of utility-scale renewable energy generation from wind, solar, and geothermal. Phase I does not assess the cost-effectiveness of resources, or the cost of gen-eration and transmission from identified areas. Phase I is intended to be a screening level study, upon which future phases can build to conduct more technical and economic assessments for the final identification of Renewable Energy Zones.
Background and Objective
The state of Utah is fortunate to have indigenous energy resources for the production of electrical energy. In 2006, 97.7 percent of electricity produced in Utah was from traditional coal, natural gas, and petroleum resources (Utah Geological Survey, 2008a, table 1.10). Rocky Mountain Power, Utah’s only investor-owned utility, provides power to approximately 80 percent of Utah’s consumers of electricity. In 2007, Rocky Mountain Power’s energy portfolio consisted of 70 percent coal, 17 percent natural gas, 10 percent hydroelectric, and 3 percent wind and other renewables. This port-folio is from in-state and out-of-state generation. With respect to Utah’s electrical production, renewable resources such as hydro-electric and geothermal contributed 2.3 percent. To promote the development of carbon-free energy resources, the 2008 Utah State Legislature passed and Governor Jon Huntsman, Jr., signed into law The Energy Resource and Carbon Emission Reduction Initia-tive (Utah Code 54-17-602). This law requires Utah’s municipal, investor-owned, and cooperative utilities to provide 20 percent of their adjusted retail sales from qualifying non-carbon based energy resources by 2025 if cost-effective.
In order to promote and identify Utah’s utility-scale electrical re-newable energy resources and assess transmission needs to bring those resources to load centers in Utah, Governor Huntsman com-missioned the Utah Renewable Energy Zones (UREZ) Task Force

Utah Geological Survey4
to (1) identify areas in Utah where large-scale renewable energy development could occur, (2) assess the electrical generation po-tential of wind, solar, and geothermal technologies, and (3) identify new and existing transmission needed to bring renewable energy generation sources to market. UREZ Phase I is a screening-level study that identifies geo-graphical locations of renewable resources and estimates the theoretical potential of electrical energy capacity from proxy technologies. This report is not an attempt to provide a proj-ect-level assessment of the energy resource quality or project development potential. Interested individuals should consult with industry professionals about developments at the project level.
The UREZ process will be broken down into multiple phases. This report will identify Phase I Renewable Energy Zones. Phase II and later phases will perform the following: (1) identify opportunities and barriers to developing transmission from the Phase I identified zones, (2) analyze the technical and economic characteristics of Phase I areas, (3) assess what existing transmission upgrades and/or new transmission may be required to develop an area, and (4) conduct final identification of REZs.
National Governors Association Grant
In June of 2008, the Governor’s Office was awarded a $50,000 grant from the National Governors Association’s (NGA) Center for Excellence. Utah was one of 12 states awarded a grant on the merits of proposing a project that would assist the state in develop-ing its clean energy potential. The Clean Energy States grant pro-vided funding for the specific goals outlined in the section above. Specifically, the funding went to project consultants, supplies and materials pertinent to the project, and travel for Utah to present its findings at an NGA event.
Renewable Energy Technology
The intent of the UREZ process is to identify geographical areas that have the potential of providing utility-scale renewable ener-gy development. Wind, solar, and geothermal technologies were identified as the primary technologies that are likely to contribute utility-scale renewable developments at costs that are competitive in limited energy markets (Wiser and Barbose, 2008). While other technologies are available, in the near term they are not likely to produce energy at the same scale as these three technologies.
Approach
The UREZ task force consulted with specialists in the wind, solar, and geothermal industries to conduct studies on areas in Utah hav-ing the greatest potential for electrical energy generation. These consultants were appointed to chair the Wind, Solar, and Geother-mal Resource Identification Work Groups, which provided a writ-ten report and data to be assembled into the final analysis of this Phase I report.
Work Group Chairs
Solar
Dr. David Hurlbut, author of the Phase I solar assessment, is a senior analyst at the National Renewable Energy Laboratory (NREL), specializing in regulatory policy, transmission, and re-newable energy economics. He is currently NREL’s project lead on the Western Renewable Energy Zone (WREZ) Initiative, which was launched by the Western Governors’ Association in early 2008 to identify opportunities for the regional development of renew-able energy resources via interstate transmission expansion. He also provided technical support to the State of Colorado for its renewable resource mapping study, ordered by the State Assembly in 2005 under Senate Bill 91.
Prior to joining NREL in 2007, Dr. Hurlbut was a senior econo-mist with the Public Utility Commission (PUC) of Texas, where he oversaw the state’s renewable portfolio standard and renewable energy credit trading system. His other duties at the Texas PUC included policing the competitive wholesale power market oper-ated by the Electric Reliability Council of Texas. His last major project with the Texas PUC was developing rules to implement Competitive Renewable Energy Zones, a first-of-its-kind policy for renewable energy transmission that inspired similar legislation in Colorado and the Western Governors’ Association’s WREZ Ini-tiative. He received his doctorate and masters degrees from the Lyndon B. Johnson School of Public Affairs at the University of Texas at Austin. Wind
Richard Simon, author of the Phase I wind assessment, received an M.S. in meteorology in 1976 from San Jose State University. He began working in wind energy in 1977 and co-authored the first formal study of wind power potential in California, published by the California Energy Commission in 1978. Mr. Simon helped site many of the wind turbines installed in California during the 1980s and was principal investigator for research studies funded by fed-eral and state governments, utility companies, and private parties during the 1970s and 1980s. During the 1990s, Mr. Simon worked across the United States and abroad, helping to expand knowledge of wind energy and siting numerous wind farms. Through 2008, he has personally sited more than 10,000 megawatts of operating wind turbines across the world. Financial institutions regularly hire him to perform due diligence reviews of wind farms. Mr. Simon started studying Utah winds in 2004 and has worked for a number of developers researching wind farm opportunities across the state. He performed the initial meteorological work for the First Wind project in Milford and sited the turbines for Utah’s first wind farm at Spanish Fork. He moved to Utah in 2007, which has given him the opportunity to gain first-hand familiarity with the state’s wind resource.

Utah Renewable Energy Zones Task Force Phase I Report: Renewable Energy Zone Resource Identification 5
Geothermal
Robert Blackett, co-author of the Phase I geothermal assessment, holds a B.S. degree in geology from Weber State University and an M.S. degree in geological engineering from the University of Utah. His professional employment includes more than 30 years combined experience working for mineral and energy consulting companies, a public utility, and a non-profit research institute. He has worked as a geologist with the Utah Geological Survey since 1987, performing assessments of various mineral and energy re-sources, but specializing in geothermal resource assessments. He is a licensed professional geologist in the State of Utah (No. 5218097).
Dr. Joseph Moore, co-author of the Phase I geothermal assess-ment, has conducted geologic and geochemical investigations of geothermal systems since 1976. He received his Ph.D. from Penn-sylvania State University and worked for the Anaconda Company as a uranium exploration geologist. In 1976 Dr. Moore joined the predecessor of the Energy & Geoscience Institute at the University of Utah. He holds appointments as a Research Professor in the College of Engineering and Adjunct Professor in the Department of Geology and Geophysics. He has conducted detailed investiga-tions of geothermal systems throughout the world. Dr. Moore’s studies have included all of the major geothermal fields in the U.S., including Utah’s Roosevelt Hot Springs, Cove Fort-Sulphurdale, and Thermo areas. Dr. Moore has published more than 150 reports and articles on his investigations. He served as Associate Editor for the Americas of the international scientific journal Geother-mics from 1999 through 2007. He currently serves on the Editorial Board of Geothermics, the Board of Directors of the Geothermal Resources Council, and the Geothermal Energy Technical Ad-visory Committee. Dr. Moore has presented workshops on geo-thermal systems to government and private organizations and has
served as a consultant to the Bureau of Land Management (BLM), U.S. Department of Energy (DOE), United Nations, U.S. Agency for International Development, U.S. Navy, Caithness, Chevron, Morrison-Knudson, Nevada Geothermal Power Company, Raser Technologies, and Unocal, among others.
Current Energy Portfolio in Utah
Utah’s electrical energy production is dominated by traditional energy sources such as coal and natural gas, which made up 97.7 percent of Utah’s generation in 2006 (figures 1 and 2). Hydroelec-tric production totaled 1.8 percent and geothermal produced 0.5 percent to round out Utah’s renewable production to 2.3 percent in 2006. Utah is a net exporter of energy produced. This is primarily due to the Intermountain Power Project, a 1,640 megawatt (MW) coal plant that provides a majority of its power to southern Cali-fornia utilities.
Utah’s energy consumption profile differs from its production. Utilities in the state acquire energy from a variety of carbon and non-carbon-based resources (in-state and out-of-state) to serve customers in Utah (figure 3). Specifically, in 2007 Rocky Moun-tain Power’s energy portfolio in Utah consisted of 70 percent coal, 17 percent natural gas, and 13 percent renewable resources.
As Utah’s population and economy have grown over the past few decades, so has its demand for energy. Utah’s elec-tricity sales from 1987 to 2006 more than doubled from 13,398 gigawatthours (GWh) to 27,749 GWh (figure 4). Rocky Mountain Power is a subsidiary of PacifiCorp. The Paci-fiCorp system is considered a single system, so its service terri-tory (California, Oregon, Washington, Idaho, Wyoming, and Utah) receives the same mix of energy resources. By the end of 2007, PacifiCorp’s wind energy portfolio consisted of approximately 400
Figure 1. Net generation of electricity in Utah by energy source, 1960-2006 (Source: Utah Geological Survey).

Utah Geological Survey6
MW. It is estimated that by the end of 2008, its wind portfolio will total 1000 MW, which will double Rocky Mountain Power’s renewable portfolio.
Existing and Announced Utility-Scale Renewable Energy Projects
Utah’s utility-scale renewable energy generation production con-sists of hydroelectric, geothermal, landfill biomass, and, most re-cently, wind energy. The total amount of generation capacity for
these technologies is 341 MW, (Utah Geological Survey, 2008b, tables 5.5-5.7). Grid-tied distributed energy from renewable en-ergy is expected to be less than 1 MW in Utah according to vari-ous reports from Utah utilities. Utah has several renewable energy projects that have recently begun or are about to break ground. For example, a 10 MW geothermal project (Raser Technology Inc.) is currently being constructed in Iron and Beaver Counties, and a 185 MW wind farm (First Wind) broke ground in fall 2008 in Beaver and Millard Counties. Both projects have signed power purchase agreements with out-of-state utilities. Future phases are in the plans for both companies, but it is unknown where the power will be sold. In addition, there are several other geothermal and wind
Figure 3. 2007 Rocky Mountain Power energy portfolio (Source: PacifiCorp).
Figure 2. Net generation (percent) of electricity in Utah by energy source, 1960-2006 (Source: Utah Geological Survey).
Utah Renewable Energy Zones Task Force Phase I Report: Renewable Energy Zone Resource Identification 7
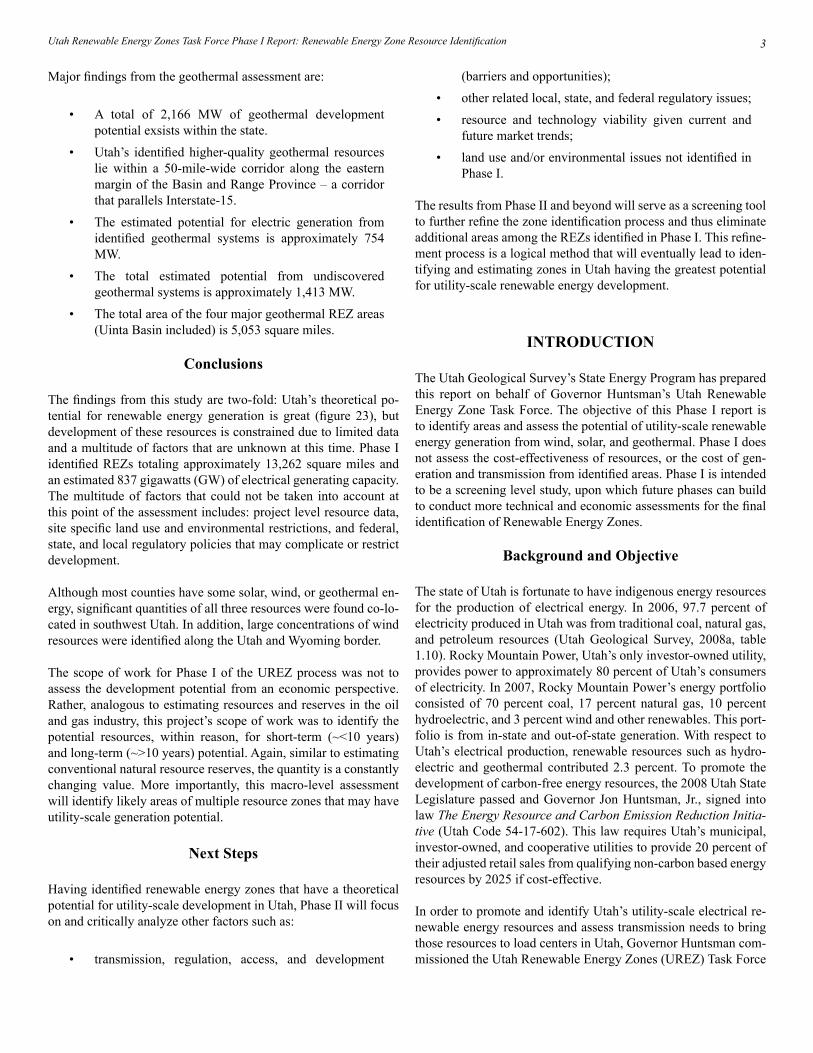
Figure 4. Sales of electricity in Utah by class of service, 1960-2007 (Source: Utah Geological Survey).
projects throughout the state in various planning phases, the total generation capacity of which is unknown at this time.
Utah’s Energy Resource and Carbon Emission
Reduction Initiative
In March 2008, Governor Huntsman signed Senate Bill 202, The Energy Resource and Carbon Emission Reduction Initia-tive, spearheaded by the Senate Majority Leader, Curtis Bramble, through which Utah’s electric utilities will provide 20 percent of their adjusted retail sales from renewable energy by 2025 if cost effective. Adjusted retail sales are defined by the total kilowatt-hours (kWh) of retail sales minus sales from non-carbon-emitting energy sources. These energy sources are nuclear, demand-side management, co-generation, and coal or natural gas plants with operational carbon sequestration technology. This legislation es-tablishes Utah’s Renewable Portfolio Goal (RPG). The 20 percent requirement may be met by the following renewable technologies: wind, geothermal, hydro (limited eligibility), biomass (limited eli-gibility), solar photovoltaic, and concentrating solar power. Lim-ited eligibility depends on the commissioning date of the project. Each kWh of solar-generated electricity counts as 2.4 kWh gener-ated. In addition, renewable energy credits (RECs) can help meet this goal. The renewable electricity that will be counted toward
this goal must be generated within the Western Electric Coordinat-ing Council’s jurisdiction.
Assessment of Renewable Energy Technology
Solar
Utility-scale solar electrical generation technologies come in two primary forms: (1) solar photovoltaic (solar PV), and (2) concen-trating solar power (CSP). Solar PV technologies use semiconduc-tor materials to convert light energy into electrical energy. Cur-rently there are only two centralized utility-scale solar PV projects in operation in the U.S.
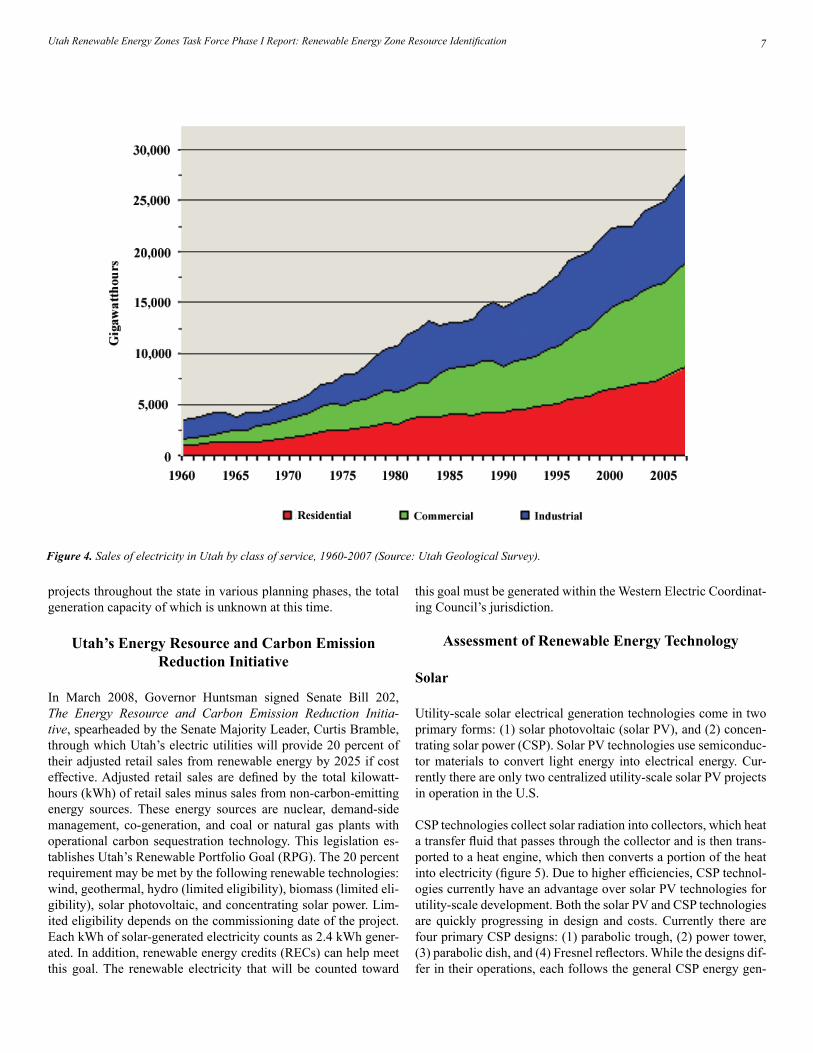
CSP technologies collect solar radiation into collectors, which heat a transfer fluid that passes through the collector and is then trans-ported to a heat engine, which then converts a portion of the heat into electricity (figure 5). Due to higher efficiencies, CSP technol-ogies currently have an advantage over solar PV technologies for utility-scale development. Both the solar PV and CSP technologies are quickly progressing in design and costs. Currently there are four primary CSP designs: (1) parabolic trough, (2) power tower, (3) parabolic dish, and (4) Fresnel reflectors. While the designs dif-fer in their operations, each follows the general CSP energy gen-
Utah Geological Survey8
eration principles described above. For more information on CSP technology go to NREL’s Concentrating Solar Power Web page at http://www.nrel.gov/csp.
CSP is considered an intermittent resource due to the nature of local solar resources. However, this technology is predictable in regard to when generation will be provided. A CSP generation pro-file is similar to the localized solar resource. Average capacity fac-tors for CSP (without thermal storage) are 18 to 25 percent. CSP can be developed with thermal storage, which can increase capac-ity factors to 40–45 percent. It has not yet been incorporated for a commercial project in the United States. Solar is not considered base load power, as are coal and geothermal, because it does not run at a constant level 24 hours a day, 7 days a week. It can, how-ever, offset generation that is used only a few hours per day when the load is high—generation that often has the highest production costs within the utility’s energy portfolio. And with the advent of thermal storage technologies coupled with CSP, there is potential for solar to provide limited base power. For information on ther-mal storage technologies go to NREL’s Thermal Energy Storage Technology Web page at http://www.nrel.gov/csp/troughnet/ther-mal_energy_storage.html.
Several hundred megawatts of parabolic trough systems have been operating in the western U.S. for over 20 years. Recently, one large 60 MW plant was commissioned in Nevada, and several hundred megawatts of power-purchase agreements have been signed be-tween developers and California utilities for multiple CSP tech-nologies, including parabolic trough systems. These systems have the option of thermal storage that in effect allows a CSP plant to generate power at true “peak demand” and even to become dis-patchable, similar to natural gas power plants.
For the purposes of this report, the primary solar technology used was CSP. As mentioned above, there are several CSP designs. Each design has its own characteristics, e.g., operations, construction,
project footprint, maintenance, etc. The NREL software used a parabolic trough design as a proxy technology for this assessment (figure 5).
The greatest concentration of high-quality solar resources is lo-cated in the western United States. Utah’s solar resources are a higher quality than most states, but when compared to other west-ern solar resources, it tends to rank behind California, Arizona, Nevada, and New Mexico (figure 6). However, southern Utah’s high direct nominal irradiance (DNI) values are favorable for large utility-scale CSP plants. Direct solar irradiance is a measure of the rate of solar energy arriving at Earth’s surface from the sun’s direct beam, on a plane perpendicular to the beam, and is usually measured by a pyrheliometer mounted on a solar tracker. Wind
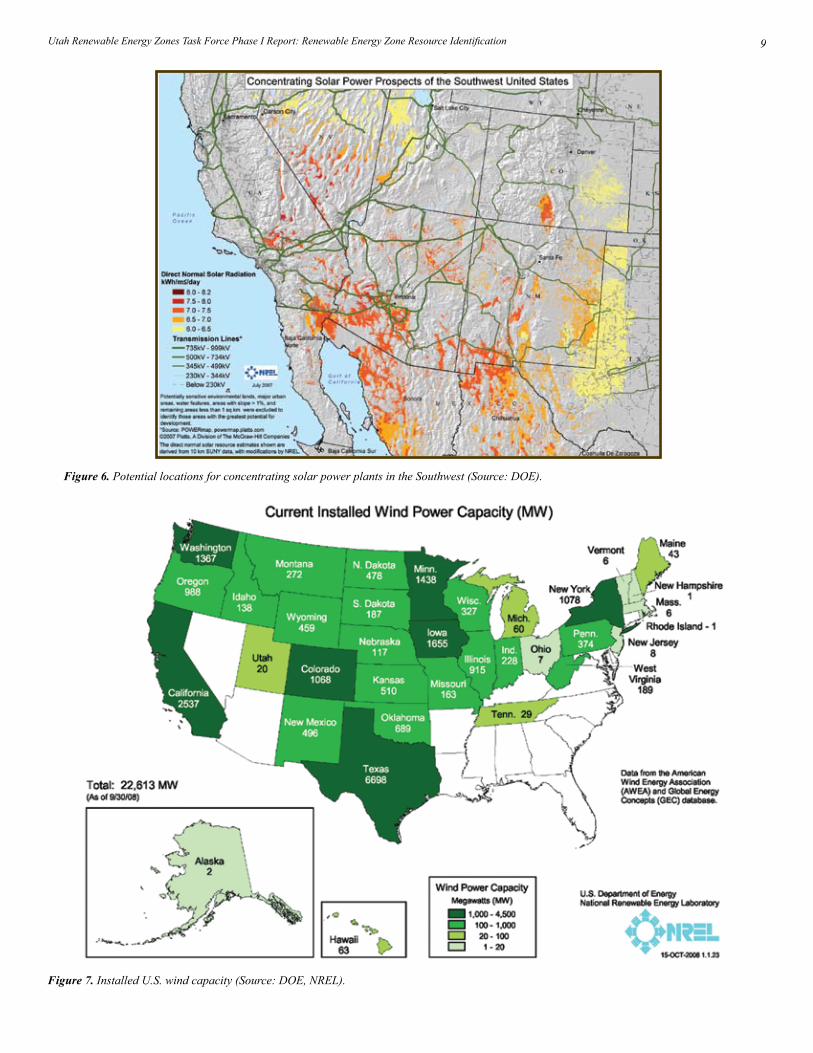
Wind turbine systems (WTS) convert energy in the wind to elec-tricity via rotating blades and a generator. In 2007, according to the U.S. Department of Energy’s Energy Information Administration, wind energy development outpaced all other forms of energy in the U.S. (Energy Information Administration, 2008). As of September 2008, U.S. wind generation capacity totaled 22,613 MW of capac-ity (Energy Information Administration, 2008). Utah currently has 19.8 MW of commercial wind capacity.
A typical individual WTS has 1.5 to 2 MW generating capacity. Arrays of WTS, often called wind farms, range from a few mega-watts in size to several hundred megawatts. Wind development has occurred primarily in the western U.S., but also is occurring in the Midwest and eastern U.S. (figure 7).
Wind energy is considered an intermittent resource due to the na-ture of local wind resources. Average capacity factors for WTS are 25 to 40 percent. Because wind energy is not constant, wind is
Figure 5. Concentrating solar thermal system; parabolic trough design (Source: DOE).
Utah Renewable Energy Zones Task Force Phase I Report: Renewable Energy Zone Resource Identification 9
Figure 7. Installed U.S. wind capacity (Source: DOE, NREL).
Figure 6. Potential locations for concentrating solar power plants in the Southwest (Source: DOE).
Utah Geological Survey10
not considered base load. It can, however, offset generation that is used only a few hours per day when the load is high—generation that often has the highest production costs within the utility’s en-ergy portfolio. Geothermal
Geothermal electricity generation is the process whereby hot water or steam, extracted from a geothermal reservoir in the earth’s crust, is used to power a heat engine via a flash or binary generating sys-tem. Currently, two basic power plants are used to generate elec-tricity: (1) steam generation and (2) binary generation.
Steam generation is an open loop system that uses the direct heat (steam) from the geothermal resource to spin a turbine, which then drives a generator to produce electricity. The geothermal fluid is then strategically reinjected back into the geothermal reservoir. Bi-nary generation is a closed loop system that transfers the geother-mal fluid to a secondary fluid. The secondary fluid vaporizes and then spins a turbine and drives a generator to produce electricity. The geothermal fluid is then reinjected back into the geothermal reservoir. For more information on geothermal technologies go to NREL’s Geothermal Technologies Web page at http://www.nrel.gov/geothermal/.
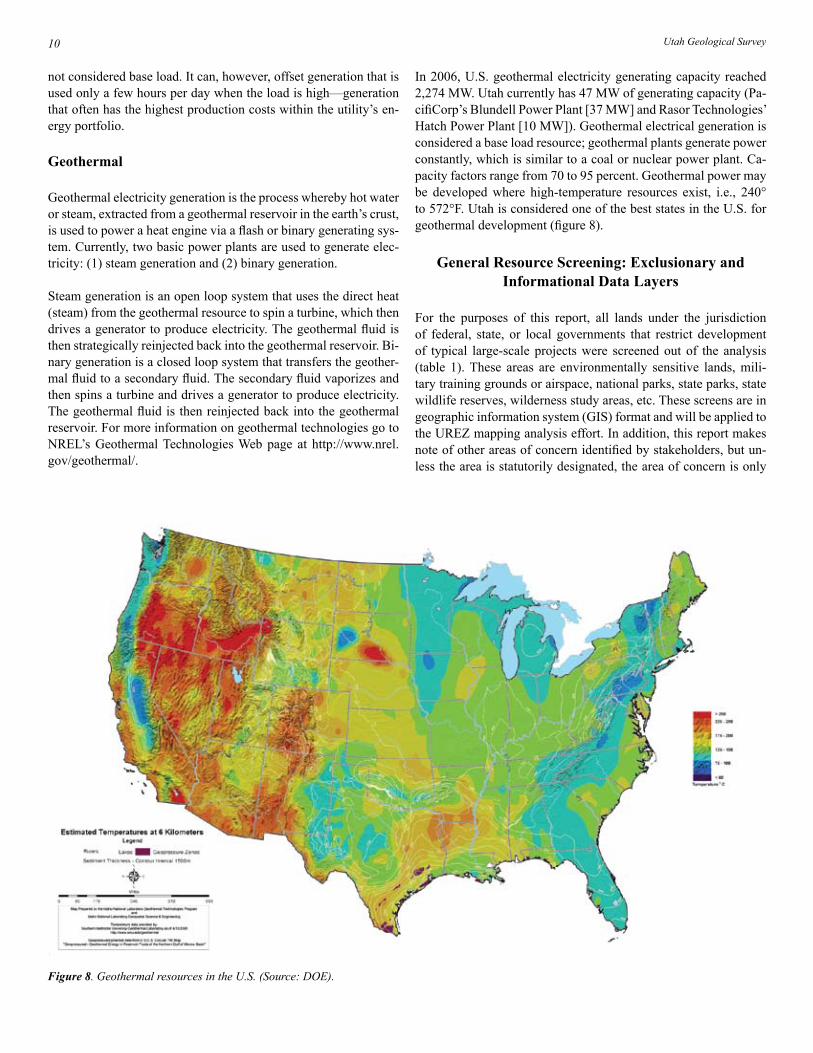
In 2006, U.S. geothermal electricity generating capacity reached 2,274 MW. Utah currently has 47 MW of generating capacity (Pa-cifiCorp’s Blundell Power Plant [37 MW] and Rasor Technologies’ Hatch Power Plant [10 MW]). Geothermal electrical generation is considered a base load resource; geothermal plants generate power constantly, which is similar to a coal or nuclear power plant. Ca-pacity factors range from 70 to 95 percent. Geothermal power may be developed where high-temperature resources exist, i.e., 240° to 572°F. Utah is considered one of the best states in the U.S. for geothermal development (figure 8).
General Resource Screening: Exclusionary and
Informational Data Layers
For the purposes of this report, all lands under the jurisdiction of federal, state, or local governments that restrict development of typical large-scale projects were screened out of the analysis (table 1). These areas are environmentally sensitive lands, mili-tary training grounds or airspace, national parks, state parks, state wildlife reserves, wilderness study areas, etc. These screens are in geographic information system (GIS) format and will be applied to the UREZ mapping analysis effort. In addition, this report makes note of other areas of concern identified by stakeholders, but un-less the area is statutorily designated, the area of concern is only
Figure 8. Geothermal resources in the U.S. (Source: DOE).

Utah Renewable Energy Zones Task Force Phase I Report: Renewable Energy Zone Resource Identification 11
identified and not used as a screen in Phase I. However, there may be additional screens added in later phases of the UREZ process.
Informational layers that contain helpful information on the geog-raphy of the state will be available in association with this report via an interactive mode from the Utah Geological Survey Web site at http://mapserv.utah.gov/urez. They are also shown in table 2.
SOLAR RESOURCE ASSESSMENT
This assessment of solar power resources was conducted by the UREZ Solar Working Group Chair, David Hurlbut of the National Renewable Energy Laboratory (NREL). This section provides an estimate of how much utility-scale solar theoretical potential Utah has, and where the best potential is likely to be found. The objec-tive of this assessment is to provide background information on solar resources to help the UREZ Task Force identify concentra-tions of high-quality renewable energy potential that may be suf-ficient to warrant high-voltage transmission upgrades. It should be noted that distance to and availability of transmission lines, devel-opment costs, and cost effectiveness were not factors included in this analysis. Rather, this analysis is a screening-level study that identifies geographical locations of solar resources and estimates the theoretical potential of electrical energy capacity from a proxy technology. This analysis is not an attempt to provide a project-level assessment of the solar energy resource quality or project development potential. Interested individuals should consult with
industry professionals about developments at the project level.
Utah is on the periphery of the country’s most productive regions for solar power. Its technical potential for large-scale solar power exceeds its total electricity consumption by orders of magnitude. All told, Utah’s theoretical potential equates to about 826 GW of utility-scale solar generating capacity. Generating capacity is the maximum power output available from a generator. However, as discussed on page 8, energy production characteristics of CSP technologies are intermittent due to the nature of solar as an en-ergy resource. As a result, CSP technologies will not generate at capacity 100 percent of the time. Average capacity factors for CSP (without thermal storage) are 18 to 25 percent. CSP can be devel-oped with thermal storage, which can increase capacity factors to 40–45 percent.
This assessment begins by describing a number of underlying as-sumptions. Perhaps the most important of these is the need to use a single reference technology and standard screening criteria to compare the merits of different areas. Generic screening criteria used here may inadvertently overlook specific projects that show unusual promise, but project-specific precision is not the aim of this study. These findings are intended to provide Utah with a broad and balanced assessment of long-term development potential.
Methods
This assessment incorporated previous seminal work done by NREL and others, extracting elements specific to Utah. The analy-
Table 1. Exclusionary screening criteria (data provided by Utah Automat-ed Geographic Reference Center [AGRC] and State Institutional Trust Lands Administration [SITLA]).
Table 2. Informational layers.
EXCLUSIONARY LAYER NAME
WHERE LAYER IS HOUSED
State Parks AGRC / SITLA (Land Owner)
State Wildlife Reserves AGRC / SITLA (Land Owner)
National Recreation Areas AGRC / SITLA (Land Owner)
National Monuments AGRC / SITLA (Land Owner)
National Parks AGRC / SITLA (Land Owner)
National Wildlife Refuges AGRC / SITLA (Land Owner)
National Wilderness Areas AGRC / SITLA (Land Owner)
Airports AGRC (Airports)
Surface Mines AGRC (MinesGNIS)
Wilderness Study Areas (BLM)
AGRC / SITLA (Land Owner)
Identified Roadless Areas (U.S.F.S.)
AGRC (USFS Roadless In-ventory)
Wetlands AGRC (Wetlands)
INFORMATIONAL LAYER NAME
WHERE LAYER IS HOUSED
Large Water Bodies AGRC (WaterBodies)
Forest Service Land AGRC / SITLA (Land Owner)
Bureau of Land Management
AGRC / SITLA (Land Owner)
State Trust Land AGRC / SITLA (Land Owner)
State Sovereign Land AGRC / SITLA (Land Owner)
Intermittent Water AGRC / SITLA (Land Owner)
Native American Reservations
AGRC / SITLA (Land Owner)
Private Land AGRC / SITLA (Land Owner)
Military Operating Areas (MOAs)
Hill Air Force Base
Fault Lines AGRC / UGS (Fault Lines)

Utah Geological Survey12
sis involved the following steps:
Measure the amount of direct normal irradiance (DNI) • falling on different parts of the state.
Screen out areas that are too steep (>3%) to accommo-• date a large solar collection field economically.
Screen out environmentally sensitive areas and other • areas that for known reasons are not available for development.
Quantify the differences in resource quality among the • remaining areas.
DNI data were taken from the National Solar Radiation Data-base, which models solar radiation using both historical surface data from more than 1,400 National Weather Service observation stations nationwide, and satellite imagery from NASA’s Geosta-tionary Operational Environment Satellites. The model produces estimates of global and direct irradiance at hourly intervals on a 10-kilometer (6.2-mile) grid for all 50 states (excluding Alaska above 60° north latitude and west of 160° west longitude).
Steep or irregular land surfaces normally pose additional difficulty and cost for a large-scale solar power project. For a thermal para-bolic trough concentrating solar power (CSP) plant, each row of the solar array (including the pipe above the trough conveying the heat transfer fluid) needs to be at a consistent angle in order to maintain trough-to-trough connections. These rows can be hun-dreds of meters long. Leveling uneven land adds to both the proj-ect cost and the environmental impact; if the natural contours are to be maintained, each point of the trough support structure must be custom-built, which also increases project costs. A level site is less critical for other types of CSP systems, although land contours will complicate the field layout.
Because Utah’s solar resource potential is so vast (6,371 square miles), this analysis assumed that the additional development costs imposed by steep or irregular terrain would prevent such sites from being economically competitive, even if they are tech-nically viable. The analysis reflected this assumption by screening out areas that have an average slope greater than 1 percent (figure 9). The slope screen imposed the assumption that, all else being equal, a flat area is an economically better development prospect than a contoured area adjacent to it with the same DNI. The slope screen used a 30-meter (98.4-foot) grid, or about one quarter of an acre. This is a higher geospatial resolution than the DNI data, and roughly the amount of contiguous land area needed for a medium-sized parabolic trough CSP plant.
Although the 1 percent slope screen was used to approximate the amount of Utah’s solar potential, the geographic bounds of where that potential may be found may in fact be larger than what the slope criteria would indicate. Areas on the periphery of a flat area may be developable due to special features or circumstances that a broad assessment cannot capture. Conversely, areas meeting the 1 percent slope criterion may still be too difficult to develop for local
reasons not identified in this assessment. To compensate for these potential errors, this assessment used a 3 percent slope screen to approximate where the developable potential is likely to exist (fig-ure 10). This less-rigorous screen essentially added a buffer around the areas passing the 1 percent slope screen.
The next step was to eliminate areas known to be off limits to development, such as national parks and wildlife preserves. Cities, towns, and water bodies were eliminated from the analysis as well. NREL has a database of exclusion areas applied to all state and national resource assessments, drawn from federal agencies and the Conservation Biology Institute.
Slope screening and land exclusions were applied by NREL using geographic information system (GIS) tools. After all the filters were applied, NREL used GIS analysis to calculate the total size (in square kilometers) of areas at different levels of DNI. Only contiguous areas at least one square kilometer in size were includ-ed in the final aggregation.
Assumptions
This statewide assessment relied on a number of simplifying as-sumptions. Unique project or site-specific factors were ignored by design, due to the need to provide a standard comparison over a wide area. Consequently, the general findings described in this report do not replace information from a more detailed pro forma analysis of a specific solar technology at a specific site.
Solar-powered distributed generation is outside 1. the scope of this study. The purpose of the UREZ initiative is to aid transmission planning for renewable energy development. Rooftop photovoltaic (PV) panels and other types of distributed solar electric generation systems, however, can be installed almost anywhere and by definition do not depend on transmission availability. Consumer decisions to install distributed PV are not influenced by whether the solar potential exists in a concentrated area. Therefore, the identification of a UREZ is largely irrelevant to the development of on-site PV.
Any site that will work for the most commonly 2. used CSP technology will work at least as well for any other large-scale solar technology. The use of a reference CSP technology—specifically, a dry-cooled parabolic trough facility with six hours of thermal storage—does not imply a preferred technology, nor does it preclude the use of any other large-scale solar technology in any area identified in this study. However, if any new technology were indeed superior to the reference system used here, all of the conclusions reached in this study would still hold true as a conservative estimation of the theoretical potential that state regulators and utility planners can reasonably anticipate.

Utah Renewable Energy Zones Task Force Phase I Report: Renewable Energy Zone Resource Identification 13
Figure 9. Solar resource areas with slope less than one percent. Direct Normal Irradiance is a measure of the solar resource before it is converted to elec-tricity. In Utah, overall energy conversion efficiency (from solar collector to electrical generation) is approximately 15 percent for CSP parabolic trough technology. An interactive version of this map is available online at http://mapserv.utah.gov/urez.

Utah Geological Survey14
Figure 10. Solar resource areas with slope less than three percent. An interactive version of this map is available online at http://mapserv.utah.gov/urez.
Utah Renewable Energy Zones Task Force Phase I Report: Renewable Energy Zone Resource Identification 15
Differences in development potential that may 3. be due to the special characteristics of a special technology are entrepreneurial in nature and are not germane to this analysis. The ability of any individual developer to improve the efficiency of any given site due to technological innovations was regarded here as a matter of proprietary competitive advantage. Not only are such entrepreneurial factors extremely difficult to measure, they are not germane to the task of identifying where the greatest solar potential exists.
A reasonable estimate of the land area capable 4. of sustaining a solar renewable energy zone will increase the likelihood that potential site-specific environmental concerns are identified early. In some cases, environmental issues can be resolved if given sufficient time to explore options. Reasoned solutions are less likely if interested parties learn of a potential project at the last minute. The simplifying assumptions required to make this statewide assessment possible posed a risk of incorrectly eliminating sites that in fact may be of interest to potential developers, or of incorrectly including areas that in fact are of little interest. Overestimating the area of potential development errs on the side of caution with respect to early identification of potential environmental issues.
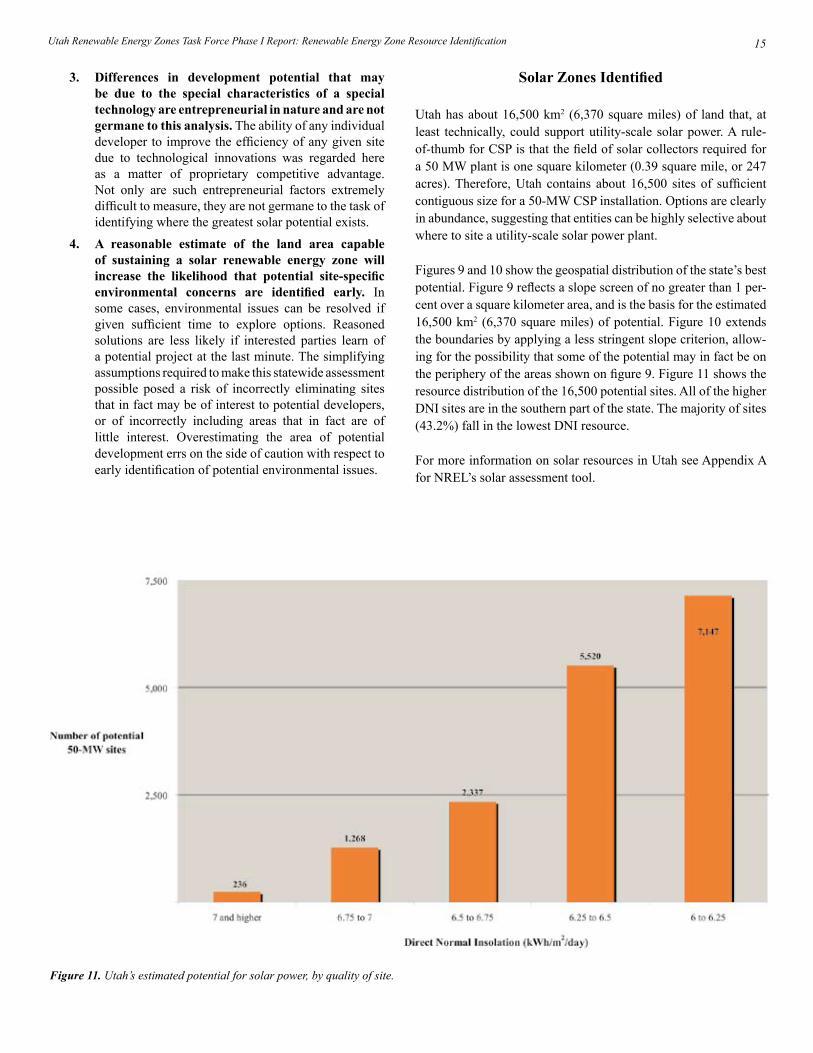
Solar Zones Identified
Utah has about 16,500 km2 (6,370 square miles) of land that, at least technically, could support utility-scale solar power. A rule-of-thumb for CSP is that the field of solar collectors required for a 50 MW plant is one square kilometer (0.39 square mile, or 247 acres). Therefore, Utah contains about 16,500 sites of sufficient contiguous size for a 50-MW CSP installation. Options are clearly in abundance, suggesting that entities can be highly selective about where to site a utility-scale solar power plant.
Figures 9 and 10 show the geospatial distribution of the state’s best potential. Figure 9 reflects a slope screen of no greater than 1 per-cent over a square kilometer area, and is the basis for the estimated 16,500 km2 (6,370 square miles) of potential. Figure 10 extends the boundaries by applying a less stringent slope criterion, allow-ing for the possibility that some of the potential may in fact be on the periphery of the areas shown on figure 9. Figure 11 shows the resource distribution of the 16,500 potential sites. All of the higher DNI sites are in the southern part of the state. The majority of sites (43.2%) fall in the lowest DNI resource.
For more information on solar resources in Utah see Appendix A for NREL’s solar assessment tool.
Figure 11. Utah’s estimated potential for solar power, by quality of site.
Utah Geological Survey16
Site Name80-m Wind
Speeds (mps)
Gross Capacity
Factor
Wind Class
Pleasant View 3.1 2.9% 1
Tooele 3.2 2.7% 1
Fruitland 3.4 4.1% 1
Pelican Lake 3.5 4.9% 1
Richfield 3.5 5.4% 1
Mayfield 3.5 7.6% 1
Moroni 3.6 5.7% 1
Promontory Point – I
3.7 6.4% 1
Wanship 3.7 6.7% 1
Utah Lake 3.8 7.9% 1
Monroe 3.9 8.0% 1
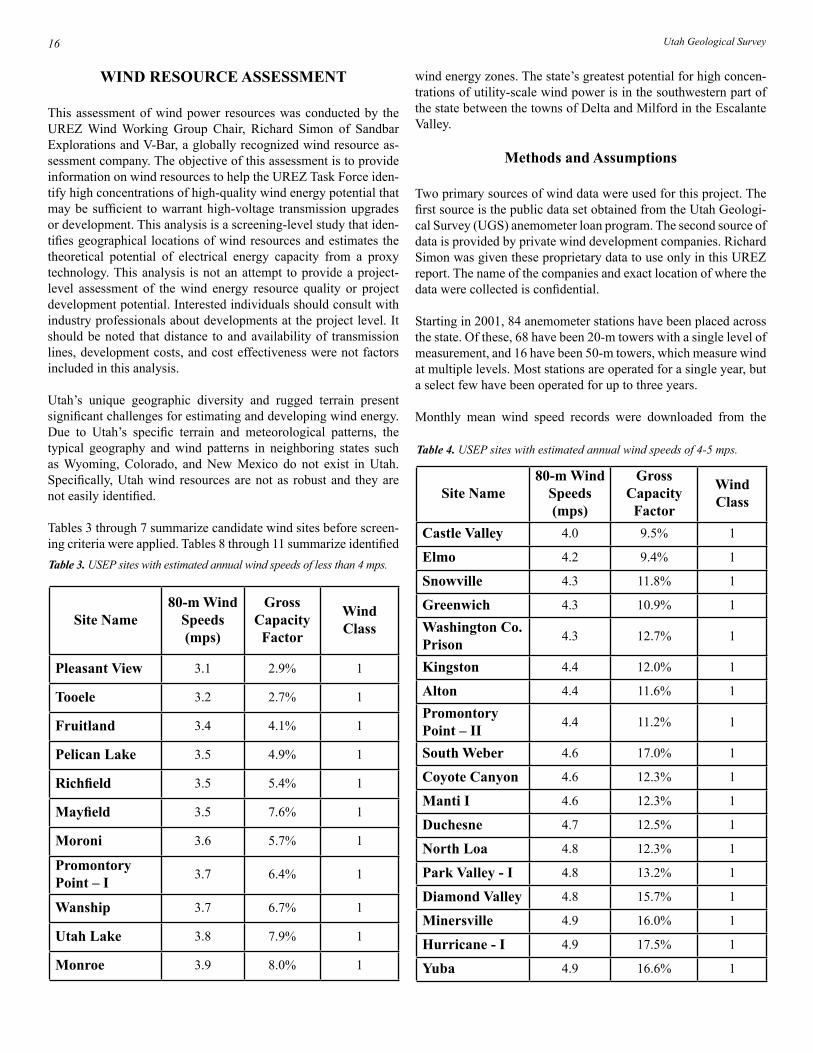
Table 3. USEP sites with estimated annual wind speeds of less than 4 mps.
Table 4. USEP sites with estimated annual wind speeds of 4-5 mps.
Site Name80-m Wind
Speeds (mps)
Gross Capacity
Factor
Wind Class
Castle Valley 4.0 9.5% 1
Elmo 4.2 9.4% 1
Snowville 4.3 11.8% 1
Greenwich 4.3 10.9% 1
Washington Co. Prison
4.3 12.7% 1
Kingston 4.4 12.0% 1
Alton 4.4 11.6% 1
Promontory Point – II
4.4 11.2% 1
South Weber 4.6 17.0% 1
Coyote Canyon 4.6 12.3% 1
Manti I 4.6 12.3% 1
Duchesne 4.7 12.5% 1
North Loa 4.8 12.3% 1
Park Valley - I 4.8 13.2% 1
Diamond Valley 4.8 15.7% 1
Minersville 4.9 16.0% 1
Hurricane - I 4.9 17.5% 1
Yuba 4.9 16.6% 1
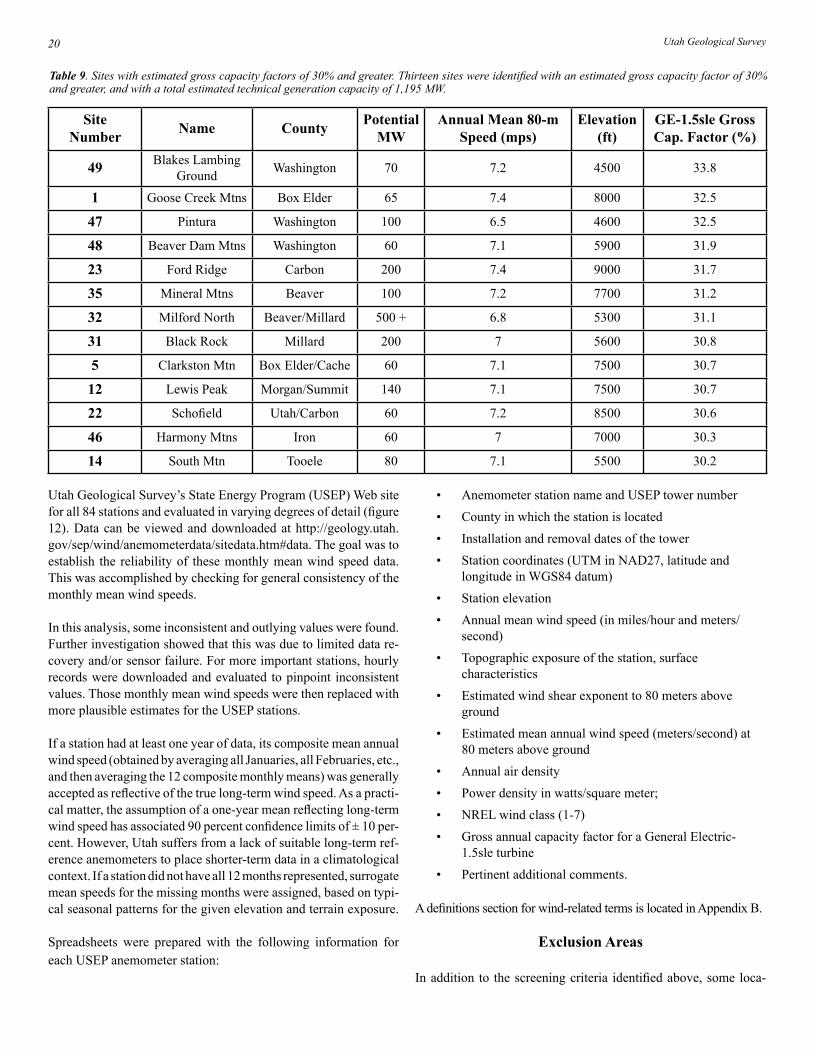
WIND RESOURCE ASSESSMENT
This assessment of wind power resources was conducted by the UREZ Wind Working Group Chair, Richard Simon of Sandbar Explorations and V-Bar, a globally recognized wind resource as-sessment company. The objective of this assessment is to provide information on wind resources to help the UREZ Task Force iden-tify high concentrations of high-quality wind energy potential that may be sufficient to warrant high-voltage transmission upgrades or development. This analysis is a screening-level study that iden-tifies geographical locations of wind resources and estimates the theoretical potential of electrical energy capacity from a proxy technology. This analysis is not an attempt to provide a project-level assessment of the wind energy resource quality or project development potential. Interested individuals should consult with industry professionals about developments at the project level. It should be noted that distance to and availability of transmission lines, development costs, and cost effectiveness were not factors included in this analysis.
Utah’s unique geographic diversity and rugged terrain present significant challenges for estimating and developing wind energy. Due to Utah’s specific terrain and meteorological patterns, the typical geography and wind patterns in neighboring states such as Wyoming, Colorado, and New Mexico do not exist in Utah. Specifically, Utah wind resources are not as robust and they are not easily identified.
Tables 3 through 7 summarize candidate wind sites before screen-ing criteria were applied. Tables 8 through 11 summarize identified
wind energy zones. The state’s greatest potential for high concen-trations of utility-scale wind power is in the southwestern part of the state between the towns of Delta and Milford in the Escalante Valley.
Methods and Assumptions
Two primary sources of wind data were used for this project. The first source is the public data set obtained from the Utah Geologi-cal Survey (UGS) anemometer loan program. The second source of data is provided by private wind development companies. Richard Simon was given these proprietary data to use only in this UREZ report. The name of the companies and exact location of where the data were collected is confidential.
Starting in 2001, 84 anemometer stations have been placed across the state. Of these, 68 have been 20-m towers with a single level of measurement, and 16 have been 50-m towers, which measure wind at multiple levels. Most stations are operated for a single year, but a select few have been operated for up to three years.
Monthly mean wind speed records were downloaded from the

Utah Renewable Energy Zones Task Force Phase I Report: Renewable Energy Zone Resource Identification 17
Table 5. USEP sites with estimated annual wind speeds of 5-6 mps.
Site Name
80-m Wind
Speeds (mps)
Gross Capacity
Factor
Wind Class
Utah State Prison 5.0 14.8% 1
WECCO – I 5.0 16.8% 1
Beryl 5.1 17.6% 1
Park Valley – II 5.1 15.2% 1
Cedar Ridge Coop
5.1 17.7% 1
Milford 5.1 18.2% 1
Bicknell 5.2 17.7% 1
Hurricane – II 5.3 20.8% 2
Raft River – II 5.4 20.4% 2
Cricket – I 5.4 17.6% 1
Stansbury 5.4 17.5% 1
Home Ranch 5.5 18.3% 1
Big Mountain 5.5 18.0% 1
Collinston 5.5 21.8% 2
Cedar City 5.5 20.0% 1
Stag Canyon 5.6 19.2% 1
Leamington 5.6 18.4% 1
Manti – II 5.6 18.6% 1
Callao 5.8 23.2% 2
Crawford 5.8 20.0% 1
North Collinston 5.9 20.7% 2
Cricket – II 5.9 20.7% 2
Mountain Lake 5.9 23.1% 2
Monticello – II 5.9 21.9% 2
Soldier Summit 5.9 21.2% 2
Table 6. USEP sites with estimated annual wind speeds of 6-7 mps.
Site Name
80-m Wind
Speeds (mps)
Gross Capacity
Factor
Wind Class
Hyrum 6.0 28.9% 2
Simpson Springs – II 6.1 22.3% 2
Diamond Mountain 6.2 23.1% 2
Cedar Creek 6.2 23.3% 2
Simpson Springs – I 6.3 27.9% 3
Hexcel 6.0 27.6% 3
Garrison – II 6.3 27.4% 3
Mapleton 6.3 31.3% 3
Garrison – I (20m) 6.4 27.7% 3
Raft River – I 6.4 28.5% 3
Wah Wah Valley 6.4 28.5% 3
Garrison – I 6.5 28.4% 3
Pintura 6.5 26.3% 3
Monticello 6.7 28.1% 3
Porcupine Ridge 6.8 27.3% 3
Camp Williams 6.8 27.4% 3
Tooele Army Depot South
6.9 29.0% 3
Table 7. USEP sites with estimated annual wind speeds greater than 7 mps.
Site Name
80-m Wind
Speeds (mps)
Gross Capacity
Factor
Wind Class
Tooele Army Depot North 7.0 29.9% 3
Monte Cristo 7.0 28.9% 3
Stockton Bar 7.2 31.1% 3
Torrey 7.3 32.6% 4
Traverse Mtn. 7.4 33.8% 4

Utah Geological Survey18
Table 8. Identified Utah wind energy sites. Sites with an asterisk identify USEP data.
Site Number Name CountyPotential
MW
Annual Mean 80-m Speed
(mps)
Elevation (ft)
GE-1.5sle Gross Cap. Factor (%)
1 Goose Creek Mtns Box Elder 65 7.4 8000 32.5
2 Cedar Creek* Box Elder 250 + 6.2 5000 26.7
3 West Hills Box Elder 75 6.0 6600 22.6
4 Point Lookout Box Elder 50 6.2 6300 24.4
5 Clarkston Mtn Box Elder/Cache 60 7.1 7500 30.7
6 Junction Hills Box Elder/Cache 70 6.4 5600 24.4
7 Crawford Mtn* Rich 150 6.8 7500 28.3
8 Monte Cristo* Rich 180 6.8 7600 28.3
9 Murphy Ridge Rich 75 6.5 7000 26.3
10 Porcupine Ridge* Summit 200 6.9 7600 29.1
11 Morgan Ridge Morgan/Summit 50 6.6 7200 27.0
12 Lewis Peak Morgan/Summit 140 7.1 7500 30.7
13 Grassy Mtn Gap Tooele 250 + 5.8 4500 23.9
14 South Mtn* Tooele 80 7.1 5500 30.2
15 Clay Hollow Salt Lake 80 6.1 5200 25.8
16 Diamond Mtn* Uintah 150 6.3 7500 24.9
17 Blue Mtn Plateau Uintah 150 6.0 7800 22.3
18 Boulter Summit Tooele/Juab 100 6.2 6200 22.4
19 Eureka Utah/Juab/Tooele 200 6.6 7300 26.9
20 Dog Valley Utah/Juab 120 6.3 6600 25.0
21 Wasatch Plateau Sanpete/Utah 220 7.0 9000 29.6
22 Schofield Utah/Carbon 60 7.2 8500 30.6
23 Ford Ridge Carbon 200 7.4 9000 31.7
24 Argyle Ridge Duchesne/Carbon 140 6.5 9000 25.0
25 Bad Land Cliffs Duchesne 180 6.7 8500 26.9
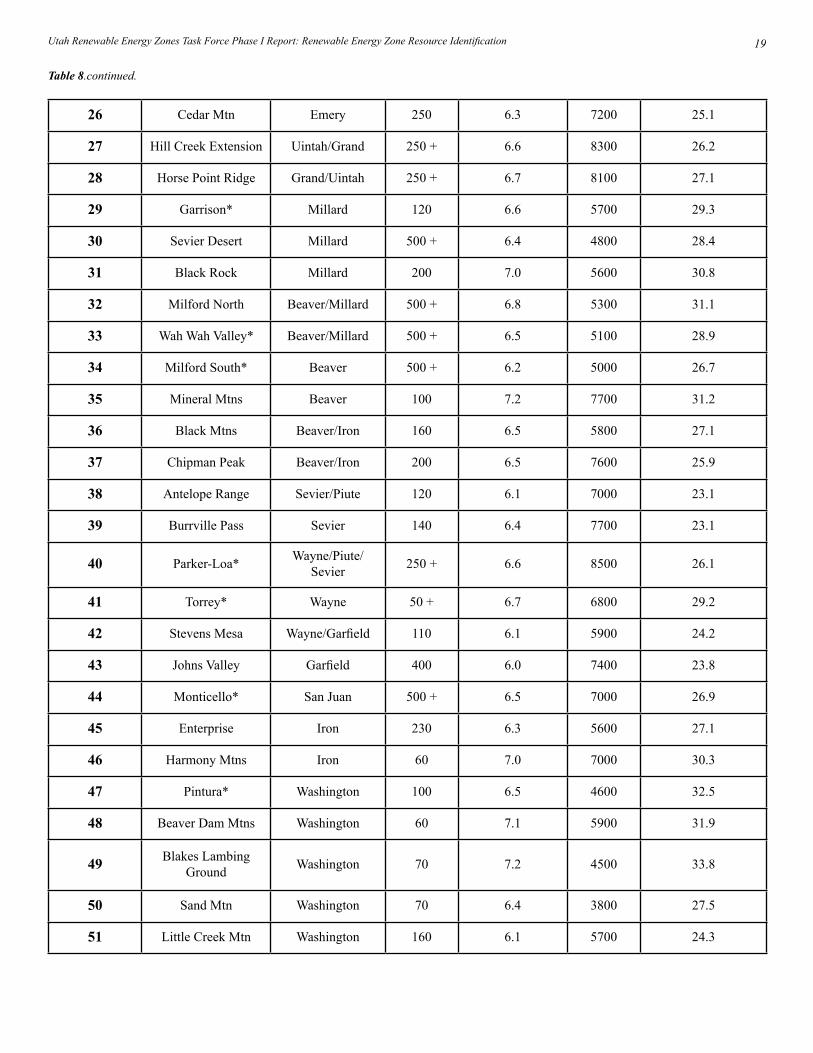
Utah Renewable Energy Zones Task Force Phase I Report: Renewable Energy Zone Resource Identification 19
26 Cedar Mtn Emery 250 6.3 7200 25.1
27 Hill Creek Extension Uintah/Grand 250 + 6.6 8300 26.2
28 Horse Point Ridge Grand/Uintah 250 + 6.7 8100 27.1
29 Garrison* Millard 120 6.6 5700 29.3
30 Sevier Desert Millard 500 + 6.4 4800 28.4
31 Black Rock Millard 200 7.0 5600 30.8
32 Milford North Beaver/Millard 500 + 6.8 5300 31.1
33 Wah Wah Valley* Beaver/Millard 500 + 6.5 5100 28.9
34 Milford South* Beaver 500 + 6.2 5000 26.7
35 Mineral Mtns Beaver 100 7.2 7700 31.2
36 Black Mtns Beaver/Iron 160 6.5 5800 27.1
37 Chipman Peak Beaver/Iron 200 6.5 7600 25.9
38 Antelope Range Sevier/Piute 120 6.1 7000 23.1
39 Burrville Pass Sevier 140 6.4 7700 23.1
40 Parker-Loa*Wayne/Piute/
Sevier250 + 6.6 8500 26.1
41 Torrey* Wayne 50 + 6.7 6800 29.2
42 Stevens Mesa Wayne/Garfield 110 6.1 5900 24.2
43 Johns Valley Garfield 400 6.0 7400 23.8
44 Monticello* San Juan 500 + 6.5 7000 26.9
45 Enterprise Iron 230 6.3 5600 27.1
46 Harmony Mtns Iron 60 7.0 7000 30.3
47 Pintura* Washington 100 6.5 4600 32.5
48 Beaver Dam Mtns Washington 60 7.1 5900 31.9
49 Blakes Lambing Ground
Washington 70 7.2 4500 33.8
50 Sand Mtn Washington 70 6.4 3800 27.5
51 Little Creek Mtn Washington 160 6.1 5700 24.3
Table 8.continued.
Utah Geological Survey20
Table 9. Sites with estimated gross capacity factors of 30% and greater. Thirteen sites were identified with an estimated gross capacity factor of 30% and greater, and with a total estimated technical generation capacity of 1,195 MW.
SiteNumber
Name CountyPotential
MWAnnual Mean 80-m
Speed (mps)Elevation
(ft)GE-1.5sle Gross Cap. Factor (%)
49 Blakes Lambing Ground
Washington 70 7.2 4500 33.8
1 Goose Creek Mtns Box Elder 65 7.4 8000 32.5
47 Pintura Washington 100 6.5 4600 32.5
48 Beaver Dam Mtns Washington 60 7.1 5900 31.9
23 Ford Ridge Carbon 200 7.4 9000 31.7
35 Mineral Mtns Beaver 100 7.2 7700 31.2
32 Milford North Beaver/Millard 500 + 6.8 5300 31.1
31 Black Rock Millard 200 7 5600 30.8
5 Clarkston Mtn Box Elder/Cache 60 7.1 7500 30.7
12 Lewis Peak Morgan/Summit 140 7.1 7500 30.7
22 Schofield Utah/Carbon 60 7.2 8500 30.6
46 Harmony Mtns Iron 60 7 7000 30.3
14 South Mtn Tooele 80 7.1 5500 30.2
Anemometer station name and USEP tower number•
County in which the station is located•
Installation and removal dates of the tower•
Station coordinates (UTM in NAD27, latitude and • longitude in WGS84 datum)
Station elevation•
Annual mean wind speed (in miles/hour and meters/• second)
Topographic exposure of the station, surface • characteristics
Estimated wind shear exponent to 80 meters above • ground
Estimated mean annual wind speed (meters/second) at • 80 meters above ground
Annual air density•
Power density in watts/square meter;•
NREL wind class (1-7)•
Gross annual capacity factor for a General Electric-• 1.5sle turbine
Pertinent additional comments.•
A definitions section for wind-related terms is located in Appendix B.
Exclusion Areas
In addition to the screening criteria identified above, some loca-
Utah Geological Survey’s State Energy Program (USEP) Web site for all 84 stations and evaluated in varying degrees of detail (figure 12). Data can be viewed and downloaded at http://geology.utah.gov/sep/wind/anemometerdata/sitedata.htm#data. The goal was to establish the reliability of these monthly mean wind speed data. This was accomplished by checking for general consistency of the monthly mean wind speeds.
In this analysis, some inconsistent and outlying values were found. Further investigation showed that this was due to limited data re-covery and/or sensor failure. For more important stations, hourly records were downloaded and evaluated to pinpoint inconsistent values. Those monthly mean wind speeds were then replaced with more plausible estimates for the USEP stations.
If a station had at least one year of data, its composite mean annual wind speed (obtained by averaging all Januaries, all Februaries, etc., and then averaging the 12 composite monthly means) was generally accepted as reflective of the true long-term wind speed. As a practi-cal matter, the assumption of a one-year mean reflecting long-term wind speed has associated 90 percent confidence limits of ± 10 per-cent. However, Utah suffers from a lack of suitable long-term ref-erence anemometers to place shorter-term data in a climatological context. If a station did not have all 12 months represented, surrogate mean speeds for the missing months were assigned, based on typi-cal seasonal patterns for the given elevation and terrain exposure.
Spreadsheets were prepared with the following information for each USEP anemometer station:

Utah Renewable Energy Zones Task Force Phase I Report: Renewable Energy Zone Resource Identification 21
Table 10. Sites with estimated gross capacity factors of 25% to 30%. Twenty-six sites were identified with an estimated gross capacity factor between 25 and 30%, with a total estimated technical generation capacity of 5,675 MW.
SiteNumber
Name CountyPotential
MWAnnual Mean 80-m
Speed (mps)Elevation
(ft)GE-1.5sle Gross Cap. Factor (%)
21 Wasatch Plateau Sanpete/Utah 220 7 9000 29.6
29 Garrison Millard 120 6.6 5700 29.3
41 Torrey Wayne 50 + 6.7 6800 29.2
10 Porcupine Ridge Summit 200 6.9 7600 29.1
33 Wah Wah ValleyBeaver/Millard
500 + 6.5 5100 28.9
30 Sevier Desert Millard 500 + 6.4 4800 28.4
7 Crawford Mtn Rich 150 6.8 7500 28.3
8 Monte Cristo Rich 180 6.8 7600 28.3
50 Sand Mtn Washington 70 6.4 3800 27.5
28 Horse Point Ridge Grand/Uintah 250 + 6.7 8100 27.1
36 Black Mtns Beaver/Iron 160 6.5 5800 27.1
45 Enterprise Iron 230 6.3 5600 27.1
11 Morgan RidgeMorgan/Summit
50 6.6 7200 27.0
19 EurekaUtah/Juab/
Tooele200 6.6 7300 26.9
25 Bad Land Cliffs Duchesne 180 6.7 8500 26.9
44 Monticello San Juan 500 + 6.5 7000 26.9
2 Cedar Creek Box Elder 250 + 6.2 5000 26.7
34 Milford South Beaver 500 + 6.2 5000 26.7
9 Murphy Ridge Rich 75 6.5 7000 26.3
27Hill Creek Extension
Uintah/Grand 250 + 6.6 8300 26.2
40 Parker-LoaWayne/Piute/
Sevier250 + 6.6 8500 26.1
37 Chipman Peak Beaver/Iron 200 6.5 7600 25.9
15 Clay Hollow Salt Lake 80 6.1 5200 25.8
26 Cedar Mtn Emery 250 6.3 7200 25.1
20 Dog Valley Utah/Juab 120 6.3 6600 25.0
24 Argyle RidgeDuchesne/
Carbon140 6.5 9000 25.0

Utah Geological Survey22
Table 11. Sites with estimated gross capacity factors of 20% to 25%. Twelve sites were identified with an estimated gross capacity factor in this range, with a total estimated technical generation capacity of 1,525 MW.
SiteNumber
Name County Potential MWAnnual Mean 80-m Speed
Elevation (ft)
GE-1.5sle Gross Cap. Factor (%)
16 Diamond Mtn Uintah 150 6.3 7500 24.9
4 Point Lookout Box Elder 50 6.2 6300 24.4
6 Junction HillsBox Elder/
Cache70 6.4 5600 24.4
51 Little Creek Mtn Washington 160 6.1 5700 24.3
42 Stevens MesaWayne/Garfield
110 6.1 5900 24.2
13 Grassy Mtn Gap Tooele 250 + 5.8 4500 23.9
43 Johns Valley Garfield 400 6 7400 23.8
38 Antelope Range Sevier/Piute 120 6.1 7000 23.1
39 Burrville Pass Sevier 140 6.4 7700 23.1
3 West Hills Box Elder 75 6 6600 22.6
18 Boulter Summit Tooele/Juab 100 6.2 6200 22.4
17Blue Mtn Plateau
Uintah 150 6 7800 22.3
tions in Utah were excluded from analysis and identification of wind sites. Due to the height of anemometer towers and wind tur-bines (80+ meters), an additional exclusion category was added to the wind analysis: military operating airspace (MOA). MOAs in Utah restrict airspace (down to 50 feet above ground level) for the purpose of military aircraft training. MOAs can overlie federal, state, county, or private lands. Federal agencies are not allowing leasing of lands that are covered by an MOA for wind resource assessments.
In addition, non-mandatory land screening criteria were used in the analysis. These areas were:
Maximum elevation 9,500 feet above sea level•
Land clearly too rugged for wind farm construction•
Forest Service lands were included only if they showed • great promise due to favorable wind, accessible land, etc.
A minimum wind resource requirement for all identified sites, agreed upon by USEP and Sandbar, was applied to justify identifi-cation as a wind site. This assumes:
a General Electric -1.5sle turbine as the proxy turbine • technology;
a drainage canyon site with at least a 10-MW potential • to be included;
other topographic features with at least a 50-MW • potential to be included;
a 20 percent minimum gross annual capacity factor. •
To determine turbine placement, a nominal spacing of three rotor diameters (231 m) along ridgelines perpendicular to the prevail-ing wind flow was assumed, and 4 x 15 rotor diameter spacing for arrays in plateau and valley exposures. Some adjustments were made based on individual candidate wind site characteristics. For really large sites (typically 250 MW or greater), the project size was assigned as greater than a given value, rather than one specific value.
Wind Sites Identified
Utah has a large theoretical potential for wind development. How-ever, the findings from this report do not take into account the costs to develop a resource. The intent of this report is to identify proj-ects that may be economically viable in future years; therefore, wind sites with a lower wind resource than most typical commer-cial sites (~ <28% annual gross capacity factor) have been identi-fied and assessed in this report.
By quantifying the estimated wind energy or electrical energy pro-duction (from a proxy wind turbine generator [WTG]), it is pos-sible to categorize these sites either by annual average wind speed, wind class, or gross capacity factor. From data reviewed and ana-lyzed from the 84 USEP anemometer tower sites, 77 stations made the UREZ reporting threshold; the other seven did not make the cut due to poor data quality and/or not meeting baseline resource criteria mentioned above. See Appendix C for high-resolution wind zone maps.

Utah Renewable Energy Zones Task Force Phase I Report: Renewable Energy Zone Resource Identification 23
Figure 12. State Energy Program’s anemometer loan program site locations.

Utah Geological Survey24
Identified Wind Zones
The wind resource data from USEP and proprietary data from pri-vate stations were plotted on mapping software, and overlaid on the Utah Automated Geographic Reference Center (AGRC) GIS files of excluded areas. A systematic review of the entire state was then performed, evaluating specific terrain features for their po-tential wind resource. Areas of interest were marked on the map, then later reviewed individually in detail to assess (1) the likely specific zone of suitable winds, (2) pertinent wind resource statis-tics (speeds, capacity factors, etc.), and (3) the estimated project size in megawatts.
Due to the complex nature of Utah geography and wind patterns, the wind identification process was subjective in many cases. The author determined when to “transfer” statistics from a known area to an unknown area. In general, this was done with a conservative bias to avoid overloading the process with too many sites.
In all, the assessment identified 91 wind sites, of which 13 are drainage canyon sites, 39 are open valley sites, 21 are low ridge sites, five are plateau sites, and 13 are high mountain sites (Ap-pendix D).
Applying all of the screening criteria resulted in the identification of 51 wind zones (or sites); these are listed in table 8 and shown on figure 13. In the Potential MW column of table 8, sites with a + have characteristics which may allow for wind development beyond what is estimated. A more complete table is available in an Excel spreadsheet, which can be found online at http://geology.utah.gov/sep/renewable_energy/urez/index.htm. See Appendix E for other sites considered that were not included in this report.
Statistics of interest for the 51 wind zones include:
The combined potential installed capacity is greater • than 9,145 MW.
The estimated annual average gross capacity factor for • the 51 zones is 27.4 percent.
There are 11 wind sites with a potential installed • capacity of at least 250 MW each.
There are 12 wind sites with estimated gross capacity • factors of at least 30 percent, accounting for 1,830 MW or greater of potential installed capacity.
The greatest concentration of wind resource in Utah • is located in the area near Milford. This includes wind sites 30-37, with greater than 2500 MW potential installed capacity.
There are wind sites in 24 out of 29 Utah counties.•
Three wind sites (5, 21, 25) are on U.S. Forest Service • land, with a potential 460 MW of installed capacity.
In order to gain some perspective on the wind resource quality
of these sites and perhaps understand their development potential, tables 9 through 11 organize the sites by their estimated gross ca-pacity factor. Sites with a higher capacity factor will have a higher production of electricity, thus lower operating cost (transmission excluded).
Wind Zone Identification and Quantification—
Uncertainties and Confidence Levels
There are numerous sources of uncertainty in the wind identifica-tion process. Below is a list of key factors, with quantitative evalu-ation where possible:
sensor accuracy and mounting, up to ±5% of wind • speed;
period of record, ±10% of mean speed with one year of • data, reduces with additional years;
station location and exposure: some locations not known • exactly, surface roughness not typically specified;
wind shear has been estimated for all UGS stations and • is known for private stations;
the extrapolation of 20-meter data to 80 meters can • introduce an uncertainty of ±7% and an extrapolation of 50-meter data can introduce an uncertainty of ±3%;
wind direction information is generally not published • and was inferred where not known;
spatial extrapolation of “known” data points to • prospective wind candidate sites varies considerably depending on distance and terrain differences between anemometer tower and site;
determination of MW potential, aggregate mean wind • speed, and aggregate gross capacity factor can be as much as ±20% in MW potential, ±5% in speed, and ±10% in relative capacity factor, all due to so-called “micro-siting uncertainties.”
When combined, the uncertainties can be rather large, especially in areas far from actual data sources.
A semi-quantitative ranking scheme was developed to assess the gen-eral magnitude of uncertainty in the predicted long-term mean and annual gross capacity factors for the 51 key wind REZs (figure 14):
Category A has a high level of confidence. These are sites with a meteorological tower within the wind zone boundary, reliable wind information from a close-by representative location, reason-ably well-understood wind direction patterns and wind regime, and/or first-hand familiarity with the area by the author. Fifteen of the 51 sites were identified in this category.
Category B has a medium level of confidence. There are no on-site data, but adequate wind records in the region are available, and the topography is not too complex to extrapolate basic wind patterns. A first-hand knowledge by the author of a site, that might other-wise be considered Category C, is sufficient to place in Category

Utah Renewable Energy Zones Task Force Phase I Report: Renewable Energy Zone Resource Identification 25
Figure 13. Identified Utah wind renewable energy zones. See Appendix C for higher resolution maps. An interactive version of this map is available online at http://mapserv.utah.gov/urez.

Utah Geological Survey26
Figure 14. Wind zone confidence levels.
Utah Renewable Energy Zones Task Force Phase I Report: Renewable Energy Zone Resource Identification 27
B. Seventeen of the 51 sites were identified in this category.
Category C has a low level of confidence. Many of these sites are inferred from topographic exposure alone, with no supporting data in the region. Nineteen of the 51 sites were identified in this category.
GEOTHERMAL RESOURCE ASSESSMENT
This section assesses the geothermal resource potential for power generation in Utah. Utah has a large number of hot spring systems throughout much of the state, and the potential for geothermal de-velopment is generally regarded as significant. With recent inter-est in the state’s resources, geothermal companies are aggressively leasing properties for electric generation. Geothermal exploration and development in Utah is currently focused on three areas: (1) Roosevelt Hot Springs, which has produced geothermal electricity since 1985, (2) Cove Fort-Sulphurdale, which produced electric-ity between 1985 and 2003, and (3) Thermo Hot Springs, which is currently being explored. Drilling at Thermo Hot Springs sug-gests the presence of a geothermal resource of sufficient size and temperature to allow power generation, even though surficial evi-dence is only a few weak springs and fossil hot spring mounds. This type of discovery is important, since it draws attention to the fact that even though the resource base is not well understood, additional commercially viable resources are likely to be present in Utah. These higher-quality geothermal resources lie within a 50-mile-wide corridor along the eastern margin of the Basin and Range Province, a corridor that parallels Interstate Highway 15. A fourth project is underway along the northern Wasatch Front in Box Elder County.
Table 12 presents the theoretical electrical potential of geothermal areas having development potential and compares resource param-eters. It should be noted that distance to and availability of trans-mission lines, the development cost, and cost effectiveness were not factors included in this analysis. This analysis is a screening-level study that identifies geographical locations of geothermal re-sources and estimates the theoretical potential of electrical energy capacity. This analysis is not an attempt to provide a project-level assessment of the geothermal energy resource quality or project development potential. Interested individuals should consult with industry professionals about developments at the project level. The estimates in table 12 are based on a combination of published resource assessments for some areas and projections for areas hav-ing thermal gradients of 100°C per kilometer (5.49°F/100 ft) or greater. The total estimated potential from both identified and un-discovered geothermal systems is approximately 2,166 MWe (e = electric).
Objectives
This study had two objectives: (1) to define areas of the state where the theoretical potential for electric generation is greatest, and (2)
to assess the electric potential of Utah’s geothermal resources. Overall, little is known about the geothermal reservoirs that mani-fest themselves occasionally at the land surface. Given that some important geothermal systems were discovered by accident in Utah (e.g., Newcastle in Iron County and Corner Canyon in Salt Lake County), it is difficult to evaluate the undiscovered resource with drilling data lacking. The report uses published information, but primarily relies on deep well data and shallow thermal-gradient information.
Objective one is defining areas of geothermal resources. Geother-mal resources of Utah can be divided into four models: (1) hydro-thermal convection systems generated by deep circulation along faults, mainly within the Basin and Range Province of western Utah, (2) magmatically driven hydrothermal convection systems associated with young plutonic rocks within and adjacent to the Mineral Range of central Utah, (3) conduction-dominated hydro-thermal systems contained in deep basins, and (4) energy available for development of enhanced geothermal systems, or engineered geothermal systems (EGS). The first two models are currently under commercial development in Utah for power generation and direct use. The latter two system models require resource assess-ment and new technology to realize their benefit.
Hydrothermal Convection Systems of the Basin & Range
The Basin and Range Province of western Utah (figure 15) is noted for numerous north-south oriented, fault-tilted mountain ranges separated by intervening, broad, sediment-filled basins. The moun-tain ranges are typically 12 to 31 miles apart, 28 to 50 miles long, and bounded on one, sometimes two, sides by high-angle faults. Typical ranges are asymmetric in cross section, having a steep slope on one side and a gentle slope on the other. The Sevier thermal area (STA) is a region of southwestern Utah where most of Utah’s known moderate- and high-temperature (>90°C) hydrothermal-geothermal systems occur. The STA cov-ers a portion of the eastern Basin and Range Province, and part of the Basin and Range-Colorado Plateau transition zone (figure 15). The geology of this region, which encompasses all of the Sevier, Black Rock, and Escalante Deserts of southwestern Utah, includes abundant faults, plutonic and volcanic rocks, basalt and rhyolite, high regional heat flow, and zones of active seismicity.
The STA is centered on the Roosevelt Hot Springs and Cove Fort-Sulphurdale Known Geothermal Resource Areas (KGRAs), where geothermal power development began some 20 years ago. Other developments in the region include a hot spring resort at the Mon-roe-Joseph area, commercial greenhouses at Newcastle, and recent geothermal power generation at Thermo Hot Springs. KGRAs that have remained undeveloped include the Crater Springs area and the Meadow-Hatton area. Areas with development potential that have been explored, but lack identified resources, are the Drum Mountains-Whirlwind Valley area near the Millard-Juab County line, the Neels Rail Siding area west of Pavant Butte, and the Ber-yl-Woods Ranch area in Iron County.

Utah Geological Survey28
Table 12. Electrical generating potential of geothermal areas in Utah. The area of the 100°C/km thermal anomaly (in square miles) is defined by the presence of thermal-gradient boreholes with gradients of 100°C per kilometer or greater (B). The area of the “defined” resource (in square miles) refers to the area evaluated within the context of a geothermal reservoir engineering study (C). Published megawatts-electric (D) refers to published resource values determined within the context of a geothermal reservoir engineering study. Possible megawatts-electric (E) refers to the potential of the total area of the thermal anomaly (B) minus the evaluated area (C) and the remainder assigned a potential of 2 megawatts per square mile.
Geothermal Site County(A)
Anomaly 100°C/km
(mi2)(B)
Defined Resource
(mi2)(C)
Published MWe(D)
Possible MWe(E)
Total MWe
(F)
IDENTIFIED
Sevier Thermal Area - Explored
Roosevelt Beaver 55 10 120 90 210
Cove Fort-Sulphurdale Beaver, Millard 94 7 102 174 276
Thermo Beaver, Iron 37 35 138 0 138
Newcastle Iron 2 2 10 0 10
Beryl Iron 2 2 0 10 10
SUBTOTAL 370 274 644
Sevier Thermal Area - Unexplored
Crater Springs Juab - 10
Drum-Whirlwind Millard, Juab 90 10
Meadow-Hatton Beaver, Millard 10 10
Monroe-Red Hill Sevier 1 2
Joseph Sevier - 2
SUBTOTAL 34
Northern Wasatch Front
Crystal-Madsen Box Elder - 10
Utah Hot Springs Box Elder - 10
Ogden Hot Springs Weber - 10
Hooper Hot Springs Salt Lake - 5
Warm Springs Fault Salt Lake - 2
Crystal-Prison Salt Lake - 2
Corner Canyon Salt Lake - 5
SUBTOTAL 44 44
Deep Conductive Resources
Davis #1 (Renaissance)* Box Elder - 7 32 32
Altamont-Bluebell Duchesne, Uintah - -
SUBTOTAL 32
SUBTOTAL (identified) 7 32 754
UNDISCOVERED
Escalante-Sevier-Black Rock (0.25 MWe/mi2)
Juab, Beaver, Millard, Iron
5,297 1,324
Raft River North (0.25 MWe/mi2) Box Elder 154 38
Wasatch Front Valley Weber, Davis, Salt 1,329 50
SUBTOTAL (undiscovered) 1,413
TOTAL (identified + undiscovered) 2,166
* Recent announcement of 100 MWe project beginning with 32 MWe.

Utah Renewable Energy Zones Task Force Phase I Report: Renewable Energy Zone Resource Identification 29
Figure 15. Physiographic regions and significant geothermal areas in Utah. From north to south: CM – Crystal-Madsen, DA – Davis #1 well, UT – Utah Hot Springs, WS – Warm Springs Fault, CC – Corner Canyon, CB – Crystal-Bluffdale, MW – Midway, CS – Crater Springs, MH – Meadow-Hatton, MJ – Monroe-Joseph, RHS – Roosevelt Hot Springs, CFS – Cove Fort-Sulphurdale, THS – Thermo Hot Springs, NC – Newcastle. General outline of the Sevier thermal area is also shown.
Utah Geological Survey30
Magmatic-Hydrothermal System at Roosevelt Hot Springs
Hydrothermal convection systems are often generated by heat de-rived from one or more cooling bodies of intrusive rock (plutons) at depth. An example of an active magmatic system can be seen at Yellowstone National Park. There, numerous hydrothermal fea-tures result from large, shallow magma chambers emplaced about 630,000 years ago. Large, high-temperature hydrothermal con-vection systems have subsequently developed above the cooling plutons, manifesting in hot springs, fumaroles, and geysers. The relative northern latitude and high elevations of the Yellowstone Plateau region result in high amounts of precipitation and resulting high rates of meteoric recharge for the system. The Yellowstone caldera system is estimated to contain thermal energy equivalent to 36,100 exajoules or 34,216 quads (one exajoule equals 1018 joules; one quad equals 1015 BTUs). By comparison, the annual energy consumption in the U.S. is about 100 quads.
A smaller version of the Yellowstone magmatic system is present near the north end of the Mineral Mountains in eastern Beaver County. Studies identified an area of anomalous heat flow extend-ing about 3 miles wide and 12 miles long over the Roosevelt Hot Springs geothermal area. Heat-flow values in excess of 1000 mW/m2 enclose an area roughly 1.2 miles wide by 5 miles long that is thought to coincide with the near-surface part of the geothermal system. Becker and Blackwell (1993) also inferred a deep, cylin-drically shaped, anomalous mass approximately 6 to 9 miles in diameter situated about 3 miles beneath the geothermal field.
The Roosevelt Hot Springs area is the most studied geothermal area in Utah, and the only identified magmatic-driven hydrother-mal system in the state (figure 19). Temperatures within the geo-thermal reservoir sometimes exceed 260°C (500°F). Roosevelt Hot Springs was a small area of springs that used to discharge silica-rich, sodium-chloride thermal water. The springs were used by early settlers in the area for washing, bathing, stock watering, and swimming. The springs reportedly had surface discharge as late as 1957, but were dry by 1966. The spring area is now char-acterized by numerous fumaroles emitting sulfurous gas and water vapor. The first drilling into the geothermal system took place in 1967 with an 80-foot well. The well was plugged and abandoned after encountering hot water, and the rig was moved a short dis-tance east where another well was drilled to 165 ft, which encoun-tered hot water that flashed to steam. Federal leases were issued in 1974. Early reservoir models suggested that the field was capable of sustaining between 60 and 120 MW of electrical production. By 1979, eleven test wells had been completed, with six considered as capable for commercial fluid production. Production wells range in depth between 878 and 1631 m (2882 and 5350 ft) with tem-peratures ranging from 250° to 258°C (482° to 496°F).
Utah Power & Light Company and Phillips built the Blundell geo-thermal power plant with a gross capacity of about 26 MWe in 1984. In November 2007, PacifiCorp completed construction of
With the exception of the Roosevelt Hot Springs area, geothermal systems in the STA appear to be driven mostly by deep circulation of meteoric fluid. Most of the systems are adjacent to the west of the Basin and Range-Colorado Plateau transition zone, which is dominated by high mountain ranges and plateaus. The elevated re-gions in central Utah receive significantly more precipitation than the desert basins to the west. Active faults within the Intermoun-tain seismic belt provide conduits for deep circulation of snowmelt from the high mountains and plateaus. High regional heat flow en-hances the possibility of geothermal development.
Cove Fort-Sulphurdale Development
All of the surficial hydrothermal alterations in the Cove Fort-Sul-phurdale area (figure 16) are caused by discharges of steam and hydrogen sulfide that is oxidized to sulfuric acid; no evidence of hot water leaking to the surface has been found. The steam and gas reach the surface via fractures from the thermal water table located at a depth of about 400 m. A round of drilling was initiated in 1983. During the next few years, 10 new wells were drilled to tap the shallow steam zone encountered, though it was not possible to maintain steam pressures needed for the power plant. The power plant was in operation between 1985 and 2003, producing between 5 and 10 MWe. Figure 17 shows the location of the deep wells. Although those drilled north of the main well field encountered temperatures appropriate for electric generation, none produced commercial quantities of either steam or water. Wells drilled north of the east-west fault are colder than wells to the south. There are indicators that the drilled portion of the reservoir is part of a much larger thermal anomaly extending to the northwest. This region covers an area of more than 90 square miles with additional re-sources suggesting a presence to the west beneath the cover of volcanic rocks. Klein and others (2004) recently evaluated the re-source potential of the field; they estimated a reservoir volume of 3 cubic miles and assessed the field’s potential at 102 MWe.
Thermo Hot Springs Development
Thermo Hot Springs has near-boiling hot springs (89.5˚C [193˚F]) with temperatures near 200˚C (392˚F) predicted from geochemical thermometers. Spring activity is now greatly reduced. Hot spring and gradient data indicate the possibility of a high-quality geo-thermal resource at depth. A new well in 2007 reached a depth of about 305 m and geysered when opened; another, drilled to 457 m, recorded a temperature of 111oC and is capable of producing several hundred gallons per minute. In November 2007, Raser Technologies drilled the first of several deep wells approximately 2.4 km southeast of the southern hot spring mound in the vicinity of a large circular anomaly. The wells have confirmed the viability of the resource. The Thermo Hot Springs area is characterized by high thermal gradients greater than twice the regional background values. Raser Technologies recently concluded that the nearly 30,000 acres they leased is capable of producing 138 MWe. Figure 18 shows the Thermo Hot Springs geothermal area; locations of thermal wells, springs, and temperature-gradient boreholes; and the general outline of the thermal-gradient anomaly.
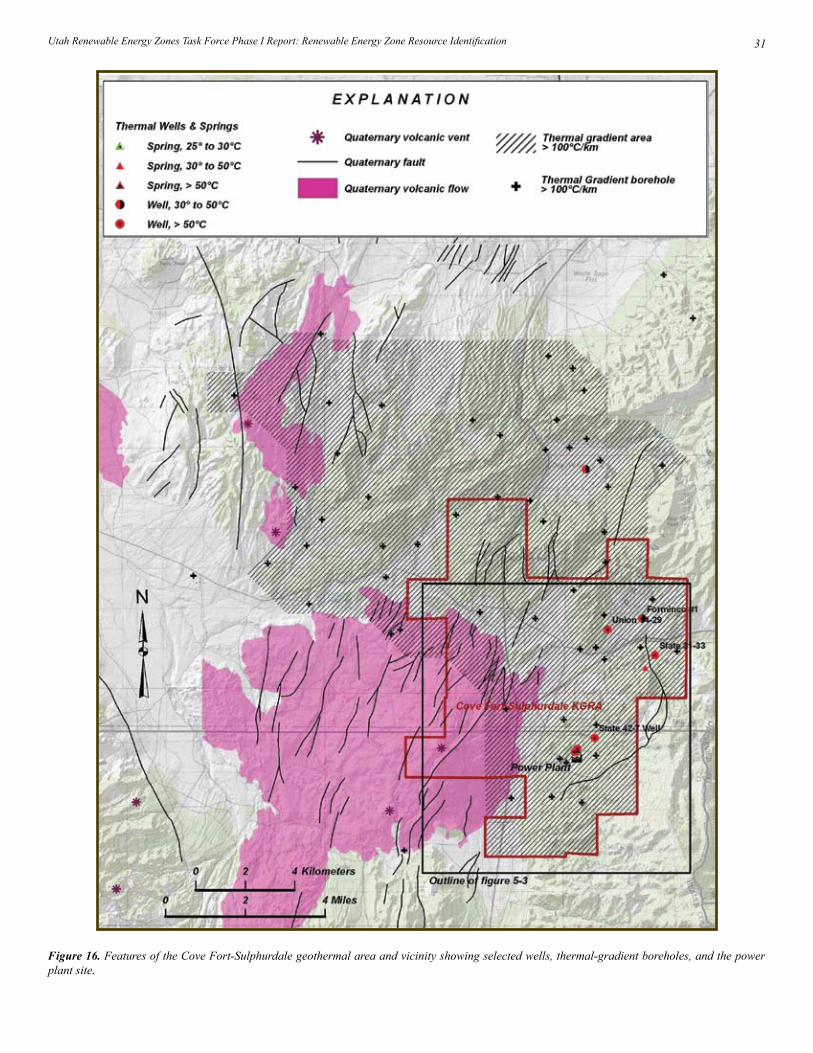
Utah Renewable Energy Zones Task Force Phase I Report: Renewable Energy Zone Resource Identification 31
Figure 16. Features of the Cove Fort-Sulphurdale geothermal area and vicinity showing selected wells, thermal-gradient boreholes, and the power plant site.

Utah Geological Survey32
Figure 17. The Cove Fort-Sulphurdale area showing geothermal wells, geophysical anomalies, and suspected faults. Maximum temperatures from wells are shown in degrees Celsius. Solid black lines denote locations of electrical resistivity profiles (arrows on two lines denote that those lines extend to the northwest).
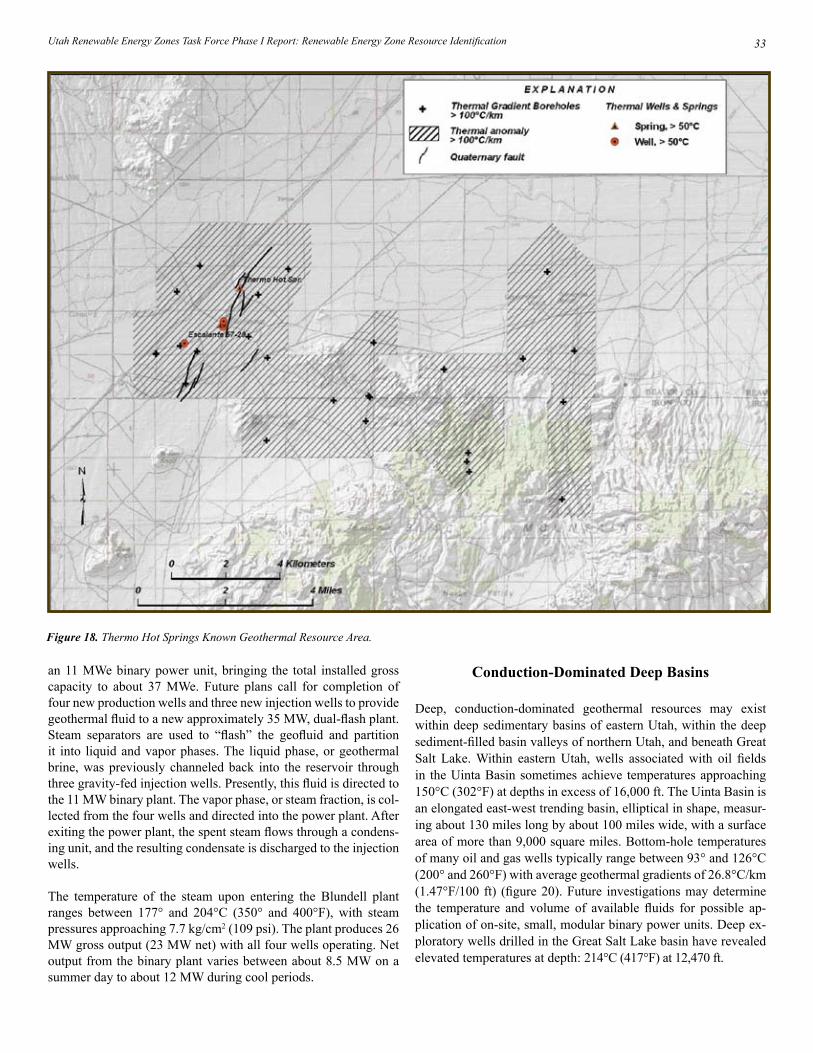
Utah Renewable Energy Zones Task Force Phase I Report: Renewable Energy Zone Resource Identification 33
an 11 MWe binary power unit, bringing the total installed gross capacity to about 37 MWe. Future plans call for completion of four new production wells and three new injection wells to provide geothermal fluid to a new approximately 35 MW, dual-flash plant. Steam separators are used to “flash” the geofluid and partition it into liquid and vapor phases. The liquid phase, or geothermal brine, was previously channeled back into the reservoir through three gravity-fed injection wells. Presently, this fluid is directed to the 11 MW binary plant. The vapor phase, or steam fraction, is col-lected from the four wells and directed into the power plant. After exiting the power plant, the spent steam flows through a condens-ing unit, and the resulting condensate is discharged to the injection wells.
The temperature of the steam upon entering the Blundell plant ranges between 177° and 204°C (350° and 400°F), with steam pressures approaching 7.7 kg/cm2 (109 psi). The plant produces 26 MW gross output (23 MW net) with all four wells operating. Net output from the binary plant varies between about 8.5 MW on a summer day to about 12 MW during cool periods.
Conduction-Dominated Deep Basins
Deep, conduction-dominated geothermal resources may exist within deep sedimentary basins of eastern Utah, within the deep sediment-filled basin valleys of northern Utah, and beneath Great Salt Lake. Within eastern Utah, wells associated with oil fields in the Uinta Basin sometimes achieve temperatures approaching 150°C (302°F) at depths in excess of 16,000 ft. The Uinta Basin is an elongated east-west trending basin, elliptical in shape, measur-ing about 130 miles long by about 100 miles wide, with a surface area of more than 9,000 square miles. Bottom-hole temperatures of many oil and gas wells typically range between 93° and 126°C (200° and 260°F) with average geothermal gradients of 26.8°C/km (1.47°F/100 ft) (figure 20). Future investigations may determine the temperature and volume of available fluids for possible ap-plication of on-site, small, modular binary power units. Deep ex-ploratory wells drilled in the Great Salt Lake basin have revealed elevated temperatures at depth: 214°C (417°F) at 12,470 ft.
Figure 18. Thermo Hot Springs Known Geothermal Resource Area.

Utah Geological Survey34
Figure 19. Geology and thermal features of the Roosevelt Hot Springs Known Geothermal Resource Area, Beaver County, Utah.

Utah Renewable Energy Zones Task Force Phase I Report: Renewable Energy Zone Resource Identification 35
Northern Wasatch Front Valleys
Many thermal springs are present along the Wasatch Front, from Utah Valley on the south to the state line on the north (figure 15). These systems are west of the Wasatch Range at the eastern edge of the Basin and Range Province and within the Wasatch fault zone. The thermal springs are considered to be the result of deep circula-tion of meteoric water, heated by the normal geothermal gradient of the Basin and Range Province.
The northern part of this region considered here is the Point-of-the-Mountain at the southern end of Salt Lake County near Crystal Hot Springs at Bluffdale, where geothermal water is used for space heating in commercial greenhouses and the Utah State Prison. The region extends northward to the Utah-Idaho border, bounded by the Wasatch Range to the east and the Oquirrh Mountains, Ante-lope Island, and the Promontory Mountains to the west. It includes the geothermal areas (south to north) of Crystal-Bluffdale, Corner Canyon, Warm Springs Fault, Hooper Hot Springs, Ogden Hot Springs, Utah Hot Springs, Lower Bear River area (Renaissance project), and Crystal Hot Springs. Geothermal water in these es-sentially unexplored systems may prove to be capable of support-ing power generation.
Enhanced Geothermal Systems (EGS)
In many parts of the country, rocks have temperatures suitable for electric generation but lack the permeability needed to support nat-ural convective (conventional hydrothermal) systems. These hot rocks represent an untapped, potentially enormous energy source that is readily accessible with today’s drilling techniques. Projects are currently underway in the U.S., France, and Australia to exploit these resources by hydraulically fracturing the rocks and extract-ing the heat from them. The concept is known as Enhanced (or Engineered) Geothermal System development (Geothermal Tech-nologies Program, 2008).
The development of an EGS reservoir is a multi-step process. An injection well is first drilled into hot rock. Water is then injected at sufficient pressure to create a fracture network by either opening existing fractures or creating new ones. Mapping the distribution of microearthquakes can monitor growth of the fractured volume. Once the newly created reservoir reaches adequate size, a produc-tion well is drilled to intersect the stimulated fracture system and extract the injected heated water. Additional injection and produc-tion wells can then be drilled to increase the volume of the reser-voir.
Figure 20. Uinta Basin oil and gas fields showing bottom-hole temperatures for wells contained in the Utah Division of Oil, Gas & Mining database. Field names are followed by the formation codes for the various reservoirs (Tgr – Green River Formation, Tw – Wasatch Formation, Kmv – Mesa Verde Group, Kmf – Ferron Sandstone).

Utah Geological Survey36
Tester and others (2006) estimated the quantity of thermal energy stored in the rocks at depth for each of the states as part of their national assessment of the EGS resource base. Temperatures were calculated at 1 km intervals from depths of 3 to 10 km and the mean value at each 0.5 km interval was used in the calculations. Temperatures calculated for the state of Utah within this depth in-terval range from 150o to 350oC. As expected the stored energy is enormous, totaling 612,202 exajoules for the entire depth interval. Even at 3.5 km, where temperatures are calculated to be 150oC, the stored thermal energy is estimated to be 10,371 exajoules. These calculations do not provide an indication of the power that can be generated, but they do suggest that temperatures appropriate for electric generation may be widely distributed across much of the state. The authors do not give estimates for EGS development since this type of resource is considered for long-term (>10 years) potential that will likely require a national effort to exploit deep hydro-fractured reservoirs.
Figure 21 illustrates the modeled temperatures at a depth of 3 km (1.9 mi) in Utah, from which three regions were identified having estimated temperatures of 150°C (302°F) or greater. These areas where yet-undiscovered geothermal resources will eventually be developed include: (1) southwestern Escalante Desert, (2) Sevier-Black Rock Desert, and (3) the northern Raft River Mountains (bright yellow zones in figure 21). A fourth region, encompassing valleys along the northern Wasatch Front, is also an area of undis-covered potential.
Assessment of the Electrical Potential of
Utah’s Geothermal Resources
The Geothermal Work Group’s second objective was to assess the electrical potential of Utah’s described systems. The described systems include the Sevier Thermal Area (Cove Fort-Sulphurdale, Roosevelt Hot Springs, Thermo Hot Springs), the western Utah valleys, the Wasatch Front and adjacent regions, and co-produced hot water from oil wells in the Uinta Basin.
Assessment of a geothermal resource requires an estimate of (1) reservoir volume, (2) reservoir temperature, (3) porosity, and (4) sweep efficiency. These values may vary significantly from field to field and even within a field. Each parameter may be represented by a range of values. Reservoir volume refers to the volume of the rock mass and fluid of the geothermal system at temperatures generally approaching 150°C (302°F) or greater. Reservoir tem-perature refers to the average temperature contained within the de-fined geothermal reservoir volume. Porosity refers to the percent-age of interconnected pore spaces with respect to overall reservoir volume (usually between 3 and 7 percent for Paleozoic carbonate rocks of western Utah). Sweep efficiency is a dimensionless reser-voir engineering concept that refers to the ability of the reservoir fractures and pore spaces to facilitate mass transfer of heat through fluid flow.
Unlike wind or solar energy, there are no surficial measurements to assess geothermal resource potential. Multiple well data and
testing are needed to estimate reservoir potential with confidence. Sanyal and others (2004), Klein and others (2004), and Blackett and others (2004) discuss the various uncertainties in developing these estimates. Geothermal power plants are currently operat-ing in Alaska, California, Hawaii, Idaho, Nevada, and Utah. Wil-liams and others (2008) summarized a national reassessment of the geothermal resources of the United States. The assessment, which evaluated identified geothermal systems and estimated un-discovered resources, concluded that the electric power genera-tion potential from identified geothermal systems is 9,057 MWe, distributed over 13 states. The mean estimated power production potential from undiscovered geothermal resources is 30,033 MWe. Additionally, another estimated 517,800 MWe could be generated through implementation of EGS technology. For Utah, the assess-ment indicates the electric power generation potential from identi-fied geothermal systems is 184 MWe, from undiscovered systems is 1,464 MWe, and from EGS is 47,200 MWe.
Blackett and Wakefield (2004) compiled available information on individual geothermal systems within Utah into a comprehensive geothermal database that includes (1) the locations of hot springs, (2) locations and depths of wells that encountered thermal water, (3) chemical analyses of the waters,( 4) calculated geothermom-eter temperatures, and (5) temperature gradient data. Blackett and others (2004) summarize data from the most promising geother-mal systems. Fleischmann (2006) addresses the institutional and infrastructure requirements for developing these same areas.
The volume of the resource is a critical parameter. Typically, ther-mal gradient data are utilized to establish the reservoir boundaries in order to constrain the aerial extent of the resource. Background thermal gradients in the Basin and Range are on the order of 30-40oC/km and this value is appropriate for the western half of Utah. Because about one-half of the thermal gradient wells drilled in the state are less than a hundred meters deep, the authors have taken a relatively conservative and practical approach to delineating the resource boundaries and calculating reservoir volumes. Analysis of mostly near-surface (<150 m [492 ft]) temperature-gradient data from the Cove Fort-Sulphurdale and Thermo Hot Spring geother-mal systems indicates that wells having temperatures appropriate for electric generation at moderate depths lie within areas where thermal gradients exceed 100oC/km and frequently 150oC/km. For this assessment, the authors have used the value of 100oC/km to outline the resource boundaries. The reservoir volume is strongly dependent on the thickness of the production zone. The authors have assumed the production zone to be 915 m (3000 ft) thick.
Table 12 presents various Utah geothermal areas having possible development potential and compares some resource parameters between areas. These estimates were based on a combination of published resource assessments (column D) for some areas and projections for other areas having thermal gradients of 100°C/km or greater. A number of parameter values are missing; therefore, it was necessary to create criteria for evaluating geothermal areas that lack deep drilling data. For explored areas with temperature-gradient data, published estimates of resource potential for the given resource area were used and the evaluated area was subtract-

Utah Renewable Energy Zones Task Force Phase I Report: Renewable Energy Zone Resource Identification 37
Figure 21. Temperatures at a depth of 3 kilometers (1.9 miles) within the earth (Tester and others, 2006).

Utah Geological Survey38
ed from the 100°C/km anomaly. This remaining area was assigned a resource potential of 2 megawatts per square mile and the result is listed in column E of table 12. These areas include Roosevelt, Cove Fort-Sulphurdale, Thermo, Newcastle, and Beryl.
For less-studied geothermal areas within the Sevier thermal area, MWe potential ranging from 2 to 10 MWe was assigned based upon geological setting and perceived size of the thermal anomaly (column E). These systems are the Crater Springs, Drum Moun-tain-Whirlwind Valley, Meadow-Hatton, Monroe-Red Hill, and Joseph geothermal areas. For the northern Wasatch Front geother-mal areas, the authors used the following set of criteria for indi-vidual geothermal systems:
Estimated resource temperatures between 100° and • 125°C – 2 MWe
Estimated resource temperatures between 125° and • 150°C – 5 MWe
Estimated resource temperatures over 150°C – 10 • MWe
The category of “Deep Conductive Resources” presently includes the potential for co-produced fluids from oil or gas wells in the Uinta Basin, primarily Altamont-Bluebell field. The authors have also included the Renaissance geothermal project, near Brigham City, in this category. The authors have made no assignment of electrical potential to the Altamont-Bluebell area because it is likely that electrical energy from co-produced fluids using modu-lar binary units here would be used on-site. For the Renaissance project, the authors initially assigned a potential of 20 MWe, after published data. Recent news releases indicate that developers in-tend to install wells, construct a 32 MWe facility here by 2010, and increase output incrementally to 100 MWe.
For the category of “Undiscovered” the authors applied the fol-lowing assumptions based upon a GIS estimate of the area includ-ed within unexplored geothermal regions with little or no surface manifestations:
Southwest Escalante Desert – 0.25 MWe per square • mile for undiscovered resources
Sevier-Black Rock Desert – 0.25 MWe per square mile • for undiscovered resources
Raft River North - 0.25 MWe per square mile for • undiscovered resources
Northern Wasatch Front – arbitrarily assigned 50 MWe • for undiscovered resources.
Summary of Analysis
This assessment indicates that Utah’s identified higher quality geothermal resources lie within a 50-mile-wide corridor along the eastern margin of the Basin and Range Province which parallels Interstate 15 (figure 22). Geothermal power-generation projects are underway in south-central and southwestern Utah. Another
project prepares to get underway along the northern Wasatch Front in Box Elder County. From this analysis, the estimated potential for electric generation from identified and undiscovered conven-tional (hydrothermal) geothermal systems is approximately 2,166 MWe. The estimate of the USGS (Williams and others, 2008) of roughly 1,648 MWe for both identified and undiscovered resourc-es at the mean confidence level is approximately 30 percent lower. However, the USGS (Williams and others, 2008) also estimates the electric generation potential of Enhanced Geothermal Systems to be tens of thousands of MWe. These resources are located along the I-15 corridor beneath those regions recognized for near-term development.
PHASE I CONCLUSIONS
The findings from this study are two-fold: Utah’s theoretical poten-tial for renewable energy generation is apparently great (figure 23), but development of these resources is constrained due to limited data and a multitude of factors that are identified below. Phase I identified renewable energy zones that total approximately 13,262 square miles and an estimated 837 gigawatts of electrical generat-ing capacity. The multitude of factors that could not be taken into account at this point of the assessment include project-level re-source data; land use and environmental restrictions; federal, state, and local regulatory policies; and economic considerations that may complicate or restrict development.
Although most counties have some solar, wind, or geothermal en-ergy, significant quantities of all three resources were found co-lo-cated in southwest Utah. In addition, large concentrations of wind resources were identified along the Utah and Wyoming border.
The scope of work for Phase I of the UREZ process was not to assess the development potential from an economic perspective. Rather, analogous to estimating resources and reserves in the oil and gas industry, this project’s scope of work was to identify the potential resources, within reason, for short-term (~<10 years) and long-term (~>10 years) potential. Predicting what will be econom-ically viable in the future is difficult, if not impossible, but will be assessed in future phases of UREZ research. Similar to estimating conventional natural resource reserves, the quantity is a constantly changing value. More importantly, this macro-level assessment will identify likely areas of multiple resource zones that may have utility-scale generation potential.
The value of Phase I is establishing a baseline estimate of the lo-cation of renewable resources and their theoretical electrical gen-eration potential. This assessment also frames a starting point at which a dialogue can begin among stakeholders to understand the complexity of developing renewable energy on a large scale. Becoming familiar with the complexity of the issues (e.g., qual-ity of the resource and environmental, economic, regulatory, and technical constraints) will lead to a better understanding of major issues that will undoubtedly need to be addressed in Phase II and beyond.

Utah Renewable Energy Zones Task Force Phase I Report: Renewable Energy Zone Resource Identification 39
Figure 22. Identified Utah geothermal energy zones. An interactive version of this map is available online at http://mapserv.utah.gov/urez.

Utah Geological Survey40
Figure 23. Overlay of identified solar, wind, and geothermal REZs. Existing transmission is superimposed on this figure for reference. Available capacity on the referenced transmission line was not documented in this report. An interactive version of this map is available online at http://mapserv.utah.gov/urez.

Utah Renewable Energy Zones Task Force Phase I Report: Renewable Energy Zone Resource Identification 41
NEXT STEPS
Having identified renewable energy zones that have a theoretical potential for utility-scale development in Utah, Phase II will focus on and critically analyze the other factors such as:
transmission, regulation, access, cost, and development • (barriers and opportunities);
other related local, state, and federal regulatory issues;•
resource and technology viability given current and • future market trends;
land use and/or environmental issues not identified in • Phase I.
The results from Phase II and beyond will serve as a screening tool to further refine the zone identification process, and thus eliminate additional areas among the REZs identified in Phase I. This refine-ment process is a logical method that will eventually lead to iden-tifying and estimating zones in Utah having the greatest potential for utility-scale renewable energy development.
REFERENCES
Austin, C.F., Austin, R.R., and Erskine, M.C., 2006, Renaissance – a geothermal resource in northern Utah: Geothermal Re-sources Council Transactions, v. 30 p. 853-857.
Becker, D.J., and Blackwell, D.D., 1993, A hydrothermal model of the Roosevelt Hot Springs Area, Utah, USA: Proceedings of the 15th New Zealand Workshop, v. 15,. P. 247-252.
Blackett, R.E., Sowards, G.M., and Trimmer, E., 2004, High tem-perature geothermal resources of Utah – analysis of selected sites, in Blackett, R.E., and Wakefield, S., Geothermal re-sources of Utah - 2004: Utah Geological Survey Open-File Report 431 DM, 68 p.
Blackett, R.E., and Wakefield, Sharon, 2004, Geothermal resourc-es of Utah – 2004: Utah Geological Survey Open-File Report 431 DM, compact disk.
Cook, K.L., Adhidjaja, J.I., and Gabbert, S.C., 1981, Complete Bouguer gravity anomaly and generalized geology map of Richfield 1 x 2 degree quadrangle, Utah: Utah Geological and Mineral Survey Map 59, scale 1:250,000.
Energy Information Administration, 2008, Renewable energy con-sumption and electricity preliminary 2007 statistics: Online, U.S. Department of Energy, <www.eia.doe.gov/cneaf/alter-nate/page/renew_energy_consumpt/rea_prereport.html>.
Fleischmann, D.J., 2006, Geothermal development needs in Utah: Geothermal Energy Association Publication, 29 p.
Forrest, R.J., 1994, Geothermal development at Roosevelt Hot Springs geothermal area Beaver County, Utah 1972 – 1993,
in Blackett, R.E., and Moore, J.N., editors, 1994, Cenozoic geology and geothermal systems of southwestern Utah: Utah Geological Association Publication 23, p. 37 – 44.
Geonomics, Inc., 1977, A telluric-magnetotelluric survey of the Thermo Hot Springs area, Utah: unpublished report prepared for Republic Geothermal Inc., 22 p., various maps, illustra-tions.
Geothermal Technologies Program, 2008, Information resources: Online, U.S. Department of Energy, <www1.eere.energy.gov/geothermal/egs_animation_text.html>.
Hintze, L.F., 1988, Geologic history of Utah: Brigham Young Uni-versity Geology Studies Special Publication 7, 202 p.
Huttrer, G. W., 1994, Geothermal exploration at Cove Fort-Sul-phurdale, Utah, 1972-1992, in Blackett, R.E., and Moore, J.N., editors, Cenozoic Geology and Geothermal Systems of Southwestern Utah: Utah Geological Association, Publication 23, pp. 61-68.
Klauk, R.H., and Gourley, C., 1983, Geothermal assessment of a portion of the Escalante Valley, Utah: Utah Geological and Mineral Survey Special Studies 63, 57 p.
Klein, C.W., Lovekin, J.W., and Sanyal, S.K., 2004, New geother-mal site identification and qualification: California Energy Commission consultant report P500-04-051, 264 p.
Lipman, P.W., Rowley, P.D., Mehnert, H.H., Evans, S.H., Jr., Nash, W.P., Brown, F.H., Izett, G.A., Naeser, C.W., and Friedman, I., 1978, Pleistocene rhyolite of the Mineral Mountains, Utah—geothermal and archeological significance: Journal of Re-search of the U.S. Geological Survey, v. 6, p. 133-147.
Mabey, D.R., and Budding, K.E., 1987, High-temperature geother-mal resources of Utah: Utah Geological and Mineral Survey Special Studies 123, 64 p.
Mariner, R.H., Brook, C.A., Swanson, J.R., and Mabey, D.R., 1978, Selected data for hydrothermal convection systems in the United States with estimated temperatures greater than or equal to 90 degrees C—back-up data for U.S. Geological Sur-vey Circular 790: U.S. Geological Survey Open File Report 78-858, 493 p.
Mariner, R.H., Brook, C.A., Swanson, J.R., and Mabey, D.R., 1978, Selected data for hydrothermal convection systems in the United States with estimated temperatures greater than or equal to 90°C: U.S. Geological Survey Open-File Report 78-858, 493 p.
Muffler, L.J.P., 1979, Assessment of geothermal resources of the United States – 1978: U.S. Geological Survey Circular 790, 163 p.
Mundorff, J.C., 1970, Major thermal springs of Utah: Utah Geo-logical and Mineral Survey Water Resources Bulletin 13, 60 p.

Utah Geological Survey42
Price, D.E., and Bartley, J., 1990, Low- and high-angle faulting, southern Mineral Mountains, southwestern Utah [abs.]: Geo-logical Society of America Abstracts, 1990 Cordilleran Sec-tion meeting, Tucson, Arizona, p. 76.
Republic Geothermal, Inc. unpublished memorandums dated June 30, 1976 and June 18, 1976.
Ross, H.P., Blackett, R.E., and Shubat, M.A., 1991, Exploring for concealed hydrothermal resources using the self-poten-tial method, Escalante Desert, Utah: Geothermal Resources Council Transactions, v. 15, p. 279-287.
Ross, H.P., and Moore, J.N., 1985, Geophysical investigations of the Cove Fort-Sulphurdale geothermal system, Utah: Geo-physics, v. 50, no. 11, p. 1732-1745.
Ross, H.P., Nielson, D.L., and Moore, J.N., 1982, Roosevelt Hot Springs geothermal system, Utah - case study: American As-sociation of Petroleum Geologists Bulletin, v. 66, no. 7, p. 879-902.
Rowley, P. D., 1979, Geologic map of the Thermo 15-minute quad-range, Beaver and Iron Counties, Utah, U. S Geol. Survey, Map GQ-1493, 1:62,500.
Rowley, P. D., Lipman, P.W., Mehnert, H.H., Lindsey, D. A., and Anderson, J.J., 1978, Blue Ribbon Lineament, an east-trend-ing structural zone within the Pioche Mineral Belt of south-western Utah and eastern Nevada, Journal of Research of the U. S. Geolgical Survey, v. 6, no. 2, pp 175-192.
Rush, F.E., 1983, Reconnaissance of the hydrothermal resources of Utah: U.S. Geological Survey Professional Paper 1044-H, p. H1-H49.
Sanyal, S., Klein, C.W., Lovekin, J.W., and Henneburger, R.C., 2004, National assessment of geothermal resources – a per-spective: Geothermal Resources Council, v. 28, p. 355-362.
Sawyer, R.F., and Cook, K.L, 1977, Gravity and ground magnetic surveys of the Thermo Hot Springs KGRA region, Beaver County, Utah: University of Utah, Department of Geology and Geophysics Technical Report, v. 77-6, 42 p.
Sibbett, B.S., and Nielson, D.L., 1980, Geology of the central Min-eral Mountains, Beaver County, Utah: University of Utah Re-search Institute, Earth Science Laboratory Report 33, 42 p.
Smith, R.B., and Sbar, M.L., 1974, Contemporary tectonics and
seismicity of the western states with an emphasis on the In-termountain seismic belt: Geological Society of America Bul-letin, v.85, p.1205-1218.
Smith, R.L., and Shaw, H.R., 1979, Igneous-related geothermal systems, in Muffler, L.J.P. editor, Assessment of geothermal resources of the United States: U.S. Geological Survey Circu-lar 790, p. 12-17.
Tester, J.W., Anderson, B.J., Batchelor, A.S., Blackwell, D.D., DiP-ippo, R., Drake, E.M., Garnish, J., Livesay, B., Moore, M.C., Nichols, K., Petty, S., Toksöz, M.N., and Veatch, R.W., Jr., 2006, The future of geothermal energy—impact of enhanced geothermal systems (EGS) on the United States in the 21st century: Massachusetts Institute of Technology report INL/EXT-06-13438-6 prepared for U.S. DOE/ID Contract DE-AC07-05ID14517, 359 p.
Utah Geological and Mineral Survey, 1980, Geothermal resources of Utah: National Oceanic and Atmospheric Administration map, scale – 1:500,000.
Utah Geological Survey, 2008a, Utah energy and mineral statistics, chapter 1—overview of U.S. and Utah energy trends: Online, <geology.utah.gov/emp/energydata/overviewdata.htm>.
Utah Geological Survey, 2008b, Utah energy and mineral statis-tics, chapter 5—elecriticy: Online, <geology.utah.gov/emp/energydata/elecriticydata.htm>.
Ward, S.H., Parry, W.T., Nash, W.P., Sill, W.R., Cook, K.L., Smith, R.B., Chapman, D.S., Brown, F.H., Whelan, J.A., and Bow-man, J.R., 1978, A summary of the geology, geochemistry, and geophysics of the Roosevelt Hot Springs thermal area, Utah: Geophysics, v. 43, no. 7, p. 1515
Williams, C.F., Reed, M.J., Mariner, R.H., DeAngelo, J., and Galanis, S.P., Jr., 2008, Assessment of moderate- and high-temperature geothermal resources of the United States: U.S. Geological Survey fact sheet 2008-3082, 4 p. http://pubs.usgs.gov/of/2008/1296/
Wilson, W.R., and Chapman, D.S., 1980, Thermal studies at Roosevelt Hot Springs, Utah: University of Utah, Department of Geology and Geophysics, Report 19, 144 p.
Wiser, R., and Barbose, G., 2008, Renewable portfolio standards in the United States—A status report with data through 2007: Lawrence Berkeley National Laboratory.

Utah Renewable Energy Zones Task Force Phase I Report: Renewable Energy Zone Resource Identification 43
APPENDICES

Utah Geological Survey44

Utah Renewable Energy Zones Task Force Phase I Report: Renewable Energy Zone Resource Identification 45
1 These maps are available at http://www.nrel.gov/csp/maps.html.
APPENDIX A.
NREL TOOLS FOR ASSESSING SOLAR POWER POTENTIAL
NREL has developed two publicly available tools to help officials, utility planners, and the general public to evaluate the solar power potential of specific locations. The Solar Power Prospector is an interactive, Internet-based geographic information system tool that allows the user to zoom to a specific location and download solar data for that specific site. The Solar Advisor Model allows the user to estimate what the levelized cost of energy would be at that site, using a solar technology and financial assumptions chosen by the user.
SOLAR POWER PROSPECTOR
NREL has developed an interactive mapping tool to support the U.S. Department of Energy’s goal to install 1,000 megawatts (MW) of new concentrating solar power systems in the southwestern United States by 2010. The Solar Power Prospector uses the same DNI data used to generate state maps of solar potential throughout the Southwest.1
The Solar Power Prospector uses an Internet-based mapping interface that enables the user to zoom into specific areas of interest. The underlying data layer shows average annual DNI for all areas of the continental United States. The tool also filters DNI based on the slope of the terrain. The user can also screen out areas that are less than the DNI threshold indicated by the user.
Additional layers show federal land ownership (including military lands, national forests, and lands managed by the U.S. Fish and Wildlife Service), lakes, highways, and urban areas.
Once the user has identified a specific site of interest, the raw DNI data for that point may be downloaded into a separate file for further analysis, either in normal .csv format or in .tmy format. The latter is the format used by the Solar Advisor Model described in the next section. The data file contains hourly observations for the entire year (any year from 1998 through 2005, or averaged into a typical meteorological year).
The Solar Power Prospector is on the Internet at http://mercator.nrel.gov/csp/.
SOLAR ADVISOR MODEL
NREL, in conjunction with Sandia National Laboratory and in partnership with the U.S. Department of Energy (DOE) Solar Energy Technologies Program (SETP), developed the Solar Advisor Model (SAM) in 2006. SAM operates on any Windows-based personal computer; the user-friendly software and documentation may be downloaded without charge.
Annual DNI information obtained from the Solar Power Prospector may be added to the SAM data files, enabling detailed scenario testing for any site selected by the user. SAM evaluates several types of financing (from residential to utility-scale) and a variety of technology-specific cost models. The technologies currently represented in SAM include CSP parabolic trough systems and PV flat plate and concentrating technologies. Other technologies to be added include dish/Stirling, power towers, and solar heating (primarily solar residential hot water).
SAM promotes the use of a consistent methodology for analysis across all solar technologies, including financing and cost assumptions. It allows users to investigate the impact of variations in physical, cost, and financial parameters to better understand their impact on key figures of merit. Figures of merit related to the cost and performance of these systems include, among other measures:
system output,•
peak and annual system efficiency,•
levelized cost of electricity,•
system capital and operating and maintenance costs, and•
hourly system production.•

Utah Geological Survey46
SAM uses a systems-driven approach to establish the connection between market requirements and targeted efforts in research and de-velopment. The comprehensive output of each scenario modeled in SAM shows a breakdown of all the factors contributing to overall project cost, thereby showing where the greatest benefits from efficiency improvements may lie. Similarly, SAM’s scenario testing capa-bilities can quantify the impact of various incentives and policies, such as state investment tax credits and property tax abatements.
The software, documentation, and background papers are available for public download at https://www.nrel.gov/analysis/sam/.
Figure A-1. Solar Power Prospector Web interface.

Utah Renewable Energy Zones Task Force Phase I Report: Renewable Energy Zone Resource Identification 47
APPENDIX B.
WIND-RELATED DEFINITIONS
Some explanatory comments about certain items in the bullet list on page 20 are discussed below.
Coordinates. There were many cases with slight discrepancy between the coordinates in the USEP web site and those provided in a separate Excel file by USEP. We were able to resolve most of these discrepancies within an acceptable level of tolerance.
Annual Mean Wind Speeds. These were obtained from the procedure described earlier in this report. USEP data are reported in miles/hour, and these were converted to meters/second (1 mps = 2.2 mph).
Topographic Exposure. Sites were assigned as high mountain, high plateau, low ridge or gap, drainage canyons, or open valley sites. Specific comments about each site were made to allow the author to determine the site designation, and how winds might be expected to vary in the local region.
Estimated Wind Shear Exponent. In nearly all cases, winds increase with height. Thus the average speeds at 80 m above ground (selected as the basis for this study) will be higher than those recorded at the 20-m or 50-m levels of the USEP stations. The formula to adjust wind speeds to the 80-m height is as follows:
V2 / V
1 = (z
2 /z
1 )α where V stands for the average speed at heights 2 and 1, and z stands for the heights, and alpha is the power law
exponent.
The typical wind shear exponent in flat areas west of the Rocky Mountains with no surface obstructions is about 0.14. The exponent tends to be higher with terrain sheltering and/or surface obstructions. Well-exposed ridgelines and other high areas tend to have shears less than 0.10. The higher the shear exponent, the greater the winds increase with height.
Wind shear exponents for the USEP stations were estimated on the basis of terrain, surface roughness, similarities to known shear values (from private data across the state), and the author’s 31 years experience in the industry.
Estimated 80-m Mean Annual Wind Speed. Obtained from the formula above.
Air Density. The wind resource is a function of wind speed and air density. The standard air density at sea level is 1.225 kg/m³. All sta-tions in Utah are at least 3000 feet above sea level, so the following process was used to determine air density across the state.Annual mean air densities were computed for four stations in the region: Salt Lake City, Elko, Ely, and Grand Junction. They were then adjusted to target elevations of 4000-9000 feet in 1000-ft increments:
Elevation (feet) Air Density (kg/m³)
4000 1.07
5000 1.04
6000 1.01
7000 0.98
8000 0.95
9000 0.92
Table B-1. Air density estimates for Utah.
For a given station, annual air density was determined based on interpolated values from the table above. The 80-m (262-ft) hub height was included in this calculation.
Power Density. For all UGS stations, we computed their power density. The formula for power density is:
P = ½ ρ V³ where P is power (watts/square meter), ρ is the air density, and V is the speed (meters/second).

Utah Geological Survey48
Annual power density is computed from the integral of the 8760 hourly power density calculations across the year. Due to budget limi-tations, no such computations were made directly from the UGS station data. Instead, we used data from private stations with permis-sion.
To simplify the process, actual power density calculations were made using a base elevation of 6000 feet and air density of 1.01 kg/m³. These calculations were made from eight representative stations across the state with a range of wind regimes. Here are the resulting annual power densities as a function of annual mean wind speed (in meters per second):
Table B-3. Wind class.
Wind Class Power Density (W/m2)
1 0-200
2 200-300
3 300-400
4 400-500
5 500-600
6 600-800
7 800+
The power density for a given site was then obtained from its mean wind speed and exposure type, using interpolation from the above table and then adjusted for site-specific air density.
Wind Class. Wind classification was created to simplify the power of wind. A wind class is simply the range of wind power density of the wind. For example, a site with a wind power density between 200 and 300 is class 2, a site in the 300 range is class 3, and so on. Wind classes are defined in the following table:
Table B-2. Estimated power densities (in watts per square meter) for Utah.
Exposure 5 mps 6 mps 7 mps 8 mps 9 mps
High mountain 134.6 227.5 358.6 521.7 703.1
High plateau 138.2 231.9 362.8 522.4 708.9
Low ridge, gap 137.4 231.8 354.7 494.3
Drainage canyon 156.4 262.2 417.6 611.8 874.0
Open valley 169.5 288.2 435.8 600.6
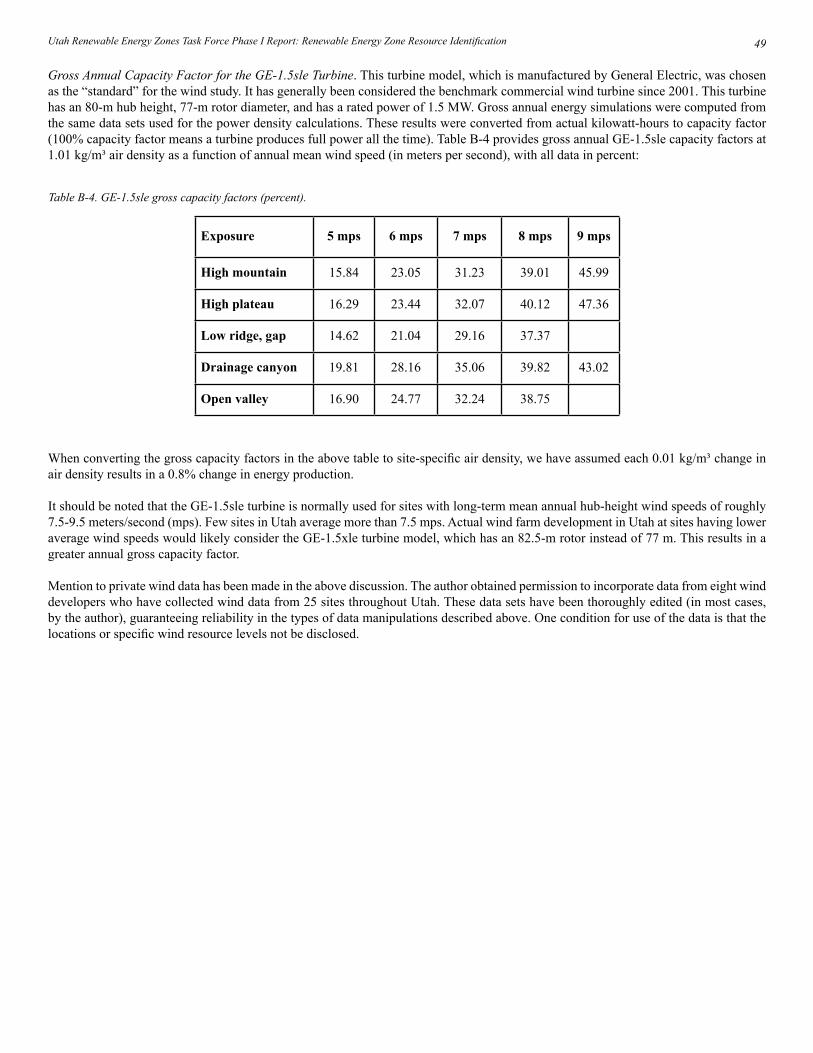
Utah Renewable Energy Zones Task Force Phase I Report: Renewable Energy Zone Resource Identification 49
Gross Annual Capacity Factor for the GE-1.5sle Turbine. This turbine model, which is manufactured by General Electric, was chosen as the “standard” for the wind study. It has generally been considered the benchmark commercial wind turbine since 2001. This turbine has an 80-m hub height, 77-m rotor diameter, and has a rated power of 1.5 MW. Gross annual energy simulations were computed from the same data sets used for the power density calculations. These results were converted from actual kilowatt-hours to capacity factor (100% capacity factor means a turbine produces full power all the time). Table B-4 provides gross annual GE-1.5sle capacity factors at 1.01 kg/m³ air density as a function of annual mean wind speed (in meters per second), with all data in percent:
When converting the gross capacity factors in the above table to site-specific air density, we have assumed each 0.01 kg/m³ change in air density results in a 0.8% change in energy production.
It should be noted that the GE-1.5sle turbine is normally used for sites with long-term mean annual hub-height wind speeds of roughly 7.5-9.5 meters/second (mps). Few sites in Utah average more than 7.5 mps. Actual wind farm development in Utah at sites having lower average wind speeds would likely consider the GE-1.5xle turbine model, which has an 82.5-m rotor instead of 77 m. This results in a greater annual gross capacity factor.
Mention to private wind data has been made in the above discussion. The author obtained permission to incorporate data from eight wind developers who have collected wind data from 25 sites throughout Utah. These data sets have been thoroughly edited (in most cases, by the author), guaranteeing reliability in the types of data manipulations described above. One condition for use of the data is that the locations or specific wind resource levels not be disclosed.
Table B-4. GE-1.5sle gross capacity factors (percent).
Exposure 5 mps 6 mps 7 mps 8 mps 9 mps
High mountain 15.84 23.05 31.23 39.01 45.99
High plateau 16.29 23.44 32.07 40.12 47.36
Low ridge, gap 14.62 21.04 29.16 37.37
Drainage canyon 19.81 28.16 35.06 39.82 43.02
Open valley 16.90 24.77 32.24 38.75
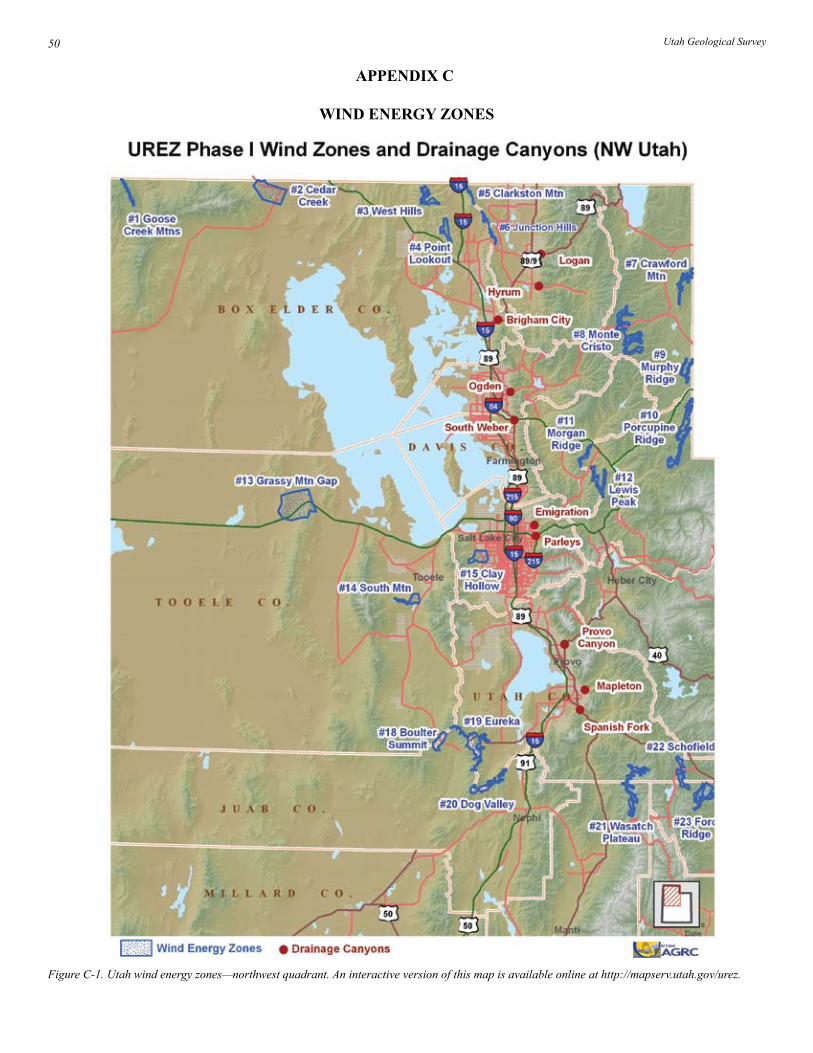
Utah Geological Survey50
Figure C-1. Utah wind energy zones—northwest quadrant. An interactive version of this map is available online at http://mapserv.utah.gov/urez.
APPENDIX C.
WIND ENERGY ZONES
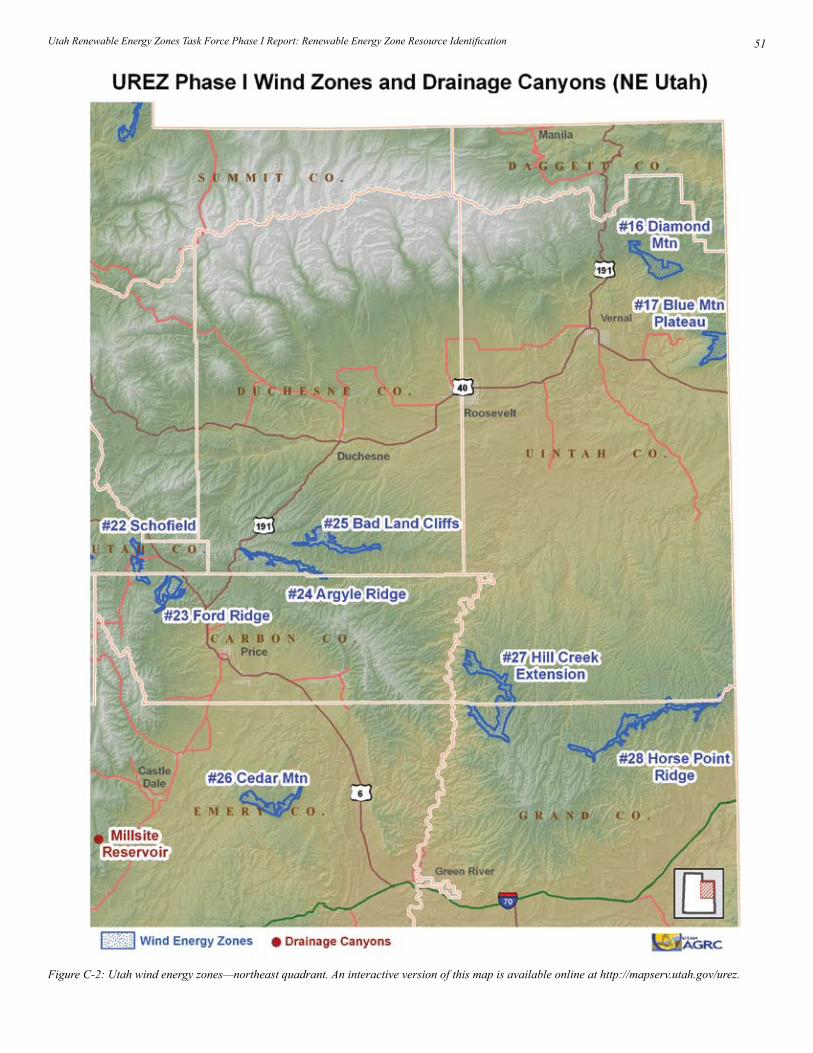
Utah Renewable Energy Zones Task Force Phase I Report: Renewable Energy Zone Resource Identification 51
Figure C-2: Utah wind energy zones—northeast quadrant. An interactive version of this map is available online at http://mapserv.utah.gov/urez.
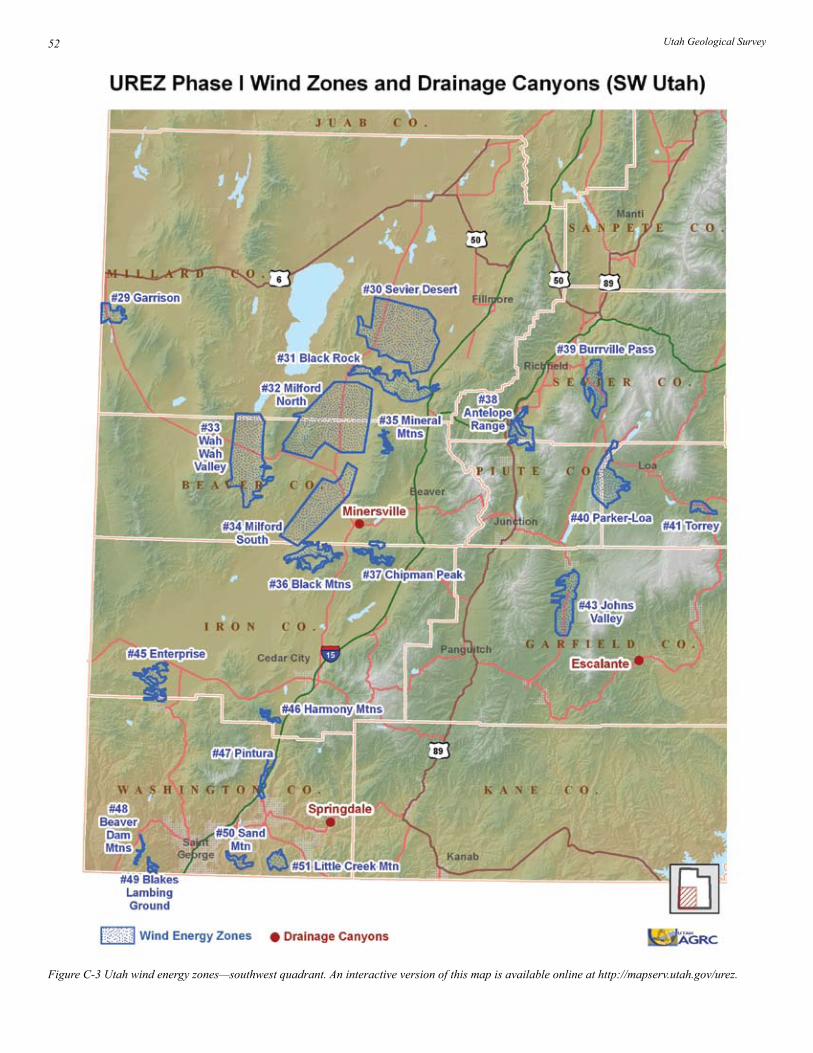
Utah Geological Survey52
Figure C-3 Utah wind energy zones—southwest quadrant. An interactive version of this map is available online at http://mapserv.utah.gov/urez.

Utah Renewable Energy Zones Task Force Phase I Report: Renewable Energy Zone Resource Identification 53
Figure C-4. Utah wind energy zones—southeast quadrant. An interactive version of this map is available online at http://mapserv.utah.gov/urez.

Utah Geological Survey54
APPENDIX D.
USEP WIND SITES BY GEOGRAPHYThe following 13 sites are located on high mountains.
Site Name CountySoldier Summit Utah
Traverse Mtn. Utah
Manti-II Sanpete
Porcupine Ridge Summit
Monte Cristo Rich
Diamond Mtn. Uintah
Big Mountain Morgan
Stag Canyon Summit
Coyote Canyon Duchesne
Laketown Rich
Crawford Rich
Cricket-I Millard
Home Ranch Rich
The following 39 sites are located in valleys.
Site Name CountyCastle Valley GrandDiamond Valley WashingtonBeryl IronHexcel Salt LakeBicknell WayneUtah Lake UtahWashington Co. Prison WashingtonPelican Lake UintahHurricane-I WashingtonCallao JuabRichfield SevierSimpson Springs-I JuabKingston PiuteMountain Lake WasatchSnowville Box ElderMinersville BeaverCollinston Box ElderMoroni SanpeteGreenwich PiuteMonroe SevierGarrison-I MillardAlton KaneWECCO-I IronFruitland DuchesneTooele TooeleCedar Ridge Coop Box ElderYuba SanpeteGarrison-II MillardTorrey WayneWanship SummitRaft River-I Box ElderSummit IronBlanding San JuanHurricane-II WashingtonWECCO-II IronGarrison-I MillardRaft River-II Box ElderMilford BeaverWah Wah Valley Millard
The following 13 sites are located in canyons.
Site Name CountyLogan Cache
Hyrum Cache
Brigham City Box Elder
Ogden Weber
South Weber Weber/Davis
Emigration Salt Lake
Parleys Salt Lake
Provo Canyon Utah
Spanish Fork Utah
Millsite Reservoir Emery
Minersville Beaver
Escalante Garfield
Springdale Washington
The following 5 sites are located on high plateaus.
Site Name County
Monticello-I San Juan
Pleasant View Weber
Monticello-II San Juan
Cedar City Iron
Kanarraville Iron

Utah Renewable Energy Zones Task Force Phase I Report: Renewable Energy Zone Resource Identification 55
The following 21 sites are located on low ridges.
Site Name County
Silver Creek Cache
Manti-I Sanpete
Elmo Emery
Duchesne Duchesne
Promontory Point-I Box Elder
Park Valley-I Box Elder
Promontory Point-II Box Elder
North Collinston Box Elder
Park Valley-II Box Elder
Leamington Millard/Juab
Tooele Army Depot South Tooele
Tooele Army Depot North Tooele
North Loa Wayne
Cedar Creek Box Elder
Pintura Washington
Utah State Prison Salt Lake
Stockton Bar Tooele
Stansbury Tooele
Simpson Springs-II Tooele
Cricket-II Millard
Camp Williams Salt Lake

Utah Geological Survey56
APPENDIX E.
ADDITIONAL INFORMATION
Several additional types of information were requested in the official scope of work for this wind study. One was to evaluate the potential wind sites if there were no exclusions for land use (parks, wilderness, and military). There are several sites along the western boundary of the state from Garrison north to the Idaho border that could be of interest, but are excluded by the military. These include the Grouse Creek Mountains and some of the hills and valleys west and southwest of Delta. Otherwise, high winds in parks and wilderness are to be expected at higher-elevation ridges and plateaus. Certain areas, like the Uinta and Tushar Mountains, likely have 9+ mps average wind speeds, but are well above 10,000 feet elevation and will likely never be given serious consideration for wind farm development even if institutional barriers were removed. Also, there are likely many minor ridges and gaps in U.S. Forest Service lands that would meet the 20% gross capacity factor threshold.
Another question concerns potential barriers to wind farm development. These include permitting, constructability, distance to transmis-sion lines, capacity for new generation on transmission lines, rugged terrain, uneconomic wind resource, and ability to purchase wind turbines. Some of these factors can be addressed, others not. It is beyond the scope of this study to analyze this further.