Embed Size (px)
Citation preview
Using Thermal Techniques for Amorphous Materials
Ann Newman Seventh Street Development Group
PO Box 526, Lafayette, IN 47902 765-650-4462
[email protected] www.seventhstreetdev.com
PPXRD May 15, 2012 Fort Myers, FL ©2012 Seventh Street Development Group

This document was presented at PPXRD -Pharmaceutical Powder X-ray Diffraction Symposium
Sponsored by The International Centre for Diffraction Data
This presentation is provided by the International Centre for Diffraction Data in cooperation with the authors and presenters of the PPXRD symposia for the express purpose of educating the scientific community.
All copyrights for the presentation are retained by the original authors.
The ICDD has received permission from the authors to post this material on our website and make the material available for viewing. Usage is restricted for the purposes of education and scientific research.
ICDD Website - www.icdd.comPPXRD Website – www.icdd.com/ppxrd

Thermal Analysis
• TG – Routine – TG-IR
• DSC – Routine
• Glass transition temperature (Tg)
• Enthalpy relaxation • Fragility • Molecular mobility • Miscibility
– Modulated – Hyper DSC
• Dielectric Analysis – Α and β relaxations – Stability prediction
• Thermally stimulated current (TSC)
• Dynamic Mechanical Analysis (DMA)
• Thermomechanical Analysis (TMA) – viscosity
• Local TMA and Heated Tip Atomic Force Microscopy (AFM)
2

3
• Measures the amount of weight change in a material as a function of temperature
• Temperature calibration performed using Curie point based on magnetism of metal standard
• High resolution option available
• Approximately 10 mg needed for analysis
• Amorphous materials may show weigh loss during equilibration
• Amorphous materials may not show nicely defined weight loss steps
0 50 100 150 200 250 300
Temperature (C) Universal V1.1F TA Instruments
Thermogravimetry

TG-IR • Sample heated in TG • Evolved gas is analyzed by IR to
identify volatiles • Developmental compound showed
12.2% weight loss – Volatiles identified as water and butyl
acetate
Rodriguez and Bugay. J Pharm Sci 1997, 86, 263-266 4

Differential Scanning Calorimetry (DSC)
• Detects thermal transitions relative to reference pan
• Endotherm: heat absorbing transitions such as a melt or volatization
• Exotherm: heat releasing transition such as decomposition or recrystallization
• Heats of fusion and heats of vaporization can be calculated
• Can be used for qualitative or quantitative analysis
• Dynamic technique
• Other techniques (TG, hot stage) needed to understand the transitions
• Sample pan and ramp rate can effect thermal transitions
5

Differential Scanning Calorimetry
Power Compensated DSC • Sample and reference pans
have separate heaters • Different amounts of heat are
added to maintain temperature during scan
• Difference in energy output is monitored to give heat flow
Heat Flux DSC • Sample and reference pans
have one heater • Heat is transferred to the pans
and the sample temperatures are monitored
• Difference between reference and sample pan converted into heat capacity
A A
Sample Reference
B B
A- furnace; B-thermocouple A- furnace; B-platinum resistance thermometers; C-crucibles
Sample Reference
A A
B B
Figures adapted from Thermal Analysis of Pharmaceutics, D. Craig and M. Reading, ed., CRC Press,2006 6

Glass Transition Temperature
Tf = onset Tg
Tm = midpoint or inflection Tg
dH/dT = f (DCp)
d_ dT
Super-cooled liquid
Glass
• The temperature at which glass and supercooled liquid interconvert is the glass transition temperature, Tg
•Commonly measured with differential scanning calorimetry (DSC) or modulated DSC
7

Glass Transition Temperature
• Common sugars
Sugar Molecular Weight (g/mol)
Tg (° C)
Glucose 180 30
Fructose 180 13
Sucrose 342 74
Trehalose 342 115
Maltose 342 100
Lactose 348 102
Raffinose 504 108
Maltodextrin 860 169
Dextran 10K 197
sucrose
glucose fructose
trehalose
maltose lactose
raffinose maltodextrin
Dextran 8

Glass Transition Temperature
• Different grades of poly(vinylpyrrolidone) (PVP)
Sample Molecular Weight (g/mol)
Tg (° C)
PVP K90 1500 K 177
PVP K30 50K 156
PVP K17 10K 136
PVP K12 2K 101
PVP/VA (60:40) 50K 102
PVP PVP/VA 9

Glass Transition Temperature
• Effect of different counterions on the Tg of indomethacin salts
Li+
Na+
K+
Rb+ Cs+
Tong et al, Pharm.Res. 2002, 19, 649-654. 10

Glass Transition Temperature
• Estimation of Tg – Tg is roughly (0.67)Tm (the melting temperature of the
crystalline material in K) – “2/3 rule”
Sample Tg (K) Tm (K) Tg/Tm
Poly(ethylene terephthalate) 343 538 0.64
Nylon 66 333 538 0.61
Polyacrylonitrile 378 590 0.64
Isotactic polypropylene 268 435 0.62
Aspririn 243 408 0.60
Indomethacin 315 434 0.73
Sodium indomethacin 393 543 0.72
Nifedipine 323 447 0.72
Cholocalciferol 293 352 0.84 11

Glass Transition Temperatures
• Tg is dependent on the rate of heating and cooling
Taylor and Shamblin. Amorphous Materials in Polymorphism of Pharmaceutical Solids, 2nd edition, Informa Healthcare 2009. 12

Glass Transition Temperature
• Water and solvents can act as plasticizers
– Water Tg: -137 °C
– lower the Tg of amorphous materials
• Rule of thumb: 1% water will decrease Tg about 10 deg
Indomethacin
Andronis et al., J.Pharm.Sci. 1997, 86, 346-351 13

Glass Transition Temperature
Wet vs dry Tg
• Wet Tg
– Want to know the effect of water/solvent on Tg
– Use hermetically sealed pan to prevent volatilization
• Dry Tg
– Want to remove all solvent and thermal history
– Use DSC cycling experiment
• Heat above Tg, cool, heat again through Tg
• Use second cycle for Tg value
14

Glass Transition Temperatures
• One Tg indicates miscible system – Can estimate Tg based on the Gordon Taylor
(different densities) or Fox equation (assuming densities are similar)
Fox Equation
• Tg,a: glass transition of component a
• Tg,b: glass transition of component b
• wa: weight fraction of component a
• wb: weight fraction of component b
• Assumes no interaction between components
Amorphous Solid Dispersions or Polymer Mixtures
PVP
30% PVP
70 %PVP
dextran
PVP
70% PVP
30% PVP
indomethacin
Newman et al. J Pharm. Sci. 2008, 97, 4840-4856
• Two glass transition temperatures (Tg) indicate a physical mixture
15

Relaxation
glass transition temperature
Hancock and Zografi. J. Pharm. Sci. 1997, 86, 1-12
• Amorphous materials can age or relax over time
• DSC shows an enthalpy relaxation endotherm
Unaged amorphous matrix
Enthalpic relaxation
Aged matrix ↑ density ↓ free volume
Surana et al. Pharm. Res. 2004, 21, 867-874.
• Upon relaxation • Density increases • Free volume decreases

Relaxation
• Once the glass is formed, it can be aged or annealed at a specific temperature (t1) for a period of time below Tg
• The relaxation results in a decrease in H or V
• Upon reanalyzing the material, enthalpy of relaxation is seen as an endotherm (ΔH)
0 hours 4 hours 8 hours 16 hours
DSC Traces for Amorphous Sucrose after Aging at 61°C
• Longer aging times will result in larger enthalpy relaxation
Hancock et al. Pharm. Res. 1995, 12, 799-806 Shamblin and Zografi. Pharm . Res. 1998, 15, 1828-1834

Relaxation
Surana et al. Pharm. Res. 2004, 21, 867-874.
•Aged materials show decreased physical and chemical reactivity compared to unaged materials
Aged matrix ↑ density ↓ free volume
Water vapor
sorption
Expansion of the condensed matrix
•Exposure to water can reverse the aging of an amorphous material and make it more reactive
Unaged amorphous matrix
Enthalpic relaxation
Drying at low T
(far from Tg) Reversal of physical aging

Annealing
• Annealing
– Sample moves towards lower energy and lower free volume
– Relaxation time should increase with annealing
• TSC was used to analyze ketoconazole annealed at different times
19
• Increased annealing resulted in more molecules entering the relaxed state – Decrease in current
observed
• Need to determine how this will affect physical stability
Bhugra et al. J Pharm Sci. 2008, 97, 4498-4515

Conditioning or Aging Step
• Found that lactose samples prepared by freeze drying (FD) and spray dring (SD) had different water uptakes
• Added a precondition step at 35% RH to obtain the same uptake from the different preps without crystallization
FD not conditioned
SD not conditioned
conditioned
Vollenbroek et al. Int J. Pharm. 2010, 395, 62-70
• Resulted in more consistent standard material regardless of prep
• Need to consider for other techniques that will show variability such as DSC, etc
20

Miscibility
• A physical mixture will give two glass transition (Tg) temperatures
• A solid amorphous dispersion will give a single Tg
0.0 0.2 0.4 0.6 0.8 1.0300
350
400
450
500
300
350
400
450
500
% Indomethacin
Tg (
K) T
g (K
)
Tg for lyophilized molecular dispersion of indomethacin and PVP
Tg for physical mixtures of indomethacin and PVP
Matsumoto and Zografi. Pharm. Res. 1999, 16, 1722-1728

Miscibility
Newman et al. J Pharm Sci. 2008,97,4840-4856
System Tg Values Observed (Aging) PDF Computational Studies
Phase separated amorphous mixtures 2 Described by individual components
Miscible 1 Not described by individual components
Solid nanosuspension 1 (2) Described by individual components
Thermal measurements have an estimated spatial resolution limit of ~ 30nm
trehalose
30% dextran
70% dextran
dextran
May be cases where one Tg indicates a miscible system but other data indicate a physical mixture
– Trehalose:dextran
DSC
XRPD/PDF
One Tg in DSC suggests miscible system
XRPD data can be described by individual components suggesting physical mixture
22

Miscibility
• NMR also used to confirm that trehalose:dextran mixtures were a solid nanosuspension
• Domain size estimated using relaxation times
• Found to be less than • 82 nm (50% trehalose)
• 55 nm (30% trehalose) Pham et al. Mol Pharmaceutics, 2010, early view
23

Sodium Indomethacin
24
Na
Tong and Zografi. Pharm Res. 1999, 16, 1186-1192
• Three methods used to make amorphous material – Grinding, freeze drying, solvent evaporation
• All amorphous based on XRPD data • DSC data collected showed the same thermal
properties for all three preparations • Sodium indomethacin (SI) exhibits higher Tg than
indomethacin (I)
SI: sodium indomethacin, IN: indomethacin

Sodium Indomethacin
Enthalpy relaxation • Measured with freeze dried sodium
indomethacin – Sample heated to 135 °C to remove any
residual water – Quench cooled using a cooling rate of 40 °
C/min to 100 ° C below Tg
– Temperature raised to aging temperature • Tg-47, Tg-40, Tg-32, Tg-16 °C
– Aging process terminated by cooling the sample at 40 ° C to 0 ° C
– DSC data collected through Tg
– Enthalpy relaxation measured at different times
• Relaxation at Tg-47 °C too small to be detected at experimental time scale
25
Tg-16
Tg-24
Tg-32
Tg-40
Tg-47
Tong and Zografi. Pharm Res. 1999, 16, 1186-1192

Fragility
• Fragile: – greater the change in molecular
mobility with temperature, and the more non-Arrhenius it is, the more “fragile” the system is considered
– Larger heat capacity changes at Tg
– Tm/Tg < 1.5
• Strong: – Less change with temperature
and the more Arrhenius-like this change the more the system is considered to be a “strong liquid”
– Smaller heat capacity changes at Tg
– Tm/Tg > 1.5
Angel. Polymer. 1997, 38, 6261
Vogel, Tamman, Fulcher (VTF) Equation
log ts = log to + [(DTo) / (T-To)] ts = structural relaxation time at T = T
to = structural relaxation time at T = ∞
D = strength parameter
To = temperature at infinite relaxation time
D = 2-30 “Fragile Liquid” D = > 30 indicates a “Strong Liquid”

Fragility
Crowley and Zografi. Thermochimica Acta 2001, 380, 79-83
Relaxation time vs temperature scaled to Tg described by VTF D values
2-30 Fragile, >30 Strong
Similar D values means similar Tm – Tg values, and therefore, similar Tg/Tm
Material Tg (K) To (k) D
B2O3 557 320 27
sorbitol 270 214 9
o-terphenyl 249 195 10
indomethacin 317 237 13
Na indomethacin 389 276 15
nifedipine 322 228 15
diazepam 398 249 10
felodipine 416 247 10

Sodium Indomethacin
Fragility (m) • Used heating rate dependence of Tg
– Different preps measured at multiple heating rates (q) • 5, 10, 30, 30, and 40 °C/min
– Plot ln q vs 1/Tg – Apparent activation energy (ΔH*) and
m can be obtained from the slope
• Can use m to calculate D
28
ground
freeze-dried
solvent evaporated
Tong and Zografi. Pharm Res. 1999, 16, 1186-1192 ln
q

Sodium Indomethacin
Fragility • Tg is different, but Tm/Tg is not significantly different • Differences in ΔH* (activation energy for enthalpy relaxation) observed
between salt and free base • The m and D values are not significantly different for sodium indomethacin
and indomethacin – Temperature dependence of molecular mobility in vicinity of Tg essentially
unchanged – No significant network structure, characteristic of a strong glass, is introduced in
the sodium salt
29 Tong and Zografi. Pharm Res. 1999, 16, 1186-1192
D= 2-30 fragile

Sodium Indomethacin Relaxation • KWW equation and enthalpy
relaxation experiments used to calculate τKWW – Need φ(t)
• For φ(t), need ΔHt and ΔH∞
• ΔH∞ calculated from DSC data
• ΔHt obtained from enthalpy relaxation experiments at time t
30
Similar near Tg
Different at lower T due to error in measurements
Tong and Zografi. Pharm Res. 1999, 16, 1186-1192

Sodium Indomethacin
• Shown for indomethacin that real relaxation times below Tg are usually smaller than estimated
• Can construct plot of log τ vs T/Tg – Use D, T0 and VTF equation
• Relaxation times for salt and free base are not different – Even with large difference in Tg
31 Tong and Zografi. Pharm Res. 1999, 16, 1186-1192

Sodium Indomethacin
Summary • Amorphous form of salt made by three methods are similar • Salt and free base show different Tgs (120 vs 44 °C)
– Due to strong ionic interaction to give a reduced free volume relative to less dense free base
• Temperature dependence of molecular mobility shows both forms are fragile – From scanning rate dependence of Tg experiments
• Molecular mobility below Tg showed similar relaxation patterns – From enthalpy relaxation recovery experiments
• Salt formation will enhance physical and chemical stability due to increase in Tg
32

Modulated DSC (MDSC)
• Different heating profile applied to sample – Sinusoidal modulation is overlaid on the
conventional linear temperature ramp – Yields a heating profile which is
continuously increasing with time, but in an alternating heating/cooling program
• Advantages: – Separation of complex transitions into
components – Increased sensitivity for weak transitions – Increased resolution without loss of
sensitivity – Direct measurement of heat capacity
Modulated DSC Heating Profile
• Uses same heat flux DSC cell arrangement utilized in conventional DSC
33

Modulated DSC (MDSC)
– Conventional or “deconvoluted” curve
– Heating rate dependent “reversing” curve (heat capacity-related)
• Melting
• Glass transition
– Non-heating rate dependent “non-reversing” curve (kinetic)
• Desolvation
• Crystallization
• Decomposition
Data are composite of three curves
Reversing
Conventional
Non-reversing
34

Modulated DSC • Hydroxypropyl methylcellulose (HPMC)
– Glass transition temperature observed in reversing heat flow curves – Separate from dehydration in total and non-reversing heat flow curve – MDSC has better sensitivity for Tg
McPhillips et al. Int. J. Pharm. 1999, 180, 83-90. 35

Modulated DSC
• Can also be used to separate the Tg (reversing) from enthalpy relaxation (non-reversing)
• Number of ways to measure activation energy for enthalpy relaxation (ΔH*) 1. scanning rate (q) dependence 2. width of Tg (ΔTg) 3. relaxation enthalpy (ΔH) over
time 4. complex heat capacity (Cp*) and
modulation frequency
36 Yu. Drug Delivery Rev. 2001, 48, 27-42.

Dielectric Analysis
Instrumentation • Sample is presented as thin film between two
parallel plates to make a capacitor • Guard ring- grounded electrode • Thermocouple placed in contact with plate(s) to
measure specimen temperature • Calibration
– Measure dielectric properties of empty dielectric cell to account for stray capacitances
– Temperature calibration performed with melting transition of a crystalline crystal, such as benzoic acid placed between the plates
• Sample subjected to a sinusoidal oscillating electric field – Dipoles in the material attempt to orient with
electric field – Resulting current flow is measured – Can vary temperature as well
37
http://www.sump4.com/publications/book004.pdf

Dielectric Analysis
• Four major properties reported during DEA
– e’ = permittivity
• Proportional to capacitance and measures alignment of the dipoles
– e” = loss factor
• Proportional to conductance and represents the energy required to align dipoles and move ions
– Tan Δ = dissipation factor or e”/e’
– K = conductivity (PS/cm)
38

Dielectric Analysis
Telmisartan • Used for high blood pressure and myocardial ischemia • Practically insoluble in water (0.09ug/mL), highly soluble at high pH
(521.55 ug/mL), weakly soluble at ph 6.8 (0.28 ug/mL) • Absolute bioavailability is 42-58% • Amorphous form and amorphous dispersions have been
investigated to improve bioavailability • Dielectric spectroscopy used to look at relaxation processes and
predicted stability of amorphous material •Temp range: 264 to -140 °C •Frequency range: 109 to 10-2 Hz – Primary α relaxations
• Correspond to Tg
– Two secondary relaxations β and γ
39 Adrjanowicz et al. Europ J Pharm Sci. 2009, 38, 395-404

Molecular Motions
• Primary Relaxations • a relaxations • “slow” cooperative
diffusion (translational and rotational motion of whole molecules or polymer segments)
• corresponds to Tg
• Secondary Relaxations • b relaxations • “faster” non-cooperative
local motions associated with individual molecules or polymer main-chain segments, as well as with polymer side-chains
• Important secondary relaxations are often called “Johari-Goldstein” relaxations. They are precursors to the primary a relaxations
Johari and Goldstein. J. Chem. Phys. 1970, 53, 2372

Dielectric
• Glass transition defined at temperature at which dielectric relaxation time τα is equal to 100 s – Tg = 400 K = 127° C
• Dielectric loss (ε“) above Tg – Temp range 403-537 K – α- process evident – Conductivity (dc) contribution due to
presence of free ionic species present in most liquids
– Corrected for dc-conducitivity
• Peak for α-relaxation increases with decreasing temperature
41
Minus dc conductivity
Adrjanowicz et al. Europ J Pharm Sci. 2009, 38, 395-404
Dielectric Analysis
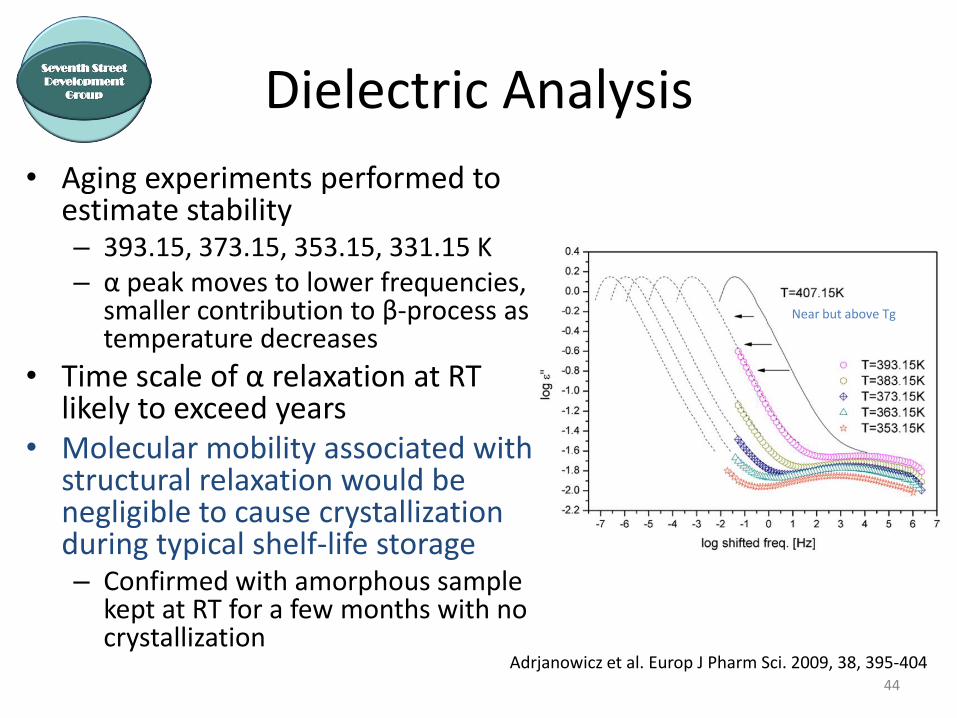
• Aging experiments performed to estimate stability – 393.15, 373.15, 353.15, 331.15 K – α peak moves to lower frequencies,
smaller contribution to β-process as temperature decreases
• Time scale of α relaxation at RT likely to exceed years
• Molecular mobility associated with structural relaxation would be negligible to cause crystallization during typical shelf-life storage – Confirmed with amorphous sample
kept at RT for a few months with no crystallization
44
Near but above Tg
Adrjanowicz et al. Europ J Pharm Sci. 2009, 38, 395-404

Dielectric Analysis
Summary • Dielectric spectroscopy used to look at relaxation
processes –Temp range: 264 to -140 °C –Frequency range: 109 to 10-2 Hz
• Primary α relaxations found above Tg • Two secondary relaxations β and γ dominate below Tg
• Tg of 400 K, fragility index (m) = 87 • Determined α relaxation time at room temperature
would exceed 3 years – Amorphous telmisartan should maintain physical and
chemical stability over prolonged storage time
45 Adrjanowicz et al. Europ J Pharm Sci. 2009, 38, 395-404

Thermally Stimulated Current
• Carvedilol used as model compound to compare techniques for low levels of amorphous material in crystalline – Thermally stimulated current (TSC) – MDSC – XRPD – Moisture uptake
• Amorphous made by melting above 135 °C and cooled to ambient in a desiccator. Stored at RT in desiccator.
• Mixtures made by blending 75:25 amorphous:crystalline sample in Turbula blender – Other blends (90:10 to 99:1) produced using blend and crystalline
material by serial dilution
46 Venkatesh et al, Pharm Res 2001, 18, 98-103

TSC
TSC • 1 mm thick hand-pressed disk placed
between electrodes • Thermally Stimulated Current 9000
Spectrometer • Polarization at 70 °C for 5 min by applying
a DC electric field at 100 V/mm – Orient molecular dipoles
• Rapidly cool the sample to 0 °C while maintaining the electric field to trap polarized dipoles
• Short circuit electrodes for 1 min • Scan sample at 7 °C/min up to 110 °C
while monitoring the current generated due to relaxation of polarized dipoles
• Calculate normalized distribution of the glass transition relaxation using a fitted polynomial outside the 45-65 °C window
47
75:25 C:A
90:10 C:A
98:2 C:A
C A

TSC
• LOD based on visual assessment of data based on standards • TSC had lowest LOD at 2% amorphous • Chemometric approaches not used
Technique Analysis LOD
TSC Polynomial fit 2%
MDSC Complex heat capacity signals 5%
XRPD Integrated peak intensities in four regions for crystalline drug and LiF standard
5%
Moisture uptake Moisture uptake 5%
48 Venkatesh et al, Pharm Res 2001, 18, 98-103

Comparison of Techniques
• Three techniques used to measure relaxation times – Modulated DSC (MDSC) – Isothermal microcalorimetry (TAM) – Thermally stimulated current (TSC)
• Different relaxation values below Tg found using different techniques – Preferentially measure different parts of the relaxation time distribution – TSC<TAM<MDSC – TSC captures some of the faster motions not captured by calorimetric
techniques
49 Bhugra et al. J Pharm Sci. 2008, 97, 4498-4515

What Have We Learned
• A variety of thermal methods are available – DSC is most common
• Many parameters can be calculated from DSC data
• Tg, fragility, mobility, etc
– DEA, DMA, TMA, etc
• Information obtained will depend on technique due to time scales
• Thermal analysis can give important information for development of the material – Tg, physical stability, viscosity, etc
50

References
• Marsac et al. Pharm Res 2009, 26, 139-151
• Adronis and Zografi. Pharm Res 1997, 14, 410-414 • Hancock et al. Pharm Res. 1999, 16, 672-675 • Harding et al. Pharm Res. 2007, 11, • Hsieh, J Pharm Sci. 2010, 99, 4096-4105 • Crowley and Zografi. Thermochim Acta. 2001, 380, 79-93
• Thermal Analysis of Pharmaceuticals, D. Q. M. Craig and M. Reading, Eds., CRC Press, Boca Raton, 2007.
• Schubnell. J Thermal Anal Calorim 2000, 61, 91-98. • Venkatesh. Pharm Res, 2001, 19, 98-103. • Park et al. Crystal Growth & Design, 2003, 3, 991-995 • Physical Characterization of Pharmaceutical Solids, H. G. Brittain, Ed., Marcel Dekkar,
New York 1995 • Solid-State Chemistry of Drugs, 2nd edition, S. R. Byrn, R. R. Pfeiffer, and J. G. Stowell,
SSCI, Inc, West Lafayette, IN 1999. • Polymorphism in the Pharmaceutical Industry, R. Hilfiker, Ed., Wiley-VCH, Weinheim
2006. • Polymorphism in Molecular Crystals, J. Bernstein, Oxford University Press, NY 2002.
51


![Thermal conductivity calculation of nano-suspensions using ... · higher thermal conductivity [, 13]. Conversely, fluctua8 - tions lose correlation quickly in amorphous materials](https://img.dokumen.tips/doc/110x75/609eca91fefaf146452d4d31/thermal-conductivity-calculation-of-nano-suspensions-using-higher-thermal-conductivity.jpg)