Embed Size (px)
Citation preview

i
Using the Understanding of Agricultural Crop Geography in the
United States as an Assessment for Agricultural Literacy
Logan Agnaarsson (Author)
A final research assignment presented and submitted to the faculty of the
Virginia Polytechnic Institute and State University
in partial fulfillment of the requirements for the degree of
Master of Science in Agricultural and Life Sciences
with a concentration in
Agricultural Leadership, Communication, and Education
through the
College of Agriculture and Life Sciences
Online Master of Agricultural and Life Sciences (OMALS) program
Tiffany Drape, PhD (Committee Chairperson; Advisor)
(Department of Agricultural, Leadership, and Community Education)
and
Hannah Scherer, PhD (Committee Member)
Megan O’Rourke, PhD (Committee Member)
Date of Official Submission: December 6, 2016
Keywords: agricultural geography, agricultural literacy, biogeographic, center of origin,
epistemological, foodshed, geography of food, pedagogical, physiographic
Copyright, 2016

ii
Abstract
The primary aim and purpose of this study was to determine the knowledge level and
understanding of where important agricultural crops are historically and statistically produced
in the United States in a sample population of American citizen adults from ages 18 to 42. Out of
a total of 310 potential participants, 190 respondents participated, with a 61.3% response rate.
The objectives for this research were to ascertain this sample population’s ability to: identify ten
agricultural crops which are endemic (native) to the North American continent based on their
centers of origin; identify five significant agricultural production areas within one or more states
of the United States; identify the historically and statistically leading regions for the production
of seven different agricultural crops in the United States; identify the historically and
statistically leading states (in their entirety) for the production of eleven different agricultural
crops in the United States; and, identify the basic physiographic differences of two states (in
their interior) and how these limit the production of agricultural crops. Through this, the
secondary aim and purpose of this study was to investigate a different approach in the
exploration and development of methods which assess agricultural literacy, to describe the need
for strengthening academic curricula which are concerned with agriculture, and to underscore
the necessity to address the current rates of agricultural literacy nationally, especially with a
consumer-based society which aspires to improve its ethics when it comes to all aspects and
concerns of its food, fiber, and fuel production systems. It was found that the mean response rate
for all correct answers was 52.7% for all individual answers, including multiple-option
questions in the survey, thereby indicating a need for better knowledge and understanding of
agricultural geography on behalf of the student as a consumer.

iii
Acknowledgements
I would like to thank Tina Fanetti, PhD, and her work as a statistician for the United
States Department of Agriculture’s (USDA) National Agricultural Statistics Service (NASS) in
Saint Louis, Missouri. Her assistance to me greatly contributed to this research, as she validated
several of the survey questions based on agricultural cropping system history and statistics. Her
efforts are greatly appreciated.
I would also like to thank my graduate advisory committee chairperson Tiffany Drape,
PhD, an associate professor for the Department of Agricultural, Leadership, and Community
Education in the College of Agriculture and Life Sciences at Virginia Polytechnic Institute and
State University. She offered to take me in as one of her graduate students, and her advice,
discernment, and percipience have facilitated the intrinsic difficulties that naturally come with
the research process, thereby guiding me through the OMALS program. Her wisdom and her
time is greatly appreciated.
I would finally like to thank my former commander, Nicolas Jelinksi, PhD, a captain in
the United States Army and an assistant professor at the University of Minnesota. His
compassion for military-related hardships and appreciation for knowledge are not to be
forgotten. I am grateful for both his leadership and his friendship, as well as his time for writing
too many letters of recommendation to count before I finally found the academic programs that
were right for me.

iv
Dedication
I would like to dedicate this manuscript to my late mother, Diane, who preached to me
that knowledge, no matter how seemingly significant or insignificant, should be both
authentically and enthusiastically shared with others to make the world a better place for all of
us, and who certainly taught me both the humility and modesty of understanding that other
people may know something that I do not; to always keep an open heart and an open mind.

v
Table of Contents
Introduction 1
Background and Setting................................................................................. 1
Statement of Problem..................................................................................... 2
Purpose of Research...................................................................................... 2
Research Objectives....................................................................................... 2
Definition of Terms........................................................................................ 3
Review of Literature....................................................................................... 4
Conceptual and Theoretical Framework....................................................... 7
Significance and Limitations of Research 10
Methodology of Research 11
Design and Instrumentation........................................................................... 11
Sampling Strategy and Targeted Sample Population ................................... 12
Data Collection.............................................................................................. 13
Results and Discussion 14
Analysis and Synopsis.................................................................................... 14
Implications, Recommendations, and Conclusion......................................... 21
References 24
Appendices 32
Appendix A: Survey Questions....................................................................... 32
Appendix B: Agricultural Crop Commodities Referenced in Survey............. 43
Appendix C: Reference Maps Used in Survey............................................... 44
Appendix D: Survey Results........................................................................... 45
1 | 6 0
Introduction
Background and Setting
The current agricultural literacy rate is a critical social issue in the United States, and it
has negative long-term effects both academically and culturally (Ackerman-Leist, 2012; Kovar
and Ball, 2013). As the world population continues to grow astronomically into this century,
putting greater demands on our global food systems, there will be an increasing demand for
individuals well-versed in agricultural science. Having these agriculturally literate individuals
readily available will assist in combatting issues dealing with agricultural biosecurity and food
defense, food security, sustainable food production, and environmental degradation, including
greater preparation for both the predicted and unpredicted impacts of climate change (Kovar and
Ball, 2013). Obviously, not everyone will become an agricultural scientist, but a general
awareness of the national agricultural infrastructure is imperative for an agriculturally literate
populace, especially in a consumer-based society (Ackerman-Leist, 2012; Kovar and Ball, 2013).
To study the agricultural infrastructure of the United States, one must acknowledge the role
which geography plays.
Although mostly a social science, geography has many scientific and social aspects and
concepts that can be studied and taught in the context of agriculture. Geography is a study which
comprises both human and natural elements, (i.e., social sciences and physical sciences,
respectively). While the study of geography is important, the study of agricultural geography can
highlight many important subdisciplines. Because agricultural animal and crop geography has
largely stabilized since the 1950s (Hart, 2001; Liang and Gong, 2015; Ramankutty and
Foley, 1999), especially in the United States, these aspects can be studied. While the concept of
agricultural geography as an academic discipline has been around since the last century, it has
largely been redefined as the “geography of food” (Atkins, 1988; Bowler and Ilbery, 1987;
Morris and Evans, 1999; Whatmore, 1991), which accounts for a more cultural and
socioeconomic approach to the study (Morris and Evans, 1999; Whatmore, 1991). While this is
an imperative area for concerns over global food distribution, food supply, ethics, and fair trade
and economics, one must account for the biogeographic and physiographic parameters, which are
both important limiting factors that affect our food supply (Robinson, 2003). Stressing the
biogeographic and physiographic attributes, which both define agricultural geography as much as
the socioeconomic attributes that define the geography of food (Block and DuPuis, 2001; Yeung,
Coe, and Kelly, 2007), can thus be integral for agricultural literacy in the education system.
Understanding these aforementioned factors in agricultural geography will translate into
better informed, intelligent decision-making by the public on issues of land use and tenure, soil
conservation, urban encroachment of abandonment of suitable agricultural-grade land (Benayas,
Martins, Nicolau, and Schulz, 2007; Foley et al., 2005), and much more, as well as an
appreciation and concern for our national food systems. While we already know that agricultural
literacy rates in the United States are at undesirable levels, there will be a necessity for
researchers to continue to assess populations and programs which address this issue, as well as
continuously identifying new areas of deficiency related to agricultural literacy efforts (Kovar
and Ball, 2013). Understanding the awareness and knowledge within the general population,
particularly the younger generation—which is already believed to be extremely disconnected

2 | 6 0
from agriculture—of where important agricultural crops are produced within the United States
could be another method in the collection and analysis of the data which is used to study the
level of agricultural literacy rates.
Statement of Problem
The concept of agricultural literacy is relatively new academically and it is important that
educational researchers continue to assess populations and programs while increasing the variety
of populations and programs assessed, thereby identifying areas of deficiency in research related
to agricultural literacy efforts and continuing these efforts in the future (Kovar and Ball, 2013).
An approach that has not been fully examined is exploring the agricultural literacy within a
population in terms of geography. Agricultural geography with crop-based systems, (as opposed
to animal-based systems), could be used to assess the understanding of where important
agricultural crops are historically and statistically produced in the United States.
Purpose of Research
The primary aim and purpose of this research was to determine the knowledge level and
understanding of where important agricultural crops are historically and statistically produced in
the United States in a sample population of American citizen adults from ages 18 to 42. The
question guiding this research was:
What is the knowledge level and understanding of where important agricultural crops are
historically and statistically produced in the United States in American adults, ages 18 to
42?
Through this, the secondary aim and purpose of this study are to investigate a different
approach in the exploration and development of methods which assess agricultural literacy, to
describe the need for strengthening academic curricula which are concerned with agriculture, and
to underscore the necessity to address the current rates of agricultural literacy nationally,
especially with a consumer-based society which aspires to improve its ethics when it comes to all
aspects and concerns of its food, fiber, and fuel production systems.
Research Objectives
The objectives for this research were to ascertain a certain population’s (adults ages 18
through 42) ability to: identify ten agricultural crops which are endemic (native) to the North
American continent based on their centers of origin; identify five significant agricultural
production areas within one or more states of the United States; identify the historically and
statistically leading regions for the production of seven different agricultural crops in the United
States; identify the historically and statistically leading states (in their entirety) for the
production of eleven different agricultural crops in the United States; and, identify the basic
physiographic differences of two states (in their interior) and how these limit the production of
agricultural crops.
3 | 6 0
Definition of Terms
Agricultural geography: A subdiscipline of human geography concerned with
agriculture; it is traditionally considered a branch of
economic geography that investigates the parts of the land
surface that are transformed by humans through primary
sector activities.
Agricultural literacy: A term used by academic institutions and organizations to
describe programs to promote the understanding which is
necessary to synthesize, analyze, and communicate the
basic information about agriculture and its importance and
impacts on society with students, producers, consumers,
and the public.
Biogeographic: Relating to biogeography; the study of the distribution of
species and ecosystems in geographic spatially and
temporally.
Center of origin: Synonymous with ‘centers of diversity’; a geographical
area where a group of organisms, either domesticated or
undomesticated, first developed their distinctive
characteristics. Specific to the origin of the cultivation of
agronomically important plants, they are also called
Vavilovian centers, named after the Russian scientist
Vavilov who coined the term.
Epistemological: The theory of knowledge or a corps of knowledge,
especially in respect to its methods, scope, and validity.
Foodshed: A geographic region which produces the food for a
particular population. The term is used to describe a region
of food networks, from the area where it is produced, to the
place where it is consumed, including the land on which it
grows, the route it travels top market, the markets through
which it passes, and the consumer with whom it is
consumed.
Geography of food: The geography of food is a field of human geography. It
focuses on patterns of food production and consumption on
the local to global scale.
Pedagogical: Relating to the methods and practices of both formal and
informal instruction, especially in specific academic or
theoretical subjects.

4 | 6 0
Physiographic: Relating to physiography; the study of the physical
attributes and characteristics of the world, specifically its
land surfaces.
Review of Literature
Agricultural Geography: A New Approach to an Ancient Practice
During the past 10,000 to 12,000 years, from an anthropological perspective, agriculture
has become a dominant force for human development and distribution across most of the world,
but has only been observed from a purely scientific perspective since the latter half of the
twentieth century (Rumney, 1984). Because the scientific era of discovery is relatively new as
compared to the rest of human history, the concept of agricultural geography was not created in
an academic nor scientific sense until the twentieth century (Grigg, 1995a). Agricultural
geography itself is a subdiscipline of human geography and can be applied to many other
subdisciplines within human geography, such as economic geography and environmental
geography (Block and DuPuis, 2001; Grigg, 1995a). Because agriculture is one of the longest
established and most important interfaces between humans and their environment, it is not only
becoming further integrated with other subdisciplines within the study of geography, but it is
also being applied to outside studies.
Agriculture involves living plants and animals that thrive in some physical environments,
but flourish less successfully, or not at all, in other environments (Hess, 2011a; McMahon,
Kofranek, and Rubatzky, 2011a). For ages, humans have considered these differences and
modern humans understand that the physical environment determines spatial variations in
agricultural activity, and that regional differences in climate (prevailing atmospheric conditions
and soil types) gives rise to distinct agricultural regions (Grigg, 1995b; Grigg, 1995c). Plants
have inherent biological characteristics that determine their productivity; they only function
efficiently in environments to which they are adapted (Hess, 2011a; McMahon, Kofranek, and
Rubatzky, 2011b). Both these factors greatly influence the nature and location of agricultural
crop production (Grigg, 1995c), and they have many influences on the spatial dimensions of
agricultural cropping systems (Lutgens and Tarbuck, 2010a; Lutgens and Tarbuck, 2010b;
Osman, 2013; Rumney, 1984). Based on these circumstances, agricultural geography can be
accurately described by science and its patterns can be recorded for several, various purposes.
The Current Trend in Agricultural Geography: The Geography of Food
Although agricultural geography has received more attention over the recent decades in
terms of policy and regulation, (Whatmore, 1991), it has had its emphasis realigned and
redefined as the “geography of food” (Atkins, 1988; Bowler and Ilbery, 1987), thereby
concentrating on areas such as the production, transportation, and retail of food from global
socioeconomic perspectives (Ackerman-Leist, 2012; Block and DuPuis, 2001; Yeung, Coe, and
Kelly, 2007). In the United States and Europe, far more notice is given to manufacturing industry
and the problems of urban areas (Grigg, 1995a). This neglect perhaps reflects the relative
unimportance of agriculture in the economies of developed nations, in contrast to its
predominance in developing nations and the world (Combes, Mayer, and Thisse, 2008; Grigg,

5 | 6 0
1995a). Additionally, subsidization of agricultural cropping systems in developed nations has
made it nearly impossible for developing nations to compete on the world market (Ackerman-
Leist, 2012). Consequently, during the past several years, the agricultural system has come under
strong criticism (Ackerman-Leist, 2012; Combes, Mayer, and Thisse, 2008; Grigg, 1995a). Thus,
perceptions of the public have been challenged dramatically, calling attention to the lack of
public understanding of the economic and ecological repercussions of the decisions which we all
collectively make when producing our food and how it affects humanity worldwide
(Powell, Agnew, and Trexler, 2008).
Despite this renewed awareness, which has been shown to be confined to niche
consumers, (i.e., health and organic food consumers) (Ackerman-Leist, 2012; Dicken, 2003), the
greater number of Americans knows little about agriculture upon entering school and shows little
improvement in agricultural literacy by the time they graduate high school (King, 2007;
Malecki, Israel, and Toro, 2004). Additionally, these aforementioned interests, while important,
have upstaged the foundations of agricultural geography: where food is produced and why it is
produced there (Grigg, 1995a). Thus, a basic understanding of where important crops are
produced in the United States may be hindered despite an increasing consumer interest in our
food systems, thereby contributing to agricultural illiteracy in American children, adolescents,
and adults. Over several generations, much of the knowledge the public had about the
agricultural origins of their food, clothing, and shelter has been lost (Agnew and
McJunkin, 2005; Malecki, Israel, and Toro, 2004). As we now move out of the industrial age,
and ironically into the information age, even fewer people are aware of the interrelatedness of
agriculture and the environment (Agnew and McJunkin, 2005; Combes, Mayer, and Thisse,
2008).
The Relevance of Agricultural Geography to Agricultural Literacy
Since agricultural literacy first became a concern in the late 1980s (Grigg, 1995a;
Rumney, 1984), the agricultural education profession has responded by defining what is meant
by agricultural literacy, identifying different methods of educational delivery, and developing a
knowledge foundation connected to standards with a reliable and valid means of assessment.
Efforts to fully articulate and clarify this definition have produced much discussion, although
with very limited consensus due to perceived philosophical and epistemological differences.
The National Research Council established the Agricultural Education in Secondary
Schools Committee to examine the status and forecast the future of agricultural education. The
Committee published its findings in a report called Understanding Agriculture: New Directions
for Education (1988), and defined agricultural literacy as:
“An agriculturally literate person would understand the food and fiber system
and this would include its history and its current economic, social and environmental
significance to all Americans.”
(National Agriculture in the Classroom, 2016)

6 | 6 0
Agricultural and educational administrators, practitioners, and researchers, as well as
government officials, convened in Washington (District of Columbia), on April 17, 2013, to
develop the National Agricultural Literacy Logic Model. To support this model, an agriculturally
literate person was defined as:
“A person who understands and can communicate the source and value of
agriculture as it affects our quality of life.”
(National Agriculture in the Classroom, 2016)
The American Farm Bureau Foundation for Agriculture states that “Agricultural literacy
can be cultivated in any person, no matter the age or experience” (American Farm Bureau
Foundation for Agriculture, 2015b). A basic assessment of the knowledge level in adults of
where important agricultural crops are produced is important because agricultural geography is
directly connected with several of the pillars of agricultural literacy (National Agriculture in the
Classroom, 2016). Furthermore, the American Farm Bureau Foundation for Agriculture once
again states, “Agricultural literacy is knowledge. We believe everyone should understand where
their food comes from” (American Farm Bureau Foundation for Agriculture, 2015a).
While a broad term, some of the main components of agricultural literacy are geographic
in nature: the knowledge and understanding of our food, fiber, and fuel systems, the production
of animal and plant products, the important relationships between agriculture and the
environment, and the distribution of agricultural products into the consumer marketplace
(Spielmaker and Leising, 2013). Agriculture is by far the most important economic activity
globally (Ackerman-Leist, 2012), and its geography is important as it uses over one-third of the
total land surface and employs approximately 45 percent of the working population (Grigg,
1995a). In the United States, agriculture directly employs only two percent or less of the
population, and it contributes a similarly small proportion to the nation income, yet, up to four-
fifths of the land surface is used for agriculture purposes (Grigg, 1995a).
Agricultural geography is a discipline that can be conveyed and delivered to students in
an academic setting, although it may not seem as conventional as purely agricultural or
geographical disciplines (Malecki, Israel, and Toro, 2004). While the use of agricultural statistics
in developing nations is still on the rise, developed nations have reliable agricultural statistical
services, such as the United States Department of Agriculture’s (USDA) National Agricultural
Statistics Service (NASS) and its five-year agricultural census, and therefore accurate cropland
data maps are not only feasible, but they are readily available to the public (Fritz et al, 2015). It
is estimated that the greater extent of (native) vegetation types of North America has been
cleared for cultivation (Ramankutty et al., 2008). Geographically, the principal mode of
anthropogenic land use has been clearing of natural ecosystems for agriculture (Ramankutty and
Foley, 1999). Following a general westward and southward annexation of the wilderness since
the colonization of the United States began, agricultural crop areas reached their apex in
expansion in the United States, and then stabilized by 1950 (Hart, 2001; Liang and Gong, 2015;
Ramankutty and Foley, 1999). Because these long-established agricultural cropping systems
exist, these patterns can be used outside of research for the sole purpose of learning.

7 | 6 0
Agricultural geography is imperative as a study of agricultural science as it will need
better understanding to ameliorate the negative impacts with both climate change, as crops will
“migrate” to new areas (Dicken, 2003; Padgham, 2009; Vermeulen et al., 2010), as well as
deterring against encroachment of urban areas onto land suited best for agricultural use (Hess,
2011b), and thus its study is directly connected to food and economic security. As the world
population rises to an approximate estimate of 9 billion people by the year 2050 (Brown, 2009;
Miller, 2005), precision agriculture will become more and more important, and the geography of
crops will thus become concomitantly more important. Individuals with knowledge and skill of
both agricultural and general geography will be in demand (Boryan et al., 2011; Fritz et al.,
2015; Rahman, 2007; See et al., 2014). The study of agricultural geography can be used
extensively by academic administers and educators, scientists, politicians, and producers on the
issues of agricultural biosecurity and food defense, agricultural pathogen and pest epidemiology,
bioenergy crop inventory, food security, deforestation, land use change and assessments,
pesticide use, soil conservation, and much more (Bockheim, 2014; Han et al., 2014; Luck et
al., 2011; Osman, 2013; Randolph, 2012; Waldner et al., 2015).
Agricultural literacy can be best achieved through curriculum infusion from kindergarten
through grade 12. Curriculum infusion is the purposeful integration of agricultural topics into the
mandated curriculum in urban, suburban, and rural schools. These topics are included as natural
interdisciplinary connections through the natural sciences and the social sciences to assist
students in better understanding the world in which they live (Malecki, Israel, and Toro, 2004).
Thus, formal education, beginning in elementary and through high school, is the logical approach
by which to assist people develop agricultural food system understandings that would be a
foundation for well-reasoned debate, and a deeper understanding is required (Hess and
Trexler, 2011; King, 2007). As public discourse focuses on agricultural food system reform, it
becomes increasingly important for citizens to understand this complex system to engage in
democratic decision-making processes (Hess and Trexler, 2011).
Conceptual and Theoretical Framework
Incorporating Social Constructivism into Agricultural Literacy and Geography
The aim and purpose of this research was to assess agricultural literacy rates in adults by
surveying their understanding of where important agricultural crops are produced in the United
States. Social constructivism is the lens that was used for this study, glimpsing what participants
either know or do not know about where agricultural crops are produced in the United States.
Although the results from the questions in the research instrument, (which was a 30-question
survey), did not directly elude to it, the guiding conceptual and theoretical framework of social
constructivism enabled thinking critically about where participating respondents had learned and
are continuing to learn the information which enabled them to correctly answer the survey
questions.
An Overview of Social Constructivism
An overview of social constructivism will allow for better understanding the aim of
integrating the research into this conceptual and theoretical framework. Constructivism is a
8 | 6 0
synthesis of multiple theories that are merged into one form (Amineh and Asl, 2015; Kukla,
2000a; Kukla, 2000b). Constructivism is an educational philosophy within a much larger
category of philosophies that are described as “rationalism” (Amineh and Asl, 2015; Stam,
2001). A rationalist philosophy is characterized by the belief that, in the minds of people, reason
is the primary source of knowledge and that reality is constructed rather than discovered (Smith
and Ragan, 2005; Stam, 2001). Constructivism is also the assimilation of both behaviorialist and
cognitive ideals (Amineh and Asl, 2015). Basically, a constructivist stance maintains that
learning is essentially a process of constructing meaning to what is being learned; “it is how
people make sense of their experiences” (Merriam, Caffarella, and Baumgartner, 2007a). People,
constantly bombarded and confronted with stimuli, both actively and inadvertently establish
cognitive infrastructures which assist them making sense of the world around them (Elias and
Merriam, 2005; Nesbit, Leach, and Foley, 2004).
Social constructivism, which draws heavily from the late psychologist Lev Semyonovich
Vygotsky (Amineh and Asl, 2015; Liu and Matthews, 2005), maintains that learning is more
than what occurs within our minds (Sjøberg, 2007). Social constructivists argue that learning is
both an essentially and a fundamentally social process; they hold that culture and context both
affect the ways in which we interpret the world around us and therefore the knowledge we
construct about it (Nesbit, Leach, and Foley, 2004). Additionally, social constructivism posits
that knowledge is constructed when individuals actively engage socially about shared problems
(Sjøberg, 2007). Making meaning is thus a dialogic process involving persons-in-conversation,
and learning is the process by which individuals are introduced to a culture of more
knowledgeable and skilled members (Elias and Merriam, 2005; Merriam, Caffarella, and
Baumgartner, 2007b). The one key assumption in social constructivism is that learning is
collaborative with meaning “negotiated from multiple perspectives” (Smith and Ragan, 2005).
When considering social constructivism as a component of constructivism, the social
processes of conversation, discussion, and negotiation must be taken into account, as these yield
learning as a product according to social constructivists (Woo and Reeves, 2007). Not
surprisingly, social constructivism also borders on sociology and communication theories
because it examines the knowledge that people have of the world around them which is
developed jointly through these aforementioned mediums, and thus this theory assumes that
understanding, significance, and meaning are developed in coordination with other people
through communication (Sjøberg, 2007). One of the most fundamental elements in this theory is
the assumption that people rationalize their experiences by creating a model of the world around
them and the way in which it functions (Merriam, Caffarella, and Baumgartner, 2007b; Sjøberg,
2007).
Applying Social Constructivism
Social constructivism applies meaning to many of the inquiries and questions which
guided this research. The collected data from the survey provided insight on not only how well
the sample population understood where important agricultural crops are produced in the United
States, but also on where people may be acquiring the information to answer the questions, what
people perceive about land-based agriculture and tenure practices, as well as how people have
constructed this information, regardless of whether they were correct or incorrect when

9 | 6 0
answering the questions in the survey. Social constructivism applies to this research not only
because of the educational landscape from which it is derived, but also because it has allowed
exploration of the social landscape to which it can be further applied in the future. This is
because formal learning is mostly in a social setting.
Social constructivists maintain that conversation, discussion, and negotiation occurring at
any place and at any time are meaningful for learning (Amineh and Asl, 2015; Liu and
Matthews, 2005; Kukla, 2000c; Sjøberg, 2007). In fact, they emphasize that learning is situated
in social contexts. One important social constructivist notion consists of authentic or situated
learning, where the person is involved in activities which are directly relevant to his or her life
and which occur within a culture similar to an applied setting (Merriam, Caffarella, and
Baumgartner, 2007b; Sjøberg, 2007; Woo and Reeves, 2007). Thus, social constructivism
provided the approximate context to examine the research questions and to present
recommendations when the data had finally been collected. Perhaps some respondents were
knowledgeable because of directly being exposed to agriculture in a social setting, (e.g., a group
of high school students on an FFA (Future Farmers of America) field trip to a farm, a grocery
shopper discussing a commercial recall of produce produced in a specific area with another
grocery shopper, or a pair of airplane passengers discussing the “fly-over country” down below).
It was important to think of any and every scenario possible in between, especially since
agriculture is both directly and indirectly a part of everyday life for all American citizens.
Analyzing the collected data through the theoretical lens of social constructivism was a
logical approach, since the adjacent and conjoined theory in this research is agricultural literacy
which posits that “agricultural knowledge and [understanding] is applied to different contexts in
the real world, which allows the student to understand the mechanisms of various agricultural
activities and their respective systems” (Powell, Agnew, and Trexler, 2008). Moreover, as this
current and future research sheds light on where adults are learning their facts based on
agricultural geography, it hopefully will inversely shed light on where they are not learning their
facts so that professionals can ascertain where these concepts can be applied in learning
environments, thus providing suggestions in remedying the issue of current agricultural literacy
rates.
10 | 6 0
Significance and Limitations of Research
Agricultural geography is important for agricultural science and agricultural education for
many reasons. The study of agricultural geography is not only an essential foundation for
building on more advanced concepts of agricultural sciences, as well as other physical and social
sciences, but it is also a powerful force for other disciplines (Malecki, Israel, and Toro, 2004).
The agricultural literacy movement is designed to promote awareness of agriculture and the
environment and to help connect concepts in science, math, and social studies using agricultural
and environmental examples, such as geography (Agnew and McJunkin, 2005; Shelerud, 2016).
In one Californian study, adolescents were asked to describe where production
agriculture occurred. No informant described production agriculture on a regional basis. Only 44
percent of the informants described agriculture that occurred in California (Hess and Trexler,
2011). While these results and the results of other studies seem disheartening, the current state of
general knowledge in the population about agricultural geography can be improved, as should
agricultural literacy in general, largely through awareness and education (King, 2007). While,
there is already a wealth of evidence that general agricultural science is needed more in
education, we need more evidence for agricultural geography.
The results of the survey will hopefully add to the accruing information which academic
administrators and educators can use to build educational approaches that are developed to assist
learners construct schemata which are more compatible with modern agricultural production
systems (Hess and Trexler, 2011; Kovar and Ball, 2013). By challenging and building on
existing schema, connections across multiple domains (e.g., geography, economics,
environmental science, etc.) can be leveraged to assist learners in constructing compatible and
robust schemata on which to build more complex understandings (Hess and Trexler, 2011). The
survey explored the understanding of these aforementioned domains in relation to specific
agricultural crops to serve as another method of assessment in order to gauge agricultural literacy
in the United States.
This research was limited by the uncertainty of how many participants would respond to
the solicitation of participating as a respondent in the survey. The most important solution to this
problem was advertising the survey and its accessibility on a variety of electronic platforms. The
second most important limitation was balancing the survey. A comprehensive battery of survey
questions carefully balanced between those inquiring about agricultural crops versus those
inquiring about demographics undoubtedly contributed to the assessment qualities of the survey,
but it could not be too time consuming for the participant, and it was therefore limited to 30
survey questions.

11 | 6 0
Methodology of Research
Design and Instrumentation
This research study was based on a descriptive survey that was distributed to gather
information on agricultural literacy, specifically by assessing the understanding of agriculture in
terms of agricultural crop geography. It has been recommended that researchers continue to
assess populations and programs while increasing the variety of populations and programs
assessed. Researchers should also identify areas of deficiency in research related to agricultural
literacy efforts and continue these efforts in the future (Kovar and Ball, 2013). This survey was
an attempt to answer this call and will hopefully provide value as a different approach to
assessing agricultural literacy. Aside from the aforementioned California Study (Hess and
Trexler, 2011), there has been relatively little research with combining both agriculture and
geography as a means to assess agricultural literacy rates.
The design of this survey was assembled from a composite of information from the
United States Department of Agriculture’s (USDA) National Agricultural Statistics Service
(NASS) which is based both on agricultural crop geography and agricultural crop statistics. It
was informed by combining elements of both regional and state historical data pertaining to
agricultural crops using the 2012 and 2007 Census of Agriculture (United Stated Department of
Agriculture, 2014; United Stated Department of Agriculture, 2014; 2009), which informed the
building of a set of questions that pertain to specific, highly productive agricultural areas of the
United States. Additionally, a single question was carefully constructed to inquire the respondent
about his or her knowledge of agricultural crops that are endemic (native) to the North American
continent. This survey design ensures a variety of questions which incorporate well-defined, but
different geographic elements—areas, regions, and states—with important agricultural crops in
order to collect data which can assist in visualizing the true understanding of how well adults
(from ages 18 to 42) know where agricultural crops are produced on a national level.
Careful consideration was given to which agricultural crops would be selected for this
survey. At first, there were originally over 50 crops from which to select. The final selection is
the result of analyzing the strength of the supporting data, especially after validation. Historical
crop maps were utilized from USDA-NASS to ensure that all the crops being used for the survey
were indeed produced in specific regions and states, regardless of how large or small their
monetary value is from agricultural production. Thus, crops such as apples, cherries, and pears
were added, as they are in fact from highly concentrated production areas, but may not be as
valuable as other crops. Other supporting data were used as well. These other supporting data
were used to ensure that the fiber and fuel components were added, and not only the food
component. Thus, crops such as cotton and canola were added without regard to their financial
contribution to the economy of the United States, but instead for the intrinsic value of their use.
The design for this cross-sectional survey was descriptive in nature, since the data
collected can be statistically inferred on a population. It was specifically conducted on the
electronic (Internet) platform Qualtrics, which is a reliable software program in a questionnaire
format. Aside from some dichotomous responses provided by the participant about demographic
information, all the questions were standardized. These predefined, multiple-choice and

12 | 6 0
multiple-answer questions, from which the respondent must choose, were based on facts for both
regional and state agricultural crop geography. The multiple-choice questions employed forced
responses, while the multiple-answer questions employed validation, which varied depending on
the number of answers suggested in the posed respective question. These close-ended questions
provided anonymity and encouraged honest responses from the sample population (Biemer,
2010; Blom and Korbmacher, 2013; Groves and Lyberg, 2010).
Sampling Strategy and Targeted Sample Population
This research was aimed at adults (from ages 18 to 42; the middle to oldest of
Generation X and the middle to youngest of generation Y, according to many sociological
definitions) (Merriam-Webster, 2016a; Merriam-Webster, 2016b), and therefore included
people who are currently in either their respective academic careers or who are active members
of the labor force. To ensure that participants of the desired ages were sampled for data
collection, branch logic, or conditional branching, was incorporated into the survey to eliminate
undesired participants upon answering demographically based questions (Biemer, 2010; Groves
and Lyberg, 2010).
The sampling strategy for the survey was a composite of both convenience and purposive
sampling. The survey was dispersed among the sample population via electronic mail to
individuals directly acquainted with the surveyor, including both personal and professional
organizations, (e.g., agricultural organizations, former military units, former academic
institutions, and civilian organizations of employment). While this is not completely accurate for
external validity (Groves and Lyberg, 2010), the use of these particular relationships—especially
their geographic facets—to reach these participants was anticipated to result in responses
collected from several states (Millar and Dillman, 2011). Several current and former armed
forces service members who are associated with the surveyor had already entertained this
approach by agreeing to participate as a respondent in the survey, with the intent on
communicating the amenable and companionable value of doing so, (i.e., incontestably “helping
out a fellow soldier” simply for being a former soldier). While the overall value of this
transcendental camaraderie is appreciated, its value here translated into the greater number of
participating respondents hailing from all over the United States and beyond. The nature of this
approach, especially involving current soldiers in the active component in the Unites States
Army, elicited responses from participants who had been raised and educated from childhood to
adulthood randomly throughout the United States, providing a varied sample population not
specific to one centralized location, despite many participants actually being in one centralized
location.
The survey was entirely anonymous and, therefore, strict confidentiality was both
intentionally and inadvertently observed. Participants maintained their anonymity and only basic
demographic data was collected. Participation in the survey was entirely voluntary in nature and
a statement of consent was included in both the invitation and the survey.
Error in sampling was avoided using clear, concise instructions and proper semantics
(Biemer, 2010). Additionally, the survey platform Qualtrics automatically calculated standard
deviation and errors for each survey question. Moreover, the survey platform Qualtrics allows

13 | 6 0
the surveyor to view the number of participants who respond completely and the amount of
participants who begin to respond, but who otherwise become disinterested in completing the
survey. Therefore, when incomplete responses are detected, answers were not used for
comparative and final analysis to ensure the elimination of bias resulting from non-response
error (Christian, Dillman, and Smyth, 2007; Groves and Lyberg, 2010).
Data Collection
The process of data collection commenced with the activation of the survey once it was
properly programmed into the Internet-based program Qualtrics and after the validated survey
questions were confirmed by an appropriate collaborator, a member of the student’s graduate
advisory committee (Groves and Lyberg, 2010). Once distributed after approved by the
Institutional Review Board (IRB), the survey was shared via the Internet through electronic mail,
disseminated to exactly 310 potential respondents. The electronic mail requests were generalized
advertisements that were in keeping with standard IRB protocols. The survey was distributed for
data collection in seven-day increments for a total of 21 days.
For the duration of three weeks, when the survey was active in Qualtrics, it was expected
to achieve at least an approximate 10 percent response rate, and it was reasonable to assume that
many more responses can be collected, especially considering the nature of the sample
population, which was a sample of convenience. Qualtrics accurately displayed response rates
and completion rates. Additionally, Qualtrics displayed when survey respondents initially began
the survey from their end, whether it is either through a computer or a smartphone application
(Vannette, 2015). After the 21-day IRB protocol, the survey was deactivated and data analysis
commenced. Out of 310 potential respondents, a total of 190 participated.
The results of the survey were analyzed as descriptive statistics in order to assess the
understanding of agricultural crop geography. After the responses were collected, the surveyor
applied measurement to the responses—in this case the amount of correct and incorrect answers.
The survey platform Qualtrics automatically prohibits the same IP (Internet Protocol) from
accessing the survey after it has been completed, whether from a computer or from a
smartphone. Therefore, each respondent could only participate once.
The survey platform Qualtrics allowed for cross-tabulation and tests of significance with
one-way analysis of variance (ANOVA), Chi-Squire, and T-tests. While cross-tabulation and
tests of significance were retroactively initiated with the collected data for further analysis, a
basic scoring method was utilized (non-aggregate; for each individual survey question which
applies) in order to describe the data.

14 | 6 0
Results and Discussion
The research question that guided this study was:
What is the knowledge level and understanding of where important agricultural
crops are historically and statistically grown in the United States in American adults,
ages 18 to 42?
The objectives for this study were to gather information on the ability for participants to:
describe ten agricultural crops which are endemic (native) to the North American continent
based on their centers of origin; describe five significant agricultural production areas within
one or more states of the United States; describe the historically and statistically leading regions
for the production of seven different agricultural crops in the United States; describe the
historically and statistically leading states (in their entirety) for the production of eleven
different agricultural crops in the United States; and, describe the basic physiographic
differences of two states (in their interior) and how it limits the production of agricultural crops.
The sample population used were American citizens ages 18 to 42. Out of a total of 310
potential participants, 190 respondents participated, with a 61.3% response rate. It was found that
the mean response rate for all correct answers was 52.7% for all individual answers, including
multiple-option questions in the survey. Within the survey, this scoring scheme applies to all
results, including the ‘Regions’ section, where it can be thought of as either an individual score
per answer or as an average of all the answers for a given question, but they are conveyed in
these summary results as an average. The median was 51.3%, while the mode was 38.9%.
Analysis and Synopsis
Native versus Non-Native Agricultural Crops: Identify ten agricultural crops which are
endemic (native) to the North American continent based on their centers of origin.
For native versus non-native agricultural crops, respondents averaged 58.3% for the
correct answers. Three crops, blueberries, common or wild strawberries, and sunflowers,
received selection rates higher than 70%, and two crops, black or wild raspberries and cucurbits,
received selection rates higher than 60%. Despite the accurate selection for many options, many
respondents, including some of the same ones who had answered correctly for other crops,
selected the inaccurate options. It was found that many respondents chose some of the world’s
oldest domesticated crops, such as apples, corn, oats, pears, potatoes, rice, and wheat, (many that
were domesticated thousands of years ago in Central Asia or the Middle East), for their answers
for crops thought to be native to North America.

15 | 6 0
Figure 1: Results for native versus non-native agricultural crops. Correct answers are marked by an asterisk*.
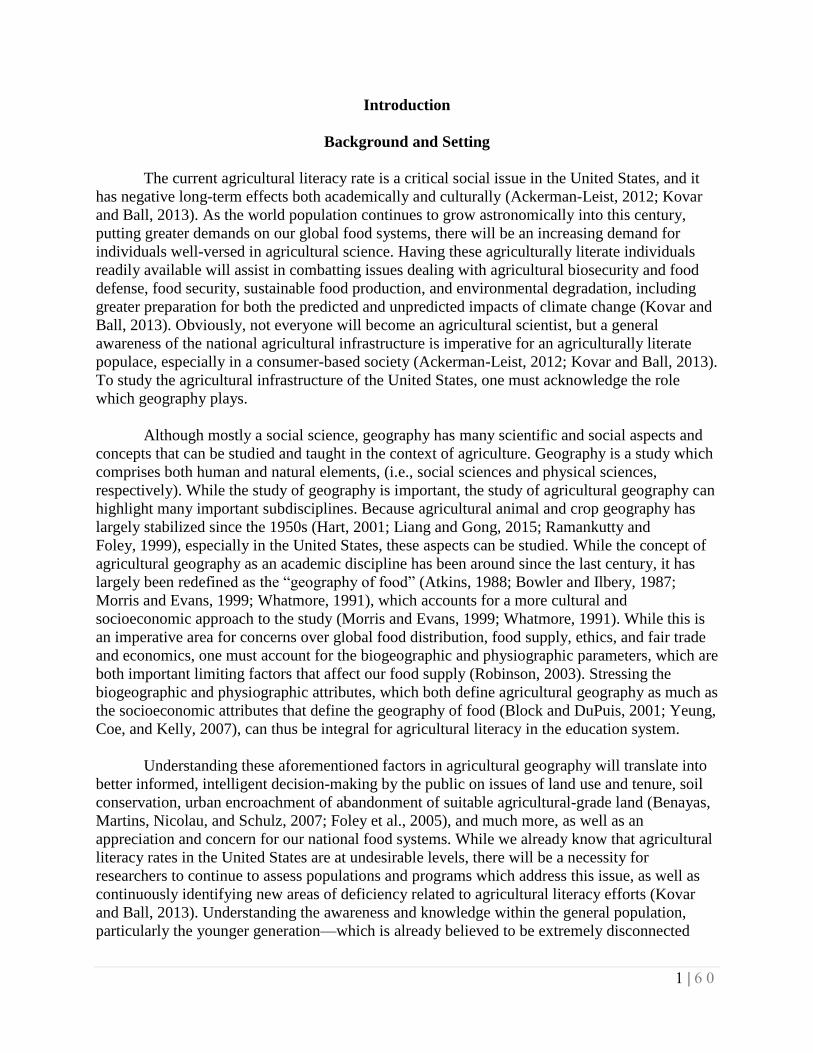
Significant Agricultural Crop Production Areas: Identify five significant agricultural
production areas within one or more states of the United States.
The questions for the significant agricultural crop production areas were placed in order
from what presumably would be the most well-known to the least-known agricultural crop
production areas, and the results suggested that this order was correct. However, it is unknown if
this order influenced the results. These highly-productive agricultural areas are often fertile
valleys and are economically vital to the nation’s total agricultural output, however, some are
more well-known than others. Some respondents knew the geographic location of some
significant agricultural crop production areas and some respondents did not.
0.0%
10.0%
20.0%
30.0%
40.0%
50.0%
60.0%
70.0%
80.0%
90.0%
100.0%
Per
centa
ge
of
Res
po
nd
ents
Figure 1: Native versus Non-Native Agricultural Crops

16 | 6 0
Figure 2: Results for significant agricultural crop production areas.
For both the San Joaquin and Columbia valleys, 69.5% and 54.2% of respondents
answered these questions correctly with California and with Washington and Oregon,
respectively. More respondents who claimed Washington as the state where they either received
all or most of their secondary knew the latter more than other respondents. It was after the San
Joaquin and Columbia Valleys that there was a noticeable decline in knowledge of significant
agricultural crop production areas beginning with the Willamette Valley, where 44.2% of
respondents answered this question correctly with Oregon. Additionally, 36.8% of respondents
admittedly did not know where the Willamette Valley is located or had never heard of it.
The results indicated that the Willamette Valley is not as well-known as the two
aforementioned areas; even 14 out of 61 total respondents who claimed Washington as the state
where they either received all or most of their secondary education admittedly did not know
where the Willamette Valley is located or had never heard of it. However, they knew more than
other respondents. For both the San Luis and Red River valleys, only 18.9% and 18.4% of
respondents answered this question correctly with Colorado and with Minnesota and North
Dakota, respectively. Additionally, 32.1% of respondents admittedly did not know where the San
Luis Valley is located or had never heard of it, while 30.5% of respondents admittedly did not
know where the Red River Valley is located or had never heard of it.
0.0% 10.0% 20.0% 30.0% 40.0% 50.0% 60.0% 70.0% 80.0% 90.0% 100.0%
Red River Valley
San Luis Valley
Willamette Valley
Columbia Valley
San Joaquin Valley
Percentage of Respondents
Figure 2: Significant Agricultural Crop Production Areas
All respondents who answered correctly
Washington-educated respondents who answered correctly
All respondents who admittedly did not know or had not heard of area
Washington-educated respondents who admittedly did not know or had not heard of area

17 | 6 0
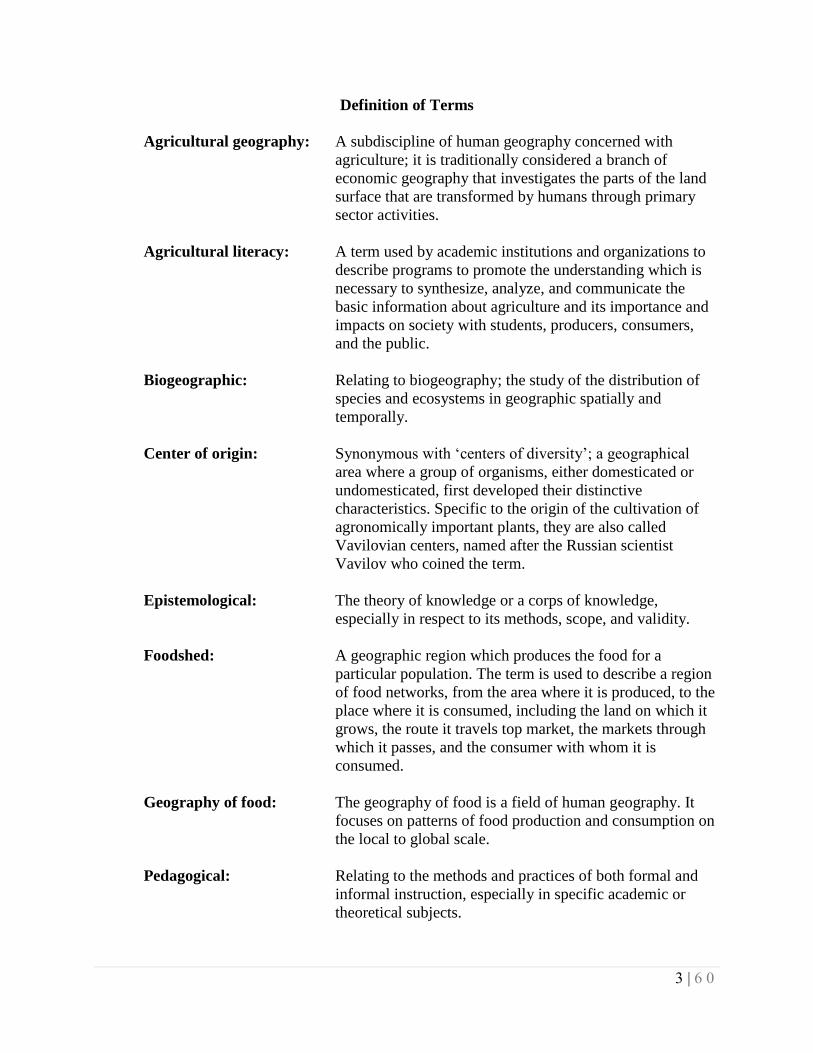
Regions: Identify the historically and statistically leading regions for the production of seven
different agricultural crops in the United States.
The questions for regions were based on where specific agricultural crops are produced
by region, as opposed to by state. Each of these questions were accompanied by a specially-
illustrated and specifically-labelled map of the conterminous United States (see Appendix C).
For all the questions in this section, respondents were forced to select the minimum amount of
answers that were required prior to moving on to the following section of the survey. However,
for some questions, they could select an additional answer that was relevant to that question.
Figure 3: Map of the United States for Regions
Figure 3: Map of the United States displaying regions for survey participants to select.

18 | 6 0
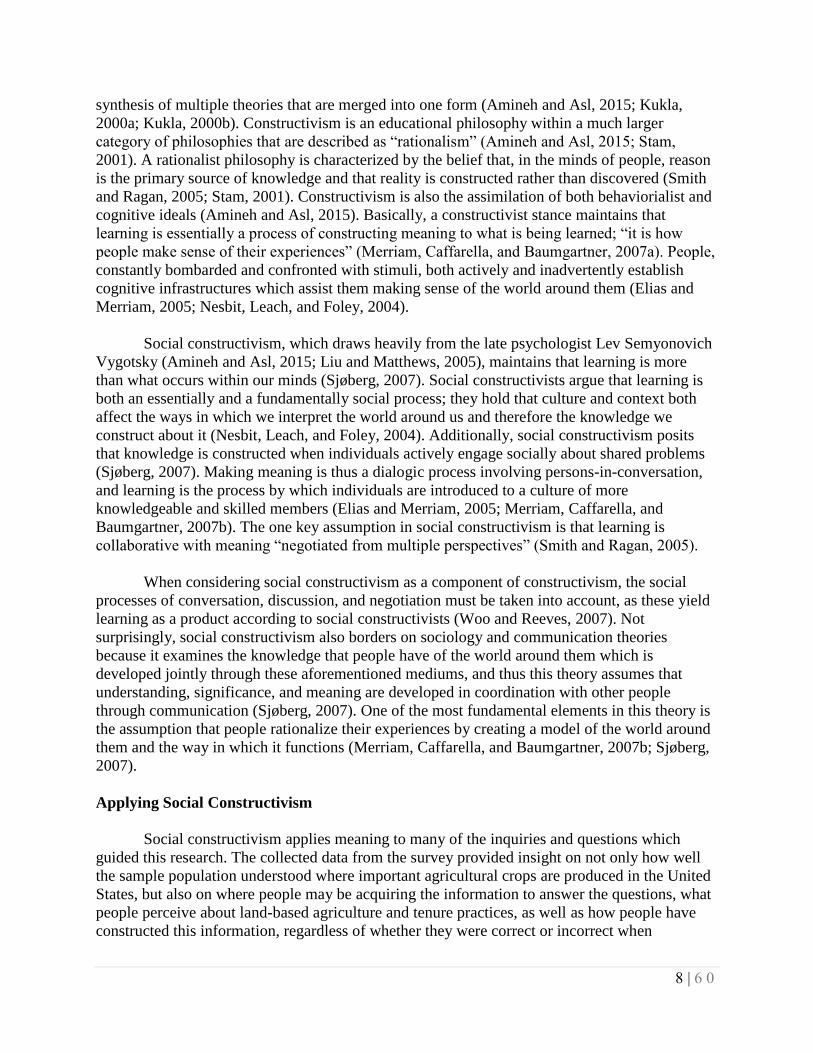
Figure 4: Result for regions.
For alfalfa and barley, respondents averaged 65.4% and 40.7% for the correct answers,
respectively. Many respondents who claimed many different states as the ones where they either
received all or most of their secondary education contributed to these results. While it was the
intention to use agricultural crops that are often used for direct human or processed for direct
human consumption in the survey, both alfalfa and barley are two agronomically important
crops. Alfalfa is a forage crop used for grazing, hay, and silage, thereby feeding hundreds of
millions of animals in the agricultural industry.
For corn and soybeans, respondents averaged 53.5% and 46.1% for the correct answers,
respectively. Region 5, while selected as an option by many respondents, did not receive as high
of a selection rate as the other two correct options, Regions 3 and 6. This suggests that many
people do not know that corn and soybeans are grown in the South. Another interesting find,
found through cross-tabulation, was that respondents appear to associate corn more with the
Great Plains region of the Midwest and not as much with the Great Lakes region.
For cotton (including all varieties) and peanuts (for all purposes), respondents averaged
72.3% and 51.6% for the correct answers, respectively. Additionally, for cotton, Region 5 itself
received a selection score of 95.3% and thus 181 out of 190 total respondents fared very
favorably with this answer option alone. Many respondents appeared to know that Texas and
New Mexico also produce significant amounts of both cotton and peanuts. However, only
exactly one-half (50.0%) of respondents who claimed California as the state where they either
received all or most of their secondary education, did not know that cotton was grown in their
region, Region 9.
For wheat, respondents averaged 65.1% for the correct answers. It was also found that
one-half (55.7%) of respondents who claimed Washington as the state where they either received
0.0%
10.0%
20.0%
30.0%
40.0%
50.0%
60.0%
70.0%
80.0%
90.0%
100.0%
Alfalfa Barley Corn Cotton Peanuts Soybeans Wheat
Per
centa
ge
of
Res
po
nd
ents
Figure 4: Regions
Mean correct answers for all respondents Mean incorrect respondents for all respondents

19 | 6 0
all or most of their secondary education did not select Region 10, and considering the sample
population, this may suggest that many people did not know that the Pacific Northwest is a
significant production region of wheat. These results are also consistent with people not knowing
that barley is produced in this region, which indicates that people do not know that the Pacific
Northwest is a significant region in the production of grains.
States (Entirety): Identify the historically and statistically leading states (in their entirety) for
the production of eleven different agricultural crops in the United States.
The questions for states (entirety) were based on where specific agricultural crops are
produced by state, as opposed to by region. Furthermore, the word ‘entirety’ is used to denote
that the entire states themselves are the focus, as opposed to a part of the state, or interior. Each
of these questions was accompanied by a regularly-labelled map of United States (see Appendix
C). Some of the answers in this section were comprised of only one state while others were
comprised of more than one; there were no more than five states per answer. For all questions in
this section, respondents were forced to select the one answer that was required to move to the
following section of the survey, however, for some questions, they could select an additional
answer that was relevant to that question.
Figure 5: Results for states in their entirety.
For the pome and stone fruits on the survey, (almonds, apples, cherries, and pears),
selection rates for the correct answers varied considerably; some of these crops have single
primary state of production, while others have several. For almonds, 70.5% of respondents
selected the correct answer, California. However, out of the 14 respondents who claimed
California as the state where they either received all or most of their secondary education, 35.7%
of them answered this question incorrectly. For apples, 61.6% of respondents selected correct
answer, Washington, New York, Michigan, and Pennsylvania. For cherries (including sweet and
0.0%
10.0%
20.0%
30.0%
40.0%
50.0%
60.0%
70.0%
80.0%
90.0%
100.0%
Per
centa
ge
of
Res
po
nd
ents
Figure 5: States (Entirety)
All respondents who answered correctly
20 | 6 0
tart varieties) and pears, 50.5% and 46.3% of respondents selected the correct answers,
respectively.
For canola (for oil), 31.6% of respondents selected the correct answer, North Dakota, and
for sugar beets (for sugar), 28.9% of respondents selected the correct answer, Minnesota, North
Dakota, Idaho, and Michigan. Additionally, as some questions in the survey were presented with
an additional answer that was relevant to that question, (allowing for the respondent to admit that
he or she may not know what the respective agricultural crop was), it was found that while most
people knew what canola is, 16.8% of respondents admittedly did not know what sugar beets (for
sugar) are.
For lemons, only 15.8% of respondents selected the correct answer, California and
Arizona. Furthermore, 84.2% of respondents thought that lemons are grown in Florida, when
California and Arizona are almost the sole producing states. It is interesting to note that while
60.0% of respondents who claimed Arizona as the state where they either received all or most of
their secondary education knew Arizona was a top producer of lemons, one-half (55.5%) of
respondents who claimed Florida as the state where they either received all or most of their
secondary education thought that Florida produced a significant number of lemons. For oranges,
67.4% of respondents selected the correct answer, Florida, California, and Arizona.
For potatoes (excluding sweet varieties), it was found that one-half (55.7%) of
respondents who claimed Washington as the state where they either received all or most of their
secondary education did not know that Washington was the nation’s top producer of potatoes,
only second to Idaho, although they fared better than other respondents, proportionally. For rice,
23.7% of respondents selected the correct answer, Arkansas, California, and Louisiana.
Moreover, 16.8% of respondents admittedly did not know that rice is produced in the United
States. Finally, for sunflowers (for both oil and seed), 20.0% of respondents selected the correct
answer, North Dakota and South Dakota.
States (Interior): Identify the basic physiographic differences two states (in their interior) and
how it limits the production of agricultural crops.
The one question for states (interior) was based on where specific agricultural crops are
produced within state, as opposed to individual states. Furthermore, the word ‘interior’ is used to
denote that the entire states themselves are the focus, as opposed to the whole of the state, or
entirety, thereby encouraging the respondent to focus on the regional, or interior, differences
within the state, particularly what physical features may influence where their important
agricultural crops can be produced. There were no maps accompanying the question in this
section, and only two states and two of their important agricultural crops were listed, Arkansas
and Colorado and rice and wheat, respectively. These states were chosen for the dichotomous
physiographic characteristics of their interiors, which undoubtedly affect the ability and capacity
to produce crops within different geographic areas inside their state boundaries. The correct
answer was “In Arkansas, rice is produced in the lower, easternmost areas, near to or at the
Mississippi River; in Colorado, wheat is produced in the lower, easternmost areas, away from the
Rocky Mountains,” with 46.3% of respondents selecting this correct option.

21 | 6 0
Implications, Recommendations, and Conclusion
Based on the results from the study, it appears that the knowledge and understanding of
where important agricultural crops are historically and statistically grown in the United States is
significantly low. The data gathered indicate that there are variabilities in both the knowledge
and understanding, depending on both the agricultural commodities and geographic locations,
and thus there are both high results and low results. Overall, however, the knowledge and
understanding of agricultural geography in America needs improvement.
Population and Sample
As this study used a sample of convenience based on the main author, the demographic
data were consistent with the attributes of the targeted sample population found within the
research’s data collection methodology, which was a significantly large number of enlisted
military personnel, and therefore was predominantly male. Although many military service
members responded, a more inclusive sample population is suggested for future research as
civilians were more adept to respond, probably due to access to both more personal time and
technology. This would also enable researchers to gather data that is more representative of the
entire national population.
Forty-four states and one territory were represented in the sample in the United States,
but 32.1% were residents of Washington and where they received all or most their secondary
education. This is also unboundedly an indication that this was a convenience sample, as
Washington is the main author’s home state. Although a significant number of respondents
hailed from one state, the associated data collected underlines the possible importance of future
research in individual states. This may warrant state-based agricultural literacy studies if
researchers use agricultural geography as a means of assessment.
The results for this study indicated that exactly one-tenth of all participants belonged to
an agricultural school organization during their secondary education. This is consistent with the
general population, as most high school students forego these agricultural school organizations
and either participate in other curricular activities, or none (Malecki, Israel, and Toro, 2004).
There were no significant differences between these two types of populations in the study, but
much larger sample would be needed to extrapolate any information for the disparity in
agricultural literacy rates based on agricultural crop geography.
In a previous study by Kovar and Ball (2013), they recommended that researchers
continue to assess populations and programs while increasing the variety of populations and
programs assessed. Additionally, a larger survey that included more demographics may be
warranted in an assessment of agricultural geography, as people of all ages and ethnic groups
have a conferred interest in agriculture to become more agricultural literate citizens of the United
States and the world (Frick, Birkenholz, Gardner, and Machtmes, 1995; Powell, Agnew, and
Trexler, 2008).
Perception, Culture, and Symbolism
22 | 6 0
There is a perception that the United States is the world’s “bread basket,” due to the
substantial amount of agricultural production, and this perception could have been the reason
why there was such a high response rate for many selections in the ‘Native versus Non-Native
Agricultural Crops’ section. The United States is one of the world’s largest exporters of
agricultural commodities, but these exports are only one-third of its total agricultural production
(Norton, Alwang, and Masters, 2015), mostly grains. Realistically, the United States imports
many of the crops that respondents thought were native to North America mostly out of
necessity, either due to demand or seasonal limitations.
In future studies, it may be advisable to include more crops limited to more specific
areas, and therefore more states should be included over regions, especially if there is a concern
for brevity in the research instrument. High-value horticultural, or permanent crops, may be more
reliable than low-value agricultural, or row crops. In other words, crops such as avocadoes and
pistachios could be used not only because of their higher visibility with consumers due to
marketing, but because the correct answers would be limited to probably no more than three
states, eliminating confusion and increasing reliability.
Perhaps it is not surprising that many respondents answered the survey question for
almonds correctly, since California is almost the world’s sole producer of almonds (United States
Department of Agriculture, 2014; 2009). In recent years there has been new marketing on the
health and nutritional benefits of almonds (Almond Board of California, 2016). In future studies,
it may be interesting to discern if people are not only aware of the crops that are more visible in
the marketplace, but also if they are more visible because of marketing.
While there were no respondents who claimed Hawai’i, Guam, or American Samoa as
the states or territories for where they either received all or most of their secondary education,
38.6% of respondents selected these incorrect answers. This suggests that respondents associate
rice with warm, tropical locations with traditionally Micronesian and Polynesian cultures. It is
also possible that some significant agricultural production areas were confusing because many
areas which incorporate Spanish names of origin, are undeniably omnipresent in many states. In
future studies, it would be reasonable and highly encouraged to see any correspondence between
agricultural geography and cultural factors.
Using cross-tabulation, it was found that all individual respondents who claimed the
states which are in Region 3 as the ones where they either received all or most of their secondary
education selected Region 3 for their answer for where they thought corn was produced, whereas
other respondents selected other answers, mostly Region 6. This may suggest that states such as
Nebraska are symbolic of corn and therefore synonymous with corn, even though Illinois has
historically and statistically produced more corn for decades. Once again, more research will
need to be conducted to ascertain how, when, and where people are provided this information
and under what abstractions and concepts they are retaining it.
Academic Implications and Recommendations
The secondary aims of this study were to be a new approach in the exploration and
development of methods which assess agricultural literacy, to identify the need for strengthening

23 | 6 0
academic curricula which are concerned with agriculture, and, to underscore the necessity to
address the current rates of agricultural literacy nationally, especially with a consumer-based
society which aspires to improve its ethics when it comes to all aspects and concerns of its food
systems.
Agricultural geography has within an incredible amount of information which can be
used to build academic curricula, however, the challenge is to identify basic approaches to the
understanding of these varied data, and to identify pedagogical techniques to present them from a
more geographical perspective. Agricultural literacy can be best achieved through curriculum
infusion in primary and secondary education. Curriculum infusion is the purposeful integration
of agricultural subjects and topics into the mandated curriculum in public schools. Thus, formal
education, beginning in elementary and through high school, is the logical approach by which to
assist people develop an understanding of their agricultural food system; where food is produced
and why it is produced there (King, 2007; Hess and Trexler, 2011; Malecki, Israel, and
Toro, 2004). Agricultural geography can include the study of both animal-based and crop-based
spatial phenomena, the patterns of land tenure and use associated with the many types of
agriculture, and both the human (social sciences) and natural (physical sciences) factors that
interrelate with crops and animals, including production and distribution. Since agriculture draws
from so many subdisciplines and it is an applied study, it becomes necessary to draw from these
several subdisciplines for lesson coherence.
According to Spielmaker and Leising (2013), there are five main academic benchmarks
related to agricultural literacy. In their National Agricultural Literacy Outcomes, they provide
five themes which academic administrators and instructors can use to build agricultural curricula.
These themes, in order, are: ‘Agriculture and the Environment’, ‘Plant and Animals for Food,
Fiber, and Energy’, ‘Food, Health, and Lifestyle’, ‘Science, Technology, Engineering, and
Mathematics’, and, ‘Culture, Society, Economy and Geography’. Out of these five themes, three
of them are influenced by geography, which are ‘Agriculture and the Environment’, ‘Plant and
Animals for Food, Fiber, and Energy’, and ‘Culture, Society, Economy and Geography’. These
themes describe how agriculture has transformed natural ecosystems to meet societal needs, and
how it is important to understand the areas, components, and processes within agricultural
activities, including the dependence and interactions of living organisms and their environments.
They describe how geographic location affects climate, and how this determines what plants will
grow where and, historically, what humans and animals will generally eat, as well as what
materials will be available for building shelter, for making clothing, and for providing fuel.
Additionally, they describe how these agricultural commodities are transported thousands of
miles from where they were produced to where they are consumed.
Conclusion
It is both apparent and clear that agricultural geography can be used as a practical tool for
the continuous assessment of agricultural literacy, especially here in the United States where a
wide variety of historical and statistical agricultural crop data can be used in developing these
assessments, because agricultural crop geography has largely stabilized since the 1950s
(Hart, 2001; Liang and Gong, 2015; Ramankutty and Foley, 1999).

24 | 6 0
The agricultural frontier is constantly advancing, and, in more recent times, agricultural
production practices have been intensified. This presents economic and environmental
challenges as the augmentation of food, fiber, and fuel production are necessary to sustain a
growing world population (Benayas, Martins, Nicolau, and Schulz, 2007). Thus, an
agriculturally literate society is needed for the continued success of the agricultural industry
(Kovar and Ball, 2013; Hess and Trexler, 2011). Knowing and understanding where some of the
most important agricultural resources are produced is undoubtedly on of the first steps to
improve and revitalize agricultural literacy, especially right here in America.

25 | 6 0
References
Ackerman-Leist, P. (2012). Rebuilding the Foodshed: How to Create Local, Sustainable, and
Secure Food Systems. White River Junction, Vermont: Chelsea Green Publishing.
Agnew, D. M., and McJunkin, M. (2005). Evolution of the agricultural literacy movement:
impact on the environment and student learning. The International Journal of
Learning, 11 (1). Accessed 16 February, 2016 from
http://iji.cgpublisher.com/product/pub.30/prod.402
Almond Board of California. (2016). Almond Board of California | Resources | Almond
Almanac and Industry Statistics. Retrieved February 16, 2016, from
http://www.almonds.com/processors/resources/almond-almanac
American Farm Bureau Foundation for Agriculture. (2015a). American Farm Bureau
Foundation for Agriculture | What is Agricultural Literacy? Accessed February 16, 2016,
from http://www.agfoundation.org/what-is-ag-literacy
American Farm Bureau Foundation for Agriculture. (2015b). American Farm Bureau
Foundation for Agriculture — What We Do. Accessed February 16, 2016, from
http://www.agfoundation.org/what-we-do
Amineh, R. J., and Asl, H. D. (2015). Review of constructivism and social constructivism.
Journal of Social Sciences, Literature, and Languages, 1 (1), 9–16. Accessed February
16, 2016 from http://blue-ap.org/j/List/4/iss/volume%201%20(2015)/issue%2001/2.pdf
Atkins, P. J. (1988). Redefining agricultural geography as the geography of food. Area, 20 (3),
281–283. Retrieved from DOI: 10.1016/0743-0167(03)00041
Benayas, J. R., Martins, A., Nicolau, J. M., and Schulz, J. J. (2007). Abandonment of
agricultural land: an overview of drivers and consequences. Perspectives in Agriculture,
Veterinary Science, Nutrition and Natural Resources, 2, 1–14. Retrieved from DOI:
10.1079/pavsnnr20072057
Biemer, P. P. (2010). Total survey error: design, implementation, and evaluation. Public
Opinion Quarterly, 74 (5), 817–848. Retrieved from DOI: 10.1093/poq/nfq058
Block, D., and DuPuis, E. M. (2001). Making the country work for the city: von Thünen's ideas
in geography, agricultural economics, and the sociology of agriculture. American
Journal of Economics and Sociology, 60 (1), 79–98. Retrieved from DOI: 10.1111/1536-
7150.t01-2-00055
Blom, A. G., and Korbmacher, J. M. (2013). Measuring interviewer characteristics pertinent to
social surveys: a conceptual framework. Survey Methods: Insights from the Field.
Retrieved from DOI: 10.13094/smif-2013-00001

26 | 6 0
Bockheim, J. G. (2014). Chapter 3: Anthropic and Plaggen Epipedons: Products of Human
Disturbance. Ins Soil Geography of the USA: A Diagnostic-Horizon Approach (pp. 13–
20). New York, New York: Springer.
Boryan, C., Yang, Z., Mueller, R., and Craig, M. (2011). Monitoring U.S. agriculture: The
United States Department of Agriculture, National Agricultural Statistics Service,
Cropland Data Layer Program. Geocarto International, 26, 341–358. Retrieved from
DOI: 10.1080/10106049.2011.562309
Bowler, I. R., and Ilbery, B. W. (1987). Redefining agricultural geography. Area, 19 (4), 327–
332. Accessed February 16, 2016, from http://www.jstor.org/stable/20002508
Brown, L. R. (2009). Chapter 9: Feeding Eight Billion People Well. In Plan B 4.0: Mobilizing
to Save Civilization (pp. 216–238). New York, New York: W. W. Norton and Company.
Christian, L. M., Dillman, D. A., and Smyth, J. D. (2007). Helping respondents get it right the
first time: the influence of words, symbols, and graphics in web surveys. Public Opinion
Quarterly, 71 (1), 113–125. Retrieved from DOI: 10.1093/poq/nfl039
Combes, P. P., Mayer, T., and Thisse, J. T. (2008). Economic Geography: The Integration of
Regions and Nations. Princeton, New Jersey: Princeton University Press.
Dicken, P. (2003). Global Shift: Reshaping the Global Economic Map in the 21st Century. New
York, New York: Guilford.
Dillman, D. A., Smyth, J., and Christian, L. (2009). Internet, Mail, and Mixed-Mode Surveys:
The Tailored Design Method. New York, New York: John Wiley and Sons.
Elias, J. L., & Merriam, S. B. (2005). Chapter VII: Analytic Philosophy of Adult Education. In
Philosophical Foundations of Adult Education (3rd ed., pp. 187–215). Malabar, Florida:
Krieger.
Foley, J. A., DeFries, R., Asner, G. P., Barford, C., Bonan, G., Carpenter, S. R., … Snyder, P.
K. (2005). Global consequences of land use. Science, 309, 570–574. Retrieved from
DOI: 10.1126/science.1111772
Frick, M. J., Birkenholz, R. J., Gardner, H., and Machtmes, K. (1995). Rural and urban inner-
city high school student knowledge and perception of agriculture. Journal of
Agricultural Education, 36 (4), 1–9. Retrieved from DOI: 10.5032/jae.1995.04001
Fritz, S., See, L., McCallum, I., You, L., Bun, A., Moltchanova, E., … Obersteiner, M. (2015).
Mapping global cropland and field size. Global Change Biology, 21, 1980–1992.
Retrieved from DOI: 10.1111/gcb.12838
Grigg, D. (1995a). Chapter 1: Introduction. In An Introduction to Agricultural
Geography (2nd ed., pp. 17–25). New York, New York: Routledge.
27 | 6 0
Grigg, D. (1995b). Chapter 2: The Biology of Agriculture. In An Introduction to Agricultural
Geography (2nd ed., pp. 26–35). New York, New York: Routledge.
Grigg, D. (1995c). Chapter 3: Climate and Crops. In An Introduction to Agricultural
Geography (2nd ed., pp. 36–56). New York, New York: Routledge.
Groves, R. M., and Lyberg, L. (2010). Total survey error: Past, present, and future. Public
Opinion Quarterly, 74 (5), 849–879. Retrieved from DOI: 10.1093/poq/nfq065
Han, W., Yang, Z., Di, L., Yagci, A. L., and Han, S. (2014). Making cropland data layer data
accessible and actionable in GIS education. Journal of Geography, 113 (3), 129–138.
Retrieved from DOI: 10.1080/00221341.2013.838286
Hart, J. F. (2001). Half a century of cropland change. Geographical Review, 91 (3), 525–543.
Retrieved from DOI: 10.2307/3594739
Hess, A. J., and Trexler, C. J. (2011). A qualitative study of agricultural literacy in urban youth:
understanding for democratic participation in renewing the agri-food system. Journal of
Agricultural Education, 52 (2), 151–162. Retrieved from DOI: 10.5032/jae.2011.02151
Hess, D. (2011a). Chapter 8: Climate and Climate Change. In Physical Geography: A
Landscape Appreciation (10th ed., pp. 188–223). Upper Saddle River, New Jersey:
Pearson — Prentice Hall.
Hess, D. (2011b). Chapter 12: Soils. In Physical Geography: A Landscape Appreciation
(10th ed., pp. 322–351). Upper Saddle River, New Jersey: Pearson - Prentice Hall.
Jones, J. W., Hansen, J. W., Royce, F. S., and Messina, C. D. (2000). Potential benefits of
climate forecasting to agriculture. Agriculture, Ecosystems and Environment, 82 (1–3),
169–184. Retrieved from DOI: 10.1016/0167-8809(00)00225-5
King, J. (2007, May 9). The high stakes in science education: risking the roots of American
productivity. Education Week, 26 (36), 34–44. Accessed February 16, 2016, from
http://www.edweek.org/ew/articles/2007/05/09/36king.h26.html
Kovar, K. A., and Ball, A. L. (2013). Two decades of agricultural literacy research: a synthesis
of the literature. Journal of Agricultural Education, 54 (1), 167–178. Retrieved from
DOI: 10.5032/jae.2013.01167
Kukla, A. (2000a). Chapter 1: Defining constructivism. In Social Constructivism and the
Philosophy of Science (pp. 1–6). New York, New York: Routledge.
Kukla, A. (2000b). Chapter 2: Constructivism and the sociology of scientific knowledge. In
Social Constructivism and the Philosophy of Science (pp. 7–18). New York, New York:
Routledge.
28 | 6 0
Kukla, A. (2000c). Chapter 9: Constructive empiricism and social constructivism. In Social
Constructivism and the Philosophy of Science (pp. 59–67). New York, New York:
Routledge.
Liang, L., and Gong, P. (2015). Evaluation of global land cover maps for cropland area
estimation in the conterminous United States. International Journal of Digital Earth, 8
(2), 102–117. Retrieved from DOI: 10.1080/17538947.2013.854414
Liu, C. H. and Matthews, R. (2005). Vygotsky’s philosophy: constructivism and its criticisms
examined. International Education Journal, 6 (3), 386–399. Accessed February 16,
2016, from http://files.eric.ed.gov/fulltext/EJ854992.pdf
Luck, J., Spackman, M., Freeman, A., Trębicki, P., Griffith, W., Finlay, K., and Chakraborty, S.
(2011). Climate change and diseases of food crops. Plant Pathology, 60, 113–121.
Retrieved from DOI: 10.1111/j.1365-3059.2010.02414.x
Lutgens, F. K., and Tarbuck, E. J. (2010a). Chapter 14: The Changing Climate. In The
Atmosphere: An Introduction to Weather (11th ed., pp. 384–413). Upper Saddle River,
New Jersey: Pearson — Prentice Hall.
Lutgens, F. K., and Tarbuck, E. J. (2010b). Chapter 15: World Climates. In The Atmosphere: An
Introduction to Weather (11th ed., pp. 414–453).
Malecki, C. L., Israel, G. D., and Toro, E. (2004). Using "Ag in the Classroom" Curricula:
Teachers’ Awareness, Attitudes and Perceptions of Agricultural Literacy (AEC 370).
Gainesville, Florida: University of Florida — Institute of Food and Agricultural Sciences
(IFAS) Extension Service.
McMahon, M., Kofranek, A. M., and Rubatzky, V. E. (2011a). Chapter 20: Temperate Fruit and
Nut Crops. In Plant Science: Growth, Development, and Utilization of Cultivated Plants
(5th ed., pp. 442–488). Upper Saddle River, New Jersey: Pearson Education — Prentice
Hall.
McMahon, M., Kofranek, A. M., and Rubatzky, V. E. (2011b). Chapter 21: Tropical and
Subtropical Crops and Crop Production Systems. In Plant Science: Growth,
Development, and Utilization of Cultivated Plants (5th ed., pp. 489–516). Upper Saddle
River, New Jersey: Pearson Education — Prentice Hall.
Merriam, S. B., Caffarella, R. S., and Baumgartner, L. M. (2007a). Part Two: Adult Learning
Theory and Models — Chapter 7: Experience and Learning. In Learning in Adulthood:
A Comprehensive Guide (3rd ed., pp. 159–186). San Francisco, California: Jossey-Bass.
Merriam, S. B., Caffarella, R. S., and Baumgartner, L. M. (2007b). Part Four: Learning and
Development — Chapter Eleven: Traditional Learning Theories. In Learning in

29 | 6 0
Adulthood: A Comprehensive Guide (3rd ed., pp. 275–297). San Francisco, California:
Jossey-Bass.
Merriam-Webster. (2016a). Merriam-Webster | Dictionary | Definition of Generation X.
Accessed February 16, 2016, from http://www.merriam-
webster.com/dictionary/Generation%20X
Merriam-Webster. (2016b). Merriam-Webster | Dictionary | Definition of Millennial.
Accessed February 16, 2016, from http://www.merriam-
webster.com/dictionary/Generation%20Y
Millar, M. M., and Dillman, D. A. (2011). Improving response to web and mixed-mode
surveys. Public Opinion Quarterly, 75 (2), 249–269. Retrieved from DOI:
10.1093/poq/nfr003
Miller, G. T. (2005a). Chapter 14: Food and Soil Resources. In Living in the Environment
(14th ed., pp. 273–304). Pacific Grove, California: Brooks/Cole — Thompson Learning.
Miller, G. T. (2005b). Chapter 8: Food, Soil, and Pest Management. In Sustaining the Earth
(8th ed., pp. 148–170). Pacific Grove, California: Brooks/Cole — Thompson Learning.
Morris, C., and Evans, N. J. (1999). Research on the geography of agricultural change:
redundant or revitalized? Area, 31 (4), 349–358. Retrieved from DOI: 10.1111/j.1475-
4762.1999.tb00101.x
Nesbit, T., Leach, L., and Foley, G. (2004). Part I: Our Approach — Chapter 5: Teaching
Adults. In Foley, G., Dimensions of Adult Learning: Adult Education and Training in A
Global Era (pp. 74–95). Columbus, Ohio: McGraw-Hill — Education
National Agriculture in the Classroom. (2016). National Agriculture in the Classroom |
Agricultural Literacy | What is agricultural literacy? Retrieved July 16, 2016, from
https://www.agclassroom.org/get/literacy.html
National Geographic Education. (2016). National Geographic Education | Weather and
Agriculture Archived Lesson. Accessed February 16, 2016, from
http://education.nationalgeographic.org/archive/xpeditions/lessons/08/g912/globalclimat
e.html
Norton, G. W., Alwang, J., and Masters, W. A. (2015). Part 5: Agricultural Development in an
Interdependent World — Chapter 16: Agriculture and International Trade. In Economics
of Agricultural Development: World Food Systems and Resource Use (3rd ed., p. 323–
343). New York, New York: Routledge.
Osman, K. T. (2013). Chapter 12: Soil Resources and Soil Degradation. In Soils: Principles,
Properties, and Management (pp. 175–214). New York, New York: Springer.

30 | 6 0
Padgham, J. (2009). Agricultural Development under a Changing Climate: Opportunities and
Challenges for Adaptation. Washington, District of Columbia: The International Bank
for Reconstruction and Development — Agricultural and Rural Development and
Environmental Departments.
Powell, D., Agnew, D., and Trexler, C. J. (2008). Agricultural literacy: clarifying a vision for
practical application. Journal of Agricultural Education, 49 (1), 85–98. Retrieved from
DOI: 10.5032/jae.2008.01085
Rahman, A. (2007). Chapter 8: Application of Remote Sensing and GIS Technique for Urban
Environmental Management and Sustainable Development of Delhi, India. In Netzband,
M., Stefanov, W. L., and Redman, C., Applied Remote Sensing for Urban Planning,
Governance, and Sustainability (pp. 165–197). New York, New York: Springer.
Ramankutty, N., Evan, A. T., Monfreda, C., and Foley, J. A. (2008). Farming the planet:
Geographic distribution of global agricultural lands in the year 2000. Global
Biogeochemical Cycles, 22. Retrieved from DOI: 10.1029/2007gb002952
Ramankutty, N., and Foley, J. A. (1999). Estimating historical changes in land cover: North
American croplands from 1850 to 1992. Global Ecology and Biogeography, 8 (5), 381–
396. Retrieved from DOI: 10.1046/j.1365-2699.1999.00141.x
Randolph, J. (2012). Chapter 6: Soils, Agriculture, and Land Use. In Environmental Land Use
Planning and Management: Creating Sustainable Communities, Watersheds, and
Ecosystems (2nd ed., pp. 143–185). Washington, District of Columbia: Island Press —
Center for Resource Economics.
Robinson, G. M. (2003). Geographies of Agriculture: Globalization, Restructuring and
Sustainability. New York, New York: Routledge.
Rumney, T. A. (1984). A course in agricultural geography: a systems approach. The Social
Studies, 75 (1), 24–27. Retrieved from DOI: 10.1080/00377996.1984.10114412
Scholz, R. W. (2011a). Part I Invention of the environment: Origins, transdisciplinarity, and
theory of science perspectives — Chapter 2: From environmental literacy to
transdisciplinarity. In Environmental Literacy in Science and Society (pp. 15–28).
Cambridge, United Kingdom: Cambridge University Press.
Scholz, R. W. (2011b). Part I Invention of the environment: Origins, transdisciplinarity, and
theory of science perspectives — Chapter 3: Basic epistemological assumptions. In
Environmental Literacy in Science and Society (29–43). Cambridge, United Kingdom:
Cambridge University Press.
See, L., Fritz, S., You, L., Ramankutty, N., Herrero, M., Justice, C., … Obersteiner, M. (2014).
Improved global cropland data as an essential ingredient for food security. Global Food
Security, 4, 37–45. Retrieved from DOI: 10.1016/j.gfs.2014.10.004

31 | 6 0
Shelerud, S. (2016). National Council for Geographic Education: Top 10 ideas for Agricultural
Geography. Accessed February 16, 2016, from http://www.ncge.org/top-10-ideas-for-
agricultural-geography
Sjøberg, S. (2007). Constructivism and Learning. In Baker, E., McGaw, B., and Peterson P.,
International Encyclopaedia of Education (3rd ed., pp. 485–490). Oxford, United
Kingdom: Elsevier.
Smith, P. L., and Ragan, T. J. (2005). Section I: Introduction — Chapter 2: Foundations of
Instructional Design. In Instructional Design (3rd ed., pp. 17–37). San Francisco,
California: Jossey-Bass.
Spielmaker, D. M., and Leising, J. G. (2013). National Agricultural Literacy Outcomes. Logan,
UT: Utah State University — School of Applied Sciences and Technology.
Stam, H. J. (2001). Social constructionism and its critics. Theory and Psychology, 11 (3), 291–
296. Retrieved from DOI: 10.1177/0959354301113001
United States Department of Agriculture. (2009). 2007 Census of Agriculture — United States
Summary and State Data Volume 1 — Geographic Area Series — Part 51 (AC-07-A-
51). United States Department of Agriculture — National Agricultural Statistics Service.
United States Department of Agriculture. (2014). 2012 Census of Agriculture — United States
Summary and State Data — Volume 1 — Geographic Area Series — Part 51 (AC-12-A-
51). United States Department of Agriculture — National Agricultural Statistics Service.
United States Department of Education. (2016). United States Department of Education |
Archived Information | Speeches | Agricultural Education in the 21st Century: Secretary
Arne Duncan's Remarks at the FFA Convention (October 21, 2010).
Accessed February 16, 2016, from
http://www.ed.gov/news/speeches/agriculturaleducation21stcenturysecretaryarneduncan
sremarksffaconvention
Vannette, D. (2015). Qualtrics, Incorporated | Sources of Error in Survey Research. Accessed
February 16, 2016, from http://www.qualtrics.com/blog/sources-of-error-in-survey-
research/
Vermeulen, S. J., Aggarwal, P. K., Ainslie, A., Angelone, C., Campbell, B. M., Challinor, A. J.,
… Wollenberg, E. (2010). Climate Change, Agriculture, and Food Security -
Agriculture, Food Security, and Climate Change: Outlook for Knowledge, Tools, and
Action (CCAFS-3). New York, New York: Consultative Group on International
Agricultural Research (CGIAR) and Earth System Science Partnership (ESSP).
Waldner, F., Fritz, S., Di Gregorio, A., and Defourny, P. (2015). Mapping priorities to focus
cropland mapping activities: fitness assessment of existing global, regional and national

32 | 6 0
cropland maps. Remote Sensing, 7, 7959–7986. Retrieved from DOI:
10.3390/rs70607959
Whatmore, S. (1991). Agricultural geography. Progress in Human Geography, 15 (3), 303–310.
Retrieved from DOI: 10.1177/030913259101500306
Woo, Y., and Reeves, T. C. (2007). Meaningful interaction in web-based learning: A social
constructivist interpretation. The Internet and Higher Education, 10 (1), 15–25.
Retrieved from DOI: 10.1016/j.iheduc.2006.10.005
Yeung, H. W. C., Coe, N., and Kelly, P. F. (2007). Economic Geography: A Contemporary
Introduction. Hoboken, New Jersey: John Wiley and Sons.

33 | 6 0
Appendices
Appendix A: Survey Questions
Correct answers are emboldened.
Native versus Non-Native Agricultural Crops
The one following question will ask which agricultural crops come from North America. All
plants, and therefore many domesticated agricultural crops, have centers of origin, or places from
where they originally evolved. Thus, some plants may be native to some areas, while non-native,
(or even invasive), in other areas.
Question 1. Which ten (10) agricultural crops are naturally native to North America? Please
select all which you believe most apply. Note: North America, for this survey, is considered and
defined as only the present-day nations of Canada and the United States, and, therefore, excludes
present-day Mexico.
Apples
Black or wild cherries
Black or wild raspberries
Black or wild walnuts
Blueberries
Cacao
Common or wild strawberries
Corn
Cucurbits (such as pumpkins, squash, and zucchini)
Cranberries
Grapes (such as Muscadine, Scuppernong, and other “New World” grapes)
Grapes (such as Aragónez, Cabernet Franc, Gewürztraminer, and other “Old World” grapes)
Oats
Pears
Pecans
Potatoes
Rice
Sunflowers
Vanilla
Wheat
Validation was employed. The respondent was forced to select at least ten and no more than ten
answers in order to commence with the survey.
Significant Agricultural Crop Production Areas
The following questions will ask where some important agricultural production areas occur in
the United States. There exist many highly productive agricultural areas, which are of great

34 | 6 0
significance to the economy of the United States. One of the most common types of these areas
occur in natural valleys with deep, rich soil. Overtime, these areas have become famous are, not
surprisingly, synonymous with agriculture.
Question 2. In which one (1) state is the San Joaquin Valley located? Please select the one state
which you believe most applies.
California
Arizona
New Mexico
Texas
I do not know, or, I have never before heard of the San Joaquin Valley
Question 3. In which two (2) states is the Columbia Valley primarily located? Please select the
two states which you believe most apply.
California and Oregon
Washington and Oregon
Virginia and Maryland
Maryland and Pennsylvania
I do not know, or, I have never before heard of the Columbia Valley
Question 4. In which one (1) state is the Willamette Valley located? Please select the one state
which you believe most applies.
California
Pennsylvania
Oregon
Utah
I do not know, or, I have never before heard of the Willamette Valley
Question 5. In which one (1) state is the San Luis Valley located? Please select the one state
which you believe most applies.
California
Washington
Texas
Colorado
I do not know, or, I have never before heard of the San Luis Valley
Question 6. Between which two (2) states is the Red River Valley primarily located? Please
select the two states which you believe most apply.
Minnesota and North Dakota
Colorado and Utah
Montana and Wyoming
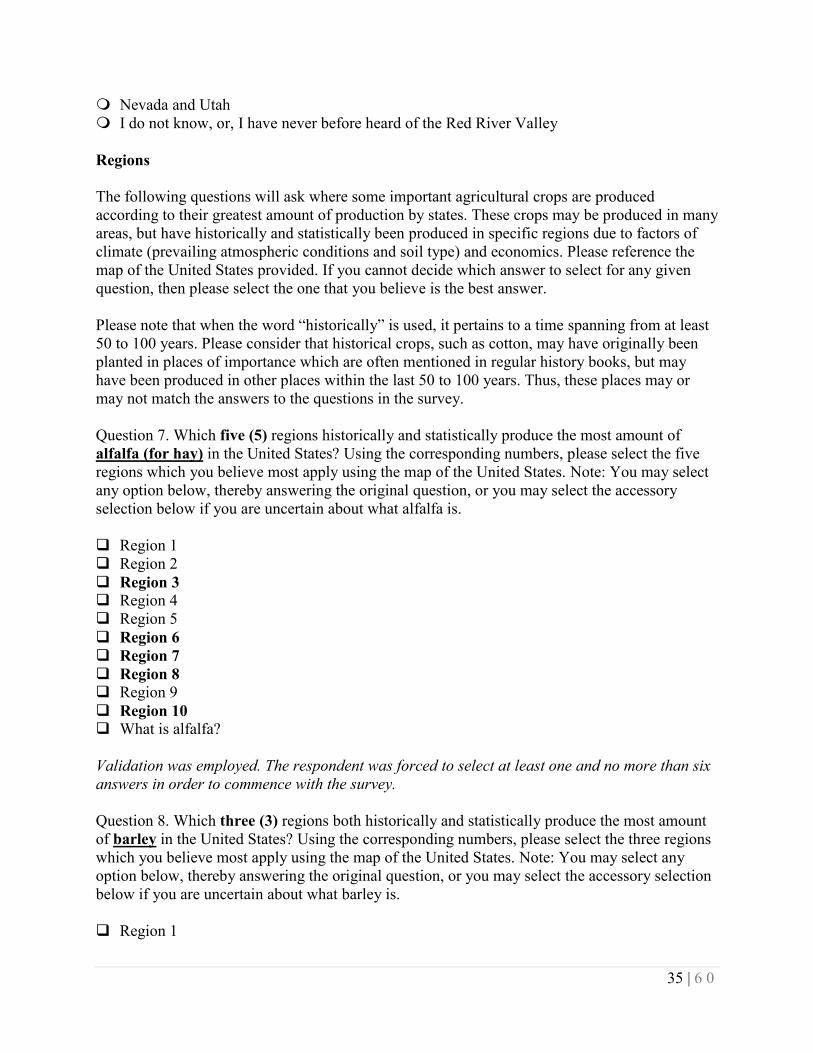
35 | 6 0
Nevada and Utah
I do not know, or, I have never before heard of the Red River Valley
Regions
The following questions will ask where some important agricultural crops are produced
according to their greatest amount of production by states. These crops may be produced in many
areas, but have historically and statistically been produced in specific regions due to factors of
climate (prevailing atmospheric conditions and soil type) and economics. Please reference the
map of the United States provided. If you cannot decide which answer to select for any given
question, then please select the one that you believe is the best answer.
Please note that when the word “historically” is used, it pertains to a time spanning from at least
50 to 100 years. Please consider that historical crops, such as cotton, may have originally been
planted in places of importance which are often mentioned in regular history books, but may
have been produced in other places within the last 50 to 100 years. Thus, these places may or
may not match the answers to the questions in the survey.
Question 7. Which five (5) regions historically and statistically produce the most amount of
alfalfa (for hay) in the United States? Using the corresponding numbers, please select the five
regions which you believe most apply using the map of the United States. Note: You may select
any option below, thereby answering the original question, or you may select the accessory
selection below if you are uncertain about what alfalfa is.
Region 1
Region 2
Region 3
Region 4
Region 5
Region 6
Region 7
Region 8
Region 9
Region 10
What is alfalfa?
Validation was employed. The respondent was forced to select at least one and no more than six
answers in order to commence with the survey.
Question 8. Which three (3) regions both historically and statistically produce the most amount
of barley in the United States? Using the corresponding numbers, please select the three regions
which you believe most apply using the map of the United States. Note: You may select any
option below, thereby answering the original question, or you may select the accessory selection
below if you are uncertain about what barley is.
Region 1

36 | 6 0
Region 2
Region 3
Region 4
Region 5
Region 6
Region 7
Region 8
Region 9
Region 10
What is barley?
Validation was employed. The respondent was forced to select at least one and no more than
four answers in order to commence with the survey.
Question 9. Which three (3) regions both historically and statistically produce the most amount
of corn (for both grain and seed) in the United States? Using the corresponding numbers,
please select the three regions which you believe most apply using the map of the United States.
Note: You may select any option below, thereby answering the original question, or you may
select the accessory selection below if you are uncertain about how corn is used for both grain
and seed.
Region 1
Region 2
Region 3
Region 4
Region 5
Region 6
Region 7
Region 8
Region 9
Region 10
What it meant by for “both grain and seed”?
Validation was employed. The respondent was forced to select at least one and no more than
four answers in order to commence with the survey.
Question 10. Which four (4) regions both historically and statistically produce the most amount
of cotton (including all varieties) in the United States? Using the corresponding numbers,
please select the four regions which you believe most apply using the map of the United States.
Region 1
Region 2
Region 3
Region 4
Region 5
Region 6

37 | 6 0
Region 7
Region 8
Region 9
Region 10
Validation was employed. The respondent was forced to select at least four (4) and no more than
four answers in order to commence with the survey.
Question 11. Which three (3) regions both historically and statistically produce the most number
of peanuts (for all purposes) in the United States? Using the corresponding numbers, please
select the three regions which you believe most apply using the map of the United States.
Region 1
Region 2
Region 3
Region 4
Region 5
Region 6
Region 7
Region 8
Region 9
Region 10
Validation was employed. The respondent was forced to select at least three and no more than
three answers in order to commence with the survey.
Question 12. Which three (3) regions both historically and statistically produce the most number
of soybeans in the United States? Using the corresponding numbers, please select the three
regions which you believe most apply using the map of the United States.
Region 1
Region 2
Region 3
Region 4
Region 5
Region 6
Region 7
Region 8
Region 9
Region 10
Validation was employed. The respondent was forced to select at least three and no more than
three answers in order to commence with the survey.

38 | 6 0
Question 13. Which four (4) regions both historically and statistically produce the most amount
of wheat in the United States? Using the corresponding numbers, please select the four regions
which you believe most apply using the map of the United States.
Region 1
Region 2
Region 3
Region 4
Region 5
Region 6
Region 7
Region 8
Region 9
Region 10
Validation was employed. The respondent was forced to select at least four and no more than
four answers in order to commence with the survey.
States (Entirety)
The following questions will ask where some important agricultural crops are produced
according to their greatest amount of production by states in their entirety. These crops may be
produced in many areas, but have historically and statistically been produced in specific regions
due to factors of climate (prevailing atmospheric conditions and soil type) and economics. Please
reference the map of the United States provided. If you cannot decide which answer to select for
any given question, then please select the one that you believe is the best answer.
Please note that when the word “historically” is used, it pertains to a time spanning from at least
50 to 100 years. Please consider that historical crops, such as cotton, may have originally been
planted in places of importance which are often mentioned in regular history books, but may
have been produced in other places within the last 50 to 100 years. Thus, these places may or
may not match the answers to the questions in the survey.
Question 14. Which one (1) state both historically and statistically produces the most number of
almonds in the United States? Please select the one state which you believe most applies using
the map of the United States.
California (CA)
Arizona (AZ)
Washington (WA)
Oregon (OR)
Question 15. Which four (4) states both historically and statistically produce the most number of
apples in the United States? Please select the four states which you believe most apply using the
map of the United States.
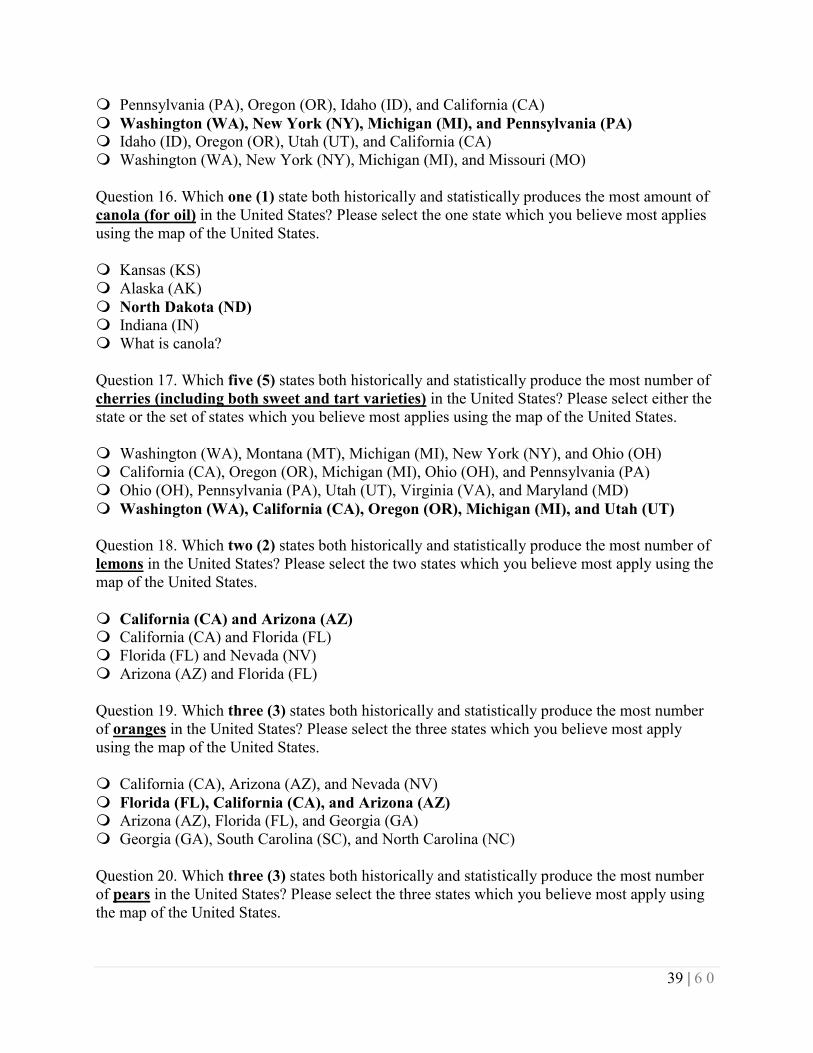
39 | 6 0
Pennsylvania (PA), Oregon (OR), Idaho (ID), and California (CA)
Washington (WA), New York (NY), Michigan (MI), and Pennsylvania (PA)
Idaho (ID), Oregon (OR), Utah (UT), and California (CA)
Washington (WA), New York (NY), Michigan (MI), and Missouri (MO)
Question 16. Which one (1) state both historically and statistically produces the most amount of
canola (for oil) in the United States? Please select the one state which you believe most applies
using the map of the United States.
Kansas (KS)
Alaska (AK)
North Dakota (ND)
Indiana (IN)
What is canola?
Question 17. Which five (5) states both historically and statistically produce the most number of
cherries (including both sweet and tart varieties) in the United States? Please select either the
state or the set of states which you believe most applies using the map of the United States.
Washington (WA), Montana (MT), Michigan (MI), New York (NY), and Ohio (OH)
California (CA), Oregon (OR), Michigan (MI), Ohio (OH), and Pennsylvania (PA)
Ohio (OH), Pennsylvania (PA), Utah (UT), Virginia (VA), and Maryland (MD)
Washington (WA), California (CA), Oregon (OR), Michigan (MI), and Utah (UT)
Question 18. Which two (2) states both historically and statistically produce the most number of
lemons in the United States? Please select the two states which you believe most apply using the
map of the United States.
California (CA) and Arizona (AZ)
California (CA) and Florida (FL)
Florida (FL) and Nevada (NV)
Arizona (AZ) and Florida (FL)
Question 19. Which three (3) states both historically and statistically produce the most number
of oranges in the United States? Please select the three states which you believe most apply
using the map of the United States.
California (CA), Arizona (AZ), and Nevada (NV)
Florida (FL), California (CA), and Arizona (AZ)
Arizona (AZ), Florida (FL), and Georgia (GA)
Georgia (GA), South Carolina (SC), and North Carolina (NC)
Question 20. Which three (3) states both historically and statistically produce the most number
of pears in the United States? Please select the three states which you believe most apply using
the map of the United States.

40 | 6 0
Washington (WA), California (CA), and Utah (UT)
Ohio (OH), Oregon (OR), and Pennsylvania (PA)
Washington (WA), California (CA), and Oregon (OR)
North Carolina (NC), Georgia (GA), and Michigan (MI)
Question 21. Which two (2) states both historically and statistically produce the most number of
potatoes (excluding sweet varieties) in the United States? Please select the two states which
you believe most apply using the map of the United States.
Idaho (ID) and Iowa (IA)
Montana (MT) and Washington (WA)
Oregon (OR) and Texas (TX)
Idaho (ID) and Washington (WA)
Question 22. Which three (3) states or territories both historically and statistically produce the
most amount of rice in the United States? Please select the three states which you believe most
apply using the map of the United States.
Arkansas (AR), California (CA), and Louisiana (LA)
Virginia (VA), North Carolina (NC), and South Carolina (SC)
Hawai'i (HI), Guam (GU), and American Samoa (AS)
Nebraska (NE), Kansas (KS), and Oklahoma (OK)
I did not know that rice is produced in the United States
Question 23. Which four (4) states both historically and statistically produce the most amount of
sugar beets (for sugar) in the United States? Please select the four states which you believe
most apply using the map of the United States.
Minnesota (MN), North Dakota (ND), Michigan (MI), and Ohio (OH)
Minnesota (MN), North Dakota (ND), Idaho (ID), and Michigan (MI)
North Dakota (ND), South Dakota (SD), Michigan (MI), and Ohio (OH)
Idaho (ID), Washington (WA), Oregon (OR), and Michigan (MI)
What are sugar beets?
Question 24. Which two (2) states both historically and statistically produce the most number of
sunflowers (for both oil and seed) in the United States? Please select the two states which you
believe most apply using the map of the United States.
North Dakota (ND) and Kansas (KS)
Kansas (KS) and Oklahoma (OK)
North Dakota (ND) and South Dakota (SD)
Colorado (CO) and Oklahoma (OK)
States (Interior)

41 | 6 0
The following single question will ask where two important agricultural crops are produced
according to their greatest amount of production by states in their interior. This is based upon
their biological limitations and needs as well as the physical limitations of the states in which
they are produced due to the factor of climate (prevailing atmospheric conditions and soil type).
If you cannot decide which answer to select for the question, then please select the one that you
believe is the best answer.
Question 25. Within the states of Arkansas and Colorado, where is all or the greater amount of
rice and wheat produced, respectively?
In Arkansas, rice is produced in the higher, westernmost areas, away from the Mississippi
River; in Colorado, wheat is produced in the lower, easternmost areas, away from the Rocky
Mountains
In Arkansas, rice is produced in the lower, easternmost areas, near to or at the Mississippi
River; in Colorado, wheat is produced in the higher, westernmost areas, near to or in the
Rocky Mountains
In Arkansas, rice is produced in the higher, westernmost areas, away from the Mississippi
River; in Colorado, wheat is produced in the higher, westernmost areas, near to or in the
Rocky Mountains
In Arkansas, rice is produced in the lower, easternmost areas, near to or at the
Mississippi River; in Colorado, wheat is produced in the lower, easternmost areas,
away from the Rocky Mountains
Conclusion and Demographics
The following questions will ask for demographic information. Please answer each question
carefully and correctly to ensure accuracy.
Question 26. Which is your age category?
Anywhere from 18 to 22 years of age
Anywhere from 23 to 27 years of age
Anywhere from 28 to 32 years of age
Anywhere from 33 to 37 years of age
Anywhere from 38 to 42 years of age
Anywhere from 43 years of age or older
Conditional branching was employed. If the respondent answered the question with, “Anywhere
from 18 to 22 years of age”, “Anywhere from 23 to 27 years of age”, “Anywhere from 28 to 32
years of age”, “Anywhere from 33 to 37 years of age”, or “Anywhere from 38 to 42 years of
age”, then the program automatically sequenced to Question 26. If the respondent answered the
question with either, “Anywhere from 33 years of age or older”, then the program automatically
sequenced to the end of the survey.
Question 27. Do you identify yourself as female or male?

42 | 6 0
Female
Male
Question 28. What is your highest level of education? Please select only the highest level which
you have currently attained, even if you are working towards your next degree.
I am currently still attending high school
I do not hold a high school degree nor an equivalent (General Educational Development
[GED])
I hold either a high school degree or an equivalent (General Educational Development
[GED])
I hold a vocational degree or certificate
I hold an associate’s degree
I hold a bachelor’s degree
I hold a master’s degree
I hold a doctorate’s degree or another type of terminal degree
Question 29. While attending high school, do you or did you participate in any one or more
agricultural school organizations, such as the FFA, the 4-H, or any other type of agricultural
school organizations?
Yes, I do participate or did participate in one or more agricultural school organizations
No, I do not participate or did not participate in any agricultural school organizations
Question 30. While attending high school, in what state or territory do you or did you live? If
you have lived in different places, please select the state or territory where you attended or have
so far attended the most of your high school education. If you cannot decide, then please select
the one where you believe in which you learned the most.
Alabama (AL)
Alaska (AK)
Arizona (AZ)
Arkansas (AR)
California (CA)
Colorado (CO)
Connecticut (CT)
Delaware (DE)
Florida (FL)
Georgia (GA)
Hawai'i (HI)
Idaho (ID)
Illinois (IL)
Indiana (IN)
Iowa (IA)
Kansas (KS)
Kentucky (KY)

43 | 6 0
Louisiana (LA)
Maine (ME)
Maryland (MD)
Massachusetts (MA)
Michigan (MI)
Minnesota (MN)
Mississippi (MS)
Missouri (MO)
Montana (MT)
Nebraska (NE)
Nevada (NV)
New Hampshire (NH)
New Jersey (NJ)
New Mexico (NM)
New York (NY)
North Carolina (NC)
North Dakota (ND)
Ohio (OH)
Oklahoma (OK)
Oregon (OR)
Pennsylvania (PA)
Rhode Island (RI)
South Carolina (SC)
South Dakota (SD)
Tennessee (TN)
Texas (TX)
Utah (UT)
Vermont (VT)
Virginia (VA)
Washington (WA)
West Virginia (WV)
Wisconsin (WI)
Wyoming (WY)
District of Columbia (DC)
American Samoa (AS)
Guam (GU)
Northern Mariana Islands (MP)
Puerto Rico (PR)
United States Virgin Islands (US-VI)
Outside of the United States

44 | 6 0
Appendix B: Agricultural Crops Used in Survey
Native versus Non-Native Agricultural Crop Species
Apples, barley, black or wild cherries, black or wild raspberries, black or wild walnuts,
blueberries, cacao, common or wild strawberries, corn, cucurbits (pumpkins and squash),
cranberries, grapes, oats, pears, pecans, potatoes, rice, sunflowers, vanilla, wheat
Regions
Alfalfa, barley, corn, cotton, peanuts, soybeans, wheat
States (Entirety)
Almonds, apples, canola, cherries, lemons, oranges, pears, potatoes, rice, sugar beets,
sunflowers
States (Interior)
Rice, wheat

45 | 6 0
Appendix C: Reference Maps Used in Survey
Appendix C; Item 1: Map of the United States displaying regions for survey participants to select.
Appendix C; Item 2: Map of the United States displaying states for survey participants to select.

46 | 6 0
Appendix D: Survey Results
Correct answers are emboldened.
Question 1. Which ten (10) agricultural crops are naturally native to North America?
Answer Choices Percentage Actual Count
Apples 82.6% 157
Black or wild cherries 58.4% 111
Black or wild raspberries 66.8% 127
Black or wild walnuts 39.5% 75
Blueberries 71.6% 136
Cacao 4.2% 8
Common or wild strawberries 74.7% 142
Corn 83.7% 159
Cucurbits 62.1% 118
Cranberries 52.6% 100
Grapes (New World) 45.8% 87
Grapes (Old World) 8.9% 17
Oats 50.5% 96
Pears 34.2% 65
Pecans 40.5% 77
Potatoes 58.9% 112
Rice 12.1% 23
Sunflowers 70.5% 134
Vanilla 8.9% 17
Wheat 73.2% 139
Total 100.0% 190
Question 2. In which one (1) state is the San Joaquin Valley located?

47 | 6 0
Answer Choices Percentage Actual Count
California 66.3% 126
Arizona 2.1% 4
New Mexico 7.9% 15
Texas 2.6% 5
Admittedly did not know or had never before heard of the
San Joaquin Valley 21.1% 40
Total 100.0% 190
Question 3. In which two (2) states is the Columbia Valley primarily located?
Answer Choices Percentage Actual
Count
California and Oregon 6.3% 12
Washington and Oregon 54.2% 103
Virginia and Maryland 9.5% 18
Maryland and Pennsylvania 2.6% 5
Admittedly did not know or had never before heard of the
Columbia Valley 27.4% 52
Total 100.0% 190
Question 4. In which one (1) state is the Willamette Valley located?
Answer Choices Percentage Actual
Count
California 1.6% 3
Pennsylvania 10.0% 19
Oregon 44.2% 84
Utah 7.4% 14
Admittedly did not know or had never before heard of the
Willamette Valley 36.8% 70
Total 100.0% 190
Question 5. In which one (1) state is the San Luis Valley located?

48 | 6 0
Answer Choices Percentage Actual Count
California 33.2% 63
Washington 1.6% 3
Texas 14.2% 27
Colorado 18.9% 36
Admittedly did not know
or had never before heard of the San Luis Valley 32.1% 61
Total 100.0% 190
Question 6. Between which two (2) states is the Red River Valley primarily located?
Answer Choices Percentage Actual Count
Minnesota and North Dakota 18.4% 35
Colorado and Utah 21.6% 41
Montana and Wyoming 14.2% 27
Nevada and Utah 15.3% 29
Admittedly did not know or had never before heard of the
Red River Valley 30.5% 58
Total 100.0% 190
Question 7. Which five (5) regions historically and statistically produce the most amount of
alfalfa (for hay) in the United States?
Answer Choices Percentage Actual Count
Region 1 4.7% 9
Region 2 15.8% 30
Region 3 50.5% 96
Region 4 24.2% 46
Region 5 55.8% 106
Region 6 84.7% 161
Region 7 71.6% 136

49 | 6 0
Region 8 81.1% 154
Region 9 37.4% 71
Region 10 38.9% 74
Admittedly did not know what alfalfa is 7.4% 14
Total 100.0% 190
Question 8. Which three (3) regions both historically and statistically produce the most amount
of barley in the United States?
Answer Choices Percentage Actual Count
Region 1 10.5% 20
Region 2 19.5% 37
Region 3 39.5% 75
Region 4 20.5% 39
Region 5 24.7% 47
Region 6 57.9% 110
Region 7 29.5% 56
Region 8 46.8% 89
Region 9 12.1% 23
Region 10 17.9% 34
Admittedly did not know what barley is 8.9% 17
Total 100.0% 190
Question 9. Which three (3) regions both historically and statistically produce the most amount
of corn (for both grain and seed) in the United States?
Answer Choices Percentage Actual Count
Region 1 1.6% 3
Region 2 7.4% 14
Region 3 47.9% 91
Region 4 10.5% 20
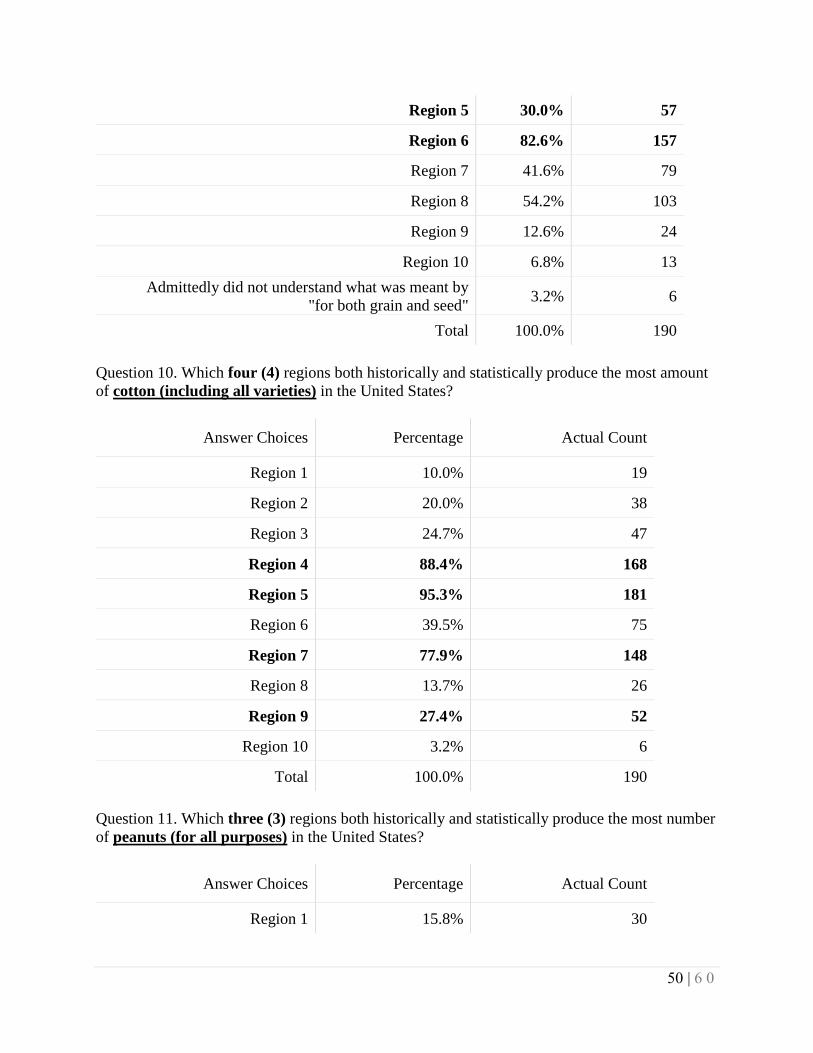
50 | 6 0
Region 5 30.0% 57
Region 6 82.6% 157
Region 7 41.6% 79
Region 8 54.2% 103
Region 9 12.6% 24
Region 10 6.8% 13
Admittedly did not understand what was meant by
"for both grain and seed" 3.2% 6
Total 100.0% 190
Question 10. Which four (4) regions both historically and statistically produce the most amount
of cotton (including all varieties) in the United States?
Answer Choices Percentage Actual Count
Region 1 10.0% 19
Region 2 20.0% 38
Region 3 24.7% 47
Region 4 88.4% 168
Region 5 95.3% 181
Region 6 39.5% 75
Region 7 77.9% 148
Region 8 13.7% 26
Region 9 27.4% 52
Region 10 3.2% 6
Total 100.0% 190
Question 11. Which three (3) regions both historically and statistically produce the most number
of peanuts (for all purposes) in the United States?
Answer Choices Percentage Actual Count
Region 1 15.8% 30

51 | 6 0
Region 2 25.3% 48
Region 3 22.6% 43
Region 4 64.2% 122
Region 5 53.2% 101
Region 6 22.1% 42
Region 7 37.4% 71
Region 8 20.0% 38
Region 9 24.7% 47
Region 10 14.7% 28
Total 100.0% 190
Question 12. Which three (3) regions both historically and statistically produce the most number
of soybeans in the United States?
Answer Choices Percentage Actual Count
Region 1 10.0% 19
Region 2 14.7% 28
Region 3 47.4% 90
Region 4 28.4% 54
Region 5 38.9% 74
Region 6 52.1% 99
Region 7 26.3% 50
Region 8 34.7% 66
Region 9 27.9% 53
Region 10 19.5% 37
Total 100.0% 190
Question 13. Which four (4) regions both historically and statistically produce the most amount
of wheat in the United States?

52 | 6 0
Answer Choices Percentage Actual Count
Region 1 1.6% 3
Region 2 7.9% 15
Region 3 41.1% 78
Region 4 17.4% 33
Region 5 47.9% 91
Region 6 84.7 161
Region 7 66.3% 126
Region 8 78.9% 150
Region 9 23.7% 45
Region 10 30.5% 58
Total 100.0% 190
Question 14. Which one (1) state both historically and statistically produces the most number of
almonds in the United States?
Answer Choices Percentage Actual Count
California (CA) 70.5% 134
Arizona (AZ) 7.9% 15
Washington (WA) 7.4% 14
Oregon (OR) 14.2% 27
Total 100.0% 190
Question 15. Which four (4) states both historically and statistically produce the most number of
apples in the United States?
Answer Choices Percentage Actual
Count
Pennsylvania (PA), Oregon (OR), Idaho (ID), and California
(CA) 12.6% 24
Washington (WA), New York (NY), Michigan (MI), and
Pennsylvania (PA) 61.6% 117
Idaho (ID), Oregon (OR), Utah (UT), and California (CA) 7.9% 15
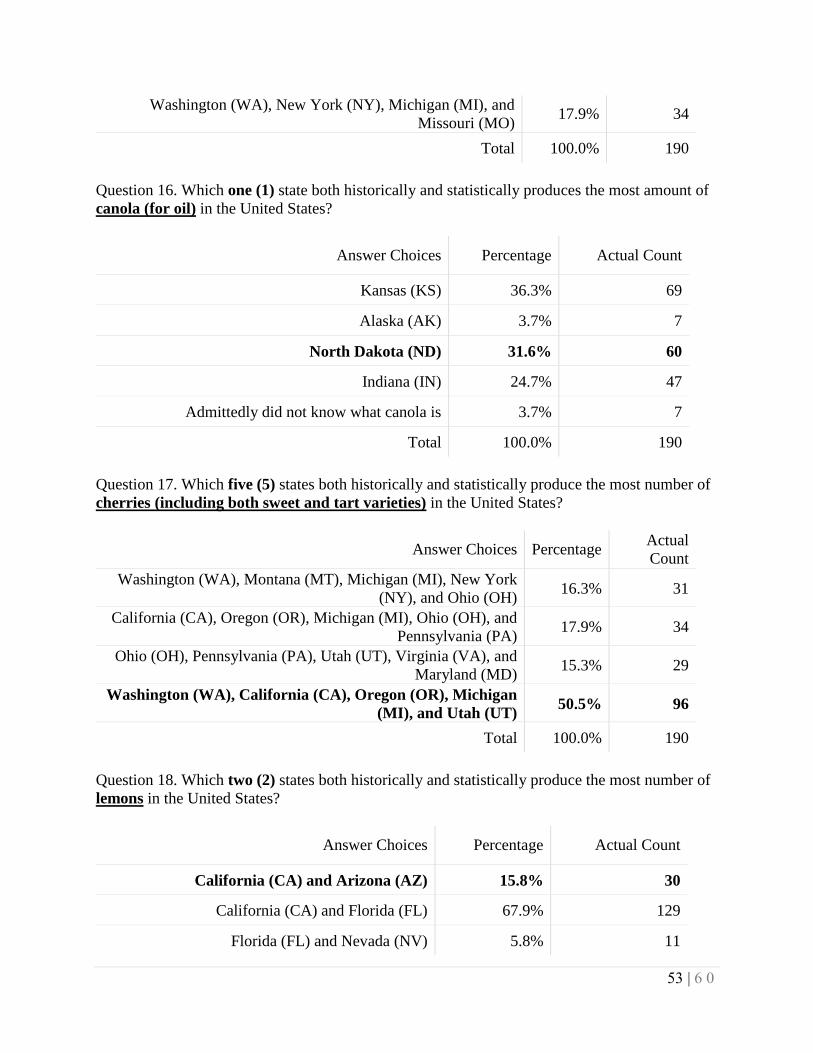
53 | 6 0
Washington (WA), New York (NY), Michigan (MI), and
Missouri (MO) 17.9% 34
Total 100.0% 190
Question 16. Which one (1) state both historically and statistically produces the most amount of
canola (for oil) in the United States?
Answer Choices Percentage Actual Count
Kansas (KS) 36.3% 69
Alaska (AK) 3.7% 7
North Dakota (ND) 31.6% 60
Indiana (IN) 24.7% 47
Admittedly did not know what canola is 3.7% 7
Total 100.0% 190
Question 17. Which five (5) states both historically and statistically produce the most number of
cherries (including both sweet and tart varieties) in the United States?
Answer Choices Percentage Actual
Count
Washington (WA), Montana (MT), Michigan (MI), New York
(NY), and Ohio (OH) 16.3% 31
California (CA), Oregon (OR), Michigan (MI), Ohio (OH), and
Pennsylvania (PA) 17.9% 34
Ohio (OH), Pennsylvania (PA), Utah (UT), Virginia (VA), and
Maryland (MD) 15.3% 29
Washington (WA), California (CA), Oregon (OR), Michigan
(MI), and Utah (UT) 50.5% 96
Total 100.0% 190
Question 18. Which two (2) states both historically and statistically produce the most number of
lemons in the United States?
Answer Choices Percentage Actual Count
California (CA) and Arizona (AZ) 15.8% 30
California (CA) and Florida (FL) 67.9% 129
Florida (FL) and Nevada (NV) 5.8% 11

54 | 6 0
Arizona (AZ) and Florida (FL) 10.5% 20
Total 100.0% 190
Question 19. Which three (3) states both historically and statistically produce the most number
of oranges in the United States?
Answer Choices Percentage Actual Count
California (CA), Arizona (AZ), and Nevada (NV) 3.7% 7
Florida (FL), California (CA), and Arizona (AZ) 67.4% 128
Arizona (AZ), Florida (FL), and Georgia (GA) 23.7% 45
Georgia (GA), South Carolina (SC), and North Carolina (NC) 5.3% 10
Total 100.0% 190
Question 20. Which three (3) states both historically and statistically produce the most number
of pears in the United States?
Answer Choices Percentage Actual Count
Washington (WA), California (CA), and Utah (UT) 16.3% 31
Ohio (OH), Oregon (OR), and Pennsylvania (PA) 20.0% 38
Washington (WA), California (CA), and Oregon (OR) 46.3% 88
North Carolina (NC), Georgia (GA), and Michigan (MI) 17.4% 33
Total 100.0% 190
Question 21. Which two (2) states both historically and statistically produce the most number of
potatoes (excluding sweet varieties) in the United States?
Answer Choices Percentage Actual Count
Idaho (ID) and Iowa (IA) 55.3% 105
Montana (MT) and Washington (WA) 2.6% 5
Oregon (OR) and Texas (TX) 3.2% 6
Idaho (ID) and Washington (WA) 38.9% 74
Total 100.0% 190

55 | 6 0
Question 22. Which three (3) states or territories both historically and statistically produce the
most amount of rice in the United States?
Answer Choices Percentage Actual Count
Arkansas (AR), California (CA), and Louisiana (LA) 23.7% 45
Virginia (VA), North Carolina (NC), and South Carolina (SC) 10.5% 20
Hawai'i (HI), Guam (GU), and American Samoa (AS) 36.8% 70
Nebraska (NE), Kansas (KS), and Oklahoma (OK) 12.1% 23
Admittedly did not know
that rice is produced in the United States 16.8% 32
Total 100.0% 190
Question 23. Which four (4) states both historically and statistically produce the most amount of
sugar beets (for sugar) in the United States?
Answer Choices Percentage Actual
Count
Minnesota (MN), North Dakota (ND), Michigan (MI), and
Ohio (OH) 17.4% 33
Minnesota (MN), North Dakota (ND), Idaho (ID), and
Michigan (MI) 28.9% 55
North Dakota (ND), South Dakota (SD), Michigan (MI), and
Ohio (OH) 21.1% 40
Idaho (ID), Washington (WA), Oregon (OR), and Michigan
(MI) 15.8% 30
Admittedly did not know what sugar beets are 16.8% 32
Total 100.0% 190
Question 24. Which two (2) states both historically and statistically produce the most number of
sunflowers (for both oil and seed) in the United States?
Answer Choices Percentage Actual Count
North Dakota (ND) and Kansas (KS) 15.8% 30
Kansas (KS) and Oklahoma (OK) 49.5% 94
North Dakota (ND) and South Dakota (SD) 20.0% 38
Colorado (CO) and Oklahoma (OK) 14.7% 28

56 | 6 0
Total 100.0% 190
Question 25. Within the states of Arkansas and Colorado, where is all or the greater amount of
rice and wheat produced, respectively?
Answer Choices Percentage Actual
Count
In Arkansas, rice is produced in the higher, westernmost areas,
away from the Mississippi River; in Colorado, wheat is produced
in the lower, easternmost areas, away from the Rocky Mountains
17.4% 33
In Arkansas, rice is produced in the lower, easternmost areas, near
to or at the Mississippi River; in Colorado, wheat is produced in
the higher, westernmost areas, near to or in the Rocky Mountains
22.1% 42
In Arkansas, rice is produced in the higher, westernmost areas,
away from the Mississippi River; in Colorado, wheat is produced
in the higher, westernmost areas, near to or in the Rocky
Mountains
14.2% 27
In Arkansas, rice is produced in the lower, easternmost areas,
near to or at the Mississippi River; in Colorado, wheat is
produced in the lower, easternmost areas, away from the
Rocky Mountains
46.3% 88
Total 100.0% 190
Question 26. Which is your age category?
Answer Choices Percentage Actual Count
Anywhere from 18 to 22 years of age 2.1% 4
Anywhere from 23 to 27 years of age 24.2% 46
Anywhere from 28 to 32 years of age 53.2% 101
Anywhere from 33 to 37 years of age 13.2% 25
Anywhere from 38 to 42 years of age 7.4% 14
Total 100.0% 190
Question 27. Do you identify yourself as female or male?
Answer Choices Percentage Actual Count
Male 62.6% 119

57 | 6 0
Female 37.4% 71
Total 100.0% 190
Question 28. What is your highest level of education?
Answer Choices Percentage Actual
Count
I am currently still attending high school 1.1% 2
I do not hold a high school degree nor an equivalent (General
Educational Development [GED]) 2.1% 4
I hold either a high school degree or an equivalent (General
Educational Development [GED]) 32.1% 61
I hold a vocational degree or certificate 8.4% 16
I hold an associate’s degree 22.1% 42
I hold a bachelor’s degree 27.4% 52
I hold a master’s degree 5.8% 11
I hold a doctorate’s degree or another type of terminal degree 1.1% 2
Total 100% 190
Question 29. While in school, do you or did you participate in any one or more agricultural
school organizations, such as the FFA, the 4-H, or any other type of agricultural school
organizations?
Answer Choices Percentage Actual
Count
Yes, I do participate or did participate in one or more
agricultural school organizations 10.0% 19
No, I do not participate or did not participate in any agricultural
school organizations 90.0% 171
Total 100% 190
Question 30. While attending high school, in what state or territory do you or did you live?
Answer Choices Percentage Actual Count
Alabama (AL) 2.1% 4
Alaska (AK) 0.5% 1

58 | 6 0
Arizona (AZ) 2.6% 5
Arkansas (AR) 0.5% 1
California (CA) 7.4% 14
Colorado (CO) 7.9% 15
Connecticut (CT) 0.5% 1
Delaware (DE) 0.5% 1
Florida (FL) 4.7% 9
Georgia (GA) 1.1% 2
Hawai'i (HI) 0.0% 0
Idaho (ID) 0.5% 1
Illinois (IL) 3.7% 7
Indiana (IN) 1.1% 2
Iowa (IA) 0.5% 1
Kansas (KS) 0.5% 1
Kentucky (KY) 0.5% 1
Louisiana (LA) 0.0% 0
Maine (ME) 0.5% 1
Maryland (MD) 1.1% 2
Massachusetts (MA) 0.5% 1
Michigan (MI) 1.1% 2
Minnesota (MN) 0.5% 1
Mississippi (MS) 0.0% 0
Missouri (MO) 3.2% 6
Montana (MT) 0.0% 0
Nebraska (NE) 1.1% 2
Nevada (NV) 0.5% 1
New Hampshire (NH) 0.5% 1
New Jersey (NJ) 0.5% 1

59 | 6 0
New Mexico (NM) 0.5% 1
New York (NY) 2.6% 5
North Carolina (NC) 1.1% 2
North Dakota (ND) 0.5% 1
Ohio (OH) 2.1% 4
Oklahoma (OK) 0.5% 1
Oregon (OR) 0.5% 1
Pennsylvania (PA) 3.2% 6
Rhode Island (RI) 0.5% 1
South Carolina (SC) 0.5% 1
South Dakota (SD) 0.5% 1
Tennessee (TN) 1.6% 3
Texas (TX) 3.2% 6
Utah (UT) 0.0% 0
Vermont (VT) 0.5% 1
Virginia (VA) 1.1% 2
Washington (WA) 32.1% 61
West Virginia (WV) 0.5% 1
Wisconsin (WI) 3.2% 6
Wyoming (WY) 0.0% 0
District of Columbia (DC) 0.0% 0
American Samoa (AS) 0.0% 0
Guam (GU) 0.0% 0
Northern Mariana Islands (MP) 0.0% 0
Puerto Rico (PR) 0.5% 1
United States Virgin Islands (US-VI) 0.0% 0
Outside of the United States 0.5% 1
Total 100% 190

60 | 6 0