Embed Size (px)
Citation preview
Using Simulation for study the Possibility of Canceling Load Unbalance of non-sinusoidal High Power three-phase Loads
MANUELA PANOIU1, CAIUS PANOIU1, IOAN SORA2, ANCA IORDAN1, RALUCA ROB1
1Electrical Engineering and Industrial Informatic Department Polytechnic University of Timisoara
Revolutiei street, no 5 Hunedoara, cod 331128 2 Electrical Engineering Faculty
Polytechnic University of Timisoara Bd. V. Parvan, no. 2, Timisoara, cod 300223
ROMANIA 1{m.panoiu, c.panoiu, anca.iordan, raluca.rob}@fih.upt.ro,
[email protected] Abstract: - The electric arc furnace as a three-phase load represent one of the most important source of harmonic currents, reactive power and unbalanced conditions in electrical power systems. This paper work aims to achieve a study concerning the unbalanced regime and to propose a method for three-phase load balancing. It is well know that the electric arc is a nonlinear element. Thus, for modeling his behavior, it was use a model having parameters like of a real electric arc. For simulation it was use the PSCAD-EMTDC program dedicated to power systems. It was also performed a study for load balancing based on modeling the three phase electric arc furnace installation. For comparative studies it was made measurements in secondary furnace transformer. Key-Words: - simulation, modeling, unbalanced load, electric arc, power quality 1 Introduction The electric arc is a nonlinear element. For study the behavior of the systems containing an electric arc it must use techniques to model the nonlinearity of the electric arc. The electric arc furnace (EAF) is a source of harmonic currents and reactive power in electrical power system because the electric arc’s nonlinearity. EAF represent also an unbalance load. In order to improve the functioning of the EAF it can be used harmonic filters [1], [5] reactive power compensation installation [2] and load balancing. The effect of these installations was analyzed using simulation program PSCAD/EMTDC [23]. PSCAD (Power System Computer Aided Design) is a multi-purpose graphical user interface capable of supporting a variety of power system simulation programs. This release supports only EMTDC (Electro-Magnetic Transients in DC Systems). For simulation it was use an electric arc model, depending on the nonlinearity of the electric arc. The modeling approach adopted in the paper is graphical, as opposed to mathematical models embedded in code using a high-level computer language. It is also propose two method for design the load balancing system. Using simulation we validate the proposed load balancing system.
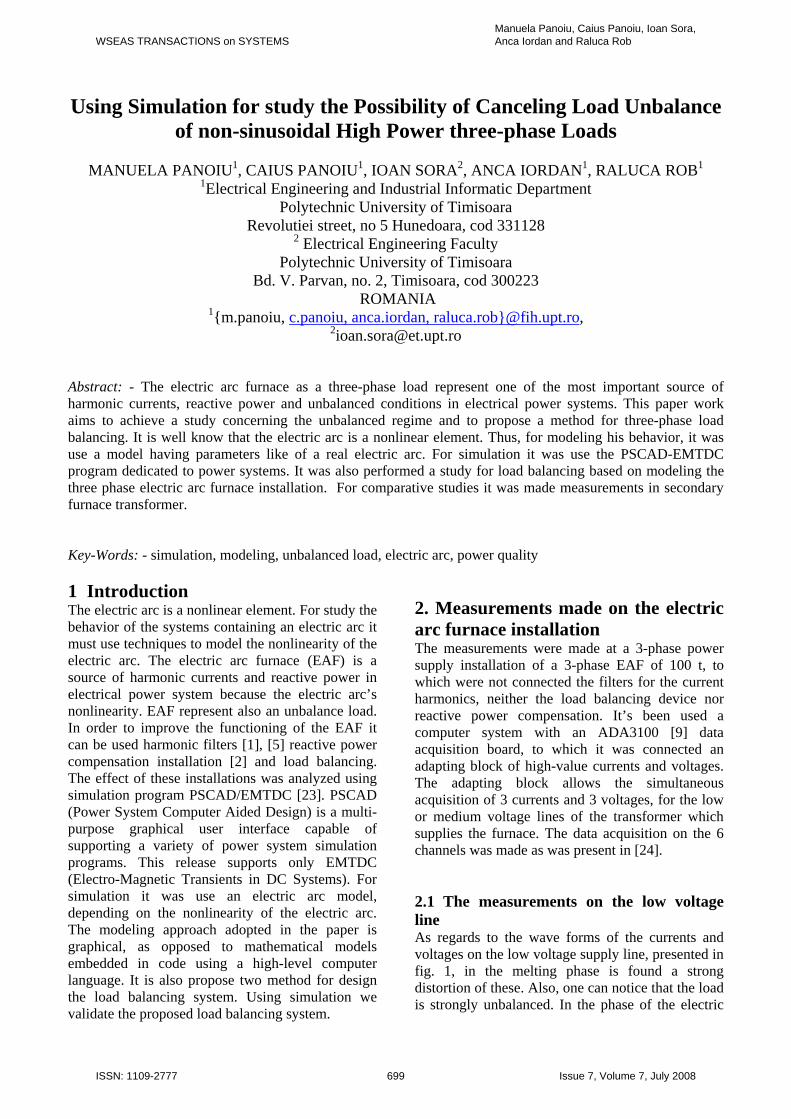
2. Measurements made on the electric arc furnace installation The measurements were made at a 3-phase power supply installation of a 3-phase EAF of 100 t, to which were not connected the filters for the current harmonics, neither the load balancing device nor reactive power compensation. It’s been used a computer system with an ADA3100 [9] data acquisition board, to which it was connected an adapting block of high-value currents and voltages. The adapting block allows the simultaneous acquisition of 3 currents and 3 voltages, for the low or medium voltage lines of the transformer which supplies the furnace. The data acquisition on the 6 channels was made as was present in [24]. 2.1 The measurements on the low voltage line As regards to the wave forms of the currents and voltages on the low voltage supply line, presented in fig. 1, in the melting phase is found a strong distortion of these. Also, one can notice that the load is strongly unbalanced. In the phase of the electric
WSEAS TRANSACTIONS on SYSTEMS
Manuela Panoiu, Caius Panoiu, Ioan Sora, Anca Iordan and Raluca Rob
ISSN: 1109-2777 699 Issue 7, Volume 7, July 2008
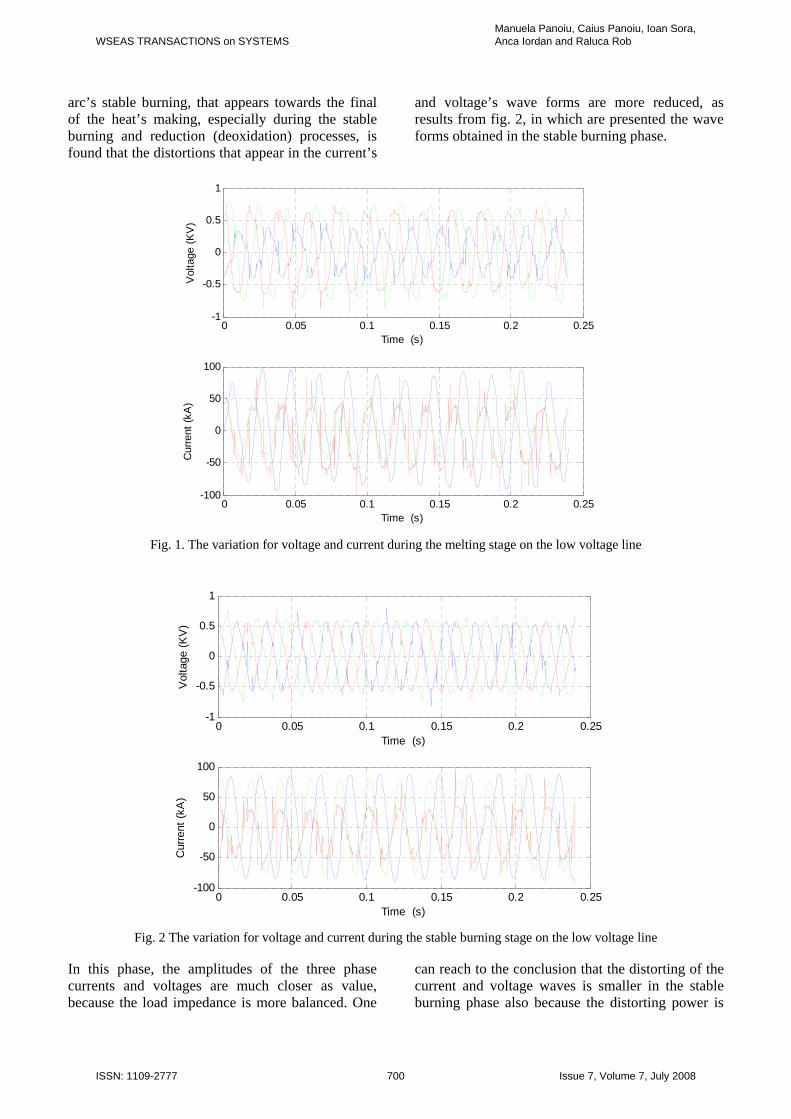
arc’s stable burning, that appears towards the final of the heat’s making, especially during the stable burning and reduction (deoxidation) processes, is found that the distortions that appear in the current’s
and voltage’s wave forms are more reduced, as results from fig. 2, in which are presented the wave forms obtained in the stable burning phase.
0 0.05 0.1 0.15 0.2 0.25-1
-0.5
0
0.5
1
Time (s)
Vol
tage
(KV
)
0 0.05 0.1 0.15 0.2 0.25-100
-50
0
50
100
Time (s)
Cur
rent
(kA
)
Fig. 1. The variation for voltage and current during the melting stage on the low voltage line
0 0.05 0.1 0.15 0.2 0.25-1
-0.5
0
0.5
1
Time (s)
Vol
tage
(KV
)
0 0.05 0.1 0.15 0.2 0.25-100
-50
0
50
100
Time (s)
Cur
rent
(kA
)
Fig. 2 The variation for voltage and current during the stable burning stage on the low voltage line
In this phase, the amplitudes of the three phase currents and voltages are much closer as value, because the load impedance is more balanced. One
can reach to the conclusion that the distorting of the current and voltage waves is smaller in the stable burning phase also because the distorting power is
WSEAS TRANSACTIONS on SYSTEMSManuela Panoiu, Caius Panoiu, Ioan Sora, Anca Iordan and Raluca Rob
ISSN: 1109-2777 700 Issue 7, Volume 7, July 2008
smaller in this phase, in conditions where the apparent, active and reactive powers are higher. As regards the voltage on the low voltage line, especially in the melting phase it can observe the presence of harmonics of 3th, 5th, 7th order, but also the components of other frequencies than the harmonics’ (inter-harmonics) [5]. In the current’s case, is found that in the melting phase is predominant the fundamental frequency’s component, the other harmonics and inter-harmonics having amplitudes roughly equal, which demonstrates that in this phase the current is strongly distorted. In the stable burning phase is found the presence of the fundamental harmonic and the odd harmonics [5]. For characterize the unbalanced regime we use the negative nonsimetry factors for current and voltage (%):
100⋅= +−− UUkU (1) 100⋅= +−− IIk I (2)
The zero nonsimetry factors for current and voltage(%):
10000 ⋅= +UUkU (3) 10000 ⋅= +IIk I (4)
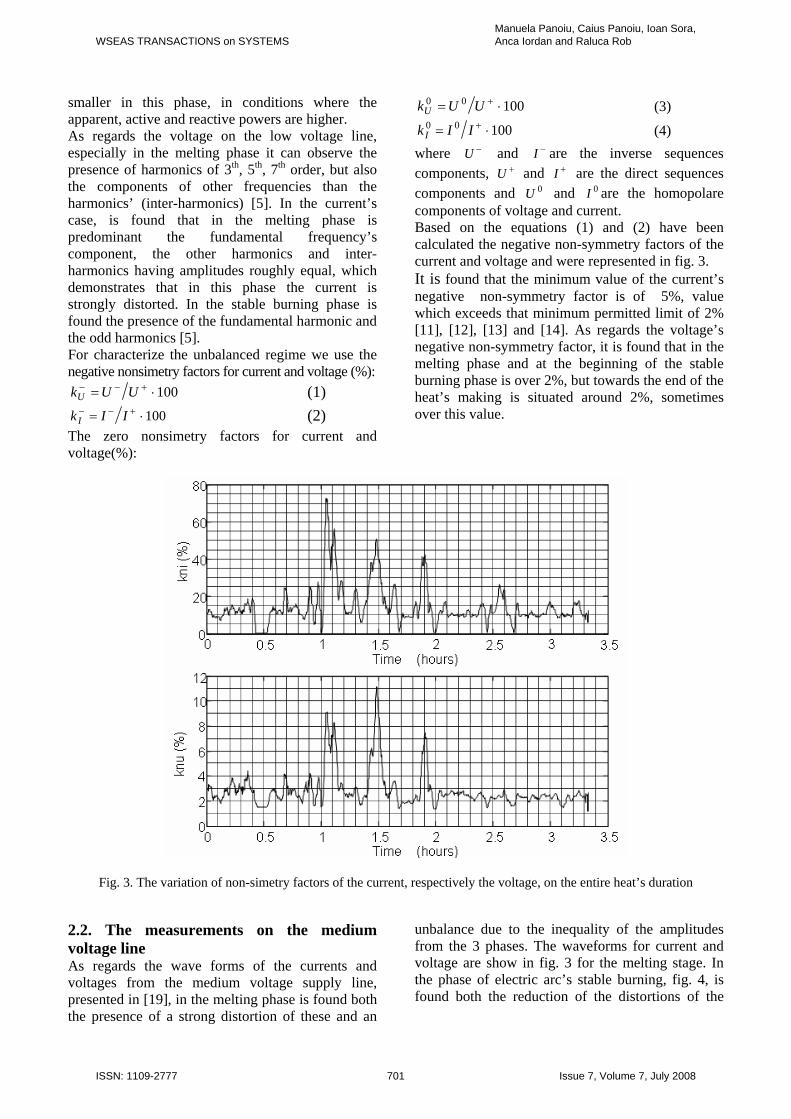
where and −U −I are the inverse sequences components, and +U +I are the direct sequences components and and 0U 0I are the homopolare components of voltage and current. Based on the equations (1) and (2) have been calculated the negative non-symmetry factors of the current and voltage and were represented in fig. 3. It is found that the minimum value of the current’s negative non-symmetry factor is of 5%, value which exceeds that minimum permitted limit of 2% [11], [12], [13] and [14]. As regards the voltage’s negative non-symmetry factor, it is found that in the melting phase and at the beginning of the stable burning phase is over 2%, but towards the end of the heat’s making is situated around 2%, sometimes over this value.
Fig. 3. The variation of non-simetry factors of the current, respectively the voltage, on the entire heat’s duration 2.2. The measurements on the medium voltage line As regards the wave forms of the currents and voltages from the medium voltage supply line, presented in [19], in the melting phase is found both
unbalance due to the inequality of the amplitudes from the 3 phases. The waveforms for current and voltage are show in fig. 3 for the melting stage. In the phase of electric arc’s stable burning, fig. 4, is found both the reduction of the distortions of the
the presence of a strong distortion of these and an
WSEAS TRANSACTIONS on SYSTEMSManuela Panoiu, Caius Panoiu, Ioan Sora, Anca Iordan and Raluca Rob
ISSN: 1109-2777 701 Issue 7, Volume 7, July 2008
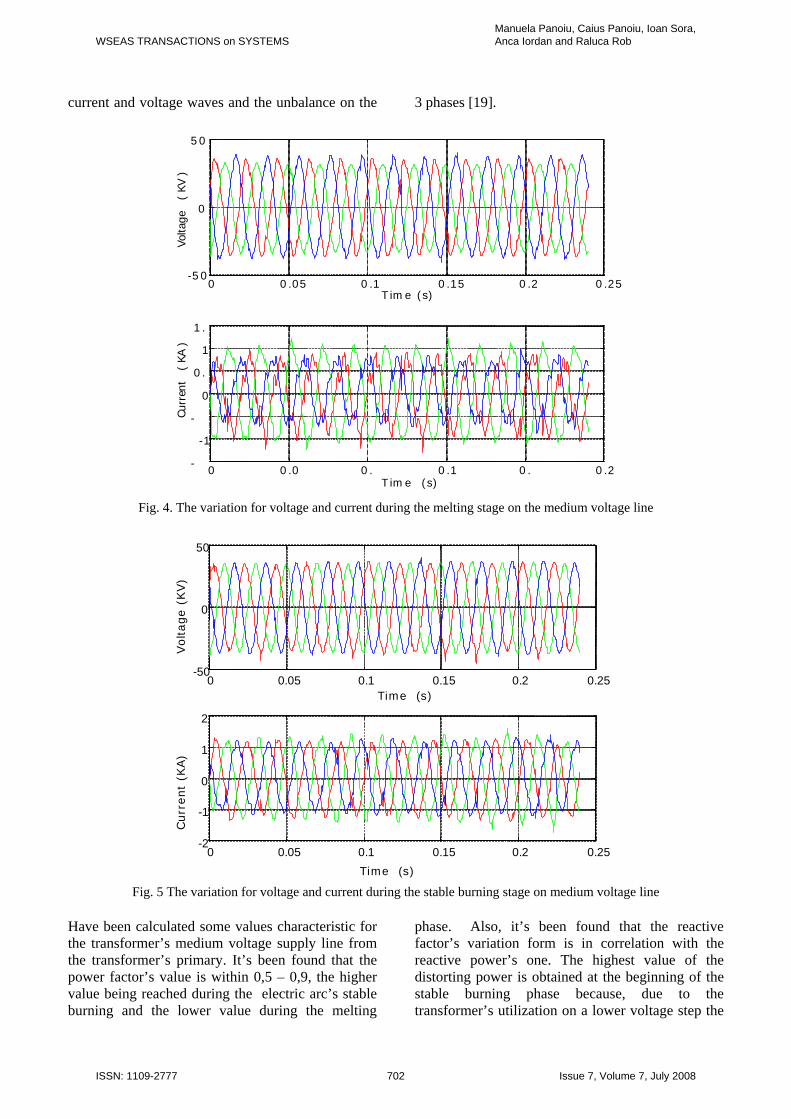
current and voltage waves and the unbalance on the 3 phases [19].
0 0 .05 0 .1 0 .15 0 .2 0 .25 -5 0
0
5 0
T im e (s)
Volta
ge
( K
V )
0 0 .0 0 . 0 .1 0 . 0 .2-
-1
-
0
0 .
1
1 .
T im e (s)
Curr
ent
(
KA )
Fig. 4. The variation for voltage and current during the melting stage on the medium voltage line
0 0.05 0.1 0.15 0.2 0.25 -50
0
50
Time (s)
Voltage (
KV)
0 0.05 0.1 0.15 0.2 0.25 -2
-1
0
1
2
Time (s)
Curr
ent
(KA)
Fig. 5 The variation for voltage and current during the stable burning stage on medium voltage line
Have been calculated some values characteristic for the transformer’s medium voltage supply line from the transformer’s primary. It’s been found that the power factor’s value is within 0,5 – 0,9, the higher value being reached during the electric arc’s stable burning and the lower value during the melting
phase. Also, it’s been found that the reactive factor’s variation form is in correlation with the reactive power’s one. The highest value of the distorting power is obtained at the beginning of the stable burning phase because, due to the transformer’s utilization on a lower voltage step the
WSEAS TRANSACTIONS on SYSTEMSManuela Panoiu, Caius Panoiu, Ioan Sora, Anca Iordan and Raluca Rob
ISSN: 1109-2777 702 Issue 7, Volume 7, July 2008
harmonics’ amplitude which are transmitted in the transformer’s primary is higher, so also the distorting power. It is also found that the minimum value of the current’s negative non-symmetry factor is of 5%, value which exceeds that minimum permitted limit of 2% [11] – [14]. As regards the voltage’s negative non-symmetry factor, it is found that in the melting phase and at the beginning of the stable burning phase is over 2%, but towards the end of the heat’s making is situated around 2%, sometimes over this value. 3. Modeling the electric arc furnace For performed an improvement of the functioning regime of the EAF the authors have analyzed and implement the main models of electric arc from the reference literature [6]–[10]. It was select a model, consider the most appropriate [6], [7]. All simulations were carried out using the simulation program PSCAD-EMTDC. This model, use by the authors also in [1], [2] and [5], considers the characteristic current-voltage described by relation
, ( )AAA IUU =A
thA IDCUU+
+= (5)
UA and IA are the voltage and current of the electric arc, Ud is the drop voltage. Constants C and D determine the difference between the sectors of the characteristic where the current increases or decreases (Ca and Da, respectively Cb and Db). The dynamic model for electric arc:
BlAUth += (6) The typical values [6], [7], for the model’s parameters are Uth=200 V, Ca = 190000 W, Cb = 39000 W, Da = Db = 5000 A. In (6) A is a constant equal with the sum of cathode and anodic drop voltages ( ) and B represent the drop
voltage on the unit length, having usual values of
VA 40≅
cmV10 [20].
4. Simulation of the electric arc furnace based on the presented model In order to model and simulate the operation of the entire installation of the three-phase electric arc furnace, there are identified, by measurements, the electric diagram’s parameters [5]; then, there are determined the parameters of the arc’s model in such way that, further the simulation of the operation of the EAF’s electric installation, to be obtained results very close to the results following the measurements made on the low voltage and medium voltage supply lines during the electric arc’s stable burning. The parameters of the electrical installation of the EAF are:
- the total resistances, on each phase
,0372,0,3640,0,6908,0
3
2
1
Ω=Ω=Ω=
mRmRmR
r
r
r
(7)
- as well as of the total inductivities .9416,8,5422,9 231 HLHLL rrr μμ === (8)
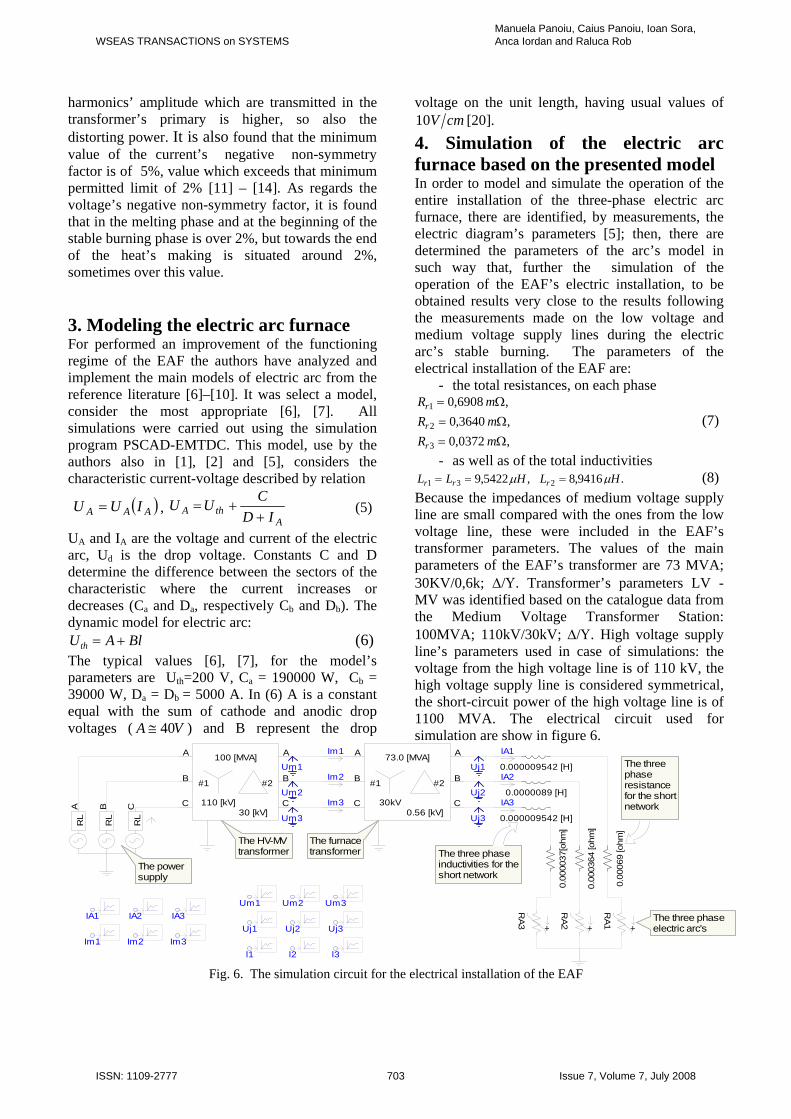
Because the impedances of medium voltage supply line are small compared with the ones from the low voltage line, these were included in the EAF’s transformer parameters. The values of the main parameters of the EAF’s transformer are 73 MVA; 30KV/0,6k; Δ/Υ. Transformer’s parameters LV - MV was identified based on the catalogue data from the Medium Voltage Transformer Station: 100MVA; 110kV/30kV; Δ/Υ. High voltage supply line’s parameters used in case of simulations: the voltage from the high voltage line is of 110 kV, the high voltage supply line is considered symmetrical, the short-circuit power of the high voltage line is of 1100 MVA. The electrical circuit used for simulation are show in figure 6.
RL
RL
A B C
RL
A
B
C
A
B
C30 [kV]
#2#1
110 [kV]
100 [MVA] A
B
C
A
B
C0.56 [kV]
#2#1
30kV
73.0 [MVA]
0.00
069
[ohm
]
0.000009542 [H]
0.00
0364
[ohm
]
0.00
0037
[ohm
]
0.0000089 [H]
0.000009542 [H]
Uj2
Uj1Um1
Um2
Im1
Im2
RA
1 +
RA
2 +
RA
3 +
IA1
IA2
IA3
Uj3
Im3
Um3
IA1Um1
IA2Um2
Uj1 Uj2 Uj3
Um3IA3
l1 l2 l3Im1 Im2 Im3
The three phase electric arc's
The three phase inductivities for theshort network
The three phase resistance for the shortnetwork
The furnacetransformer
The HV-MV transformer
The power supply
Fig. 6. The simulation circuit for the electrical installation of the EAF
WSEAS TRANSACTIONS on SYSTEMSManuela Panoiu, Caius Panoiu, Ioan Sora, Anca Iordan and Raluca Rob
ISSN: 1109-2777 703 Issue 7, Volume 7, July 2008
Following the measurements made on the EAF’s real installation was observed that its operation is featured by the presence of an unbalanced 3-phase regime regardless the technological step, both on the low voltage supply line and the medium voltage one. The simulation of the EAF’s operation as unbalanced 3-phase load was analyzed for two cases:
Unequalness of total impedances’ values of short network phases;
Unequalness of extinction voltages’ values on the 3 phases, due to unequalness of the electric arcs’ lengths on the 3 phases. 4.1. Simulation of the real installation’s operation using unequal values of the short network impedances Because there are sections of the short network where the cables of the 3 phases are disposed in the same plan, it appears an unbalance of the values of short network’s total impedances [20]. The simulations were achieved for such values of the voltage from the transformer’s secondary that should allow the obtaining of the same results as the ones obtained following the measurements made on the medium voltage line and published by authors in [20]. The comparisons of the simulation results with the ones of the measurements were made for the transformer operation’s case, S = 73 MVA, power which is equal with the one measured during the stable burning period after approx. 2 hours from the beginning of the heat making, [15], Sm = 72,25 MVA. Comparing from viewpoint of currents’ and voltages’ forms obtained by simulations with the ones obtained by measurements on the real installation, are found the following:
The value of the current’s and voltage’s amplitude from the low voltage line obtained by simulations corresponds to the one obtained by measurements made in the stable burning phase.
On the medium voltage supply line is found that both the current’s and the voltage’s amplitude obtained by simulations correspond with the ones obtained by measurements made in the reduction phase [20]. Based on the results obtained by simulations, using a Matlab program, were determined the spectral characteristics and the amplitudes of the current’s and voltage’s wave harmonics for the low and medium voltage supply lines.
Comparing the results obtained by simulations with the measured ones can be drawn the following conclusions:
The spectral characteristics obtained by the measurements made on the low voltage supply line in the reduction phase correspund, from the viewpoint of the harmonics present in the specter, with the ones obtained by simulation.
In case of the medium voltage supply line is found the same correspondence between the spectral characteristics obtained for the signals measured in the reduction phase and the ones obtained by simulation. In voltage’s case is found that, following simulations, the harmonics of which order/rank is multiple of 3 are strongly damped, fact which corresponds to the real situation. Based on these observations, results that from the viewpoint of amplitudes, variation forms, but also from the viewpoint of the frequency characteristics and harmonics amplitude of currents and voltages, the values of the electric installation’s parameters and of the chosen model’s parameters allow a good reproduction of the operation of the EAF real installation. 4.2. Simulation of the real installation’s operation using unequal values of the electric arc’s length The influence of the unequalness of the electric arc’s length on the three phases is reflecting on the appearance of different values of extinction voltage on the three phases, determining the appearance of a strongly unbalanced regime. If the EAF is provided with automatic installation for electrodes’ position adjustment, the unbalance which appears is reduced by the modification of the electric arcs lengths on the three phases. The total cancellation of the unbalance using the automatic installation for electrodes’ position adjustment is not possible due to the great feedback time, of tenth of seconds, of the electrodes’ positioning system but also due to their small movement speed ( mincm 12≈ ) [20]. Following the simulations, it resulted that, using equal values of the total resistances and total inductivities of the short network’s conductors and choosing for the electric arc’s length
cm 5,12cm 16
cm 5,19
3
2
1
===
lll
, (9)
WSEAS TRANSACTIONS on SYSTEMSManuela Panoiu, Caius Panoiu, Ioan Sora, Anca Iordan and Raluca Rob
ISSN: 1109-2777 704 Issue 7, Volume 7, July 2008
Result the values of the electric arc’s voltage given by the relation:
V 165V 200V 235
3
2
1
===
th
th
th
UUU
(10)
This results by comparing the results from table 1, where are presented the values of the direct sequence components, inverse and homopolar of the currents and voltages resulted by simulation of the unbalance between the two situations. The results were obtained using a Matlab program. Using the diagram from fig. 6, with the electric arc’s length values given by (9), there were made simulations of the installation. Following these simulations, were obtained the variation forms similar to the ones obtained following simulations, with unequal values of the short network’s
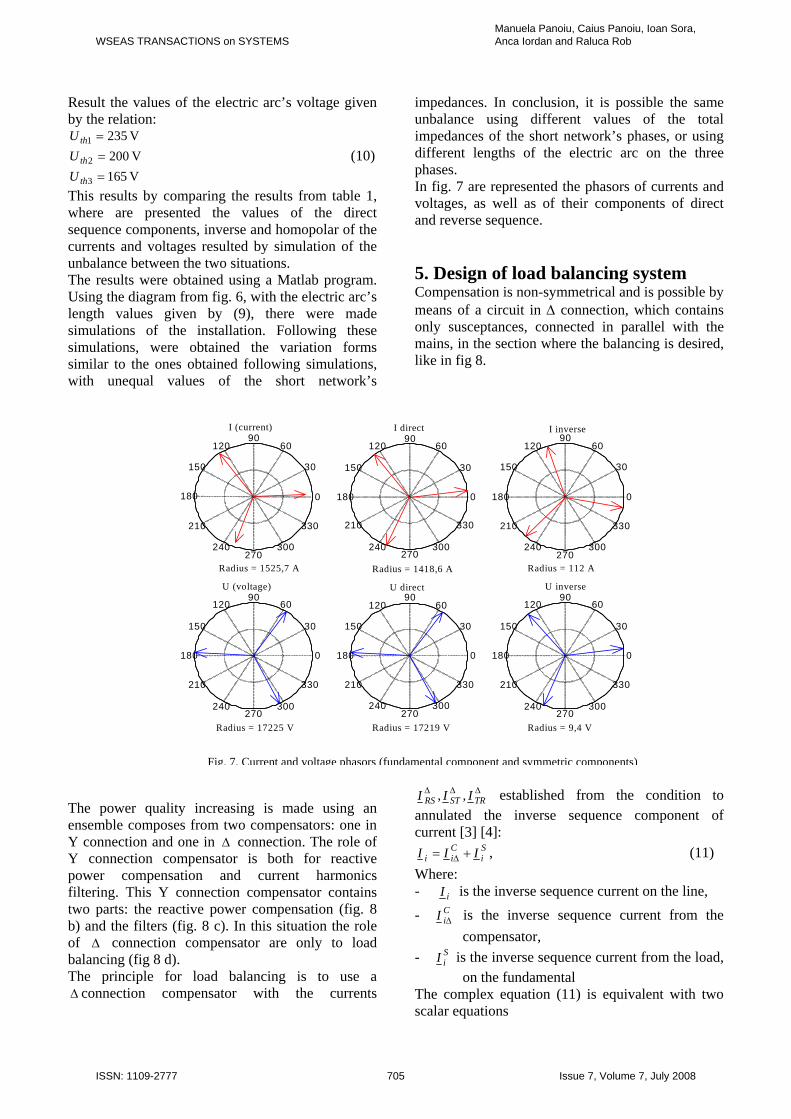
impedances. In conclusion, it is possible the same unbalance using different values of the total impedances of the short network’s phases, or using different lengths of the electric arc on the three phases. In fig. 7 are represented the phasors of currents and voltages, as well as of their components of direct and reverse sequence. 5. Design of load balancing system Compensation is non-symmetrical and is possible by means of a circuit in Δ connection, which contains only susceptances, connected in parallel with the mains, in the section where the balancing is desired, like in fig 8.
I (current) I direct I inverse
The power quality increasing is made using an ensemble composes from two compensators: one in Y connection and one in Δ connection. The role of Y connection compensator is both for reactive power compensation and current harmonics filtering. This Y connection compensator contains two parts: the reactive power compensation (fig. 8 b) and the filters (fig. 8 c). In this situation the role of connection compensator are only to load balancing (fig 8 d).
Δ
The principle for load balancing is to use a connection compensator with the currents Δ
ΔΔΔTRSTRS III ,, established from the condition to
annulated the inverse sequence component of ]:current [3] [4
Si
Cii II = I+ , (11) Δ
Where: - iI is the inverse sequence current on the line, - C
iI Δ is the inverse sequence current from the compensator,
- SiI is the inverse sequence current from the load,
on the fundamental The complex equation (11) is equivalent with two
ations
scalar equ
Fig. 7. Current and voltage phasors (fundamental component and symmetric components)
Radius = 1525,7 A
30
210
60
240
90
270
120
300
150
330
180 0
U (voltage)
Radius = 17225 V
30
210
60
240
90
270
120
300
150
330
180 0
Radius = 1418,6 A
30
210
60
240
90
270
120
300
150
330
180 0
30
210
60
240
90
270
120
300
150
330
180 0
Radius = 112 A
U inverse U direct
Radius = 17219 V
30
210
60
240
90
270
120
300
150
330
180 0
30
210
60
240
90
270
120
300
150
330
180 0
Radius = 9,4 V
WSEAS TRANSACTIONS on SYSTEMSManuela Panoiu, Caius Panoiu, Ioan Sora, Anca Iordan and Raluca Rob
ISSN: 1109-2777 705 Issue 7, Volume 7, July 2008
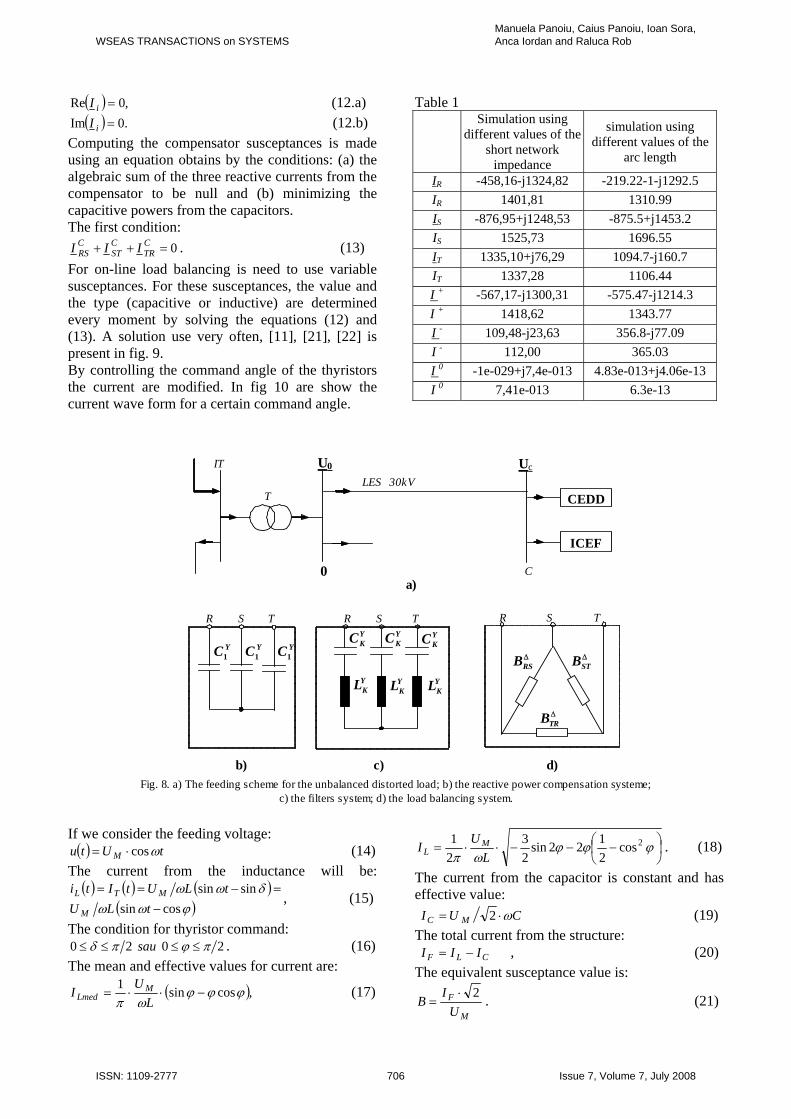
( ) ,0Re =iI (12.a) ( ) .0Im =iI (12.b)
Computing the compensator susceptances is made using an equation obtains by the conditions: (a) the algebraic sum of the three reactive currents from the compensator to be null and (b) minimizing the
om the capacitors. The first conditioncapacitive powers fr
: 0=++ C
TRCST
CRS III . (13)
For on-line load balancing is need to use variable susceptances. For these susceptances, the value and the type (capacitive or inductive) are determined every moment by solving the equations (12) and (13). A solution use very often, [11], [21], [22] is present in fig. 9. By controlling the command angle of the thyristors the current are modified. In fig 10 are show the urrent wave form for a certain command angle.
Table 1
diff he s differ f the
c
Simulation using erent values of t
hort network impedance
simulation using ent values oarc length
IR -458 ,82 -219 2.5 ,16-j1324 .22-1-j129IR 1401,81 1310.99 IS -876 ,53 -87 .2 ,95+j1248 5.5+j1453IS 1525,73 1696.55 IT 133 29 10 .7 5,10+j76, 94.7-j160IT 1337,28 1106.44 I + -567 ,31 -57 3 ,17-j1300 5.47-j1214.I + 1418,62 1343.77 I - 109 3 35,48-j23,6 6.8-j77.09 I - 112,00 365.03 I 0 -1e- 13 4.83e- e-13 029+j7,4e-0 013+j4.06I 0 7,41e-013 6.3e-13
YC1
CEDD
ICEF
IT
T
U0 Uc
0 C
LES 30kV
b)
R S T
YC1 YC1
YKL
YKC Y
KC YKC
R S T
YKL Y
KL
R S T
ΔRSB Δ
STB
ΔTRB
c) d) Fig. 8. a) The feeding scheme for the unbalanced distorted load; b) the reactive power compensation systeme;
c) the filters system; d) the load balancing system.
a)
If we consider the feeding voltage: ( ) tUtu M ωcos⋅= (14)
the inductance will be: The current from( ) ( ) ( )
( )ϕωω cossin −tLU M
The condition for thyristor mmand:
δωω sinsin =−== tLUtIti MTL , (15)
co2020 πϕπδ ≤≤≤≤ sau .
The mean and effective values for current are: (16)
( ,cossin1 ϕϕϕωπ
−⋅⋅=L
UI M
Lmed
⎟⎠⎝ωπ 222 L
The current from the capacitor is constant and has effective value:
⎞⎜⎛ −−−⋅⋅= ϕϕϕ 2cos122sin31 UI M
L . (18)
CUI MC ω⋅= 2 (19) he total cur n rom the structure: T re t f
CLF III −= , The equivalent susceptance value is:
(20)
) (17) M
F
UI
B2⋅
= . (21)
WSEAS TRANSACTIONS on SYSTEMSManuela Panoiu, Caius Panoiu, Ioan Sora, Anca Iordan and Raluca Rob
ISSN: 1109-2777 706 Issue 7, Volume 7, July 2008
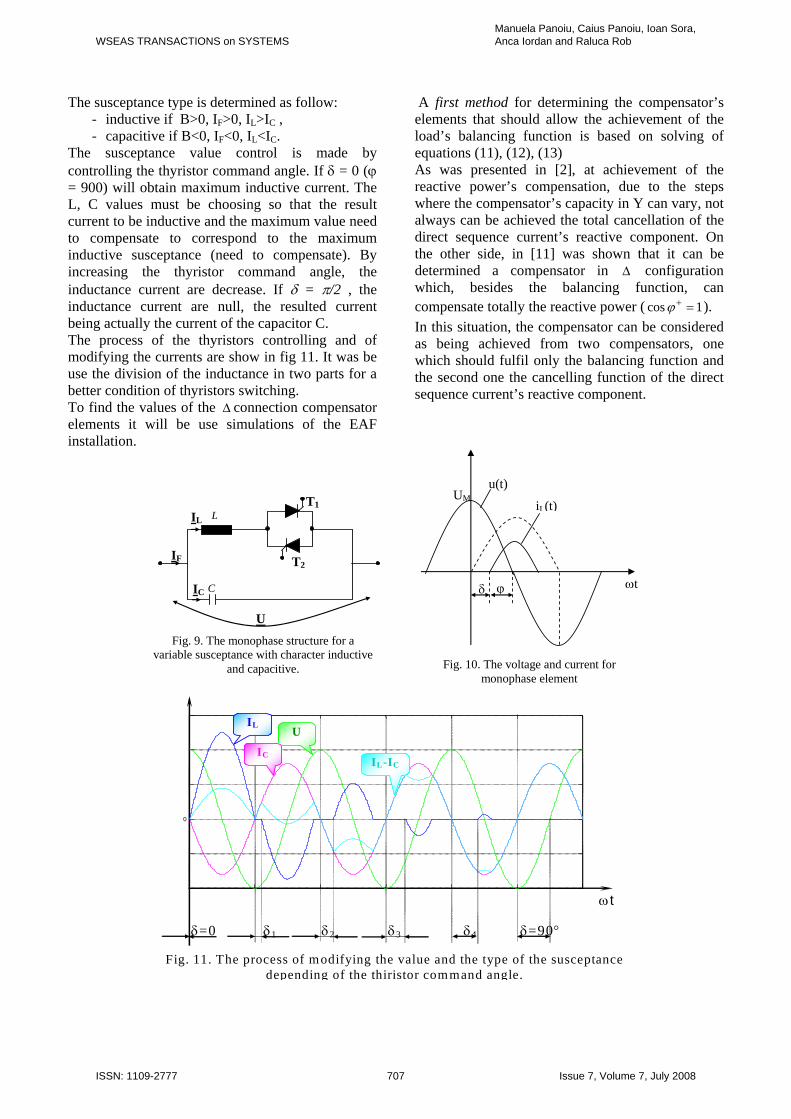
The susceptance type is determined as follow: - inductive if B>0, IF>0, IL>IC , - capacitive if B<0, IF<0, IL<IC.
The susceptance value control is made by controlling the thyristor command angle. If δ = 0 (ϕ = 900) will obtain maximum inductive current. The L, C values must be choosing so that the result current to be inductive and the maximum value need to compensate to correspond to the maximum inductive susceptance (need to compensate). By increasing the thyristor command angle, the inductance current are decrease. If δ = π/2 , the inductance current are null, the resulted current being actually the current of the capacitor C. The process of the thyristors controlling and of modifying the currents are show in fig 11. It was be use the division of the inductance in two parts for a better condition of thyristors switching. To find the values of the connection compensator elements it will be use simulations of the EAF installation.
Δ
A first method for determining the compensator’s elements that should allow the achievement of the load’s balancing function is based on solving of equations (11), (12), (13) As was presented in [2], at achievement of the reactive power’s compensation, due to the steps where the compensator’s capacity in Y can vary, not always can be achieved the total cancellation of the direct sequence current’s reactive component. On the other side, in [11] was shown that it can be determined a compensator in configuration which, besides the balancing function, can compensate totally the reactive power ( ).
Δ
1 cos =+ϕIn this situation, the compensator can be considered as being achieved from two compensators, one which should fulfil only the balancing function and the second one the cancelling function of the direct sequence current’s reactive component.
u(t)
iL(t)
ωt δ ϕ
UM
Fig. 10. The voltage and current for monophase element
T1
T2
IL L
C IC
IF
U Fig. 9. The monophase structure for a
variable susceptance with character inductive and capacitive.
0
IL U
IC IL-IC
Fig. 11. The process of modifying the value and the type of the susceptance depending of the thiristor command angle.
δ=0 δ1 δ2 δ3 δ4 δ=90°
ωt
WSEAS TRANSACTIONS on SYSTEMSManuela Panoiu, Caius Panoiu, Ioan Sora, Anca Iordan and Raluca Rob
ISSN: 1109-2777 707 Issue 7, Volume 7, July 2008
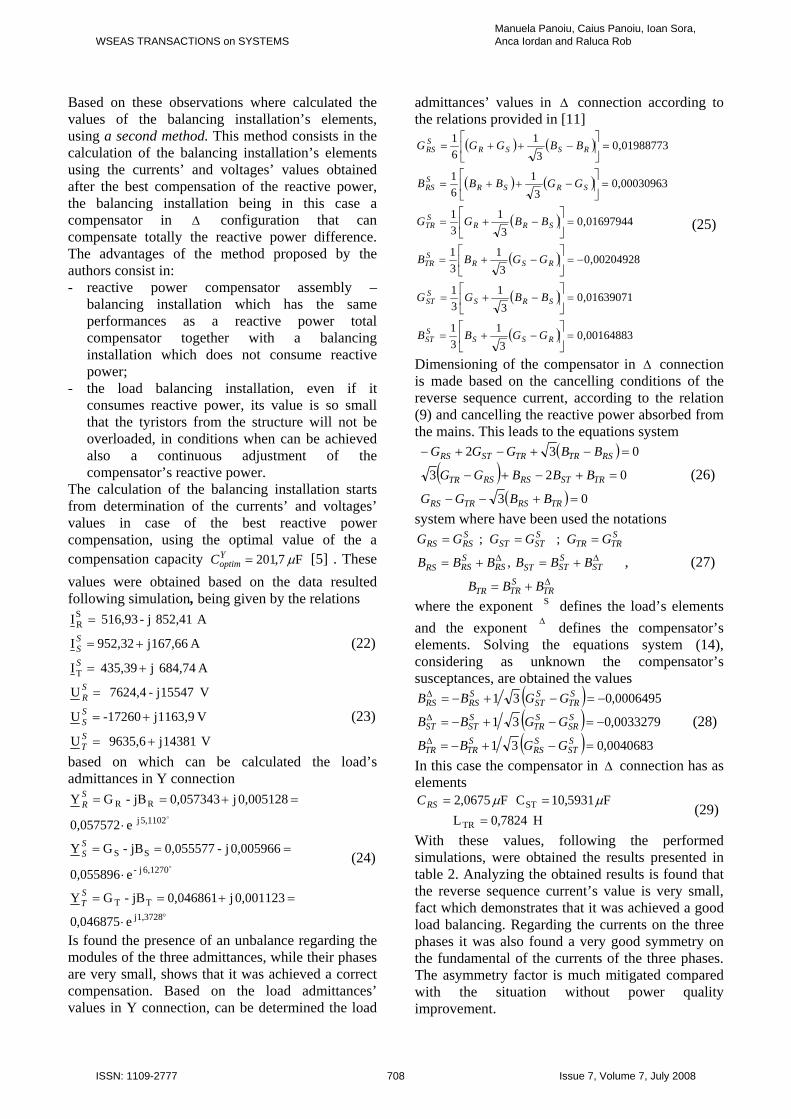
Based on these observations where calculated the values of the balancing installation’s elements, using a second method. This method consists in the calculation of the balancing installation’s elements using the currents’ and voltages’ values obtained after the best compensation of the reactive power, the balancing installation being in this case a compensator in configuration that can compensate totally the reactive power difference. The advantages of the method proposed by the authors consist in:
Δ
- reactive power compensator assembly – balancing installation which has the same performances as a reactive power total compensator together with a balancing installation which does not consume reactive power;
- the load balancing installation, even if it consumes reactive power, its value is so small that the tyristors from the structure will not be overloaded, in conditions when can be achieved also a continuous adjustment of the compensator’s reactive power.
The calculation of the balancing installation starts from determination of the currents’ and voltages’ values in case of the best reactive power compensation, using the optimal value of the a compensation capacity [5] . These values were obtained based on the data resulted following simulation, being given by the relations
F 7,201 μ=YoptimC
A 684,74 j435,39 I
A 167,66 j952,32I
A 852,41 j- 516,93 I
T
SR
+=
+=
=
S
SS (22)
V 14381 j9635,6 U
V 1163,9 j-17260U
V 15547 j- 7624,4 U
+=
+=
=
ST
SS
SR
(23)
based on which can be calculated the load’s admittances in Y connection
°⋅
=+==
⋅
===
⋅
=+==
1,3728 jTT
6,1270 j -
SS
5,1102 j
RR
e046875,0
0,001123 j0,046861jB-GY
e0,055896
0,005966 j - 0,055577jB-GY
e0,057572
0,005128 j0,057343jB-GY
ST
SS
SR
o
o
(24)
Is found the presence of an unbalance regarding the modules of the three admittances, while their phases are very small, shows that it was achieved a correct compensation. Based on the load admittances’ values in Y connection, can be determined the load
admittances’ values in connection according to the relations provided in [11]
Δ
( ) ( )
( ) ( )
( )
( )
( )
( ) 00164883,03
131
01639071,03
131
00204928,03
131
01697944,03
131
00030963,03
161
01988773,03
161
=⎥⎦
⎤⎢⎣
⎡−+=
=⎥⎦
⎤⎢⎣
⎡−+=
−=⎥⎦
⎤⎢⎣
⎡−+=
=⎥⎦
⎤⎢⎣
⎡−+=
=⎥⎦
⎤⎢⎣
⎡−++=
=⎥⎦
⎤⎢⎣
⎡−++=
RSSSST
SRSSST
RSRSTR
SRRSTR
SRSRSRS
RSSRSRS
GGBB
BBGG
GGBB
BBGG
GGBBB
BBGGG
(25)
Dimensioning of the compensator in Δ connection is made based on the cancelling conditions of the reverse sequence current, according to the relation (9) and cancelling the reactive power absorbed from the mains. This leads to the equations system
( )
( )( ) 03
023
032
=+−−
=+−+−
=−+−+−
TRRSTRRS
TRSTRSRSTR
RSTRTRSTRS
BBGG
BBBGG
BBGGG
(26)
system where have been used the notations
Δ
ΔΔ
+=
+=+=
===
TRSTRTR
STSSTSTRS
SRSRS
STRTR
SSTST
SRSRS
BBB
BBBBBB
GGGGGG
,
;;
, (27)
where the exponent S defines the load’s elements and the exponent defines the compensator’s elements. Solving the equations system (14), considering as unknown the compensator’s susceptances, are obtained the values
Δ
( )( )( ) 0040683,031
0033279,031
0006495,031
=−+−=
−=−+−=
−=−+−=
Δ
Δ
Δ
SST
SRS
STRTR
SSR
STR
SSTST
STR
SST
SRSRS
GGBB
GGBB
GGBB
(28)
In this case the compensator in connection has as elements
Δ
H 7824,0L F 5931,10C F 0675,2
TR
ST
=== μμRSC
(29)
With these values, following the performed simulations, were obtained the results presented in table 2. Analyzing the obtained results is found that the reverse sequence current’s value is very small, fact which demonstrates that it was achieved a good load balancing. Regarding the currents on the three phases it was also found a very good symmetry on the fundamental of the currents of the three phases. The asymmetry factor is much mitigated compared with the situation without power quality improvement.
WSEAS TRANSACTIONS on SYSTEMSManuela Panoiu, Caius Panoiu, Ioan Sora, Anca Iordan and Raluca Rob
ISSN: 1109-2777 708 Issue 7, Volume 7, July 2008
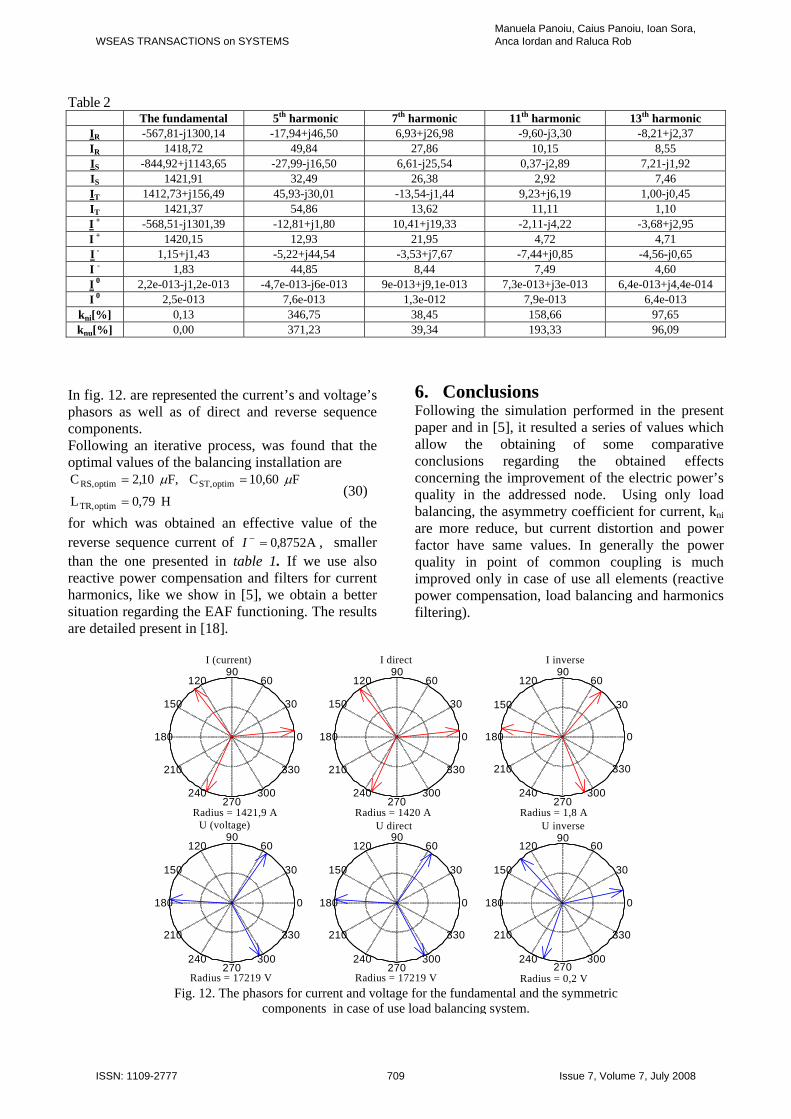
Table 2 The fundamental 5th harmonic 7th harmonic 11th harmonic 13th harmonic
IR -567,81-j1300,14 -17,94+j46,50 6,93+j26,98 -9,60-j3,30 -8,21+j2,37 IR 1418,72 49,84 27,86 10,15 8,55 IS -844,92+j1143,65 -27,99-j16,50 6,61-j25,54 0,37-j2,89 7,21-j1,92 IS 1421,91 32,49 26,38 2,92 7,46 IT 1412,73+j156,49 45,93-j30,01 -13,54-j1,44 9,23+j6,19 1,00-j0,45 IT 1421,37 54,86 13,62 11,11 1,10 I + -568,51-j1301,39 -12,81+j1,80 10,41+j19,33 -2,11-j4,22 -3,68+j2,95 I + 1420,15 12,93 21,95 4,72 4,71 I - 1,15+j1,43 -5,22+j44,54 -3,53+j7,67 -7,44+j0,85 -4,56-j0,65 I - 1,83 44,85 8,44 7,49 4,60 I 0 2,2e-013-j1,2e-013 -4,7e-013-j6e-013 9e-013+j9,1e-013 7,3e-013+j3e-013 6,4e-013+j4,4e-014 I 0 2,5e-013 7,6e-013 1,3e-012 7,9e-013 6,4e-013
kni[%] 0,13 346,75 38,45 158,66 97,65 knu[%] 0,00 371,23 39,34 193,33 96,09
In fig. 12. are represented the current’s and voltage’s phasors as well as of direct and reverse sequence components. Following an iterative process, was found that the optimal values of the balancing installation are
H 79,0L
F 60,10CF, 10,2C
optimTR,
optimST,optimRS,
=
== μμ (30)
for which was obtained an effective value of the reverse sequence current of , smaller than the one presented in table 1. If we use also reactive power compensation and filters for current harmonics, like we show in [5], we obtain a better situation regarding the EAF functioning. The results are detailed present in [18].
A8752,0=−I
6. Conclusions Following the simulation performed in the present paper and in [5], it resulted a series of values which allow the obtaining of some comparative conclusions regarding the obtained effects concerning the improvement of the electric power’s quality in the addressed node. Using only load balancing, the asymmetry coefficient for current, kni are more reduce, but current distortion and power factor have same values. In generally the power quality in point of common coupling is much improved only in case of use all elements (reactive power compensation, load balancing and harmonics filtering).
I (current) I direct I inverse
Fig. 12. The phasors for current and voltage for the fundamental and the symmetric
components in case of use load balancing system.
Radius = 1421,9 A
30
210
60
240
90
270
120
300
150
330
180 0
U (voltage)
Radius = 17219 V
30
210
60
240
90
270
120
300
150
330
180 0
Radius = 1420 A
30
210
60
240
90
270
120
300
150
330
180 0
Radius = 1,8 A
30
210
60
240
90
270
120
300
150
330
180 0
U direct U inverse
Radius = 17219 V
30
210
60
240
90
270
120
300
150
330
180 0
Radius = 0,2 V
30
210
60
240
90
270
120
300
150
330
180 0
WSEAS TRANSACTIONS on SYSTEMSManuela Panoiu, Caius Panoiu, Ioan Sora, Anca Iordan and Raluca Rob
ISSN: 1109-2777 709 Issue 7, Volume 7, July 2008

References: [1] Panoiu M., Panoiu C., Osaci M, Muscalagiu I.,
Simulation Result about harmonics filtering for Improving the Functioning Regime of the UHP EAF, Proc. of the 7th WSEAS Int. Conf. on Signal Processing, Comp. Geometry and Artificial Vision, Athens, Greece, Aug. 24-26, 2007, pg. 71-76
[2] Panoiu, M., Panoiu, C., Sora, I., Osaci, M., Simulations Results on the Reactive Power Compensation Process on Electric Arc Furnace Using PSCAD-EMTDC, International Journal of Modelling, Identification and Control, vol. 2, no. 3, 2007, pg. 250-257
[3] Panoiu M., Panoiu C., Simulation Results for Modeling the AC Electric Arc as Nonlinear Element using PSCAD EMTDC, WSEAS Transaction on circuits and systems, vol 6, Jan 2007, pp 149-156
[4] Panoiu M., Panoiu C., Sora I., Osaci M., Using a Model Based on Linearization of the Current – Voltage Characteristic for Electric Arc Simulation, Proceedings of the 16th IASTED International Conference on Applied Simulation and Modelling , Palma de Mallorca, Spain, August 29 – 31, 2007, pag. 99-103,
[5] Panoiu M., Panoiu C., Osaci M, Muscalagiu I., Simulation Result about Harmonics Filtering using Measurement of Some Electrical Items in Electrical Installation on UHP EAF, WSEAS Transaction on circuits and systems, vol 7, Jan 2008, pp 22-31
[6] Montanari, G.C., Loggini, M., Cavallini, A., Pitti, L., Zaminelli, D., Arc-Furnace model for the Study of Flicker Compensation in Electrical Networks, IEEE Transactions on Power Delivery, vol. 9, No. 4, 1994, pg. 2026-2036
[7] Tang, L., Kolluri, S., Mark, F. Mc-Granaghan, Voltage Flicker Prediction for two simultaneously operated Arc Furnaces, IEEE Trans. on Power Delivery, vol. 12, No. 2, 1997.
[8] Benoit Boulet, Gino Lalli and Mark Agersch, Modeling and Control of an Electric Arc Furnace, Proc. of the American Control Conference, Denver, , 2003, pp. 3060-3064.
[9] Cano Plata E.A., Tacca H.E., Arc Furnace Modeling in ATP-EMTP, The 6th International Conference on Power Systems Transients (IPST), 2005, june 19-23, Montreal Canada
[10] S. Chitchian and M. Akhbari, A Simple Arc Furnace Model for Power System Harmonic Studies, Proceeding (409) Power and Energy Systems - 2003
[11] Buta, A., Pana, A., Ivaşcu, C., Reactive power compensation criteria in unbalanced electrical networks, Energetica, vol. 45, 1997, pp. 289-294.
[12] Arseneau, R., Baghzouz, Y., Belanger, J., Bowes, K., et. al., Practical definitions for powers in systems with nonsinusoidal waveforms and unbalanced loads, IEEE Trans. on Power Delivery, vol. 11, 1998, pg. 79-87.
[13] Harmonics Working Group IEEE PES T&D Committee, Modeling of components with nonlinear voltage current characteristics for harmonic studies, Power Engineering Society General Meeting, IEEE Publication, 6-10, June 2004, page(s): 769 – 772, Vol.1
[14] IEEE Standard 519-1992, “IEEE Recommended Practices and Requirements for Harmonic Control in Electrical Power Systems,” New York, 1992.
[15] Quispe, E., Viego, P., Cogollos, J., Statistical equations to evaluate the effects of voltage unbalance on the efficiency and power factor of a three-phase induction motors , WSEAS Transactions on Circuits and Systems 4 (4), pp. 234-239
[16] Martínez-Cárdenas, F., Medina, A., Digital protection systems response to frequency variations, sequence components, unbalance and non sinusoidal operation conditions , WSEAS Transactions on Circuits and Systems 5 (12), pp. 1795-1802
[17] Medina, A., Martinez-Cardenas, F., Analysis of the harmonic distortion and unbalanced conditions in the operation of electro-mechanical and digital protection relays, WSEAS Transactions on Circuits and Systems 5 (4), pp. 582-589
[18] Panoiu, M., Panoiu, C., Sora, I., Simulation results regarding harmonics filtering, reactive power compensation and load balancing on power loads, Proceedings of the 17th IASTED International Conference on Applied Simulation and Modeling, pp 71-76, Corfu, 2008
[19] Panoiu, M., Panoiu, C., Sora, I., Experimental Research Concerning the Electromagnetic Pollution Generated by the 3-Phase Electric Arc Furnaces in the Electric Power Supply Networks, Acta Electrotehnica, nr.2, vol 47, pp 102-112, 2006
[20] Panoiu, M., Panoiu, C., Sora, I., Modeling of Three Phase Electric Arc Furnace, Acta Electrotehnica, nr.2, vol 48, pp 124-134, 2007
[21] Czarnecki, L., S., Shin, M., H., Guangda, C., Adaptive balancing compensator, IEE Transactions on Power Delivery, vol.10, no.3, 1995, pp.1663-1669.
[22] Maltavelli, P., Tenti, P., An Integrated Design Approach of Hybrid Compensation Systems, IEEE Transactions on Industry Applications, pg. 2348-2355, 1996
[23] www.pscad.com
WSEAS TRANSACTIONS on SYSTEMSManuela Panoiu, Caius Panoiu, Ioan Sora, Anca Iordan and Raluca Rob
ISSN: 1109-2777 710 Issue 7, Volume 7, July 2008