Embed Size (px)
Citation preview

Using Propagation Models to Build FingerprintMaps and Assess Location Estimation
Algorithms PerformancePedro Mestre, Member, IAENG, Joao Cordeiro, Luis Reigoto, Luis Coutinho, Paulo Botelho,
and Carlos Serodio, Member, IAENG
Abstract—Performance of Fingerprinting-based Location Es-timation Algorithms can be improved by using the user direc-tion information when Fingerprint Maps are generated. Insteadof using a single Map, multiple maps can be used, and theLocation Estimation Algorithm can choose the best map orcombine the information of a subset of best maps. However,collecting data to build the Fingerprint Maps is a very timeconsuming task, therefore, collecting data to build multiplemaps is even more time consuming. Also, any change in thescenario (e.g. new furniture) implies that new data must becollected to update the Fingerprint Map. The time it takesto collect data for N directional maps, instead of only one,increases by a factor of N. A possible solution to cope withthis problem is to generate those maps using propagationmodels. This is the technique proposed in this paper, whichuses propagation models, that include information about theuser influence on the Received Signal Strength, to generate theFingerprint Maps. These propagation models can be used bothto build the Fingerprint Maps and to generate data sets used totest Location Estimation Algorithms. It is possible to simulateRSS values, and eliminate the need of collecting real data, totest Location Estimation Algorithms, for example during thedevelopment phase.
Index Terms—Fingerprinting, Location Estimation Algo-rithm, Indoor, Propagation Models.
I. INTRODUCTION
F INGERPRINTING, one of the most used location esti-mation techniques for indoor environments [1], consists
on collecting information about some property of wirelessnetworks, and compare it to values previously stored in aset of data called the Fingerprint Map (FM) [2], [3], [4].Although any property of the wireless signal can be used in
Manuscript received March 7, 2016; revised April 4, 2016.P. Mestre is with Centre for the Research and Technology of Agro-
Environmental and Biological Sciences, CITAB, University of Tras-os-Montes and Alto Douro, UTAD, Quinta de Prados, 5000-801 Vila Real,Portugal, www.utad.pt, and, Algoritmi Research Centre, Guimaraes, Portu-gal (phone: +351-259350363; email: [email protected])
J. Cordeiro is with GisTree, UTAD, Quinta de Prados, 5000-801 VilaReal, Portugal, www.gistree.pt (email: [email protected])
L. Reigoto is with NEOS by BOLD, Rua do Engenheiro Carlos BoiaNo29, Aveiro, 3810-702 Aveiro, Portugal, www.neosbybold.com (email:[email protected])
L. Coutinho is with University of Tras-os-Montes and Alto Douro,UTAD, Quinta de Prados, 5000-801 Vila Real, Portugal (email:[email protected])
P. Botelho is with University of Tras-os-Montes and Alto Douro, UTAD,Quinta de Prados, 5000-801 Vila Real, Portugal, www.utad.pt (email:[email protected])
C. Serodio is with Centre for the Research and Technology of Agro-Environmental and Biological Sciences, CITAB, University of Tras-os-Montes and Alto Douro, UTAD, Quinta de Prados, 5000-801 Vila Real,Portugal, www.utad.pt, and Algoritmi Research Centre, Guimaraes, Portugal(email: [email protected])
Fingerprinting, usually the Received Signal Strength (RSS)value is used. Data to build the FM is collected duringa phased called the off-line phase, at which several datasamples are collected at each point of the spatial domainthat will be used in the map.
With the objective of increasing the performanceof Fingerprinting-based Location Estimation Algorithms(LEA), the authors presented in [5] a Fingerprinting-basedsolution that uses multiple Fingerprint Maps. Instead ofcollecting only data about the RSS values, it was alsocollected data about the user direction (azimuth), using thesmartphone magnetic sensor. It was then possible to buildmultiple Fingerprint Maps, based on the user direction, e.g.North, South, East and West. Two approaches were proposedto select the map to be used during the on-line phase: thefirst consists in selecting the best FM, and do the locationestimation based on that map; the other option consists onusing the best N maps and then combine the solutions basedon the contribution of each map (weighted average).
One of the drawbacks of Location Estimation using Fin-gerprinting is that collecting data to build the FM can be avery time consuming task, because data must be collectedat multiple spatial domain points, and, at each point severalsamples must be collected. For example in [6], 20 sample perspatial coordinates were collected. If, instead of collectingdata for a single FM, data is collected to build multipleFingerprinting maps, then the time needed to collect datawill be much longer.
The above mentioned problem can be solved if instead ofcollecting in loco data, to build the FM, propagation modelsare used. In this paper it is presented an extension to themethods proposed by the authors in [7], and Multiple Fin-gerprint Maps are generated by simulating both the expectedRSS values and the user direction. The user direction willalso have a direct influence on the RSS values.
When improving existing LEA, or when creating newones, it is often needed to feed the Location EstimationAlgorithm with test data sets. These data sets can be realdata, collected at real scenarios, with the above mentioneddrawbacks, or can be simulated data. This paper will alsopresent a solution for generating test data sets based on prop-agation model data, the user position, and some randomnessassociated do wireless signals. Propagation models will beused to simulate RSS values used by the Location EstimationAlgorithms.
To test the feasibility of building multiple FingerprintMaps (with user direction information), and to generate datasets based on RSS values simulation, based on propagation
Proceedings of the World Congress on Engineering 2016 Vol I WCE 2016, June 29 - July 1, 2016, London, U.K.
ISBN: 978-988-19253-0-5 ISSN: 2078-0958 (Print); ISSN: 2078-0966 (Online)
WCE 2016
models, three of the classic Location Estimation Algorithmsare used: Nearest Neighbour; k-Nearest Neighbour; WeightedNearest Neighbour. Results will also be compared to dataobtained using real values that were acquired in the testingscenario.
II. GENERATING FINGERPRINT MAPS USINGPROPAGATION MODELS
With the objective of making the FM generation an easierand faster task, by eliminating the need to collect datain loco, it was proposed by the authors in [7] the useof Propagation Models to generate the Fingerprint Maps.Instead of collecting data at every point of the real scenario,a simulation was made using a blueprint of the scenario thatincludes information about obstacles (furniture, doors, walls,etc) and propagation models. One of the advantages of thistechnique is that if the scenario changes, it is only neededto update the blueprint information, run the simulation againand generate the new Fingerprint Map.
Because in [7] the user direction was not considered, asingle map was generated. Information on the generated FMwas equivalent to that of collecting data in all directions(with the user rotating while acquiring data), but withoutconsidering the attenuation of the user’s body (i.e. theinfluence of the user’s direction).
From the several propagation models that could be usedto build the FM, and to simulate the RSS values, becauseof the results obtained in [8], the modified Motley-Keenanmodel (Eq. 1) is going to be used:
PL(d) = PL(d0) + 10nlog
(d
d0
)+
N∑i=1
kiLωi (1)
The above equation models the total Path Loss, as afunction of the distance between the transmitter and thereceiver (d), the Path Loss at a reference distance (PL(d0)),the Path Loss exponent (n), which may vary according tothe structure of the building [9], the number of walls of typei (ki) and the attenuation factor for walls of type i (Lωi).
When there are walls of the same type, but with differentthicknesses, the adjusted model of Eq. 2 can be used instead:
PL(d) = PL(d0)+10nlog
(d
d0
)+
N∑i=1
kiL0i2log3(
εiε0i
) (2)
where:
• L0i: is the attenuation of a reference wall with thicknessε0;
• ki: is the number of type i walls that have thinness εi.
A. Simulation of the Fingerprint Maps
Even though the above presented model can be used topredict the expected RSS values at each spatial point of thereal scenario, and therefore be used to build the FingerprintMap, it does not take into account the losses because of theuser presence. The use of multiple Fingerprint Maps onlymakes sense if information about the user position is includedin the Fingerprint Map.
To Equation 2 it must therefore be added the user atten-uation (Ua), and the final model equation (considering theuser influence) is as in 3:
PL(d) = PL(d0)+Ua+10nlog
(d
d0
)+
N∑i=1
kiL0i2log3(
εiε0i
)
(3)Relatively to the values for the user attenuation (Ua), in
the literature several values can be found. According to [3],[10] a single human body can cause an attenuation in therange of 3.5dB to 5.0dB.
In the simulations presented in this paper it will beconsidered that the user is always facing the mobile terminal,therefore the user will be an obstacle only for those refer-ences that lie behind him/her. For all Access Points that theuser is facing, it is used Equation 2 to model the propagationdata (there is no user-caused attenuation), otherwise Equation3 is used.
B. Simulation of On-Line RSS Values
Another objective of this work is the simulation of on-line RSS values, i.e., values that are fed to the LocationEstimation Algorithms for testing purposes. To simulatethese values propagation models can also be used. Data,to simulate the RSS values, will be generated based onEquations 2 and 3, depending on the user direction relativelyto the Access Points. However these equations, cannot beused as they are, to simulate on-line data, because they aredeterministic, and wireless signals have a slight randomness.
Since Fingerprint Maps are usually built using many datasamples, which are averaged, the randomness of acquireddata fades. This means that deterministic models can be usedto build the Fingerprint Map.
However, to mimic real data acquired from the wirelesstransceiver (e.g. during the on-line phase), some randomnessmust be added to the model. This characteristic is obtainedby adding a random variable Xσ , that denotes a Gaussianvariable with zero mean and standard deviation σ [11], toEquations 2 and 3.
III. TESTING SCENARIO AND CONDITIONS
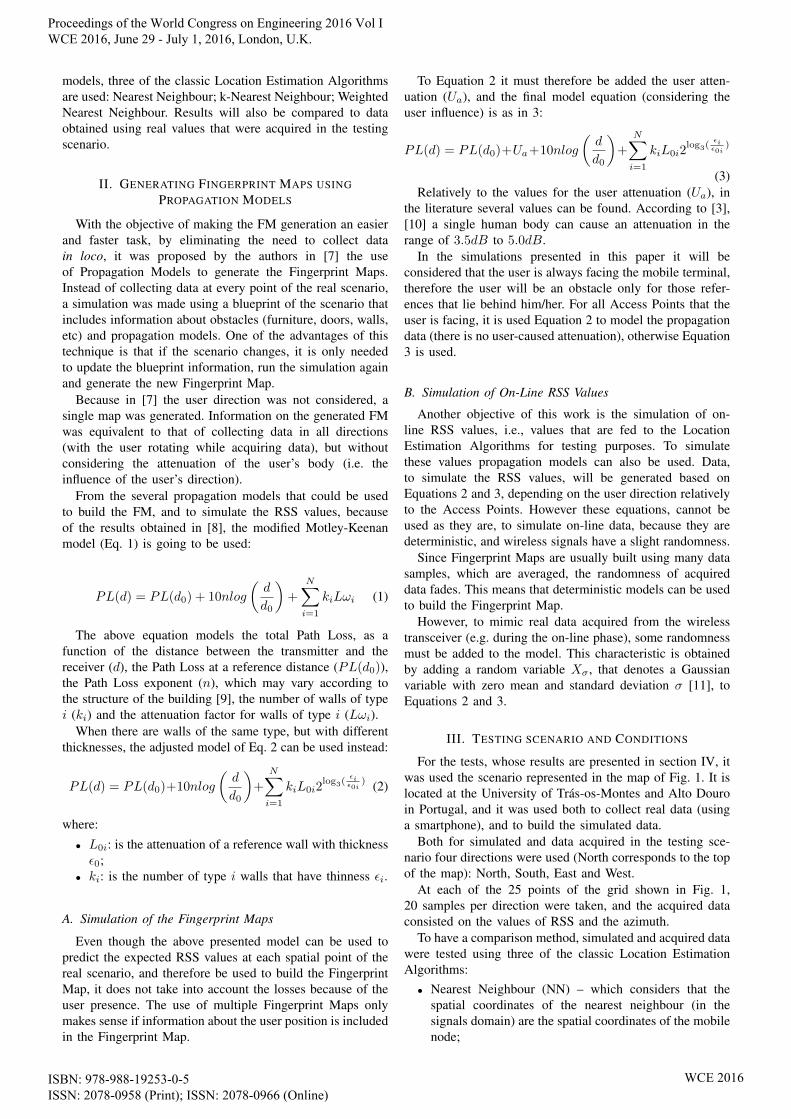
For the tests, whose results are presented in section IV, itwas used the scenario represented in the map of Fig. 1. It islocated at the University of Tras-os-Montes and Alto Douroin Portugal, and it was used both to collect real data (usinga smartphone), and to build the simulated data.
Both for simulated and data acquired in the testing sce-nario four directions were used (North corresponds to the topof the map): North, South, East and West.
At each of the 25 points of the grid shown in Fig. 1,20 samples per direction were taken, and the acquired dataconsisted on the values of RSS and the azimuth.
To have a comparison method, simulated and acquired datawere tested using three of the classic Location EstimationAlgorithms:
• Nearest Neighbour (NN) – which considers that thespatial coordinates of the nearest neighbour (in thesignals domain) are the spatial coordinates of the mobilenode;
Proceedings of the World Congress on Engineering 2016 Vol I WCE 2016, June 29 - July 1, 2016, London, U.K.
ISBN: 978-988-19253-0-5 ISSN: 2078-0958 (Print); ISSN: 2078-0966 (Online)
WCE 2016
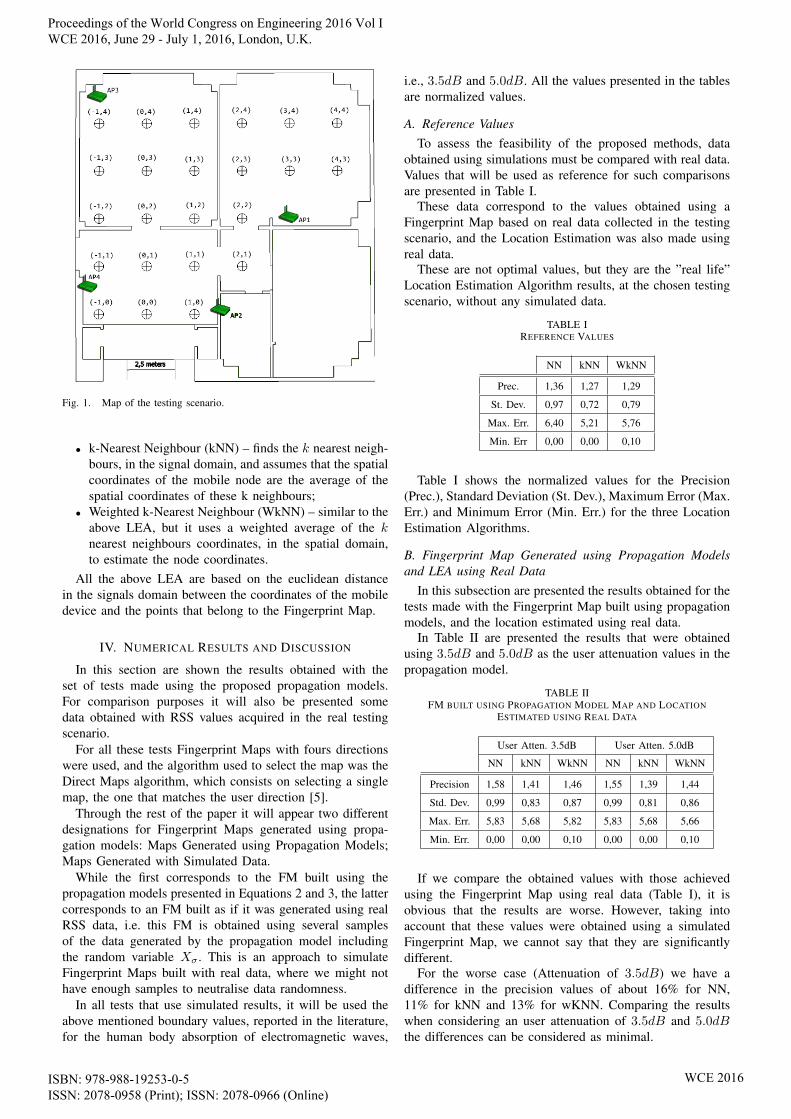
Fig. 1. Map of the testing scenario.
• k-Nearest Neighbour (kNN) – finds the k nearest neigh-bours, in the signal domain, and assumes that the spatialcoordinates of the mobile node are the average of thespatial coordinates of these k neighbours;
• Weighted k-Nearest Neighbour (WkNN) – similar to theabove LEA, but it uses a weighted average of the knearest neighbours coordinates, in the spatial domain,to estimate the node coordinates.
All the above LEA are based on the euclidean distancein the signals domain between the coordinates of the mobiledevice and the points that belong to the Fingerprint Map.
IV. NUMERICAL RESULTS AND DISCUSSION
In this section are shown the results obtained with theset of tests made using the proposed propagation models.For comparison purposes it will also be presented somedata obtained with RSS values acquired in the real testingscenario.
For all these tests Fingerprint Maps with fours directionswere used, and the algorithm used to select the map was theDirect Maps algorithm, which consists on selecting a singlemap, the one that matches the user direction [5].
Through the rest of the paper it will appear two differentdesignations for Fingerprint Maps generated using propa-gation models: Maps Generated using Propagation Models;Maps Generated with Simulated Data.
While the first corresponds to the FM built using thepropagation models presented in Equations 2 and 3, the lattercorresponds to an FM built as if it was generated using realRSS data, i.e. this FM is obtained using several samplesof the data generated by the propagation model includingthe random variable Xσ . This is an approach to simulateFingerprint Maps built with real data, where we might nothave enough samples to neutralise data randomness.
In all tests that use simulated results, it will be used theabove mentioned boundary values, reported in the literature,for the human body absorption of electromagnetic waves,
i.e., 3.5dB and 5.0dB. All the values presented in the tablesare normalized values.
A. Reference ValuesTo assess the feasibility of the proposed methods, data
obtained using simulations must be compared with real data.Values that will be used as reference for such comparisonsare presented in Table I.
These data correspond to the values obtained using aFingerprint Map based on real data collected in the testingscenario, and the Location Estimation was also made usingreal data.
These are not optimal values, but they are the ”real life”Location Estimation Algorithm results, at the chosen testingscenario, without any simulated data.
TABLE IREFERENCE VALUES
NN kNN WkNN
Prec. 1,36 1,27 1,29
St. Dev. 0,97 0,72 0,79
Max. Err. 6,40 5,21 5,76
Min. Err 0,00 0,00 0,10
Table I shows the normalized values for the Precision(Prec.), Standard Deviation (St. Dev.), Maximum Error (Max.Err.) and Minimum Error (Min. Err.) for the three LocationEstimation Algorithms.
B. Fingerprint Map Generated using Propagation Modelsand LEA using Real Data
In this subsection are presented the results obtained for thetests made with the Fingerprint Map built using propagationmodels, and the location estimated using real data.
In Table II are presented the results that were obtainedusing 3.5dB and 5.0dB as the user attenuation values in thepropagation model.
TABLE IIFM BUILT USING PROPAGATION MODEL MAP AND LOCATION
ESTIMATED USING REAL DATA
User Atten. 3.5dB User Atten. 5.0dB
NN kNN WkNN NN kNN WkNN
Precision 1,58 1,41 1,46 1,55 1,39 1,44
Std. Dev. 0,99 0,83 0,87 0,99 0,81 0,86
Max. Err. 5,83 5,68 5,82 5,83 5,68 5,66
Min. Err. 0,00 0,00 0,10 0,00 0,00 0,10
If we compare the obtained values with those achievedusing the Fingerprint Map using real data (Table I), it isobvious that the results are worse. However, taking intoaccount that these values were obtained using a simulatedFingerprint Map, we cannot say that they are significantlydifferent.
For the worse case (Attenuation of 3.5dB) we have adifference in the precision values of about 16% for NN,11% for kNN and 13% for wKNN. Comparing the resultswhen considering an user attenuation of 3.5dB and 5.0dBthe differences can be considered as minimal.
Proceedings of the World Congress on Engineering 2016 Vol I WCE 2016, June 29 - July 1, 2016, London, U.K.
ISBN: 978-988-19253-0-5 ISSN: 2078-0958 (Print); ISSN: 2078-0966 (Online)
WCE 2016

C. Fingerprint Map Generated with Simulated Data andLEA using Real Data
This set of tests consisted in generating the FingerprintMaps based on simulated RSS values, both for an userattenuation of 3.5dB and 5.0dB.
Results presented in Table III were obtained using arandom variable with standard deviation 2dB and in TableIV it was used a standard deviation of 4dB. These valuesfor the standard deviation were chosen empirically.
TABLE IIIFM BUILT USING SIMULATED RSS VALUES WITH σ = 2dB FOR THERANDOM VARIABLE AND LOCATION ESTIMATED USING REAL DATA
User Atten. 3.5dB User Atten. 5.0dB
NN kNN WkNN NN kNN WkNN
Precision 1,59 1,41 1,46 1,57 1,40 1,45
Std. Dev. 0,99 0,84 0,87 0,99 0,81 0,86
Max. Err. 5,83 5,68 5,82 5,83 5,68 5,66
Min. Err. 0,00 0,00 0,10 0,00 0,00 0,10
TABLE IVFM BUILT USING SIMULATED RSS VALUES WITH σ = 4dB FOR THERANDOM VARIABLE AND LOCATION ESTIMATED USING REAL DATA
User Atten. 3.5dB User Atten. 5.0dB
NN kNN WkNN NN kNN WkNN
Precision 1,58 1,40 1,45 1,54 1,41 1,44
Std. Dev. 0,98 0,82 0,86 0,98 0,80 0,85
Max. Err. 5,83 5,68 5,66 5,83 5,47 5,77
Min. Err. 0,00 0,00 0,10 0,00 0,00 0,14
Even though there are slight differences when comparingto the results presented in the previous section (Table II),these difference are not significant.
As a first conclusion, despite the fact that maps weregenerated with the objective of mimicking the behaviourof an FM generated with real RSS values, i.e. have somerandomness, there are other factors that must be taken intoaccount besides adding a simple random variable, at least togenerate the Fingerprint Map.
On the other hand, the simulated RSS values can beused by Location Estimation Applications (e.g. in unit orintegration tests), to build the Fingerprint Map. In he nextsection it will be presented the tests made to assess if theycan also be used to test the LEA.
D. Maps generated using Propagation Model and LEA usingSimulated Data
Tables V, VI, VII and VIII show results of a set oftests that have as objective to verify if it is possible to useFingerprint Maps obtained using Propagation Models andSimulated RSS values to assess the performance of LocationEstimation Algorithms.
In all these tables, the columns 3.5dB and 3.5dB corre-spond to the results obtained using an user attenuation of3.5dB and 3.5dB, for the simulated RSS values.
For the results in Table V and VI, the FM was generatedconsidering a user attenuation of 3.5dB. In Table V the value
of the used standard deviation for the random variable is σ =2dB, and for Table VI the values of the standard deviationis σ = 4dB .
TABLE VFM BUILT USING PROPAGATION MODELS WITH 3.5dB FOR USER
ATTENUATION AND σ = 2dB FOR THE RANDOM VARIABLE
User Atten. 3.5dB User Atten. 5.0dB
NN kNN WkNN NN kNN WkNN
Precision 0,04 0,68 0,34 0,08 0,70 0,36
Std. Dev. 0,25 0,30 0,19 0,34 0,31 0,23
Max. Err. 2,24 1,41 1,75 2,24 1,41 1,93
Min. Err. 0,00 0,00 0,00 0,00 0,00 0,10
TABLE VIFM BUILT USING PROPAGATION MODELS WITH 3.5dB FOR USER
ATTENUATION AND σ = 4dB FOR THE RANDOM VARIABLE
User Atten. 3.5dB User Atten. 5.0dB
NN kNN WkNN NN kNN WkNN
Precision 0,28 0,74 0,48 0,33 0,77 0,51
Std. Dev. 0,61 0,33 0,38 0,63 0,34 0,40
Max. Err. 3,00 2,43 2,50 3,61 2,69 3,11
Min. Err. 0,00 0,00 0,00 0,00 0,00 0,00
For the results in Table VII and VIII, the Fingerprint Mapwas generated considering that the user attenuation is 5.0dB.In Table VII it was considered σ = 2dB for the randomvariable, and for Table VIII, σ = 4dB was used.
TABLE VIIFM BUILT USING PROPAGATION MODELS WITH 5.0dB FOR USER
ATTENUATION AND σ = 2dB FOR THE RANDOM VARIABLE
User Atten. 3.5dB User Atten. 5.0dB
NN kNN WkNN NN kNN WkNN
Precision 0,07 0,69 0,36 0,03 0,69 0,34
Std. Dev. 0,32 0,32 0,22 0,23 0,31 0,19
Max. Err. 2,24 1,49 1,81 2,24 1,41 1,75
Min. Err. 0,00 0,00 0,00 0,00 0,00 0,00
TABLE VIIIFM BUILT USING PROPAGATION MODELS WITH 5.0dB FOR USER
ATTENUATION AND σ = 4dB FOR THE RANDOM VARIABLE
User Atten. 3.5dB User Atten. 5.0dB
NN kNN WkNN NN kNN WkNN
Precision 0,33 0,74 0,50 0,30 0,76 0,50
Std. Dev. 0,64 0,35 0,40 0,62 0,35 0,40
Max. Err. 3,00 2,69 2,50 3,61 2,85 2,80
Min. Err. 0,00 0,00 0,00 0,00 0,00 0,00
Making a first comparison between all these data, it canbe concluded that there is a slight overall difference betweenthe values obtained when considering a user attenuation of3.5dB and 5.0dB, both for the FM and for the simulated
Proceedings of the World Congress on Engineering 2016 Vol I WCE 2016, June 29 - July 1, 2016, London, U.K.
ISBN: 978-988-19253-0-5 ISSN: 2078-0958 (Print); ISSN: 2078-0966 (Online)
WCE 2016

RSS. The higher the value of the user attenuation that isused in the simulations, the more the results approach thosevalues obtained with real data.
Another conclusion is that higher values for the randomvariable standard deviation also produce better results (moresimilar to those with real data). This is particularly noticeablefor the Nearest Neighbour algorithm.
To verify if the systems is behaving as if it was using realdata, the first parameter to be checked are the values for theprecision (localisation error) of Nearest Neighbour. One ofthe characteristics of NN is that the output value is always apoint of the grid. This means that the output of NNb eitherhas zero error or an error equal to the distance of two pointsof he grid.
If the precision values are too close to zero this meansthat either we are using a spatial grid too sparse, or the RSSvalues are very similar to those used to build the FingerprintMap. In the first case, the points of the grid are so distant thatthe probability of error is to low, which is not the case of ourtesting scenario (because of the results presented in Table I).The second case means that the simulated RSS values aretoo similar to those without the random variable added.
Analysing Table V and Table VII we can see that, forthese tests, the precision values are too low, this means thatthe simulated RSS values cannot be used to test the LEA.
Values for kNN and WkNN give little information aboutthe simulation feasibility because in kNN the error is zeroonly when the k points are collinear and in WkNN we donot have error equal to zero for k > 1.
On the other hand, despite the fact that values presentedon Tables VI and VIII are different of those shown in thereference table, they have a behaviour similar to what isexpected of real RSS values.
With a higher value of randomness in the model, it ispossible to simulate RSS values to test Location EstimationAlgorithms.
V. CONCLUSION
Comparing the results obtained in the testing scenario,it can be concluded that it is possible to replace the off-line phase of Fingerprinting by a simulation using Prop-agation Models, provided that some minimal informationabout the scenario are known, such as the blueprint, locationof furniture, thickness and type of walls and location ofthe Access Points. This last is very important when usingmultiple Fingerprint Maps because the model considers twosituations: the user is an obstacle between the Acess Pointand the mobile phone; the user is not in the path betweenthese devices.
Obviously that this is not an universal solution suitablefor all real life situations. For example if it is not possibleto know where the Access Points are, or, it is impossibleto do a mapping between Access Point and MAC address,this solution cannot be used. Instead the traditional approachto Fingerprint Map generation must be used. On the otherhand, if the minimal requirements are known, at any timewhen small changes occur, it is possible to easily generate anew FM.
Comparing the techniques used to generate the FingerprintMap, the use of propagation models without the randomvariable is simpler and has similar results to those obtained
Fig. 2. Prototype of Mobile Application to detect user steps usingaccelerometer data.
Fig. 3. Fundamental Frequency information (a) obtained from the ac-celerometer data (b).
with the simulated RSS values. In fact this was alreadyexpected because of the average properties.
As a tool to generate simulated RSS values to testLocation Estimation Algorithms, propagation models arefeasible. Analysing the presented tests, for the higher valuesof the user attenuation and the standard deviation of therandom variable, we can conclude that even though somemore tunning is needed in the model values, the results arepromising.
Combining the information related to the above two para-graphs we can conclude that the generated RSS values mimicthe behavior of real data because when used with an FM it is
Proceedings of the World Congress on Engineering 2016 Vol I WCE 2016, June 29 - July 1, 2016, London, U.K.
ISBN: 978-988-19253-0-5 ISSN: 2078-0958 (Print); ISSN: 2078-0966 (Online)
WCE 2016

possible to test the LEA, and these values can also be usedto build a valid FM.
Regarding to the value of the random variable standarddeviation, it is not the same for all spatial points, nor forall values of RSS or even between the scenarios that theauthors have been using to test the Algorithms. As futurework it would be interesting to model the uncertainty of thisrandom variable, to achieve an even more robust model thatcan mimic in perfection what we are expecting in the realscenario.
The results presented in this paper using real data arevalid for the smartphone used in the tests, however in a”real life” scenario it is possible to adapt the LocationEstimation Algorithm to the smartphone and the FingerprintMap, using LEA calibration based on Direct Search Methodsas presented in [6].
As future work, the proposed methods will be integratedwith complementary techniques that will allow to minimizethe localisation errors in tracking applications. One of suchtechniques is the use of other sensors included in the smart-phones (besides the compass and the wireless transceiver),such as the accelerometer, to predict to where the user isheading.
For example, the compass and the wireless transceiver in-formation can be used together to obtain a location estimationpoint (or subset of points), and the information provided bythe compass and the accelerometer can be used to estimatedto where the user as moved relatively to a previous wellknown position. Making the fusion of these two pieces ofinformation the location method can become more robust.
A prototype of an application, that could be integratedwith the localisation techniques here presented, is depictedin Fig. 2. This application estimates the user activity (e.g.walking) and number of steps, by extracting the fundamentalfrequency information of the accelerometer data, using theFast Fourier Transform. Plots of Fig. 3 represent the outputof the frequency domain analysis (a) and data collected fromthe accelerometer (b).
REFERENCES
[1] G. Deak, K. Curran, and J. Condell, “A survey of active andpassive indoor localisation systems,” Computer Communications,vol. 35, no. 16, pp. 1939 – 1954, 2012. [Online]. Available:http://www.sciencedirect.com/science/article/pii/S014036641200196X
[2] A. Taheri, A. Singh, and E. Agu, “Location fingerprinting on infras-tructure 802.11 wireless local area networks,” in LCN ’04: Proceedingsof the 29th Annual IEEE International Conference on Local ComputerNetworks. Washington, DC, USA: IEEE Computer Society, 2004, pp.676–683.
[3] P. Bahl and V. N. Padmanabhan, “Radar: an in-building rf-based userlocation and tracking system,” pp. 775–784, 2000.
[4] C. Serodio, L. Coutinho, H. Pinto, and P. Mestre, “A comparison ofmultiple algorithms for fingerprinting using IEEE802.11,” in LectureNotes in Engineering and Computer Science: Proceedings of TheWorld Congress on Engineering 2011, WCE 2011, 6-8 July, 2011,London, U.K., 2011, pp. 1710–1715.
[5] P. Mestre, J. Cordeiro, and C. Serodio, “Multi fingerprint map forindoor localisation,” in Lecture Notes in Engineering and ComputerScience: Proceedings of The World Congress on Engineering 2015,WCE 2015, 1-3 July, 2015, London, U.K., 2015, pp. 599–604.
[6] P. Mestre, L. Reigoto, A. Correia, J. Matias, and C. Serodio, “RSS andLEA adaptation for indoor location using fingerprinting,” in LectureNotes in Engineering and Computer Science: Proceedings of TheWorld Congress on Engineering 2012, WCE 2012, 4-6 July, 2012,London, U.K., 2012, pp. 1334–133.
[7] P. Mestre, C. Serodio, L. Coutinho, L. Reigoto, and J. Matias, “Hybridtechnique for fingerprinting using ieee802.11 wireless networks,” inIndoor Positioning and Indoor Navigation (IPIN), 2011 InternationalConference on, Sept 2011, pp. 1–7.
[8] C. Serodio, L. Coutinho, L. Reigoto, J. M. A., Correia, and P. Mestre,“A Lightweight Indoor Localization Model based on Motley-Keenanand COST.” in Lecture Notes in Engineering and Computer Science:Proceedings of The World Congress on Engineering 2012, WCE 2012,4-6 July, 2012, London, U.K., 2012, pp. 1323–1328.
[9] F. Evennou and F. Marx, “Improving positioning capabilities for indoorenvironments with WiFi,” in IST Summit, 2005.
[10] M. Youssef, M. Mah, and A. Agrawala, “Challenges: Device-freepassive localization for wireless environments,” in Proceedingsof the 13th Annual ACM International Conference on MobileComputing and Networking, ser. MobiCom ’07. New York,NY, USA: ACM, 2007, pp. 222–229. [Online]. Available:http://doi.acm.org/10.1145/1287853.1287880
[11] J. Andersen, T. Rappaport, and S. Yoshida, “Propagation Measure-ments and Models for Wireless Communications Channels,” IEEECommunications Magazine, vol. 33, no. 1, pp. 42–49, January 1995.
Proceedings of the World Congress on Engineering 2016 Vol I WCE 2016, June 29 - July 1, 2016, London, U.K.
ISBN: 978-988-19253-0-5 ISSN: 2078-0958 (Print); ISSN: 2078-0966 (Online)
WCE 2016