Embed Size (px)
Citation preview
outcome
health
indicators
USING MORTALITY RATES AS A HEALTH OUTCOME INDICATOR: STATISTICAL EXEMPLARS
Roberts SE, Daly E, Mason A, Goldacre MJ, Griffith M, Gill LE
Report to the Department of HealthSeptember 2000

USING MORTALITY RATES AS A HEALTH OUTCOME INDICATOR
Statistical exemplars
1. Introduction
2. Myocardial infarction
3. Coronary heart disease
4. Stroke
5. Fractured femur
6. Diabetes
7. Asthma
8. Conclusions
1

1. INTRODUCTION Background For many years mortality rates have been used as an outcome indicator to make comparisons over time and between populations. They were considered to be a potential indicator in five of the ten health outcome indicator reports published by NCHOD in 1999. In view of the continuing importance of mortality rates, the Department of Health commissioned NCHOD(Oxford) to prepare a digest of statistical exemplars based on the recommendations about mortality indicators included in the condition specific reports. This report contains statistical exemplars of case fatality rates for:
· myocardial infarction · coronary heart disease · stroke · fractured femur · diabetes · asthma.
The illustrative values have been derived from the Oxford Record Linkage Database. The definition descriptions are taken from the relevant condition specific reports. Objective The objective of producing these exemplars has been, for each condition, to show:
· age/sex group differences · comparisons between age-sex standardised and crude rates · time trends · effect of using different data from the death certificate.
2. MYOCARDIAL INFARCTION ILLUSTRATIVE VALUES
2

Methods The indicator definition recommended in the Report is, for a given population, age group and sex; deaths from myocardial infarction per 100,000 resident population. The ICD code used was ICD-9 410. The objectives of the study were to analyse using the recommended specification:
· age and sex group differences · age and sex standardised rates · trends over time · effects of changing the indicator definition with regard to underlying cause of death or
any cause of death on the death certificate.
The illustrative indicator values are based on the Oxford Record Linkage Study data for the thirty one year period from 1 January 1968 to 31 December 1998. The study population comprised of the two districts, Oxfordshire and West Berkshire from 1968 and 1974, and the entire Oxford Region from 1975 to 1998. Information on multiple causes of death was available for the period 1979 to 1998 only. For the purposes of the analysis in this report, the mortality rates were standardised by the direct method to the European standard population. Results Age and sex-specific mortality rates for myocardial infarction, aggregated over the entire study period 1968 to 1998, are shown in Exhibit 2.1. These crude rates were very low for both sexes in all age groups under 40, but thereafter increased sharply with increasing age. The total mortality rates for all age groups and the age-specific rates in each age group were substantially higher among men than women. However, the excess relative mortality among the men was greatest among the younger age groups. Among subjects aged in their 30s, the mortality rates were about seven times higher among men than women. For people aged in their 50s the relative risk dropped to 3.5 and for those aged 80 and over to 1.5. In order to make comparison between the sexes and different populations, it is important to adjust for age differentials. Hence the direct standardisation technique, to the standard European population, has been used here to calculate the standardised mortality rates that are shown in Exhibit 2.2 along with the unadjusted mortality rates. It is clear that while the annual mortality rates for men were higher than for women, and both declined heavily over the course of the study period, the reductions were greater for men. The crude rates among men almost halved from just under 200 per 100,000 in the late 1960s to approximately 100 in 1998. The rates for women declined from about 130 per 100,000 in 1968 to roughly 80 at the end of the study period It is also apparent that the effects of standardisation have differentially affected the mortality rates for the two sexes. During the early part of the study period the standardised rates for
3

men were higher than the crude rates, but converged from the 1980s onwards. For women, with a higher prevalence of mortality due to myocardial infarction in the oldest age groups, the standardised rates were lower, increasingly so, than the crude rates. The effects of varying the indicator to include deaths due to myocardial infarction as the underlying cause of death, or as any cause of death, are illustrated in Exhibit 2.3. Information on multiple causes of death have been available only since 1979 and thus the mortality rates for myocardial infarction as any cause of death on the death certificate are only plotted for the period 1979 to 1998. Exhibit 2.3 again shows decreasing mortality rates for men and women, for both the underlying and any causes of death, with a larger decline for men. However, since over 90% of all deaths involving myocardial infarction refer to the underlying cause of death, there is little effect in varying the definition of this indicator.
4

Exhibit 2.1 Age and sex-specific mortality rates for myocardial infarction, as the underlying cause of death (per 100,000 population, 1968-1998)
Mortality rate (per 100,000 population)
Age group Men Women Total < 1 0.4 0.2 0.3 1 - 4 0.0 0.0 0.0 5 - 9 0.0 0.0 0.0 6 -10 0.0 0.0 0.0 11-14 0.0 0.0 0.0 15-19 0.2 0.0 0.1 20-24 0.8 0.2 0.5 25-29 3.3 0.9 2.1 30-34 11.7 1.6 6.7 35-39 30.4 4.2 17.5 40-44 68.7 10.5 39.9 45-49 139.6 24.3 82.4 50-54 246.2 54.4 150.4 60-64 403.5 132.9 265.5 65-69 651.4 245.9 436.3 70-74 972.9 444.1 675.9 75-79 1393.0 738.0 996.0 80-84 1872.8 1140.8 1389.3 85+ 2378.6 1651.3 1838.0 All ages
160.7
112.2
136.4
5
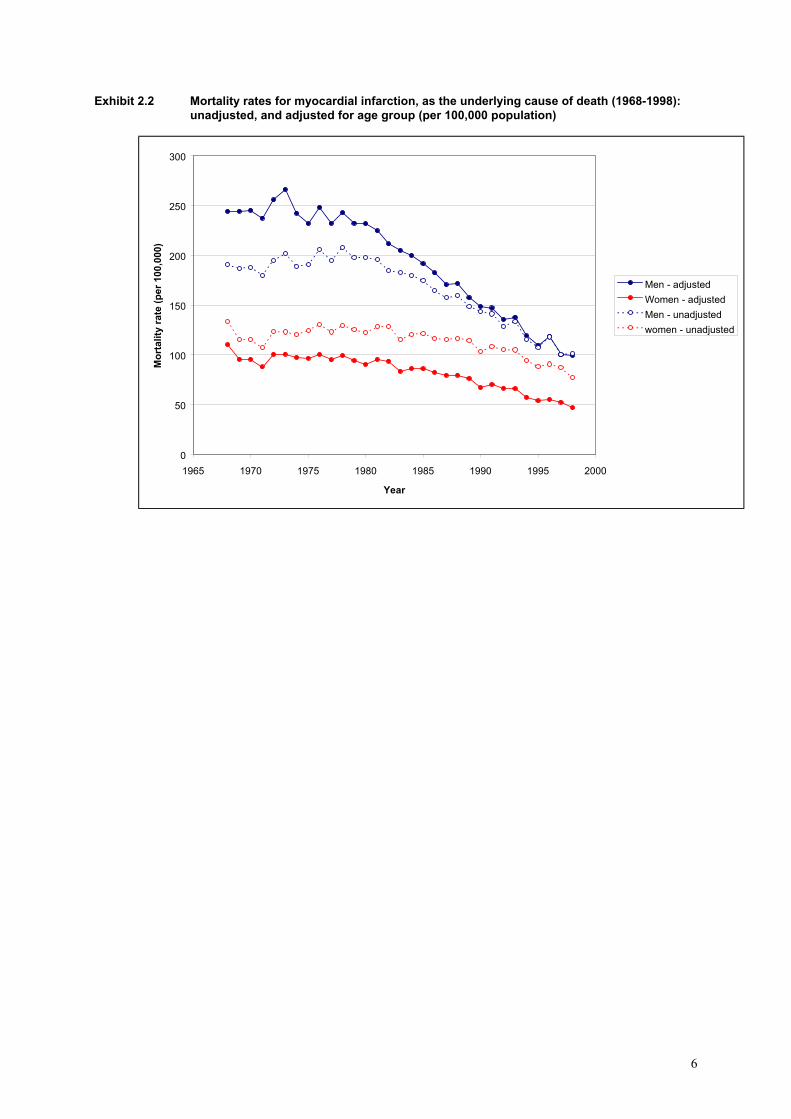
Exhibit 2.2 Mortality rates for myocardial infarction, as the underlying cause of death (1968-1998): unadjusted, and adjusted for age group (per 100,000 population)
0
50
100
150
200
250
300
1965 1970 1975 1980 1985 1990 1995 2000
Year
Mor
talit
y ra
te (p
er 1
00,0
00)
Men - adjustedWomen - adjustedMen - unadjustedwomen - unadjusted
6

Exhibit 2.3 Standardised mortality rates for myocardial infarction (1968-1998): myocardial infarct underlying cause of death and in any position on the death certificate (per 100,000 population)
0
50
100
150
200
250
300
1965 1970 1975 1980 1985 1990 1995 2000
Year
Mor
talit
y ra
te (p
er 1
00,0
00)
Men - any causeMen - underlying causeWomen - any causeWomen - underlying cause
7

3. CORONARY HEART DISEASE ILLUSTRATIVE VALUES Methods The indicator definition recommended in the Report is, for a given population, age group and sex; deaths from coronary heart disease per 100,000 resident population. The ICD codes used were ICD-9 410-414. The objectives of the study were to analyse using the recommended indicator specification:
· age and sex group differences · age and sex standardised rates · trends over time · effects of changing the indicator definition with regard to underlying cause of
death or any cause on the death certificate. The illustrative indicator values are based on the Oxford Record Linkage Study data for the thirty one year period from 1 January 1968 to 31 December 1998. The study population comprised of the two districts, Oxfordshire and West Berkshire from 1968 and 1974, and the entire Oxford Region from 1975 to 1998. Information on multiple causes of death was available for the period 1979 to 1998 only. For the purposes of the analysis in this report, the mortality rates were standardised by the direct method to the European standard population. Results Age and sex-specific mortality rates for CHD are shown in Exhibit 3.1. These demonstrate similar patterns as for myocardial infarction with increased mortality rates among the older age groups. There were higher age-specific rates among men than women and this difference became less marked with increased age. The age-specific mortality rates for CHD were for both sexes about 50% higher than for myocardial infarction. Among the oldest age groups (over 80), they were almost double that for myocardial infarction. Standardisation to the standard European population as shown in Exhibit 3.2 has a similar effect on mortality rates for CHD as for myocardial infarction. The standardised rates for men were higher than the crude initially but converged over time. For women, the standardised rates were much lower than the crude rates in the latter years of the study period. The effect of including multiple cause deaths together with those where CHD was the underlying cause of death age had little effect upon the witnessed mortality rates, as CHD as the underlying cause of death accounts for over 80% of these deaths throughout the study period. Exhibit 3.3 shows that both sets of mortality rates show a steady decline, particularly among men, over the course of the study period.
8

Exhibit 3.1 Age and sex-specific mortality rates for coronary heart disease, as the underlying cause of death (per 100,000 population, 1968-1998)
Mortality rate (per 100,000 population)
Age group Men Women Total < 1 0.9 0.7 0.8 1 - 4 0.1 0.1 0.1 5 - 9 0.0 0.0 0.0 6 -10 0.0 0.0 0.0 11-14 0.1 0.0 0.1 15-19 0.3 0.0 0.2 20-24 1.4 0.3 0.9 25-29 4.9 1.1 3.0 30-34 17.3 2.5 10.0 35-39 43.7 6.5 25.4 40-44 99.2 15.5 57.8 45-49 201.3 34.5 118.5 50-54 353.7 78.2 216.1 60-64 583.9 187.2 381.6 65-69 957.7 351.1 636.0 70-74 1466.0 652.9 1009.4 75-79 2184.9 1143.9 1553.9 80-84 3103.1 1895.2 2305.2 85+ 4413.7 3195.4 3508.1 All ages
248.0
183.3
215.5
9

Exhibit 3.2 Mortality rates for coronary heart disease, as the underlying cause of death (1968-1998): unadjusted, and adjusted for age group (per 100,000 population)
0
50
100
150
200
250
300
350
400
1965 1970 1975 1980 1985 1990 1995 2000
Year
Mor
talit
y ra
te (p
er 1
00,0
00)
Men - adjustedWomen - adjustedMen - unadjustedwomen - unadjusted
10

Exhibit 3.3 Standardised mortality rates for coronary heart disease (1968-1998): coronary heart disease as the underlying cause of death and in any position on the death certificate (per 100,000 population)
0
50
100
150
200
250
300
350
400
1965 1970 1975 1980 1985 1990 1995 2000
Year
Mor
talit
y ra
te (p
er 1
00,0
00)
Men - any causeMen - underlying causeWomen - any causeWomen - underlying cause
11

4. STROKE ILLUSTRATIVE VALUES Methods The indicator definition recommended in the Report is, for a given population, age group and sex; deaths from stroke per 100,000 resident population. The ICD codes used were ICD-9 431-438. The objectives of the study were to analyse using the recommended indicator specification:
· age and sex group differences · age and sex-standardised rates · trends over time · effects of changing the indicator definition with regard to underlying cause of death or
any cause on the death certificate. The illustrative indicator values are based on the Oxford Record Linkage Study data for the thirty one year period from 1 January 1968 to 31 December 1998. The study population comprised of the two districts, Oxfordshire and West Berkshire from 1968 and 1974, and the entire Oxford Region from 1975 to 1998. Information on multiple causes of death was available for the period 1979 to 1998 only. For the purposes of the analysis in this report, the mortality rates were standardised by the direct method to the European standard population. Results Exhibit 4.1 shows the age-specific mortality rates for stroke. They increased greatly among the oldest age groups and were higher among men than women in most age groups. However, among subjects aged 85 and over, and for all subjects, the crude mortality rates were higher in women. The standardised mortality rates as shown in Exhibit 4.2 were higher than the crude rates for men during the earlier part of the study period, but converged in the latter years. For women, the standardised rates were again increasingly much lower over time than the crude mortality rates. For men and women, and for both deaths due to stroke as the underlying cause of death and in any position on the death certificate, there were consistent reductions in mortality rates, of similar magnitude, throughout the study period. Figure 4.3 shows that for both men and women the mortality rates for stroke as any cause of death were approximately one-third higher than for rates based upon underlying cause of death only.
12

Exhibit 4.1 Age and sex-specific mortality rates for stroke, as the underlying cause of death (per 100,000 population, 1968-1998)
Mortality rate (per 100,000 population)
Age group Men Women Total < 1 3.5 3.2 3.4 1 - 4 0.2 0.2 0.2 5 - 9 0.1 0.1 0.1 6 -10 0.3 0.4 0.3 11-14 0.3 0.3 0.3 15-19 0.3 0.6 0.4 20-24 0.5 0.4 0.4 25-29 0.8 0.9 0.9 30-34 2.0 1.5 1.8 35-39 4.4 2.6 3.5 40-44 7.6 6.3 7.0 45-49 19.3 14.4 16.9 50-54 40.8 30.1 35.5 60-64 91.8 67.8 79.6 65-69 199.1 140.9 168.2 70-74 429.9 336.3 377.3 75-79 829.5 708.2 756.0 80-84 1468.2 1413.0 1431.7 85+ 2581.5 2891.2 2811.7 All ages
76.0
124.5
100.3
13

Exhibit 4.2 Mortality rates for stroke, as the underlying cause of death (1968-1998): unadjusted, and adjusted for age group (per 100,000 population)
0
20
40
60
80
100
120
140
160
180
1965 1970 1975 1980 1985 1990 1995 2000
Year
Mor
talit
y ra
te (p
er 1
00,0
00)
Men - adjustedWomen - adjustedMen - unadjustedwomen - unadjusted
14
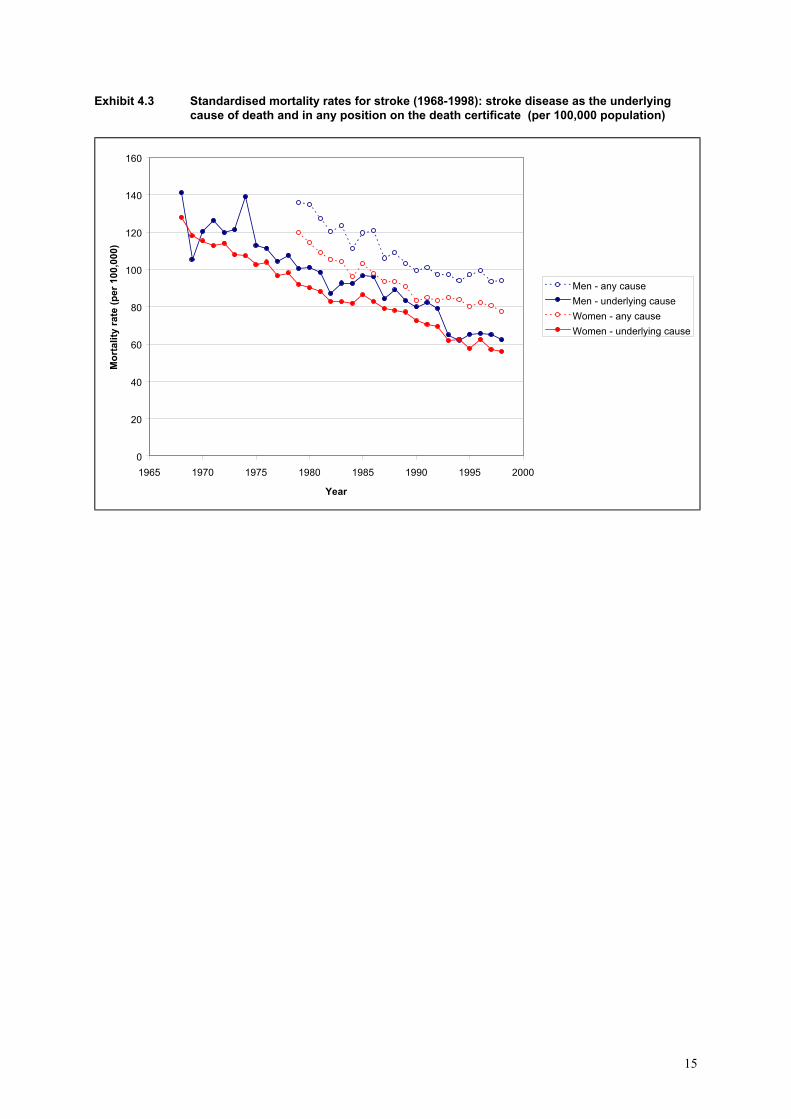
Exhibit 4.3 Standardised mortality rates for stroke (1968-1998): stroke disease as the underlying cause of death and in any position on the death certificate (per 100,000 population)
0
20
40
60
80
100
120
140
160
1965 1970 1975 1980 1985 1990 1995 2000
Year
Mor
talit
y ra
te (p
er 1
00,0
00)
Men - any causeMen - underlying causeWomen - any causeWomen - underlying cause
15
5. FRACTURED FEMUR ILLUSTRATIVE VALUES Methods The indicator definition recommended in the Report is, for a given population, age group and sex; deaths from fractured femur per 100,000 resident population. The ICD codes used were ICD-9 820-821. The objectives of the study were to analyse using the recommended indicator specification:
· age and sex group differences · age and sex standardised rates · trends over time · effects of changing the indicator definition with regard to underlying cause of
death or any cause on the death certificate. The illustrative indicator values are based on the Oxford Record Linkage Study data for the thirty one year period from 1 January 1968 to 31 December 1998. The study population comprised of the two districts, Oxfordshire and West Berkshire from 1968 and 1974, and the entire Oxford Region from 1975 to 1998. Information on multiple causes of death was available for the period 1979 to 1998 only. For the purposes of the analysis in this report, the mortality rates were standardised by the direct method to the European standard population. Results Exhibit 5.1 shows that for both men and women the mortality rates for fractured femur were relatively low (less than 10 per 100,000) for all groups aged under 75. The age-specific rates were then greatly increased among subjects, particularly women, aged 80 and over. Trends in mortality rates are illustrated in Exhibit 5.2. Due to the relatively low death counts, apparent for most of the population age groups, there was a substantial amount of fluctuation in the annual mortality rates. Hence in order to discern more clearly any trend patterns, a smoothing procedure involving the calculation of three year moving averages has been applied as shown in Exhibit 5.3. These show large reductions in both the standardised and crude mortality rates, particularly among women, during the early 1970s and a levelling off in rates thereafter. The standardised rates for men were higher than the crude rates early on but converged in later years. Over the time period the standardised rates among women became increasingly lower than the crude rates. Exhibits 5.4 and 5.5 show that for mortality due to fractured femur as any cause of death on the death certificate there is evidence for both sexes of a large increase in rates in the latter years. Although, there is some evidence of a smaller, contemporary increase in mortality rates when fractured femur is considered as the underlying cause of death only, the large increase is likely to be due to changes in the coding practices for death certificates. Exhibit 5.1 Age and sex-specific mortality rates for fractured femur, as the underlying cause of
death (per 100,000 population, 1968-1998)
16

Mortality rate (per 100,000 population)
Age group Men Women Total < 1 0.0 0.0 0.0 1 - 4 0.0 0.0 0.0 5 - 9 0.0 0.0 0.0 6 -10 0.0 0.0 0.0 11-14 0.0 0.0 0.0 15-19 0.1 0.0 0.1 20-24 0.0 0.0 0.0 25-29 0.0 0.0 0.0 30-34 0.0 0.0 0.0 35-39 0.0 0.0 0.0 40-44 0.0 0.1 0.0 45-49 0.2 0.1 0.1 50-54 0.6 0.1 0.4 60-64 0.9 0.9 0.9 65-69 1.4 1.4 1.4 70-74 4.9 7.9 6.6 75-79 12.4 21.2 17.7 80-84 37.7 61.3 53.3 85+ 118.7 177.3 162.3 All ages
1.6
5.3
3.5
17

Exhibit 5.2 Mortality rates for fractured femur, as the underlying cause of death (1968-1998): unadjusted, and adjusted for age group (per 100,000 population)
0
2
4
6
8
10
12
14
1965 1970 1975 1980 1985 1990 1995 2000
Year
Mor
talit
y ra
te (p
er 1
00,0
00)
Men - adjustedWomen - adjustedMen - unadjustedwomen - unadjusted
18

Exhibit 5.3 Smoothed mortality rates for fractured femur, as the underlying cause of death (1968- 1998): unadjusted, and adjusted for age group (per 100,000 population)
0
2
4
6
8
10
12
1965 1970 1975 1980 1985 1990 1995 2000
Year
Mor
talit
y ra
te (p
er 1
00,0
00)
Men - adjustedWomen - adjustedMen - unadjustedwomen - unadjusted
19

Exhibit 5.4 Standardised mortality rates for fractured femur (1968-1998): fractured femur as the underlying cause of death and in any position on the death certificate (per 100,000 population)
0
1
2
3
4
5
6
7
8
9
10
1965 1970 1975 1980 1985 1990 1995 2000
Year
Mor
talit
y ra
te (p
er 1
00,0
00)
Men - any causeMen - underlying causeWomen - any causeWomen - underlying cause
20

Exhibit 5.5 Smoothed standardised mortality rates for fractured femur (1968-1998): fractured femur as the underlying cause of death and in any position on the death certificate (per 100,000 population)
0
1
2
3
4
5
6
7
8
9
1965 1970 1975 1980 1985 1990 1995 2000
Year
Mor
talit
y ra
te (p
er 1
00,0
00)
Men - any causeMen - underlying causeWomen - any causeWomen - underlying cause
21
6. DIABETES ILLUSTRATIVE VALUES Methods The indicator definition recommended in the Report is, for a given population, age group and sex; deaths from diabetes per 100,000 resident population. The ICD code used was ICD-9 250. The objectives of the study were to analyse using the recommended indicator specification:
· age and sex group differences · age and sex standardised rates · trends over time · effects of changing the indicator definition with regard to underlying cause of
death or any cause on the death certificate. The illustrative indicator values are based on the Oxford Record Linkage Study data for the thirty one year period from 1 January 1968 to 31 December 1998. The study population comprised of the two districts, Oxfordshire and West Berkshire from 1968 and 1974, and the entire Oxford Region from 1975 to 1998. Information on multiple causes of death was available for the period 1979 to 1998 only. For the purposes of the analysis in this report, the mortality rates were standardised by the direct method to the European standard population. Results Exhibit 6.1 shows that age-specific mortality rates for diabetes increased greatly with age and tended to be higher for men than women. However, the overall mortality rate was slightly higher for women. Since the mortality rates for diabetes as the underlying cause of death were relatively low, three year moving averages have again been applied when investigating trends as shown in Exhibits 6.2 and 6.3. The standardised and crude mortality rates for diabetes increased during the early 1980s and declined during the 1990s. The mortality rates for diabetes as any cause of death on the death certificate were much higher than for the figures relating to underlying cause of death only. Exhibits 6.4 and 6.5 show that for men and women they were respectively roughly four and three times as high. While the mortality rates for diabetes as underlying cause of death tended to decline during the 1990s, there was an increase in rates, particularly among men, for diabetes as any cause of death. This is likely to be due to some extent to changes in the coding practices for death certification.
22
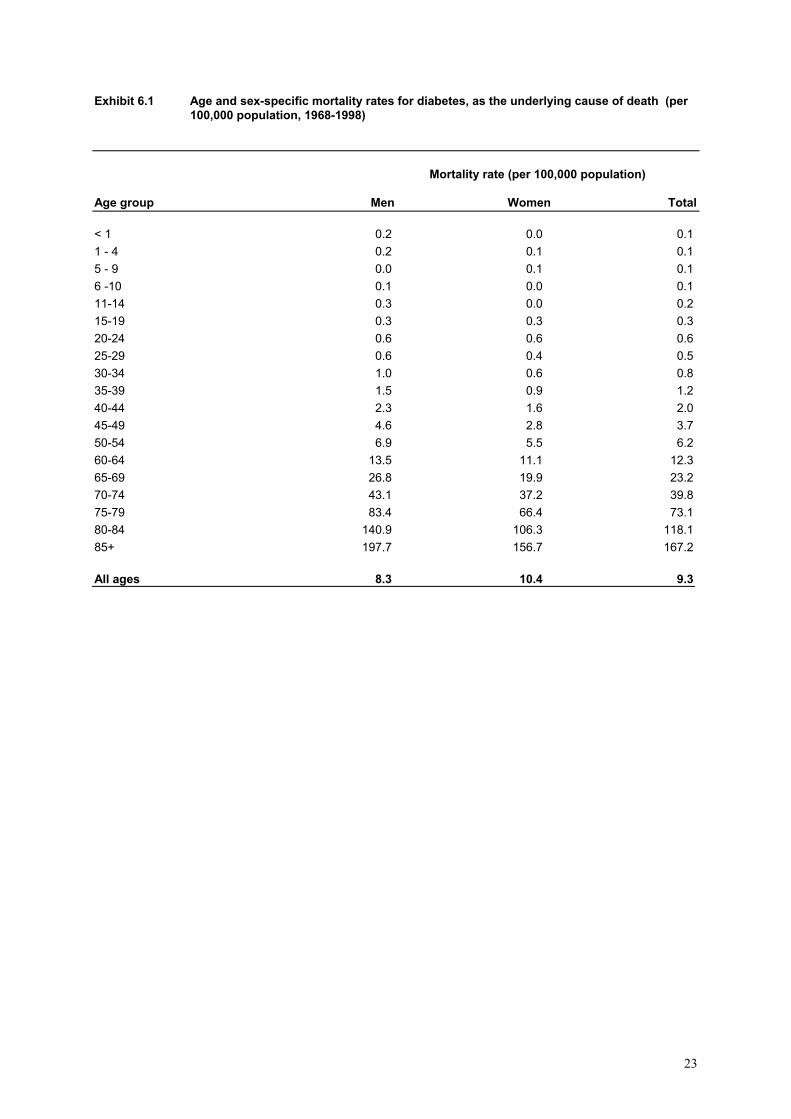
Exhibit 6.1 Age and sex-specific mortality rates for diabetes, as the underlying cause of death (per 100,000 population, 1968-1998)
Mortality rate (per 100,000 population)
Age group Men Women Total < 1 0.2 0.0 0.1 1 - 4 0.2 0.1 0.1 5 - 9 0.0 0.1 0.1 6 -10 0.1 0.0 0.1 11-14 0.3 0.0 0.2 15-19 0.3 0.3 0.3 20-24 0.6 0.6 0.6 25-29 0.6 0.4 0.5 30-34 1.0 0.6 0.8 35-39 1.5 0.9 1.2 40-44 2.3 1.6 2.0 45-49 4.6 2.8 3.7 50-54 6.9 5.5 6.2 60-64 13.5 11.1 12.3 65-69 26.8 19.9 23.2 70-74 43.1 37.2 39.8 75-79 83.4 66.4 73.1 80-84 140.9 106.3 118.1 85+ 197.7 156.7 167.2 All ages
8.3
10.4
9.3
23
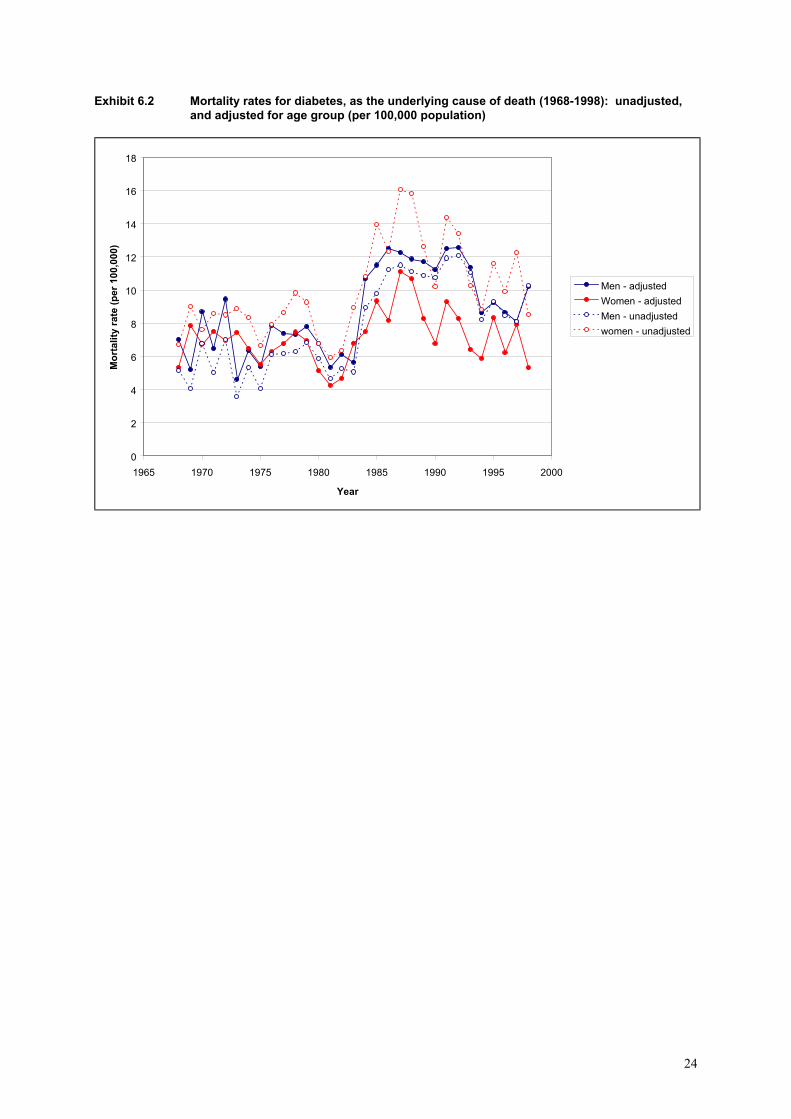
Exhibit 6.2 Mortality rates for diabetes, as the underlying cause of death (1968-1998): unadjusted, and adjusted for age group (per 100,000 population)
0
2
4
6
8
10
12
14
16
18
1965 1970 1975 1980 1985 1990 1995 2000
Year
Mor
talit
y ra
te (p
er 1
00,0
00)
Men - adjustedWomen - adjustedMen - unadjustedwomen - unadjusted
24

Exhibit 6.3 Smoothed mortality rates for diabetes, as the underlying cause of death (1968-1998): unadjusted, and adjusted for age group (per 100,000 population)
0
2
4
6
8
10
12
14
16
1965 1970 1975 1980 1985 1990 1995 2000
Year
Mor
talit
y ra
te (p
er 1
00,0
00)
Men - adjustedWomen - adjustedMen - unadjustedwomen - unadjusted
25

Exhibit 6.4 Standardised mortality rates for diabetes (1968-1998): diabetes as the underlying cause of death and in any position on the death certificate (per 100,000 population)
0
5
10
15
20
25
30
35
40
45
1965 1970 1975 1980 1985 1990 1995 2000
Year
Mor
talit
y ra
te (p
er 1
00,0
00)
Men - any causeMen - underlying causeWomen - any causeWomen - underlying cause
26

Exhibit 6.5 Smoothed standardised mortality rates for diabetes (1968-1998): diabetes as the underlying cause of death and in any position on the death certificate (per 100,000 population)
0
5
10
15
20
25
30
35
40
45
1965 1970 1975 1980 1985 1990 1995 2000
Year
Mor
talit
y ra
te (p
er 1
00,0
00)
Men - any causeMen - underlying causeWomen - any causeWomen - underlying cause
27

7. ASTHMA ILLUSTRATIVE VALUES
Methods The indicator definition recommended in the Report is, for a given population, age group and sex; deaths from asthma per 100,000 resident population. The ICD code used was ICD-9 493. The objectives of the study were to analyse using the recommended indicator specification:
· age and sex group differences · age and sex standardised rates · trends over time · effects of changing the indicator definition with regard to underlying cause of
death or any cause on the death certificate. The illustrative indicator values are based on the Oxford Record Linkage Study data for the thirty one year period from 1 January 1968 to 31 December 1998. The study population comprised of the two districts, Oxfordshire and West Berkshire from 1968 and 1974, and the entire Oxford Region from 1975 to 1998. Information on multiple causes of death was available for the period 1979 to 1998 only. For the purposes of the analysis in this report, the mortality rates were standardised by the direct method to the European standard population. Results Exhibit 7.1 shows that the age-specific mortality rates for asthma as underling cause of death tended to be comparable between men and women in most age groups under 70. For the oldest age groups the mortality rates for women were higher, while the overall mortality rate was also higher in women. The mortality rates for asthma were relatively low and the three year moving average smoothing procedure has again been employed for the trends over time illustrated in Exhibits 7.2 and 7.3. For both the standardised and the crude rates, and for men and women alike, there is evidence of an increase in mortality rates during the late 1970s and 1980s and a decline during the 1990s. Exhibits 7.3 and 7.4 show that when mortality due to asthma as any cause of death on the death certificate is considered there appears to be evidence for men of a decline in rates from the mid 1980s onwards. For women any trend in mortality levels is less discernible.
28

Exhibit 7.1 Age and sex-specific mortality rates for asthma, as the underlying cause of death (per 100,000 population, 1968-1998)
Mortality rate (per 100,000 population)
Age group Men Women Total < 1 0.0 0.0 0.0 1 - 4 0.2 0.3 0.2 5 - 9 0.3 0.1 0.2 6 -10 0.4 0.3 0.4 11-14 1.2 0.5 0.9 15-19 0.8 0.7 0.8 20-24 1.1 0.6 0.8 25-29 0.9 0.9 0.9 30-34 1.2 0.9 1.1 35-39 1.1 1.2 1.1 40-44 2.0 2.5 2.2 45-49 2.6 2.2 2.4 50-54 4.4 4.5 4.4 60-64 5.4 5.8 5.6 65-69 7.0 8.5 7.8 70-74 9.6 13.4 11.8 75-79 12.3 14.0 13.3 80-84 16.3 16.6 16.5 85+ 20.9 25.5 24.3 All ages
2.4
3.2
2.8
29

Exhibit 7.2 Mortality rates for asthma, as the underlying cause of death (1968-1998): unadjusted, and adjusted for age group (per 100,000 population)
0
1
2
3
4
5
6
1965 1970 1975 1980 1985 1990 1995 2000
Year
Mor
talit
y ra
te (p
er 1
00,0
00)
Men - adjustedWomen - adjustedMen - unadjustedwomen - unadjusted
30

Exhibit 7.3 Smoothed mortality rates for asthma (1968-1998): unadjusted, and adjusted for sex and age group (per 100,000 population)
0
1
2
3
4
5
1965 1970 1975 1980 1985 1990 1995 2000
Year
Mor
talit
y ra
te (p
er 1
00,0
00)
Men - adjustedWomen - adjustedMen - unadjustedwomen - unadjusted
31

Exhibit 7.4 Standardised mortality rates for asthma (1968-1998): asthma as the underlying cause of death and in any position on the death certificate (per 100,000 population)
0
1
2
3
4
5
6
7
1965 1970 1975 1980 1985 1990 1995 2000
Year
Mor
talit
y ra
te (p
er 1
00,0
00)
Men - any causeMen - underlying causeWomen - any causeWomen - underlying cause
32

Exhibit 7.5 Smoothed standardised mortality rates for asthma (1968-1998): asthma as the underlying cause of death and in any position on the death certificate (per 100,000 population)
0
1
2
3
4
5
6
1965 1970 1975 1980 1985 1990 1995 2000
Year
Mor
talit
y ra
te (p
er 1
00,0
00)
Men - any causeMen - underlying causeWomen - any causeWomen - underlying cause
33

8. CONCLUSIONS
Myocardial infarction For myocardial infarction mortality rates were very low for both sexes in all age groups under 40, but thereafter they increased sharply with age. The total mortality rates and the age-specific rates in each age group were substantially higher among men than women. However, the excess relative mortality among men was greatest among the younger age groups. Among subjects aged in their 30s the mortality rates were about seven times higher among men than women. For people aged in their 50s the relative risk had dropped to 3.5 and among those aged 80 and over it was much lower again at 1.5. In order to make comparison between the two sexes, and indeed between different populations, it is important to adjust for age differentials. The direct standardisation technique, to the standard European population, was used in this study to calculate standardised mortality rates. For myocardial infarction while the annual mortality rates for men were higher than for women and both declined heavily over the course of the study period, the reductions were greater for men. The crude rates among men almost halved from just under 200 per 100,000 in the late 1960s to approximately 100 in 1998. The rates for women declined from about 130 per 100,000 in 1968 to roughly 80 at the end of the study. The effects of standardisation have also differentially affected the mortality rates for the two sexes. During the early part of the study period the standardised rates for men were higher than the crude rates but converged from the 1980s onwards. For women, with a higher occurrence of mortality due to myocardial infarction in the oldest age groups, the standardised rates were lower, increasingly so over time, than the crude rates. The effects of varying the indicator to include only deaths due to myocardial infarction when the condition was the underlying cause of death or all deaths when it was recorded anywhere on the certificate have been examined. However, information on multiple causes of death has been available only since 1979. Hence, the mortality rates for myocardial infarction as recorded anywhere on the death certificate have been plotted for the period 1979 to 1998 only. They again showed decreasing mortality rates for men and women, for both the underlying cause and anywhere on the certificate, with a larger decline for men. However, since over 90% of all deaths involving myocardial infarction relate to the underlying cause of death there is little effect in varying the definition of this indicator. Coronary heart disease Age and sex-specific mortality rates for coronary heart disease demonstrated similar patterns as for myocardial infarction. There were increased mortality rates among the older age groups and higher age-specific rates among men that were less marked with increased age. The age-specific rates for CHD were about 50% higher than for myocardial infarction. Among the oldest age groups they were almost double that for myocardial infarction.
34
Standardisation to the European population had a similar effect on mortality rates for CHD as for myocardial infarction. The standardised rates for men were higher than the crude rates but converged over time. For women, the standardised rates increasingly became much lower than the crude rates in the latter years. The effect of including deaths where CHD was anywhere on the certificate together with those where CHD was the underlying cause of death again had little effect upon mortality rates since CHD as the underlying cause of death accounted for over 80% of the deaths. As with myocardial infarction both sets of mortality rates showed a steady decline, particularly among men, over the course of the study period. Stroke The age-specific mortality rates for stroke, which increased greatly among the oldest age groups, were higher among men than women in most age groups. However, among subjects aged 85 and over and for all subjects the crude mortality rates were higher in women. The standardised mortality rates, as for myocardial infarction and CHD, were higher than the crude rates for men during the earlier part of the study period but converged in the latter years. For women, the standardised rates were again increasingly much lower over time than the crude mortality rates. For men and women, and for both deaths due to stroke as the underlying cause of death and in any position on the death certificate, there were consistent reductions in mortality rates of similar magnitude throughout the study period. For both men and women the rates for stroke as any cause of death were approximately one-third higher than for rates based upon underlying cause of death only. Fractured femur For both men and women, the mortality rates for fractured femur were relatively low at less than 10 per 100,000 for all groups aged under 75. The age-specific mortality rates were then greatly increased among subjects, particularly women, aged 80 and over. Due to the relatively low death counts, apparent for most of the population age groups, there was a substantial amount of fluctuation in the annual mortality rates for fractured femur. In order to discern more clearly any trend patterns, a smoothing procedure involving the calculation of three year moving averages has been applied. The results showed large reductions in both the standardised and crude mortality rates, particularly among women, during the early 1970s and a levelling-off in the rates thereafter. As with all the other indicators considered previously, the standardised rates for men were higher than the crude rates early on but converged in the latter years. The standardised rates among women became increasingly lower than the crude rates. For fractured femur recorded anywhere on the death certificate there was evidence for both sexes of a large increase in mortality rates in the latter years. Although, there was some evidence of a smaller, contemporary increase in mortality rates when fractured femur was considered as the underlying cause of death only, the large increase is likely to be due mainly to changes in the coding practices for death certificates.
35
Diabetes Age-specific mortality rates for diabetes increased greatly with age and tended to be higher for men than women. However, the overall mortality rate was slightly higher for women. Since the mortality rates for diabetes as the underlying cause of death were relatively low three year moving averages were again applied to investigate time trends. Both the standardised and crude mortality rates for diabetes showed an increase during the early 1980s and a subsequent decline during the 1990s. The mortality rates for diabetes recorded anywhere on the death certificate were, unlike the previous conditions considered, much higher than the figures relating to diabetes as the underlying cause of death only. For men and women they were respectively about four and three times as high. While the mortality rates for diabetes as underlying cause of death tended to decline during the 1990s there was an increase in rates, particularly among men, for diabetes recorded anywhere on the certificate. This is again likely to be due, to some extent, to changes in the coding practices for death certification. Asthma The age-specific mortality rates for asthma as underling cause of death tended to be comparable between men and women in most age groups under 70. For the oldest age groups the mortality rates for women were higher, while the overall mortality rate was also higher in women. The mortality rates for asthma were relatively low and the three year moving average smoothing procedure was employed again. For both the standardised and the crude rates, and for both sexes, there was evidence of an increase in mortality rates during the late 1970s and 1980s followed by a decline during the 1990s. When mortality due to asthma recorded anywhere on the death certificate is considered there was evidence for men of a decline in rates from the mid 1980s onwards. For women any trend in mortality levels was less discernible. The rates calculated using asthma as underlying cause were considerably lower than those when asthma was recorded anywhere on the certificate.
36