Embed Size (px)
Citation preview

Full Terms & Conditions of access and use can be found athttp://www.tandfonline.com/action/journalInformation?journalCode=tjde20
Download by: [49.206.202.89] Date: 07 January 2017, At: 02:57
International Journal of Digital Earth
ISSN: 1753-8947 (Print) 1753-8955 (Online) Journal homepage: http://www.tandfonline.com/loi/tjde20
Mapping rice-fallow cropland areas for short-season grain legumes intensification in South Asiausing MODIS 250 m time-series data
Murali Krishna Gumma, Prasad S. Thenkabail, Pardharsadhi Teluguntla,Mahesh N. Rao, Irshad A. Mohammed & Anthony M. Whitbread
To cite this article: Murali Krishna Gumma, Prasad S. Thenkabail, Pardharsadhi Teluguntla,Mahesh N. Rao, Irshad A. Mohammed & Anthony M. Whitbread (2016) Mapping rice-fallow cropland areas for short-season grain legumes intensification in South Asia usingMODIS 250 m time-series data, International Journal of Digital Earth, 9:10, 981-1003, DOI:10.1080/17538947.2016.1168489
To link to this article: http://dx.doi.org/10.1080/17538947.2016.1168489
© 2016 The Author(s). Published by InformaUK Limited, trading as Taylor & FrancisGroup.
Published online: 04 May 2016.
Submit your article to this journal Article views: 533
View related articles View Crossmark data
Citing articles: 3 View citing articles
Mapping rice-fallow cropland areas for short-season grain legumesintensification in South Asia using MODIS 250 m time-series dataMurali Krishna Gummaa , Prasad S. Thenkabailb, Pardharsadhi Teluguntlab, MaheshN. Raoc, Irshad A. Mohammeda and Anthony M. Whitbreada
aInternational Crops Research Institute for the Semi-Arid Tropics, Patancheru, India; bU.S. Geological Survey (USGS),Western Geographic Science Center, Flagstaff, AZ, USA; cHumboldt State University, Arcata, CA, USA
ABSTRACTThe goal of this study was to map rainfed and irrigated rice-fallow croplandareas across South Asia, using MODIS 250 m time-series data and identifywhere the farming system may be intensified by the inclusion of a short-season crop during the fallow period. Rice-fallow cropland areas are thoseareas where rice is grown during the kharif growing season (June–October),followed by a fallow during the rabi season (November–February). Thesecropland areas are not suitable for growing rabi-season rice due to theirhigh water needs, but are suitable for a short -season (≤3 months), lowwater-consuming grain legumes such as chickpea (Cicer arietinum L.), blackgram, green gram, and lentils. Intensification (double-cropping) in thismanner can improve smallholder farmer’s incomes and soil health via richnitrogen-fixation legume crops as well as address food security challengesof ballooning populations without having to expand croplands. Severalgrain legumes, primarily chickpea, are increasingly grown across Asia as asource of income for smallholder farmers and at the same time providingrich and cheap source of protein that can improve the nutritional quality ofdiets in the region. The suitability of rainfed and irrigated rice-fallowcroplands for grain legume cultivation across South Asia were defined bythese identifiers: (a) rice crop is grown during the primary (kharif) cropgrowing season or during the north-west monsoon season (June–October);(b) same croplands are left fallow during the second (rabi) season or duringthe south-east monsoon season (November–February); and (c) ability tosupport low water-consuming, short-growing season (≤3 months) grainlegumes (chickpea, black gram, green gram, and lentils) during rabi season.Existing irrigated or rainfed crops such as rice or wheat that were grownduring kharif were not considered suitable for growing during the rabiseason, because the moisture/water demand of these crops is too high. Thestudy established cropland classes based on the every 16-day 250 mnormalized difference vegetation index (NDVI) time series for one year (June2010–May 2011) of Moderate Resolution Imaging Spectroradiometer(MODIS) data, using spectral matching techniques (SMTs), and extensivefield knowledge. Map accuracy was evaluated based on independentground survey data as well as compared with available sub-national levelstatistics. The producers’ and users’ accuracies of the cropland fallow classeswere between 75% and 82%. The overall accuracy and the kappa coefficientestimated for rice classes were 82% and 0.79, respectively. The analysisestimated approximately 22.3 Mha of suitable rice-fallow areas in South Asia,with 88.3% in India, 0.5% in Pakistan, 1.1% in Sri Lanka, 8.7% in Bangladesh,1.4% in Nepal, and 0.02% in Bhutan. Decision-makers can target these areasfor sustainable intensification of short-duration grain legumes.
ARTICLE HISTORYReceived 17 December 2015Accepted 16 March 2016
KEYWORDSCroplands; cropland fallow;seasonal rice mapping; rice-fallow; intensification; kharif;rabi; remote sensing; double-cropping; MODIS 250 m;NDVI; spectral matchingtechniques; ground surveydata; grain legumes;potential cropland areas;South Asia
© 2016 The Author(s). Published by Informa UK Limited, trading as Taylor & Francis Group.This is an Open Access article distributed under the terms of the Creative Commons Attribution-NonCommercial-NoDerivatives License (http://creativecommons.org/licenses/by-nc-nd/4.0/), which permits non-commercial re-use, distribution, and reproduction in any medium, provided theoriginal work is properly cited, and is not altered, transformed, or built upon in any way.
CONTACT Murali Krishna Gumma [email protected], [email protected]
INTERNATIONAL JOURNAL OF DIGITAL EARTH, 2016VOL. 9, NO. 10, 981–1003http://dx.doi.org/10.1080/17538947.2016.1168489

1. Introduction
A sustainable, profitable, and resilient smallholder agricultural sector is the key to food and nutri-tional security for the growing populations of Asia and Africa (FAO 2015). South Asia accounts for40% of the world’s harvested rice area (USDA 2010) and feeds almost 25% of the world’s popu-lation domestically and abroad (FAO 2015). Globally, there is tremendous pressure to produceat least 50% more food to feed the projected world population of 9.15 billion by 2050 (Alexandra-tos and Bruinsma 2012). There is high demand across South Asia, to increase and diversify foodproduction to meet the increasing nutritional demands of an economically rich and growing popu-lation, and to meet export demands that can provide additional income to smallholder farmers.However, increasing production by expanding the area or through technological means such asirrigation, fertilizer, and mechanization is limited due to increasing pressure on croplands foralternative uses as well as environmental concerns, production cost, and severe stresses onwater availability in a changing climate scenario (Garnett et al. 2013; Gray et al. 2014). In addition,urbanization, industrialization, and salinization are putting more pressure on existing crop area(Foley et al. 2011). Hence, agronomists consider cropland intensification as an imperative andvariable solution.
In India, areas where the kharif season (June–October) rainfed rice and/or irrigated rice cropsare grown often remain fallow during the rabi season (November–February). This is mainlybecause these lands do not have sufficient water to grow important staple crops (e.g. rice,wheat) during rabi season. There is however the opportunity to grow water-efficient short-seasongrain legumes, which have a high market demand and improve soil health via nitrogen fixation(Dabin et al. 2016; Dixon et al. 2007; Ghosh et al. 2007); this is often termed as rice-fallowintensification.
Spatial information – which can be used to target areas where rice-fallow intensification maybe possible – is important for designing effective policies, seed systems, and the provision ofextension information (Bantilan et al., forthcoming; Gumma et al. 2014; Kontgis, Schneider,and Ozdogan 2015; Subbarao et al. 2001). Remote sensing is an ideal tool to provide a powerful,quick, and independent approach to estimating fallow croplands over large areas and show theirdynamics (Badhwar 1984; Lobell et al. 2003; Thenkabail 2010; Thenkabail et al. 2009b; Thiruven-gadachari and Sakthivadivel 1997). Over the last 50 years, improved cropland mapping methodsand approaches have evolved. There are several studies on spatio-temporal analysis to map agri-culture areas by irrigation source (Anderson et al. 2015; Gumma et al. 2011c; Knight et al. 2006;See et al. 2015; Thenkabail, Schull, and Turral 2005; Velpuri et al. 2009; Xu et al. 2006; Zheng et al.2015), specific crop type mapping and temporal changes (Foerster et al. 2012; Gumma et al.2015b; Kontgis, Schneider, and Ozdogan 2015), and crop intensity (Gumma et al. 2014; Sakamotoet al. 2005).
The major aim of this paper is to define a methodology for mapping rice-fallow cropland classesfor South Asia. Rice-fallow areas those where rice crop is grown during kharif season (June–October)but are left fallow during rabi season (November–February). The uniqueness and novelty of thisstudy are twofold. Firstly, no study has explored mapping fallow croplands using innovative spectralmatching techniques (SMTs). This study used every 16-day, MODIS 250 m time-series data (http://modis.gsfc.nasa.gov/) for one year (June 2010–May 2011) to map fallow croplands in South Asiausing SMTs that were first advocated for cropland mapping by Thenkabail et al. (2007) and latersuccessfully applied in global and regional mapping of croplands (Biradar et al. 2009; Gray et al.2014; Gumma et al. 2015a; Pittman et al. 2010; Salmon et al. 2015; See et al. 2015; Thenkabailet al. 2007, 2009a, 2012). The study, for the first time, used SMTs to map cropland fallow inorder to identify suitable areas for growing short-season (∼3 month), low-water-consuming grainlegumes such as chickpea, black gram, green gram, and lentils. Second, implementation of SMTmethodology to accurately map cropland fallow over large areas, such as South Asia, is invaluablein order to address food security challenges of the twenty-first century.
982 M. K. GUMMA ET AL.

2. Materials and methods
2.1. Study area
South Asia is located between 5°38′40′′ and 36°54′30′′ latitudes and, 61°05′00′′ and 97°14′15′′ longi-tudes, covering a geographical area of about 477 Mha (Figure 1, Table 1). It has six agro-ecologicalzones (AEZs): humid tropics, sub-humid tropics, semi-arid tropics, semi-arid, subtropics, and arid(FAO-IIASA 2012). South Asia borders Western Asia, Central Asia, Eastern Asia, Southeastern Asiaand the Indian Ocean. It includes six countries: Pakistan, India, Nepal, Bhutan, Bangladesh, and Sri
Table 1. Cropland areas, rice areas, and geographic areas of the South Asian Nations. Basic country-level geographic areas,cropland areas, irrigated areas, rainfed areas, and rice areas of South Asia for 2010–2011.
CountryTotal geographicalarea (‘000 ha)
Total gross plantedarea (‘000 ha)
Net irrigated areas(NAS) (‘000 ha)
Net Rainfed areas(NAS) (‘000 ha)a,b
Harvested area of ricec
(NAS) (‘000 ha)
Bangladesh 14,804 15,002 6749 3400 10,801Bhutan 4365 121 27 94 26Indiac 345,623 184,443 63,601 104,500 44,712Nepal 16,210 4208 1926 2100 1560Pakistan 89,167 22,817 19,270 3600 2377Sri Lanka 6453 2076 462 1614 832Total 476,622 228,668 92,035 115,308 60,308aSource: World rice statistic, FAO.bSource: Rainfed farming system (http://link.springer.com/chapter/10.1007/978-1-4020-9132-2_22) (Hobbs and Osmanzai 2011).chttp://www.indiastat.com.
Figure 1. Study area of South Asia and ground data points. There were 1398 cropland data samples of which 303 were used asreference/training data for ideal spectra generation, 527 were used for class identification and labeling, and 568 were for classvalidation.
INTERNATIONAL JOURNAL OF DIGITAL EARTH 983

Lanka. In South Asia, about 80% of the poor live in rural areas and are highly dependent on agri-culture for their livelihood (World Bank 2015). There are nine major river basins in the studyarea: the Indus, Ganges, Brahmaputra, Narmada, Tapti, Godavari, Krishna, Kaveri, and Mahanadi.There are many major and minor irrigation projects connected to these basins in South Asia, cover-ing a total command area of 133 Mha (Thenkabail et al. 2008). However, the ultimate potential ofirrigated lands is 139 Mha, the increase being primarily due to the revised assessment of minorground water schemes and minor surface water schemes to 64 Mha and 17 Mha, respectively.Rice is the major crop in this region, with single or multiple cropping seasons. Most of the ricearea (63%) is under irrigated systems, while 37% is rainfed (Gumma et al. 2011a).
2.2. Methods: overview
The methodology is presented in Figure 2 and described below. First, MODIS 250 m NDVI imagerycomposite of every 16-days was used to create time series for South Asia. Second, ground survey
Figure 2. Overview flowchart of methodology. Flow diagram of methodology for mapping rice-fallow using the every 16-dayMODIS 250 m time-series data, ground data, Google Earth data, spectral matching techniques, and decision trees.
984 M. K. GUMMA ET AL.

information was collected to gather precise ground knowledge on rice cropping systems of SouthAsia. Third, ideal spectral generation of rice cropping systems based on precise ground knowledgeand by using MODIS 250 m time-series data was performed. Fourth, class spectra were generatedusing unsupervised classification of South Asia using MODIS 250 m every 16-day NDVI time series.Fifth, the class spectra from the unsupervised classification was spectrally matched with ideal spectrato determine spatial distribution of rice classes across South Asia. Sixth, classes that qualify as rice-fallow areas and short-season grain legumes intensification in South Asia were identified. Finally,accuracy assessments were performed on the products and rice-fallow area estimations were com-pared with national statistics.
2.3. Satellite data and processing
The present study used MOD13Q1.5 product, which provides every 16-day composite images takenby the MODIS sensor at 250 m spatial resolution. Since rice is the most important crop in SouthAsia, rice fields are often contiguous and stretch across 100s or 1000s of ha in one stretch(Gumma et al. 2011a; Settle et al. 1996). So, 250 m (6.25 ha) pixels that are acquired every dayand processed into 16-day maximum value composites (MVCs) are mostly cloud free, provide excel-lent wall-to-wall spatial coverage, and have ideal temporal coverage to study crop phenology, vigor,and dynamics (Biggs et al. 2006). The MOD13Q1 product normalized difference vegetation index(NDVI) further normalizes data. Twelve tiles covering the South Asian region were downloadedfrom the Land Processes Distributed Active Archive Center (LP DAAC) (https://lpdaac.usgs.gov).The MODIS re-projection tool (MRT) was used to re-project and mosaic the 12 tiles for each com-posite date (Gumma et al. 2011a; Thenkabail et al. 2009a). Altogether 23 mosaic images were com-posited for the crop year 2010–2011 (from June 2010 to May 2011).
The NDVI data were further processed to create monthly maximum value composites(NDVIMVC) for each of the seven months in the kharif season, using Equation (1).
NDVI MVCi = Max(NDVIi1, NDVIi,2), (1)
where NDVI MVCi is monthly MVC of ith month (e.g. ‘i’ is Jan–Dec). i1, i2 are every 16-day com-posite in a month.
2.4. Ground survey information
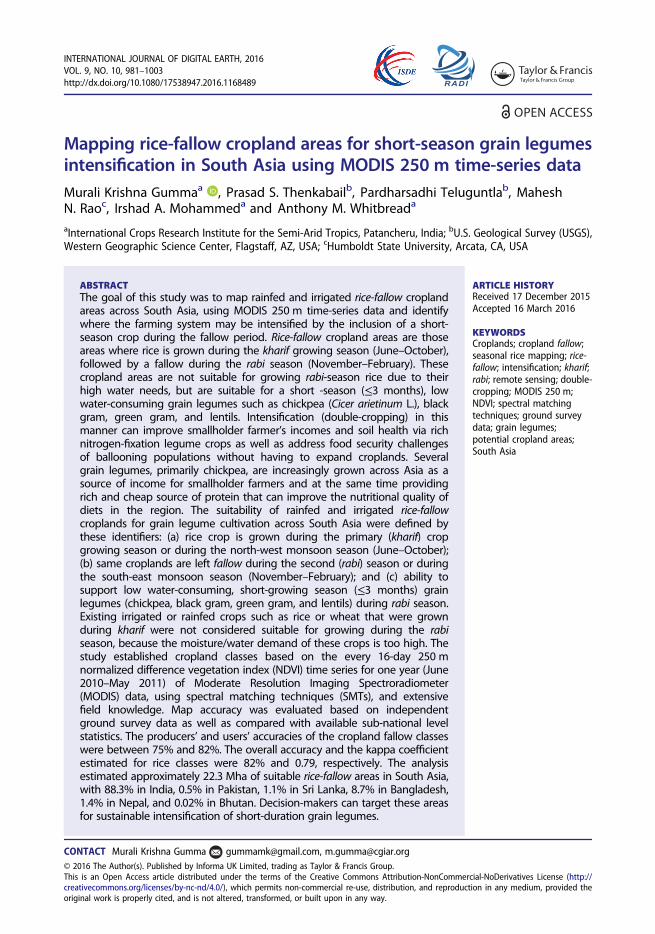
Ground survey information (Table 2) was collected at different times in three distinct field cam-paigns, which were collectively used to increase the sample size for class identification as well asto assess accuracy (Figure 1). Overall, there were 1398 ground data samples of which 303 wereused for ideal spectra generation, 527 for class identification and labeling, and 568 for validation(Table 2). These data were collected based on stratified random sampling. Ground data collectionis stratified by road network and randomized by distance traveled (either every 15 minutes ofdrive or every 10 or 15 or 20 km of drive, depending on road conditions or weather conditions orother field work limitations like safety issues or sensitive locations). Roughly, 20% of all grounddata samples were used for ideal spectra generation. Greater time was spent on ideal spectral samplelocations for the simple reason of finding a local expert to speak and understand agricultural systems.This was not possible for all 1398 locations, but was successfully done at 303 locations. The rest of thesamples were initially equally split (527 samples) for class identification and validation. However, thevalidation samples increased by another 41 points (reaching a total of 568) since these samples camein almost at the end of class identification; so we just treated them as additional validation samples.Further, of the 1398 samples, 395 were non-croplands samples and the rest 1003 were croplandsamples. Of the 303 ideal spectral cropland data samples, there were 204 that were from the idealspectral category (Figure 4) with the rest 99 being non-croplands. The ground data were extensively
INTERNATIONAL JOURNAL OF DIGITAL EARTH 985
collected during two growing periods: September 2010 (kharif season) and January and February2011 (rabi season). At each sample, information was collected on existing crop type, irrigationtype, soil type, and land use land cover (LULC) with a 250 m × 250 m patch size and geolocatedwith a hand-held GPS unit. Information pertaining to irrigated area surrounding the point was cate-gorized into three classes: small (≤10 ha), medium (10–15 ha), and large (≥15 ha). Additional infor-mation was gathered through interviews with farmers and district agriculture extension officers todetermine crop intensities, and type during the previous year. Based on this, ground data were sys-tematically collected by adopting the following approach:
Cropland water methods: irrigated or rainfedCropping intensity: single crop (SC), double crop (DC), or continuous crop (CC)Phenology: kharif or season 1 (June–October), rabi or season 2 (November–February)
Based on this naming system and convention, each class was named (Table 3). For example, class 6is: rainfed-SC-rice in kharif-fallow in rabi-fallow in summer. The 10 cropland classes that will bemapped are listed in Tables 2 and 3 and their MODIS spectral profiles illustrated in Figure 4.Table 2 defines how data were collected during field data. Table 3 defines how these classes aremapped using MODIS data. These classes are further discussed in detail in Section 2.8. Of all theclasses that will be mapped, our primary interest will be the rice-fallow class (i.e. where rice isgrown during kharif season or June–October, and left fallow during the rabi season or Novem-ber–February).
Samples covered major cropland areas, which in turn were chosen based on the knowledge of dis-trict agricultural extension officers in order to ensure adequate samples of major crops as well asother LULC information, including two photographs from each location. In many sample locations,farmers provided information on planting dates, cropping intensity (single or double crop), and per-centage canopy cover for these locations. Additional information was obtained from agriculture and
Table 2. Ground data samples used for reference/training and validation. The samples were classified into 11 categories.
Cropland class categoryReference samples forideal spectra generation
Reference samples forclass identification
Validation samplesfor class accuracies
Totalsamples
01. Irrigated-SC-rice in kharif-fallowin rabi-fallow in summer
14 16 45 75
02. Irrigated-SC-fallow in kharif-ricein rabi-fallow in summer
9 12 21 42
03. Irrigated-DC-rice in kharif-mixedcrops in rabi-fallow in summer
28 42 40 110
04. Irrigated-DC-rice in kharif-rice inrabi-fallow in summer
11 28 58 97
05. Irrigated-TC-rice in kharif-mixedcrops in rabi-rice in summer
18 22 74 114
06. Rainfed-SC-rice in kharif-fallow inrabi-fallow in summer
35 23 62 120
07. Rainfed-SC-fallow in kharif-rice inrabi-fallow in summer
12 8 12 32
08. Rainfed-SC-flooded in kharif-flooded in rabi flooded-summerrice
5 5 7 17
09. Irrigated-DC-mixed crops inkharif-mixed crops in rabi-fallow insummer
35 61 102 198
10. Rainfed-SC-mixed crops in kharif-fallow in rabi-fallow in summer
37 39 122 198
Total cropland samples 204 256 543 100311. All other Samples (non-croplands, other LCLU)
99 271 25 395
Total ground data samples 303 527 568 1398
Note: SC = single crop, DC = double crop, TC = triple crop, LCLU = land cover/land use.
986 M. K. GUMMA ET AL.
irrigation departments for areas not accessible due to road conditions and time constraints. LULCnames and class labels were assigned in the field using the protocol (Gumma et al. 2014; Thenkabailet al. 2009b). Determining the areas where rice-fallow occurs is of great importance as illustrated inFigure 3.
2.5. Ideal spectral signatures
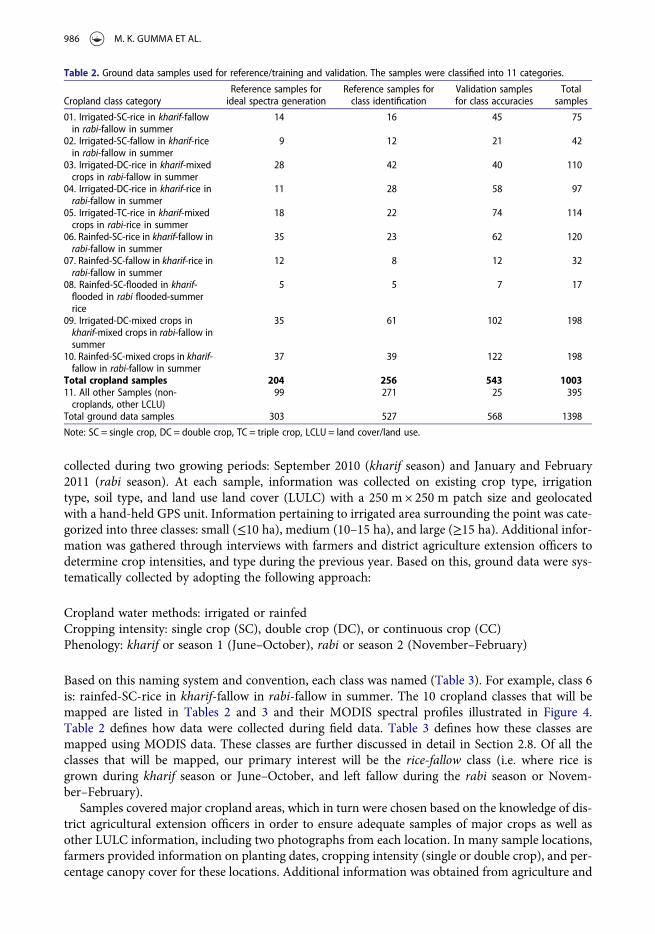
Ideal spectral signatures (Figure 4) were generated using every 16-day MODIS NDVI time-seriesdata with precise knowledge on croplands based on extensive ground survey information completedin 2010 and 2011 (Table 2, Figure 1). Ideal spectral signatures were based on 204 unique referencesamples available from field data (Table 2). The MODIS NDVI time-series ideal spectral signatureswere extracted from each of these 204 ground reference field samples. The 204 reference samples(Table 2) were grouped according to their unique categories and also grouped under major rice sys-tems as shown in Figure 4. The samples were grouped into homogeneous categories that generatedideal spectral signatures taking into consideration cropping intensity, crop type, and cropping sys-tems (Figure 4). Each signature was generated with group of similar samples. For example Figure 4(a), class 1: ‘01. Irrigated-single crop-rice in kharif-fallow in rabi-fallow in summer (14)’ signaturedefines/means: irrigated rice croplands during the kharif season followed by fallow during therabi season, and also fallow during the summer season (14 ground samples). The signatures aresmoothed to remove noise, if present. Overall, a total of 10 unique cropland classes (Figure 4(a–d)) that are either irrigated (classes 1–5 and 9; Figure 4) or rainfed (classes 6–8 and 10; Figure 4),have differing cropping intensities (e.g. classes 1, 2, 6–8, and 10 are single crop; classes 3, 4, and 9
Table 3. Classes suitable for rice-fallow. Rationale for considering classes 1 and 6 for rabi season (November–February) as fallowcropland areas suitable for chickpea cultivation across South Asia.
Class descriptionConsidered or
notRationaleName Yes/No
01. Irrigated-SC-rice in kharif-fallowin rabi-fallow in summer
Yes These rice dominant croplands during kharif season areoverwhelmingly fallow in rabi season, have sufficientmoisture/water for growing rabi grain legumes
02. Irrigated-SC-fallow in kharif-rice inrabi-fallow in summer
No Since this class is already overwhelmingly cropped during rabiseason, areas under this class are not available for rabi grainlegumes
03. Irrigated-DC-rice in kharif-mixedcrops in rabi-fallow in summer
No Since this class is already overwhelmingly cropped during rabiseason, areas under this class are not available for rabi grainlegumes
04. Irrigated-DC-rice in kharif-rice in rabi-fallow in summer
No Since this class is already overwhelmingly cropped during rabiseason, areas under this class are not available for rabi grainlegumes
05. Irrigated-TC-rice in kharif-mixedcrops in rabi-rice in summer
No Since this class is already overwhelmingly cropped during rabiseason, areas under this class are not available for rabi grainlegumes
06. Rainfed-SC-rice in kharif-fallow inrabi-fallow in summer
Yes These rice dominant croplands during kharif season areoverwhelmingly fallow in rabi season, have sufficientmoisture/water for growing rabi grain legumes
07. Rainfed-SC-fallow in kharif-rice inrabi-fallow in summer
No Since this class is already overwhelmingly cropped during rabiseason, areas under this class are not available for rabi grainlegumes
08. Rainfed-SC-flooded in kharif-floodedin rabi flooded-summer rice
No Since these areas have excess water during rabi, not suitable for rabigrain legumes
09. Irrigated-DC-mixed crops in kharif-mixed crops in rabi-fallow in summer
No Since this class is already overwhelmingly cropped during rabiseason, areas under this class are not available for rabi grainlegumes
10. Rainfed-SC-mixed crops in kharif-fallow in rabi-fallow in summer
No These croplands do not have sufficient moisture/water for rabi grainlegumes. Thereby, even though these croplands are fallow duringrabi season, are not suitable for rabi grain legumes
INTERNATIONAL JOURNAL OF DIGITAL EARTH 987

are double crop; and classes 5 is a triple crop; Figure 4), and distinct phenological cycles were estab-lished (Figure 4)."
2.6. Class spectra generation
First, South Asian croplands were masked out from non-croplands based on recent findings reportedin previous studies (Dheeravath et al. 2010; Gumma et al. 2011a; Thenkabail et al. 2009b). In order toensure that cropland masks include all cropland areas, we used masks from multiple studies. Giventhat overwhelming majority of croplands (∼99%) are within these cropland masks (that we have ver-ified by overlaying our cropland ground data points), our emphasis of the study was within thismask. Second, even non-cropland mask (all areas outside cropland mask) were analyzed separatelyto determine whether there were any croplands in the non-cropland mask areas. Third, class spectra(e.g. Figure 5(a)) were generated based on unsupervised classification of MODIS 250 m, 16-dayNDVI time-series data for the year 2010–2011 using ISOCLASS cluster algorithm (ISODATA inERDAS Imagine 2014™) followed by progressive generalization (Cihlar et al. 1998). Finally, theinitial classification was set at a maximum of 160 iterations and a convergence threshold of 0.99,which resulted in 160 classes for entire South Asian study area. For non-cropland mask areas, weperformed a quick 25-class classification and looked for any cropland areas. Since any croplandwithin this was negligible (<1%), we ignored it in our analysis.
Figure 3. Rice-fallow illustration. Rice-fallow are croplands where rice crop is grown during the kharif season (upper photo) and leftfallow during the rabi season (lower photo). Note the MODIS 250 m every 16-day NDVI is also shown on the photo (magenta line)for the different months.
988 M. K. GUMMA ET AL.

2.7. Matching class spectra with ideal spectra to group classes using SMTs
The matching of class spectra with ideal spectra is clearly demonstrated in Figures 5 and 6. The initial160 unsupervised classes (called class spectra) are grouped into a number of groups based on quan-titative SMTs (Homayouni and Roux 2003; Thenkabail et al. 2007). The process involves four steps:
1. Grouping similar class spectra (Figure 5(a)): Starting with initial 160 classes, all classes that arespectrally similar or very close, as determined by qualitative and quantitative spectral matching tech-niques (QSMTs), are grouped together. In Figure 5(a), we show 12 classes (class numbers: 1, 3, 7, 11,12, 18, 22, 43, 48, 55, 87, and 121), from the original 160 that were grouped together since they arehighly correlated with one another, which is also shown in qualitative plot (Figure 5(a)).
2. Finding an ideal spectra that matches closest to class spectra (Figure 5(b)): From the idealspectral library (Figure 3), an ideal spectra (Figure 5b) was selected that matches closest to classspectra that are grouped together (Figure 5(a)).
3. Matching class spectra with ideal spectra (Figure 5(c)): The 12-class spectra (Figure 5(a)) werematched with ideal spectra (Figure 5(b)) through QSMT (Figure 5(c)). This led to determining spec-tral correlation similarity (SCS) R-square values (a type of QSMT) by correlating ideal spectra(Figure 5(b)) with class spectra (Figure 5(a)). For example, ‘CL_001 (0.83)’ means the SCS R-squarevalue between class 1 and the ideal spectra is 0.83. The SCS R-square values varied between 0.79 to0.97 (Figure 5c), and
4. Combining all similar class spectral classes into a single class (Figure 5(d)): Since all the 12-class spectral classes are very highly correlated to one another and in turn they are highly correlatedwith ideal spectra, the 12-class spectral classes are combined into a single class. This single class(magenta in Figure 5(d)) has an SCS R-square value of (0.97). So, the 12 classes now become a single
Figure 4. Ideal spectral signatures of 10 cropland classes of South Asia. Here are the 10 ideal spectral signatures. For example, classname in the legend ‘01. Irrigated, SC, rice in kharif, fallow in rabi, fallow in summer (14)’ (Figure 4(a), green color plot) meansirrigated croplands that have cropping intensity of single crop (crop grown only during 1 season in 12 months) with rice cropgrown during kharif (June–October), but left fallow during rabi (November–February) and also left fallow in summer (March–May). The number 14 within bracket means that the ideal spectra is established based on 14 samples that are spread acrossstudy area.
INTERNATIONAL JOURNAL OF DIGITAL EARTH 989

class and will have a preliminary name of ‘rainfed-SC-rice in kharif-fallow in rabi-fallow in summer’.This preliminary class labeling was verified with other ground data, and very high resolution imageryto determine the one final label for the 12 combined classes.
Thus, the 12 combined classes take the same label as the ideal spectral, that is, ‘rainfed-SC-rice inkharif-fallow in rabi-fallow in summer’. The spatial distribution of these classes is shown in Figure 6.Also, all non-rice classes (i.e. all other crops) were grouped into a single class as they were not classesof interest in this study. So, the entire focus of this study was in characterizing (e.g. Figure 4), iden-tifying (e.g. Figure 5), and spatially mapping (e.g. Figure 6) rice classes. These preliminary labeling ofclasses were further validated using: (a) ground survey data, (b) very high-resolution imagery, (c)expert opinion, (d) other published work, or national statistics a combination of these. The sameprocess is used to identify and label all 160 classes, leading to final classes (Figures 8 and 10, andTable 4).
Some classes may not resolve conclusively even after using ground survey information and otherinformation mentioned above. Such classes were then subset, re-classified, and re-analyzed followingthe protocols mentioned above (Gumma et al. 2011a, 2014; Thenkabail et al. 2007). Using the same
Figure 5. Illustration of spectral matching techniques (SMTs). SMTs to match class spectra with ideal spectra where single crop isgrown with rainfed rice crop cultivated during the kharif season (June–October), but is overwhelmingly left fallow during the rabiseason (November–February). The process involves four steps: (1) Grouping similar class spectra (Figure 5(a)): For example, ofthe 160 initial unsupervised classes, we grouped all classes that have similar time-series spectral signatures. For example, in Figure5(a) a total of 12 classes (class numbers: 1, 3, 7, 11, 12, 18, 22, 43, 48, 55, 87, and 121) were grouped together since they are highlycorrelated. (2) Finding an ideal spectra that matches closest to class spectra (Figure 5(b)): From the ideal spectral library(Figure 3), we selected an ideal spectra (Figure 5(b)) that matches closest to class spectra that are grouped together (Figure 5(a)). (3) Matching class spectra with ideal spectra (Figure 5(c)): The 12 class spectra were matched with ideal spectra throughquantitative spectral matching technique (QSMT). This lead to determining spectral correlation similarity (SCS) R-square value (atype of QSMT) by correlating ideal spectra with class spectra. For example, ‘CL_001 (0.83)’ means the SCS R-square value betweenclass 1 and the ideal spectra is 0.83, and (4). Combining all similar class spectral classes to a single class (Figure 5(d)): Since allthe 12 class spectral classes are very highly correlated to one another and in turn they are highly correlated with ideal spectra, the12 class spectral classes are combined into a single class. This single class (magenta in Figure 5(d)) has an SCS R-square value of(0.97). So, the 12 classes now become a single class and will have a preliminary name of ‘rainfed-SC-rice in kharif-fallow in rabi-fallow in summer’. This preliminary class labeling was verified with other ground data, and very high resolution imagery to deter-mine the one final label for the 12 combined classes.
990 M. K. GUMMA ET AL.

approach as above, each of the 160 classes of South Asia were grouped into distinct categories, ident-ified, and labeled.
The process, led to reducing 160 class spectral classes (Section 2.6) to 11 combined classes (Figure8). Of these 11 combined classes, 10 classes were croplands (Figure 8, Table 4). The remainder of theindividual non-cropland classes were grouped into a single class (class 11 in Figure 8). Statistics wereonly provided for the 10 cropland classes (Table 4).
2.8. Identifying croplands with potential for cultivating chickpea (Cicer arietinum)
Each of the 10 cropland classes in Figure 8 was assessed (Table 3) for their potential for cultivatinggrain legumes such as chickpea (Cicer arietinum), black gram (Vigna mungo), green gram (Vignaradiata), and lentil (Lens culinaris). Using class 6 as an example, Figure 7 illustrates how theNDVI gradually goes up during mid-July and reaches a peak (0.7) in October and gradually fallsto pre-planting levels of about 0.4 indicating the cultivation of kharif rice followed by cropland fal-low. The dates of vegetation transitions were determined using the NDVI time series and a double-logistic model of vegetation phenology (Biggs et al. 2006; Fischer 1994):
NDVIt = vs + k1+ exp(− c(t − p))
− k+ vs − ve1+ exp(− d(t − q))
, (2)
where vs is starting of rice growing season, ve is the ending of the rice growing season, k is an asymp-totic maximum value of NDVI, c and d are the slopes of the NDVI time series at the inflection points,and p and q are the dates of the inflection points (Figure 7).
Class 6 (Figures 4 and 5) is therefore a cropland class that is rainfed during the kharif season withrice crop but left fallow in rabi seasons and during summer months. Each of the 10 classes in Figure 4can be characterized and assessed (Table 3) for their potential for cultivating grain legumes. Withinthese classes, our goal is to identify fallow croplands during rabi season. Suitable classes shouldmeet all of the following conditions:
Figure 6. Spatial distribution of rice-fallow classes of rainfed areas. These 12 classes (left image) have rice crop grown during kharif(June–October) season, but are left fallow during the rabi (November–February) season. The image on the right is the 12 classesmerged into a single rice-fallow class.
INTERNATIONAL JOURNAL OF DIGITAL EARTH 991

(A) The class should be a fallow cropland during the rabi season;(B) The class should be a cropland with rice cultivation during kharif season; and(C) The class should have sufficient moisture/water during the rabi season to grow short-season
(≤3 month), low water-consuming crop determined based on field surveys or expert opinion.
If all of the above conditions are met, then the class (Table 3, Figure 8) becomes suitable for cultivat-ing grain legumes such as chickpea. Each of the 10 classes (Figure 8, Table 3) were analyzed to ascer-tain if they met the three conditions. The rationale for which classes qualify for grain legumecultivation are given in Table 3.
It is clear that class 1 and class 6 have fallow croplands during the rabi season. These are alsoclasses where rice is grown in the kharif season under rainfed and irrigated conditions. Field surveysand expert opinion gathered during extensive field visits and discussions with local experts alsoclearly indicated that these two classes have adequate moisture for about three months in the rabiseason (November–February). Thus they were identified as active croplands that are fallow duringrabi, but which also have sufficient moisture to grow a short-season (∼3 month) crop. The rest of theclasses do not qualify for rabi-season chickpea cultivation since they do not meet one or more criteriamentioned above.
2.9. Calculating sub-pixel areas
Full-pixel areas (FPAs) are not a correct representation of actual areas of crops grown due to obvioussensor resolution issues. Sub-pixel areas (SPAs) or actual area calculation is of greater significance aspixel sizes become coarser. In this study, MOD13Q1 pixels cover 250 m on each side and its area is6.25 ha. So, for example, for a pixel with only 50% cropped, a FPA-based area calculation per pixelwill be 6.25 ha, whereas the SPA or actual area will be 3.125 ha (6.25 ha × 0.5). Therefore, areas mustbe calculated based on SPAs to avoid discrepancies in estimates of cropped area.
Cropland area fractions (CAFs) were calculated for the kharif season (June–October) and rabiseason (November–February) using the methodology described by Thenkabail et al. (2007) andThenkabail, Schull, and Turral (2005). This resulted in CAFs that varied between 77.1% or 0.771for class 10 during kharif (June–October) to 97.1% or 0.971 during kharif for class 5 (Table 4). In
Figure 7. Classic case of rainfed rabi-fallow. A model of vegetation phenology and transition dates, as in Equation (3). Tmin definesthe beginning of the time series, Ton is onset of greenness, Tdev beginning of development stage, Tsen onset of senescence, and Tharis harvesting time. p and q are the inflection points. Figure shows the progression of class 6. Rainfed, single crop during kharif(June–October), fallow during rabi (November–February), and fallow during summer (March–May). In this study we want tomap rice croplands areas (either in kharif or summer) that are left fallow during rabi.
992 M. K. GUMMA ET AL.

Figure 8. Spatial distribution of croplands and their characteristics in South Asia. The first 10 classes show irrigated or rainfed classes that have single or double or triple cropping and where rice or othercrops dominate. The classes also show seasonality of cropping and when croplands are left fallow. Class 11 is non-croplands within the cropland mask. The black areas are non-croplands outside thecropland mask.
INTERN
ATIO
NALJO
URN
ALOFDIGITA
LEA
RTH993

seasons when there is little or no crop (cropland fallow), the CAFs were negligible (≤5%). The CAFswere calculated for each season using the same procedure as described in detail by Thenkabail et al.(2007). This resulted in calculating SPAs also for each season (Table 4). SPAs are important becausewe defined a particular class as croplands when, for example, ≥50% of the pixel area is cropped. Thatwould mean, a pixel whether it has 50% area cropped or 100% area cropped is still mapped as crop-lands. In order to get actual areas, FPA needs to be multiplied by CAF (Table 4). Overall, the actualareas are equivalent to SPAs. That is, each pixel in each class is assessed for its actual area as follows:
SPAs or actual areas = FPAs× CAFs
Table 4. Cropland statistics of rice-fallow (classes 1 and 6) and other classes. Rice systems in South Asia, including other agricultureareas with irrigation source. The table shows full-pixel area (FPA), crop area fraction (CAF), and sub-pixel area (SPA) or actual area.SPA = FPA × CAF.
Class description
Full-pixelarea (FPA)(000′ha)
% oftotalarea(FPA)
Cropland area fractions(CAFs) (%) Actual cropland area (000’ha)
Kharif Rabi Summer Kharif Rabi Summer
Total grosscrop land
area (000’ha)
01. Irrigated-SC-rice inkharif-fallow in rabi-fallow in summer
10,273 4.9 96.1 3.1 3.2 9873 318 329 10,520
02. Irrigated-SC-fallow inkharif-rice in rabi-fallow in summer
2952 1.4 3.1 92.2 3.1 92 2722 92 2905
03. Irrigated-DC-rice inkharif-mixed crops inrabi-fallow in summer
20,811 9.9 94 88.9 3.3 19,562 18,501 687 38,750
04. Irrigated-DC-rice inkharif-rice in rabi-fallow in summer
2,801 1.3 96.3 94.6 3 2698 2650 84 5432
05. Irrigated-TC-rice inkharif-mixed crops inrabi-rice in summer
5,726 2.7 97.3 91.7 89.8 5571 5250 5142 15,963
06. Rainfed-SC-rice inkharif-fallow in rabi-fallow in summer
14,306 6.8 91.3 2.9 2.1 13,061 415 300 13,777
07. Rainfed-SC-fallow inkharif-rice in rabi-fallow in summer
891 0.4 3 93.6 3 27 834 27 888
08. Rainfed-SC-flooded inkharif-flooded in rabiflooded-summer rice
618 0.3 3 3 91.9 19 19 568 605
09. Irrigated-DC-mixedcrops in kharif-mixedcrops in rabi-fallow insummer
73,633 35.0 86.7 83.2 3.5 63,840 61,263 2577 127,680
10. Rainfed-SC-mixedcrops in kharif-fallow inrabi-fallow in summer
78,416 37.3 77.7 18 0 60,929 14,115 0 75,044
Total croplands 210,428 175,671 106,087 9805 291,563
Note: Net cropland areas cultivated in South Asia, full-pixel areas (FPA) = 210,428,000 ha.Net cropland areas cultivated in South Asia, sub-pixel areas (SPAs) or actual areas during summer season (March–May) = 9,805,241ha.
Gross cropland areas cultivated in South Asia, sub-pixel areas (SPAs) or actual areas = 291,562,500 ha.For classes 1 and 6 (Note: these two classes have rice during kharif and left fallow in rabi).Total net cultivated areas during kharif in South Asia, SPAs or actual areas of classes 1 and 6 = 22,933,730 ha.Total net cultivated areas during rabi in South Asia, SPAs or actual areas of classes 1 and 6 = 733,343 ha.Total uncultivated areas during rabi that were cultivated during kharif, SPAs or actual areas of classes 1 and 6 = 22,200,576 ha.
994 M. K. GUMMA ET AL.
2.10. Accuracy assessments and comparison with national statistics
Accuracy assessment was based on a total of 568 independent ground samplings, as described in Section2.4. These ground samples were not used in class identification and labeling and hence are completelyindependent. The accuracy assessment is performed using an error matrix (Congalton 1991). The col-umns (x-axis) of an error matrix contain the ground survey data samples and the rows (y-axis) rep-resent the results of the classified rice maps. The error matrix is a multi-dimensional table in whichthe cells contain changes from one class to another. The statistical approach of accuracy assessment con-sists of different multi-variate statistical analyses. A frequently used measure is kappa, which is designedto compare results from different regions or different classifications (Congalton 1991).
The SPAs were calculated at district level administrative units and compared with national stat-istics at the district level (e.g. www.indiastat.com) (INDIASTAT 2015). Statistics for India wereobtained from the website of the Ministry of Agriculture’s Directorate of Rice Development(http://dacnet.nic.in/rice/), while statistics for Bangladesh, Nepal, Pakistan, Nepal, and Bhutanwere obtained from national statistical departments (BBS 2011; CBS 2013; SDCS 2013). Based onthe data available from the target countries, we compared irrigated area statistics derived usingMODIS data gathered at the provincial or state level were compared, resulting in 62 administrativeunits. Similarly, rice cropland estimates derived from MODIS data analysis were compared at thesub-district level (812 administrative units).
3. Results
Considering the objectives of this study and based on the methods described in section 2.0 and itssub-sections, distinct cropland classes of South Asia were mapped (Figure 8). The characteristics ofthese cropland classes were then used to determine fallow croplands during the rabi season that aresuitable areas for cultivating grain legumes (Figure 9, Table 4).
3.1. Spatial distribution of croplands in south Asia
The spatial distribution of cropland areas of South Asia with 10 distinct cropland classes and an 11thother land cover/land use (LCLU) is shown in Figure 8, with statistics provided in Table 4.
Based on the FPA, 44% (210.4 Mha) of the total geographic area (477 Mha) of South Asia was undercroplands (classes 1 to 10 in Figure 8, Table 4). Of the 210.4 Mha, class 9 (irrigated-DC-mixed crops inkharif-mixed crops in rabi-fallow in summer) with 35% and class 10 (rainfed-SC-mixed crops in kharif-fallow in rabi-fallow in summer) with 37.3% dominate. Even though these are large areas, class 9 is irri-gated and cultivated in rabi as well as kharif, whereas class 10 is rainfed and is cultivated only in kharif.Although during the rabi season class 10 is fallow, cultivation of crops is not viable since these lands arerainfed during kharif and do not have sufficient residual moisture for crop growth during the rabi sea-son. The NDVI phenological characteristics of these classes are shown in Figure 4. All 10 croplandclasses are mapped (Figure 4) and their actual areas (or SPAs) are established (Table 4).
The FPA of croplands in South Asia was 210.48 Mha (Figure 9, Table 4). Of this, 175.67 Mha(83% of net cropped area) is SPAs during kharif (Table 4). This significantly differs from the rabicrop land area that is estimated at about 50% of the net cropped area. While classes 9 and 10,due to their large area, dominate the kharif season, only class 9 dominates during the rabi season,followed by class 3, indicating the importance of irrigation for growing a rabi crop.
3.2. Cropland classes with rabi-fallow suitable for cultivating grain legumes across SouthAsia
Of the 10 cropland classes (Figure 8, Table 4), two classes (Figure 9) meet the three critical criterionfor being eligible for rabi-season cropping. There two classes were: irrigated-SC-rice in kharif-fallow
INTERNATIONAL JOURNAL OF DIGITAL EARTH 995

in rabi-fallow in summer (class 1); and rainfed-SC-rice in kharif-fallow in rabi-fallow in summer(class 6). These classes are rice-fallow areas because rice is grown in these class areas during kharifand overwhelmingly left fallow during rabi.
The total net cultivated area during kharif in South Asia, SPAs or actual areas, of classes 1 and 6were 22.93 Mha (Table 4). The total net cultivated area during rabi in South Asia, SPAs or actualareas, of classes 1 and 6 were 0.73 Mha (Table 4). Therefore this leaves a total uncultivated area ( fal-low croplands) of 22.2 Mha (22.93–0.73 Mha) during rabi from classes 1 and 6 (Table 4) and poten-tially available for rabi-season cropping.
3.3. Accuracies and errors
Accuracies of the classes were established based on 568 ground sample data (Table 5). This providedan overall accuracy of 82% with kappa of 0.79. The user’s and producer’s accuracies of most classeswere above 80%. Even when they were somewhat lower, the class mix is mainly among croplandclasses. Classes 1 and 6 are cropland fallow classes and hence critical to this study. These classeswere determined to have producer’s accuracy of 80% and 75%, respectively, while the user’s accuracyof 82% and 69%, respectively. The lower accuracies for some of the classes can be improved through
Figure 9. Rice-fallow of South Asia. Two cropland classes where rice is grown during kharif (June–October) season, but are fallowcroplands during rabi (November–February) season are shown here. Class 1 has irrigated rice crop during in kharif season, and class6 has rainfed rice during kharif season. Both classes are left fallow during the rabi season. The total areas of such rice-fallow is 22.2Mha where second or rabi–season, low water-consuming, short-season (≤3 month) legume crops such as chickpea, black gram,green gram, and lentils can be grown.
996 M. K. GUMMA ET AL.

Table 5. Accuracy assessments using error matrix. Accuracies and errors of cropland classes including rice-fallow classes of South Asia).
Crop classification 01. 02. 03. 04. 05. 06. 07 08 09. 10. 11.Classtotals
Referencetotals
Classifiedtotals
Users’accuracy (%)
Producers’accuracy (%) Kappa
01. Irrigated-SC-rice in kharif-fallow in rabi-fallow in summer
37 0 0 1 1 6 0 0 1 0 0 45 46 37 82 80 0.8
02. Irrigated-SC-fallow in kharif-rice in rabi-fallow in summer
0 19 0 1 3 0 1 1 1 0 0 21 26 19 90 73 0.7
03. Irrigated-DC-rice in kharif-mixed cropsin rabi-fallow in summer
0 0 37 1 6 1 1 0 2 0 0 40 48 37 93 77 0.8
04. Irrigated-DC-rice in kharif-rice in rabi-fallow in summer
0 0 0 49 1 1 0 0 2 1 1 58 55 49 84 89 0.9
05. Irrigated-TC-rice in kharif-mixed crops inrabi-rice in summer
0 0 1 0 54 0 1 0 4 0 0 74 60 54 73 90 0.9
06. Rainfed-SC-rice in kharif-fallow in rabi-fallow in summer
6 1 0 1 4 43 0 0 0 2 0 62 57 43 70 75 0.7
07. Rainfed-SC-fallow in kharif-rice in rabi-fallow in summer
0 0 0 2 2 0 5 0 0 0 1 12 10 5 42 50 0.5
08. Rainfed-SC-flooded in kharif-flooded inrabi flooded-summer rice
0 0 0 0 0 0 0 5 0 0 0 7 5 5 71 100 1
09. Irrigated-DC-mixed crops in kharif-mixed crops in rabi-fallow in summer
0 1 1 3 2 10 2 1 88 5 2 102 115 88 86 77 0.7
10. Rainfed-SC-mixed crops in kharif-fallowin rabi-fallow in summer
2 0 1 0 0 0 1 0 0 105 0 122 109 105 86 96 1
11. Other LULC 0 0 0 0 1 1 1 0 4 9 21 25 37 21 84 57 0.5Column Total 45 21 40 58 74 62 12 7 102 122 25 568 568 463
Note: Overall classification accuracy = 82%; overall kappa statistics = 0.79; X-axis is Ground survey information and Y-axis is Modis derived classification.
INTERN
ATIO
NALJO
URN
ALOFDIGITA
LEA
RTH997

a number of measures that include: (a) access to greater number of reference/training data, (b) con-ducting more regional analysis and/or analyzing them by AEZs, (c) incorporating other data such asslope, soils, and elevation, (d) aggregating classes where areas are very small (e.g. small classes like 7and 8 with a large class like 6 to get broader rainfed group), and (e) incorporating higher resolutiontime-series remote sensing data such as Landsat 30 m every 16-day.
3.4. Comparison with district-wise cropland statistics
Figure 6 illustrates the spatial extent of rice growing areas or rice-fallow (Table 5) where rice crop isgrown during the kharif (June–October) and left fallow during rabi (November–February). In orderto assess how well the spatial extent of rice fallow were estimated, we correlated (Figures 10 and 11)district-wise statistics of rice areas of kharif derived from remote sensing in this study with the stat-istics obtained from national systems; resulting in a R2 value of 0.84. Some of the uncertainty that wesee in Figure 10 is as a result of the uncertainties existing in the national statistics. Figure 11 showsdistrict by district correlation map between the MODIS derived areas versus the district statisticsfrom the national systems. Correlations are high (0.8 or greater) in districts where rice is dominantcrop. Low correlations are in areas where there is fragmentation in rice growing areas.
4. Discussion
Mapping rice-fallow (Figure 9, Table 4) is useful for providing intensification options for producingmore food, which is critical for ensuring the global food security. Greater food production for agrowing population requires more land. Since cropland expansion is not feasible and has costlyenvironmental and ecological impacts (Kuemmerle et al. 2013; Thenkabail et al. 2012; Tilman1999; Tilman et al. 2002), cropland intensification by cultivating existing fallow croplands is a poss-ible option. In certain parts of South Asia, croplands are left fallow over large areas during the rabiseason (November–February) (Figures 6 and 9). The areas where rice crop is grown during the kharif
Figure 10. Remote-sensing-derived rice area comparisons with national statistics. The district-wise rice areas derived using MODIS250 m are compared with agricultural census data for 2010–11.
998 M. K. GUMMA ET AL.

season (June–October) also hold significant moisture/water during the rabi season to sustain a short-season, low water-consuming grain legume crop such as chickpea. This study extensively investi-gated South Asia using MODIS 250 m NDVI time series to arrive at cropland classes (Figure 8)from which two cropland fallow classes (Figure 10) were identified as most suitable areas for therabi-season cultivation with short-season, low water-consuming grain legumes. These two classeshave a total area of about 22.2 Mha (Table 4, Figure 9) as fallow croplands during the rabi season.
The present research used MOD13Q1.5 temporal data to identify rice-fallow with rice systemsand irrigated areas across South Asia. MODIS captures imagery on a daily basis. The 16-day com-posites from the daily acquisitions combine to make a time-series dataset over a crop year or a calen-dar year. This type of dataset provides temporal profiles of crop growing locations to identify thestart of season, peak growth stage, and harvest date during each season. The value of NDVI as func-tion of time also helps in identifying the type of crop in an eco-region based on certain peakthresholds for that crop. This study applies an SMT which is found to be ideal in mapping irrigatedand rainfed areas (Thenkabail et al. 2007) and mapping rice areas (Gumma et al. 2011a). Mappingthe spatial distribution of rice-fallow areas using MODIS 250 m 16-day time series and ground sur-vey information with SMTs is a significant new advancement in the use of this technology. Theadvantage of using an SMT in this study is in ability to selectively use the ideal spectral profiles ofrice during the rainy season. The rainfed rice spectral class varies from 0.25 to 0.70 for purely rainfedrice and 0.25 to 0.85 for irrigated rice during the rainy season. The qualitative (shape) differencebetween ideal spectra and class spectra is narrow and represents the fallow lands accurately.
SMT is a powerful concept (Homayouni and Roux 2003; Thenkabail et al. 2007) for mappingcroplands or for that matter any land use/land cover (LULC) using time-series remotely senseddata. The process of matching class spectra with ideal spectra will be invaluable in fast and automaticidentification and labeling of classes. However, SMTs will not work without accurate ground data/
Figure 11. Correlation between MODIS derived kharif rice areas versus the national statistics.
INTERNATIONAL JOURNAL OF DIGITAL EARTH 999

knowledge that help develop accurate sets of ideal spectral libraries. Uncertainties and/or inaccura-cies in ground data will result in class labeling errors leading to uncertainties in classes that are inter-preted and mapped.
Cropped area fractions were calculated to better calibrate the MODIS pixel area to the real irri-gated/rice or rainfed/rice area. Also, this method relies on ground survey information that is a trulyrepresentative sample of the fragmented rice systems. Higher resolution imagery could be used toprovide a more accurate estimate of pure classes, but wall to wall coverage, repeat coverage duringcrop growing period, costs, and massive processing are all major issues hard to surmount for suchlarge areas as South Asia. Results clearly show that present methods and MODIS time-series datahave many advantages such as capturing large-scale cropping pattern. But to minimize errors,additional research will be attempted with multi-sensor images, including Landsat 30-m data withadvanced fusion techniques (Gumma et al. 2011b).
Source of water and crop intensity are also considered in the classification of land cover. Thepotential areas among these rice-based systems are classes 1 and 6 with an extent of around 22.2Mha (Table 6). The land use class 10 is another potential area where the rabi-fallow are very high(47 Mha), but the suitability for legume production needs to be assessed. Also, crop modelingtools can help in assessing the potential yields in classes 1 and 6, but class 10 needs a thorough inves-tigation of the edapho-climatic suitability. The largest rice-fallow area under class 6 is in the north-eastern plateau of India, including Chattisgarh, Chotanagpur Plateau and the Assam region, whichare under red and yellow soils. The important states in India where the rice-fallow areas can beexploited are Chattisgarh, Odissa, West Bengal, Madhya Pradesh, Telangana, Assam and Maharash-tra. The Barind Tract (Rajshahi, Naogadh, Bogra, and Dinajpur divisions) in Bangladesh is a poten-tial region based on the eco-physiography covering an area of 2 Mha. In Nepal the eastern andcentral terai regions with an extent of 0.3 Mha are the potential areas. Sri Lanka is another potentialcountry with an area of 0.26 Mha spread over the central, north-central, and eastern regions. TheSind region in Pakistan has the largest rice-fallow area with about 0.09 Mha specifically in the Sulai-man Peidmont.
5. Conclusions
The study developed maps of rice-fallow cropland areas, where rice grown during the kharif season(June–October) but left fallow during the rabi season (November–February), for entire South Asiabased on MODIS 250 m every 16-day NDVI time-series data analyzed using SMTs. These rice-fallowcropland areas can support low water-consuming, short-growing season (≤3 months) rabi-seasonlegumes such as chickpea, black gram, green gram, and lentils, but are unsuitable for growing ricecrop or other cereals during the rabi season due to lack of moisture/water to sustain these highwater-consuming, relatively long-growing season (>3 month) crops. In South Asia, the rice-fallowcropland area classes occupied 22.2 Mha (Figure 9, Table 4) of SPAs or actual areas during the kharifseason. Currently, out of the 22.2 Mha of actual areas identified during the kharif season, only about
Table 6. Rice-fallow by country. Country-wise distribution of areas of rabi-rice-fallow in South Asia.
Area in (000’ha)
Country01. Irrigated-SC-rice in kharif-fallow in rabi-fallow in
summer06. Rainfed-SC-rice in kharif-fallow in rabi-fallow in
summer Total
Bangladesh 1190 739 1929Bhutan 3 1 4India 7909 11,695 19,604Nepal 194 117 311Pakistan 14 93 107Sri Lanka 244 1 245Total 9554 12,646 22,200
1000 M. K. GUMMA ET AL.

0.77 Mha is cropped during the rabi season. This has left a massive 21.43 Mha of fallow croplandareas available to grow short duration, low water-consuming legume crops during the rabi aftermonsoon kharif rice cultivation in these areas. The overall accuracy of cropland mapping was82% with kappa coefficient of 0.79. The rabi-fallow cropland classes (with rice as kharif crop) showedproducer’s accuracies between 75% and 80% and user’s accuracies between 69% and 82%. Thus, thisstudy has demonstrated the use of remote-sensing data and techniques to identify and map rice- fal-low cropland areas in South Asia, with the overall goal of providing baseline information to policyand resource planning for sustainable development of production agriculture through croplandintensification and diversification rather than cropland area expansion for meeting the food andnutritional demands of growing population that is also economically advancing.
Acknowledgments
Authors would like thank to International Rice Research Institute (IRRI) for providing ground survey data and dis-trict-wise national statistics; Dr Dheeravath Venkateshwarlu, Dr Andrew Nelson, and Dr Mitch Scull for supportingground surveys in India; Dr Saidul Islam for Bangladesh ground survey data; Dr Nimal Desanayake for Sri Lankaground survey data.
Funding
This research was supported by two CGIAR Research Programs: Dryland Cereals, Grain legumes and WLE. Theresearch was also supported by the global food security support analysis data at 30 m project (GFSAD30; http://geography.wr.usgs.gov/science/croplands/; https://croplands.org/) funded by the NASA MEaSUREs [grant number:NNH13AV82I] (Making Earth System Data Records for Use in Research Environments) funding obtained throughNASA ROSES solicitation as well as by the Land Change Science (LCS), Land Remote Sensing (LRS), and ClimateLand Use Change Mission Area Programs of the U.S. Geological Survey (USGS).
ORCID
Murali Krishna Gumma http://orcid.org/0000-0002-3760-3935
References
Alexandratos, N., and J. Bruinsma. 2012. World Agriculture Towards 2030/2050: The 2012 Revision. ESA Work. Pap3. Accessed June 8, 2015. http://large.stanford.edu/courses/2014/ph240/yuan2/docs/ap106e.pdf.
Anderson, W., L. You, S. Wood, U. Sichra, and W. Wu. 2015. “An Analysis of Methodological and Spatial Differencesin Global Cropping Systems Models and Maps.” Global Ecology and Biogeography 24: 180–191.
Badhwar, G. D. 1984. “Automatic Corn–Soybean Classification Using Landsat MSS Data. I. Near-harvest CropProportion Estimation.” Remote Sensing of Environment 14: 15–29.
Bantilan, C., D. K. Charyulu, P. Gaur, M. S. Davala, and J. Davis. Forthcoming. Short Duration Chickpea Technology:Enabling Legumes Revolution in Andhra Pradesh. Hyderabad: ICRISAT, Patancheru.
BBS. 2011. Hand book of agriculture statistics, Bangladesh Bureau of Statistics. Accessed Janaury 20, 2012. http://www.bbs.gov.bd/webtestapplication/userfiles/image/AgricultureCensus/.
Biggs, T. W., P. S. Thenkabail, M. K. Gumma, C. A. Scott, G. R. Parthasaradhi, and H. N. Turral. 2006. “Irrigated AreaMapping in Heterogeneous Landscapes with MODIS Time Series, Ground Truth and Census Data, Krishna Basin,India.” International Journal of Remote Sensing 27: 4245–4266.
Biradar, C. M., P. S. Thenkabail, P. Noojipady, Y. Li, V. Dheeravath, H. Turral, M. Velpuri, et al. 2009. “A Global Mapof Rainfed Cropland Areas (GMRCA) at the End of Last Millennium Using Remote Sensing.” International Journalof Applied Earth Observation and Geoinformation 11: 114–129.
CBS. 2013. Central Bureau of Statistics: Statistical Year Book of Nepal – 2013. Accessed August 21, 2015. http://cbs.gov.np/.
Cihlar, J., Q. Xiao, J. Chen, J. Beaubien, K. Fung, and R. Latifovic. 1998. “Classification by Progressive Generalization: ANew Automated Methodology for Remote Sensing Multichannel Data.” International Journal of Remote Sensing 19:2685–2704.
Congalton, R. G. 1991. “A Review of Assessing the Accuracy of Classifications of Remotely Sensed Data.” RemoteSensing of Environment 37: 35–46.
INTERNATIONAL JOURNAL OF DIGITAL EARTH 1001

Dabin, Z., Y. Pengwei, Z. Na, Y. Changwei, C. Weidong, and G. Yajun. 2016. “Contribution of Green Manure Legumesto Nitrogen Dynamics in Traditional Winter Wheat Cropping System in the Loess Plateau of China.” EuropeanJournal of Agronomy 72: 47–55.
Dheeravath, V., P. S. Thenkabail, G. Chandrakantha, P. Noojipady, G. P. O. Reddy, C. M. Biradar, M. K. Gumma, andM. Velpuri. 2010. “Irrigated areas of India Derived Using MODIS 500 m Time Series for the Years 2001–2003.”ISPRS Journal of Photogrammetry and Remote Sensing 65: 42–59.
Dixon, J., A. M. Omwega, S. Friel, C. Burns, K. Donati, and R. Carlisle. 2007. “The Health Equity Dimensions of UrbanFood Systems.” Journal of Urban Health 84: 118–129.
FAO. 2015. FAOSTAT. Accessed June 2, 2015. http://faostat.fao.org/.FAO-IIASA. 2012. Global Agro-ecological Zones (GAEZ v3.0). IIASA and FAO. Accessed November 28, 2015. http://
webarchive.iiasa.ac.at/Research/LUC/GAEZv3.0/.Fischer, A. 1994. “A Model for the Seasonal Variations of Vegetation Indices in Coarse Resolution Data and its
Inversion to Extract Crop Parameters.” Remote Sensing of Environment 48: 220–230.Foerster, S., K. Kaden, M. Foerster, and S. Itzerott. 2012. “Crop Type Mapping Using Spectral–temporal Profiles and
Phenological Information.” Computers and Electronics in Agriculture 89: 30–40.Foley, J. A., N. Ramankutty, K. A. Brauman, E. S. Cassidy, J. S. Gerber, M. Johnston, N. D. Mueller, C. O’Connell, D. K.
Ray, and P. C. West. 2011. “Solutions for a Cultivated Planet.” Nature 478: 337–342.Garnett, T., M. Appleby, A. Balmford, I. Bateman, T. Benton, P. Bloomer, B. Burlingame, M. Dawkins, L. Dolan, and D.
Fraser. 2013. “Sustainable Intensification in Agriculture: Premises and Policies.” Science 341: 33–34.Ghosh, P., K. Bandyopadhyay, R. Wanjari, M. Manna, A. Misra, M. Mohanty, and A. S. Rao. 2007. “Legume Effect for
Enhancing Productivity and Nutrient Use-efficiency in Major Cropping Systems – An Indian Perspective: AReview.” Journal of Sustainable Agriculture 30: 59–86.
Gray, J., M. Friedl, S. Frolking, N. Ramankutty, A. Nelson, and M. Gumma. 2014. “Mapping Asian Cropping Intensitywith MODIS.” IEEE Journal of Selected Topics in Applied Earth Observations and Remote Sensing 7 (8): 3373–3379.doi:10.1109/JSTARS.2014.2344630.
Gumma, M. K., K. Kajisa, I. A. Mohammed, A. M. Whitbread, A. Nelson, A. Rala, and K. Palanisami. 2015a.“Temporal Change in Land Use by Irrigation Source in Tamil Nadu and Management Implications.”Environmental Monitoring and Assessment 187: 1–17.
Gumma, M. K., S. Mohanty, A. Nelson, R. Arnel, I. A. Mohammed, and S. R. Das. 2015b. “Remote Sensing BasedChange Analysis of Rice Environments in Odisha, India.” Journal of Environmental Management 148: 31–41.
Gumma, M. K., A. Nelson, P. S. Thenkabail, and A. N. Singh. 2011a. “Mapping Rice Areas of South Asia Using MODISMultitemporal Data.” Journal of Applied Remote Sensing 5: 053547. doi:10.1117/1.3619838.
Gumma, M. K., P. S. Thenkabail, F. Hideto, A. Nelson, V. Dheeravath, D. Busia, and A. Rala. 2011b. “MappingIrrigated Areas of Ghana Using Fusion of 30 m and 250 m Resolution Remote-Sensing Data.” Remote Sensing 3:816–835.
Gumma, M. K., P. S. Thenkabail, A. Maunahan, S. Islam, and A. Nelson. 2014. “Mapping Seasonal Rice CroplandExtent and Area in the High Cropping Intensity Environment of Bangladesh Using MODIS 500 m Data for theYear 2010.” ISPRS Journal of Photogrammetry and Remote Sensing 91: 98–113.
Gumma, M. K., P. S. Thenkabail, I. V. Muralikrishna, M. N. Velpuri, P. T. Gangadhararao, V. Dheeravath, C. M.Biradar, S. Acharya Nalan, and A. Gaur. 2011c. “Changes in Agricultural Cropland Areas Between a Water-surplusYear and a Water-deficit Year Impacting Food Security, Determined Using MODIS 250 m Time-series Data andSpectral Matching Techniques, in the Krishna River Basin (India).” International Journal of Remote Sensing 32:3495–3520.
Hobbs, P., and M. Osmanzai. 2011. “Important Rainfed Farming Systems of South Asia.” In Rainfed Farming Systems,edited by P. Tow, I. Cooper, I. Partridge, and C. Birch, 603–641. Amsterdam: Springer.
Homayouni, S., and M. Roux. 2003. “Material Mapping from Hyperspectral Images Using Spectral Matching in UrbanArea.” In IEEE Workshop in honour of Prof. Landgrebe, edited by P. Landgrebe. Washington, DC, USA.
INDIASTAT. 2015. State-wise Net Area Irrigated by Source in India and State-wise Irrigated Area Under Crops inIndia. Accessed May 30, 2015. www.indiastat.com.
Knight, J. F., R. L. Lunetta, J. Ediriwickrema, and S. Khorram. 2006. “Regional Scale Land-Cover Characterizationusing MODIS-NDVI 250 m Multi-Temporal Imagery: A Phenology Based Approach.” GIScience and RemoteSensing 43: 1–23.
Kontgis, C., A. Schneider, and M. Ozdogan. 2015. “Mapping Rice Paddy Extent and Intensification in the VietnameseMekong River Delta with Dense Time Stacks of Landsat Data.” Remote Sensing of Environment 169: 255–269.
Kuemmerle, T., K. Erb, P. Meyfroidt, D. Müller, P. H. Verburg, S. Estel, H. Haberl, P. Hostert, M. R. Jepsen, and T.Kastner. 2013. “Challenges and Opportunities in Mapping Land Use Intensity Globally.” Current Opinion inEnvironmental Sustainability 5: 484–493.
Lobell, D. B., G. P. Asner, J. I. Ortiz-Monasterio, and T. L. Benning. 2003. “Remote Sensing of Regional CropProduction in the Yaqui Valley, Mexico: Estimates and Uncertainties.” Agriculture, Ecosystems & Environment94: 205–220.
1002 M. K. GUMMA ET AL.

Pittman, K., M. C. Hansen, I. Becker-Reshef, P. V. Potapov, and C. O. Justice. 2010. “Estimating Global CroplandExtent with Multi-year MODIS Data.” Remote Sensing 2: 1844–1863.
Sakamoto, T., M. Yokozawa, H. Toritani, M. Shibayama, N. Ishitsuka, and H. Ohno. 2005. “A Crop PhenologyDetection Method Using Time-Series MODIS Data.” Remote Sensing of Environment 96: 366–374.
Salmon, J. M., M. A. Friedl, S. Frolking, D. Wisser, and E. M. Douglas. 2015. “Global Rain-fed, Irrigated, and PaddyCroplands: A New High Resolution Map Derived from Remote Sensing, Crop Inventories and Climate Data.”International Journal of Applied Earth Observation and Geoinformation 38: 321–334.
SDCS. 2013. Sri Lanka Department of Census and Statistics, Agriculture and Environment Statistics Division.Accessed August 21, 2015. http://www.statistics.gov.lk/agriculture/index.htm.
See, L., S. Fritz, L. You, N. Ramankutty, M. Herrero, C. Justice, I. Becker-Reshef, P. Thornton, K. Erb, and P. Gong.2015. “Improved Global Cropland Data as an Essential Ingredient for Food Security.” Global Food Security 4: 37–45.
Settle, W. H., H. Ariawan, E. T. Astuti, W. Cahyana, A. L. Hakim, D. Hindayana, and A. S. Lestari. 1996. “ManagingTropical Rice Pests Through Conservation of Generalist Natural Enemies and Alternative Prey.” Ecology 77 (7):1975–1988.
Subbarao, G., J. Kumar Rao, C. Kumar, U. Johansen, A. Irshad, L. Krishna Rao, K. Venkataratnam, K. Hebbar, M. Sai,and D. Harries. 2001. Spatial Distribution and Quantification of Rice-fallows in South Asia: Potential for Legumes.Hyderabad: ICRISAT. 316pp.
Thenkabail, P. S. 2010. “Global Croplands and their Importance for Water and Food Security in the Twenty-firstCentury: Towards an Ever Green Revolution that Combines a Second Green Revolution with a BlueRevolution.” Remote Sensing 2: 2305–2312.
Thenkabail, P. S., C. M. Biradar, P. Noojipady, V. Dheeravath, Y. Li, M. Velpuri, M. Gumma, et al. 2009b. “GlobalIrrigated Area Map (GIAM), Derived from Remote Sensing, for the End of the Last Millennium.” InternationalJournal of Remote Sensing 30: 3679–3733.
Thenkabail, P., C. Biradar, P. Noojipady, V. Dheeravath, Y. Li, M. Velpuri, M. Gumma, et al. 2009a. “Global IrrigatedArea Map (GIAM) for the End of the Last Millennium Derived from Remote Sensing.” International Journal ofRemote Sensing 30 (14): 3679–3733.
Thenkabail, P. S., C. M. Biradar, P. Noojipady, V. Dheeravath, Y. J. Li, M. Velpuri, G. Reddy, X. Cai, M. Gumma, andH. Turral. 2008. A Global Irrigated Area Map (GIAM) Using Remote Sensing at the End of the Last Millennium.Colombo: International Water Management Institute.
Thenkabail, P., P. Gangadhara Rao, T. Biggs, M. Gumma, and H. Turral. 2007. “Spectral Matching Techniques toDetermine Historical Land-use/land-cover (LULC) and Irrigated Areas Using Time-series 0.1-Degree AVHRRPathfinder Datasets.” Photogrammetric Engineering & Remote Sensing 73: 1029–1040.
Thenkabail, P. S., J. W. Knox, M. Ozdogan, M. K. Gumma, R. G. Congalton, Z. Wu, C. Milesi, A. Finkral, M. Marshall,and I. Mariotto. 2012. “Assessing Future Risks to Agricultural Productivity, Water Resources and Food Security:How can Remote Sensing Help?.” Photogrammetric Engineering and Remote Sensing 78: 773–782.
Thenkabail, P. S., M. Schull, and H. Turral. 2005. “Ganges and Indus River Basin Land Use/Land Cover (LULC) andIrrigated Area Mapping Using Continuous Streams of MODIS Data.” Remote Sensing of Environment 95: 317–341.
Thiruvengadachari, S., and R. Sakthivadivel. 1997. Satellite Remote Sensing for Assessment of Irrigation SystemPerformance: A Case Study in India. Research Report 9. Colombo: International Irrigation Management Institute.
Tilman, D. 1999. “Global Environmental Impacts of Agricultural Expansion: The Need for Sustainable and EfficientPractices.” Proceedings of the National Academy of Sciences 96: 5995–6000.
Tilman, D., K. G. Cassman, P. A. Matson, R. Naylor, and S. Polasky. 2002. “Agricultural Sustainability and IntensiveProduction Practices.” Nature 418: 671–677.
USDA. 2010. United States Department of Agriculture. Foreign Agricultural Service. Accessed May 21, 2015. www.fas.usda.gov/psdonline/.
Velpuri, N. M., P. S. Thenkabail, M. K. Gumma, C. B. Biradar, P. Noojipady, V. Dheeravath, and L. Yuanjie. 2009.“Influence of Resolution in Irrigated Area Mapping and Area Estimations.” Photogrammetric Engineering &Remote Sensing 75: 1383–1395.
World Bank. 2015. PovcalNet. Accessed May 25, 2015. http://iresearch.worldbank.org/PovcalNet/povcalNet.html.Xu, C.-Y., L. Gong, T. Jiang, D. Chen, and V. Singh. 2006. “Analysis of Spatial Distribution and Temporal Trend of
Reference Evapotranspiration and Pan Evaporation in Changjiang (Yangtze River) Catchment.” Journal ofHydrology 327: 81–93.
Zheng, B., S. W. Myint, P. S. Thenkabail, and R. M. Aggarwal. 2015. “A Support Vector Machine to Identify IrrigatedCrop Types Using Time-series Landsat NDVI Data.” International Journal of Applied Earth Observation andGeoinformation 34: 103–112.
INTERNATIONAL JOURNAL OF DIGITAL EARTH 1003