Embed Size (px)
Citation preview

Using Measurement to Guide
Colonoscopy Quality Improvement
New York City Department of Health and Mental Hygiene
New York Citywide Colon Cancer Control Coalition

About This Presentation
• Audience
Gastroenterologists and trainees
Allied health professionals specializing in endoscopy
• Objective
Engage physicians and staff in a conversation about
measuring colonoscopy quality improvement (QI)

Why Measure?
• Identify gaps in care
• Set practice performance goals and track progress
• Track and inform improvements in practices, processes,
outcomes, and the system as a whole
• Learn during Plan-Do-Study-Act (PDSA) cycles
• Participate in value-based incentive programs for quality
of care (e.g., Merit-based Incentive Payment System
[MIPS])

Measures and Best Practices:
Selecting Measures
• Select measures that are well-defined and linked to
evidence-based practice
• Focus on measures that reveal gaps
Select a balanced set of measures to ensure the whole
system is improved
• Define each of the measures:
Numerator and denominator; inclusions and
exclusions; reporting frequency, reporting period
• Whenever possible, use data from the system to obtain
measures:
Existing admin, clinical and patient experience data

Measures and Best Practices:
Data Quality
• Establish expectations for data quality (content and
frequency) and ensure data collection is captured
accordingly
• Perform routine quality assurance checks to identify any
problems with data collection/entry and data
upload/transfer
• Examine for completeness (e.g., track the amount of
missing pathology)
• Ensure that documentation and other information
systems collect accurate and complete information
required for measures of interest

Measures and Best Practices:
Making Sense of the Data
• Begin reporting measures immediately
• Review data at least quarterly
• Examples of how to use data:
Display data over time using run charts rather than looking at
a single point in time or a data table
Examine results to understand:
What is the practice and provider volume (sample size)?
What is the disease course?
What are the patient characteristics?
Run simple bivariate analyses to examine relationships
between measures (e.g., ADR and adequate bowel
preparation rate)

Measures and Best Practices:
Reporting
• Use measurement constructively
• Acknowledge context when
interpreting data
• Provide comparison data within
the practice as well as local and
national data sets. Compare to
both averages and the highest
performing providers
Measures and Best Practices:
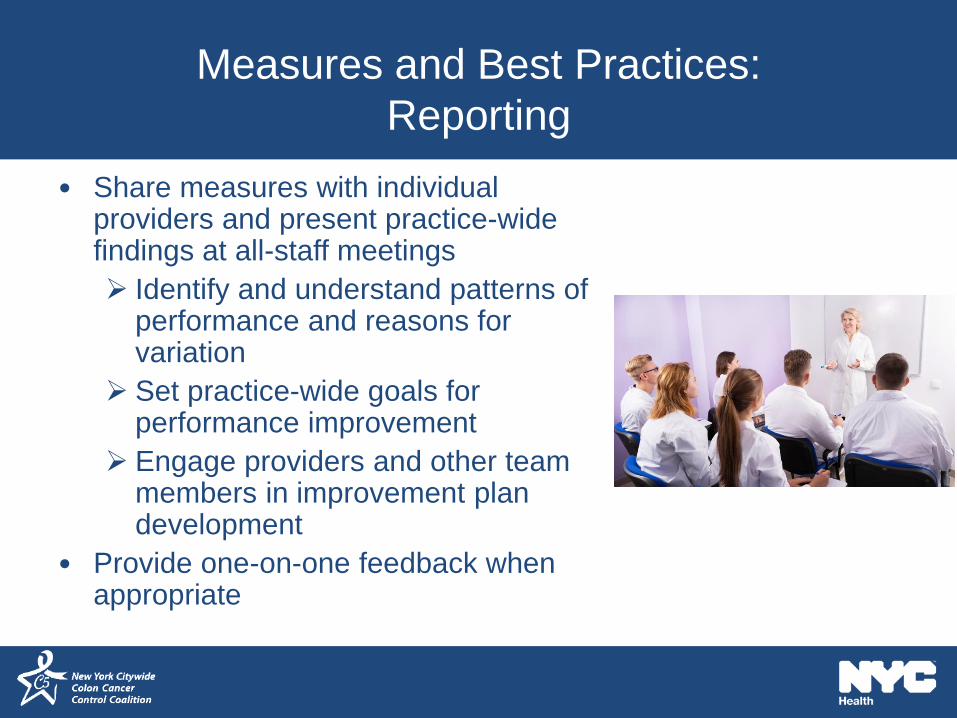
Reporting
• Share measures with individual providers and present practice-wide findings at all-staff meetings
Identify and understand patterns of performance and reasons for variation
Set practice-wide goals for performance improvement
Engage providers and other team members in improvement plan development
• Provide one-on-one feedback when appropriate

Indicators of a High Quality Screening
Colonoscopy Program
• Preparation
Adequate bowel preparation rate ≥ 85%
• Procedure
Adenoma Detection Rate (ADR) ≥ 25%
≥ 30% in men
≥ 20% in women
Cecal intubation with photography rate
≥ 95%
• Follow-up
Interval between screening
colonoscopies is 10 years after a
normal examination
Rex DK, et al. Gastrointestinal Endoscopy. 81:31-53. 2015.

Adequate Bowel Preparation
• Definition: Cleansing the colon judged either adequate or inadequate.
Adequate bowel preparation is defined as a colon where the examiner is
able to identify polyps of > 5 mm.
• Rationale: Colon cleansing is critical for the efficacy of colonoscopy.
Inadequate bowel preparation can prevent endoscopists from reaching the
cecum and identifying adenomas. This can lead to repeat colonoscopy or a
short follow-up interval.
• Recommended by: American Society for Gastrointestinal Endoscopy
(ASGE) / American College of Gastroenterology (ACG) Task Force, 2015;
U.S. Multi-Society Task Force, 2014
• Target: Bowel preparation should be deemed adequate in ≥ 85% of
colonoscopies.
• Suggested frequency: Quarterly (or monthly if sufficient volume)
• Minimum sample size: 20
• Data quality concerns: Ambiguous reporting (e.g., “fair” preparation)

Adequate Bowel Preparation:
Practice-Level
• Chart your practice’s percent adequate bowel prep over time
• Compare to the 85% national target
70
75
80
85
90
95
100
% A
de
qu
ate
Bo
we
l P
rep
ara
tio
n
85% National Target
Data is for illustrative purposes only and does not represent actual patients or providers.

Adequate Bowel Preparation Measurement
• Adequacy of bowel
preparation and follow-
up intervals
• Adequacy of bowel
preparation and ADR

Adenoma Detection Rates (ADR)
• Definition: The ADR is the proportion of patients aged ≥ 50 years
undergoing a complete screening colonoscopy who have one or more
adenomas detected.
• Rationale: ADR has emerged as a critical measure of a high-quality
endoscopist. As ADR increases above 20%, the risk of subsequent CRC
decreases.
• Recommended by: ACG/ASGE Quality Task Force 2014 Screening
Colonoscopy
• Target: ≥ 30% ADR for all men, ≥ 20% ADR for all women
• Suggested frequency: Quarterly (or monthly if sufficient volume)
• Minimum sample size: Assessment of ADR improvement particularly at the
endoscopist level depends on a large enough sample size to stabilize the
volatility of the ADR point estimates. Recommend at least > 25 charts.

Adenoma Detection Rates:
Data Quality Concerns
• “Missing” pathology results:
Complete pathology results are necessary to
calculate accurate ADRs
• To ensure high data quality, design and implement
systematic workflow for:
Collection of pathology report
Review and approval of reports by individual
endoscopists
Entry of pathology results into an endowriter or
electronic report writer

Adenoma Detection Rates:
Practice-Level Pooled Patient ADR
• Report individual physician’s pooled ADR for all patients
• Compare to the ADR target of > 25%
0
10
20
30
40
50
AD
R (
%)
Physician
Pooled ADR Target of 25%
Data is for illustrative purposes only and does not represent actual patients or providers.

Adenoma Detection Rates:
Practice-Level Monthly ADR
• Report pooled physician ADR data over time
• Compare your practice trend to the > 25% target
0
10
20
30
40
50
June July August September October November
AD
R (
%)
Pooled ADR Target of 25%
Data is for illustrative purposes only and does not represent actual patients or providers.

Adenoma Detection Rates:
Practice-Level Monthly ADR
• Show physicians exceeding or not reaching ADR targets
0
10
20
30
40
50
June July August September October November
AD
R (
%)
Physicians Not Reaching ADR Target Physicians Reaching ADR Target
Pooled ADR Target of 25%
Data is for illustrative purposes only and does not represent actual patients or providers.

Adenoma Detection Rates:
Corley Quintiles
• Group providers into quintiles of ADR (“+” represents one provider)
• Inform providers into which quintile their ADR falls
Adopted from: Corley DA, et al. New England Journal of Medicine. 370:1298-1306. 2014. Data is for illustrative purposes only and does not
represent actual patients or providers.

Adenoma Detection Rates:
Corley Quintiles
Physician QuintileP1745 5P1876 5
P1457 5P1436 4
P1897 4P1784 4
P1889 4P1783 4P1493 3
P1481 3P1124 2
P1648 2P1781 2
P1964 2P1145 1P1258 1
Overall ADR
Highest
Lowest
Data is for illustrative purposes only and does not represent actual patients or providers.

Cecal Intubation With
Photo Documentation Rate
• Definition: Cecal intubation is defined as passage of the colonoscope tip to a
point proximal to the ileocecal valve so that the entire cecal caput, including the
medial wall of the cecum between the ileocecal valve and appendiceal orifice, is
visible.
• Rationale: Successful cecal intubation with photo documentation is critical to
successful colonoscopy. Incomplete examination of the colon is significantly
associated with missed adenoma.
• Recommended by: American Society for Gastrointestinal Endoscopy
(ASGE)/American College of Gastroenterology (ACG) Task Force, 2015
• Target: Nationally, gastroenterologists are expected to reach the cecum in 95%
of cases of screening colonoscopies and 90% of all colonoscopies.
• Suggested frequency: Quarterly (or monthly if sufficient volume)
• Minimum sample size: 20
• Data quality concerns: Examinations in which cecal intubation was not
intended (e.g., therapeutic colonoscopy to remove a previously-identified polyp)
should be excluded from the denominator.

Cecal Intubation Rates:
Practice-Level
• Chart your practice-level cecal intubation with photo
documentation over time
• Compare to the 95% target for screening colonoscopy
50
60
70
80
90
100
Ce
ca
l In
tub
atio
n (
%)
95% National Target
Data is for illustrative purposes only and does not represent actual patients or providers.

Colonoscopy Follow-up Intervals
• Definition: Recommended follow-up colonoscopy at 10-year intervals
between screening colonoscopies in average-risk patients who have negative
examination results and adequate bowel cleansing
• Rationale: Colonoscopic screening is recommended in all current guidelines
at 10-year intervals, based on the adenoma-to-carcinoma progression and the
established duration of the protective effect of colonoscopy
• Recommended by: American Society for Gastrointestinal Endoscopy
(ASGE)/American College of Gastroenterology (ACG) Task Force, 2016
• Target: Following appropriate 10-year follow-up intervals is ≥ 90% for all
screening negative colonoscopy
• Suggested frequency: Quarterly (or monthly if sufficient volume)
• Minimum sample size: 20
• Data Quality Concerns: Identifying examinations that should be excluded
from the denominator (e.g., non-screening examinations, inadequate bowel
preparation, high-risk patients)

Follow-Up Interval:
Practice-Level
• Chart your pooled practice level follow-up interval for screening
colonoscopy over time
• Target is a 10-year follow-up interval
• Include only the interval for negative screening colonoscopies
0
20
40
60
80
100
March April May June July August September October
10-y
ea
r F
ollo
w U
p R
ate
(%
)
80% Practice-Level Target
Data is for illustrative purposes only and does not represent actual patients or providers.

Conclusions
• Measurement is essential to:
Identify gaps in care
Set practice performance
goals
Guide improvement work
Track improvements in
practices and outcomes
Participate in pay-for-
reporting and -performance
programs
24
References
1. Rex DK, Schoenfeld PS, Cohen J, et al. Quality indicators for colonoscopy.
Gastrointestinal Endoscopy. 2015;81(1):31-53.
2. Corley DA, Jensen CD, Marks AR, et al. Adenoma Detection Rate and Risk of
Colorectal Cancer and Death. New England Journal of Medicine. 2014;370(14):1298-
1306.


![Bowel Elimination Si.ppt [Read-Only] - ocw.usu.ac.idocw.usu.ac.id/.../kdm_slide_bowel_elimination.pdfPrimary organ of bowel elimination ... Small bowel series Barium enema. ... Sigmoid](https://img.dokumen.tips/doc/110x75/5adf17e77f8b9ac0428bbfc8/bowel-elimination-sippt-read-only-ocwusuacidocwusuacidkdmslidebowel.jpg)