Embed Size (px)
Citation preview

7/21/2019 Using Mass Spectrometry for Drug Metabolism Studies
http://slidepdf.com/reader/full/using-mass-spectrometry-for-drug-metabolism-studies 1/362
EDITED BY
Walter A. Korfmacher
USING
MASS SPECTROMETRYFOR
DRUG METABOLISM
STUDIES
CRC PRESS
Boca Raton London New York Washington, D.C.
Copyright © 2005 CRC Press, LLC
7/21/2019 Using Mass Spectrometry for Drug Metabolism Studies
http://slidepdf.com/reader/full/using-mass-spectrometry-for-drug-metabolism-studies 2/362
This book contains information obtained from authentic and highly regarded sources. Reprinted
material is quoted with permission, and sources are indicated. A wide variety of references are
listed. Reasonable efforts have been made to publish reliable data and information, but the author
and the publisher cannot assume responsibility for the validity of all materials or for the
consequences of their use.
Neither this book nor any part may be reproduced or transmitted in any form or by any means,
electronic or mechanical, including photocopying, microfilming, and recording, or by any
information storage or retrieval system, without prior permission in writing from the publisher.
All rights reserved. Authorization to photocopy items for internal or personal use, or the personal
or internal use of specific clients, may be granted by CRC Press, provided that $1.50 per
page photocopied is paid directly to Copyright Clearance Center, 222 Rosewood Drive,
Danvers, MA 01923 USA. The fee code for users of the Transactional Reporting Service
is ISBN 0-8493-1963-3/04/$0.00+$1.50. The fee is subject to change without notice. For
organizations that have granted a photocopy license by the CCC, a separate system of paymenthas been arranged.
The consent of CRC Press does not extend to copying for general distribution, for promotion, for
creating new works, or for resale. Specific permission must be obtained in writing from CRC Press
for such copying.
Direct all inquiries to CRC Press, 2000 N.W. Corporate Blvd., Boca Raton, Florida 33431.
Trademark Notice: Product or corporate names may be trademarks or registered trademarks,
and are used only for identification and explanation, without intent to infringe.
Visit the CRC Press Web site at www.crcpress.com
2005 by CRC Press
No claim to original U.S. Government works
International Standard Book Number 0-8493-1963-3
Library of Congress Card Number 2004050306
Printed in the United States of America 1 2 3 4 5 6 7 8 9 0
Printed on acid-free paper
Library of Congress Cataloging-in-Publication Data
Using mass spectrometry for drug metabolism studies/edited by Walter A. Korfmacher.
p. cm.
Includes bibliographical references and index.
ISBN 0-8493-1963-3 (alk. paper)
1. Drugs–Metabolism. 2. Drugs–Spectra. 3. Mass spectrometry.
[DNLM: 1. Pharmaceutical Preparations–metabolism. 2. Drug Design. 3. Drug
Evaluation, Preclinical–methods. 4. Spectrum Analysis, Mass–methods.
QV 38 U85 2004]
I. Korfmacher, Walter A. II. Title.
RM301. U85 2004
6150.7–dc22 2004050306
Copyright © 2005 CRC Press, LLC
7/21/2019 Using Mass Spectrometry for Drug Metabolism Studies
http://slidepdf.com/reader/full/using-mass-spectrometry-for-drug-metabolism-studies 3/362
Preface
The impetus for this book came from a combination of factors, but can be
summarized by the statement that we live in exciting times. It is an exciting time
to be a drug metabolism specialist involved in drug discovery efforts and it is
an exciting time for mass spectrometry. I feel fortunate to have been able to liveduring these times and I look forward to what the future holds in store for all
of us.
This book was designed to be a resource book for professionals in both
mass spectrometry and drug metabolism areas, but will also be helpful to
medicinal chemists interested in learning more about drug metabolism issues in
new drug discovery. The chapters were written so that scientists in these fields
could benefit from the state-of-the-art expertise and knowledge that is
contained in each chapter and the references cited by each chapter’s author.
While each chapter was written so that it could be read separately from the
other chapters, I have inserted notes into most of the chapters referring to
another chapter for more information on a given topic.
The book has chapters on general topics as well as specific areas of interest.
There are also specific chapters devoted to newer technology that has more
recently been introduced and appears to have great potential. I would like to
thank all of the authors of these chapters for their efforts and attention to
detail that have allowed this book to become a reality. I also thank Schering-
Plough Research Institute management for their support of this effort. Finally,
I would like to thank my family for their continuing support, especially
Madeleine, my wife.
Walter A. Korfmacher
February 14, 2004
v
Copyright © 2005 CRC Press, LLC

7/21/2019 Using Mass Spectrometry for Drug Metabolism Studies
http://slidepdf.com/reader/full/using-mass-spectrometry-for-drug-metabolism-studies 4/362
Editor
Walter A. Korfmacher, Ph.D.
Dr. Korfmacher is a director of exploratory drug metabolism at Schering-
Plough Research Institute in Kenilworth, New Jersey. He received his B.S. inchemistry degree from St. Louis University in 1973. He then went on to obtain
his M.S. in chemistry in 1975, and Ph.D. in chemistry in 1978, both from the
University of Illinois in Urbana. In 1978, he joined the FDA and was employed
at the National Center for Toxicological Research (NCTR) in Jefferson,
Arkansas. While at the NCTR, he also held adjunct associate professor
positions at the College of Pharmacy in the University of Tennessee (Memphis)
and the Department of Toxicology in the University of Arkansas for Medical
Sciences (Little Rock). After 13 years at the NCTR, Dr. Korfmacher joined
Schering-Plough Research Institute as a principal scientist in October, 1991.
He is currently a Director and the leader for a group of fifteen scientists.
His research interests include the application of mass spectrometry to the
analysis of various sample types, particularly metabolite identification and
trace organic quantitative methodology. His most recent applications are in the
use of HPLC combined with atmospheric pressure ionization mass spectro-
metry and tandem mass spectrometry for both metabolite identification as well
as nanogram/ml quantitative assay development for various pharmaceutical
molecules in plasma. He is also a leader in the field of developing strategies for
the application of new MS techniques for drug metabolism participation in
new drug discovery and is frequently invited to speak at scientific conferences.
In 1999–2000, Dr. Korfmacher was the chairperson of the North Jersey
Mass Spectrometry Discussion Group and in 2002, Dr. Korfmacher received
the New Jersey Regional Award for Achievements in Mass Spectrometry.
Dr. Korfmacher has over 100 publications in the scientific literature and has
made over 75 presentations at various scientific forums.
vii
Copyright © 2005 CRC Press, LLC
7/21/2019 Using Mass Spectrometry for Drug Metabolism Studies
http://slidepdf.com/reader/full/using-mass-spectrometry-for-drug-metabolism-studies 5/362
Contributors
Bradley L. Ackermann, Ph.D.
Senior Research Scientist
Drug Disposition
Eli Lilly and Company
Indianapolis, Indiana
Richard M. Caprioli, Ph.D.
Professor of Biochemistry and
DirectorMass Spectrometry Research Center
Department of Biochemistry
Vanderbilt University
Nashville, Tennessee
Kathleen Cox, Ph.D.
Associate Director
Exploratory Drug Metabolism
Department of Drug Metabolismand Pharmacokinetics
Schering-Plough Research Institute
Kenilworth, New Jersey
Jean-Marie Dethy, MSc.
Senior Scientist
Department of Toxicology and
Drug Metabolism
Lilly Development Center
Mont-Saint-Guibert, Belgium
Ge ´ rard Hopfgartner, Ph.D.
Professor
School of Pharmacy
University of Geneva
Geneva, Switzerland
Yunsheng Hsieh, Ph.D.
Principal Scientist
Exploratory Drug Metabolism
Department of Drug Metabolism
and Pharmacokinetics
Schering-Plough Research InstituteKenilworth, New Jersey
Daniel B. Kassel, Ph.D.
Senior Director
Analytical Discovery &
Development
Syrrx, Inc.
San Diego, California
Walter A. Korfmacher, Ph.D.
Director
Exploratory Drug Metabolism
Department of Drug Metabolism
and Pharmacokinetics
Schering-Plough Research Institute
Kenilworth, New Jersey
Hong Mei, Ph.D.
Associate Principal Scientist
Exploratory Drug Metabolism
Department of Drug Metabolism
and Pharmacokinetics
ix
Copyright © 2005 CRC Press, LLC
7/21/2019 Using Mass Spectrometry for Drug Metabolism Studies
http://slidepdf.com/reader/full/using-mass-spectrometry-for-drug-metabolism-studies 6/362
Schering-Plough Research Institute
Kenilworth, New Jersey
Michelle L. Reyzer, Ph.D.Research Fellow
Department of Biochemistry
Vanderbilt University
Nashville, Tennessee
Thomas N. Thompson, Ph.D.
Consultant
12328 Noland
Overland Park, Kansas
Sam Wainhaus, Ph.D.
Associate Principal Scientist
Exploratory Drug Metabolism
Department of Drug Metabolism
and Pharmacokinetics
Schering-Plough Research Institute
Kenilworth, New Jersey
Xiaoying Xu, Ph.D.
Associate Principal Scientist
Exploratory Drug Metabolism
Department of Drug Metabolism
and Pharmacokinetics
Schering-Plough Research Institute
Kenilworth, New Jersey
Manfred Zell
Senior Scientist
F. Hoffmann-La Roche, Ltd.
Basel, Switzerland
x Contributors
Copyright © 2005 CRC Press, LLC

7/21/2019 Using Mass Spectrometry for Drug Metabolism Studies
http://slidepdf.com/reader/full/using-mass-spectrometry-for-drug-metabolism-studies 7/362
Contents
Chapter 1 Bioanalytical Assays in a Drug Discovery Environment 1
Walter A. Korfmacher, Ph.D.
Chapter 2 Drug Metabolism In Vitro and In Vivo Results: How
do these Data Support Drug Discovery? 35
Thomas N. Thompson, Ph.D.
Chapter 3 High Throughput Strategies for In Vitro
ADME Assays: How Fast Can We Go? 83Daniel B. Kassel, Ph.D.
Chapter 4 Matrix Effects: Causes and Solutions 103
Hong Mei, Ph.D.
Chapter 5 Direct Plasma Analysis Systems 151
Yunsheng Hsieh, Ph.D.
Chapter 6 Acyl Glucuronides: Assays and Issues 175
Sam Wainhaus, Ph.D.
Chapter 7 Utilizing Higher Mass Resolution in Quantitative Assays 203
Xiaoying Xu, Ph.D.
Chapter 8 Special Requirements for Metabolite Characterization 229
Kathleen Cox, Ph.D.
Chapter 9 APPI: A New Ionization Source for LC and MS/MS
Assays 253
Yunsheng Hsieh, Ph.D.
xi
Copyright © 2005 CRC Press, LLC

7/21/2019 Using Mass Spectrometry for Drug Metabolism Studies
http://slidepdf.com/reader/full/using-mass-spectrometry-for-drug-metabolism-studies 8/362
Chapter 10 Q Trap MS: A New Tool for Metabolite Identification 277
Ge ´ rard Hopfgartner, Ph.D. and Manfred Zell
Chapter 11 MS Imaging: New Technology ProvidesNew Opportunities 305
Michelle L. Reyzer, Ph.D. and Richard M. Caprioli, Ph.D.
Chapter 12 Understanding the Role and Potential of Infusion
Nanoelectrospray Ionization for Pharmaceutical
Bioanalysis 329
Bradley L. Ackermann, Ph.D. and
Jean-Marie Dethy, MSc.
xii Contents
Copyright © 2005 CRC Press, LLC

7/21/2019 Using Mass Spectrometry for Drug Metabolism Studies
http://slidepdf.com/reader/full/using-mass-spectrometry-for-drug-metabolism-studies 9/362
Chapter 1
Bioanalytical Assays in a DrugDiscovery Environment
Walter A. Korfmacher
1.1 Introduction
The challenge of working in the pharmaceutical industry during this time of
rapid expansion of our knowledge of the causes and potential cures for many
diseases is both exciting and formidable. It is exciting because we are now
learning how to make potent drugs that can target specific receptors in order to
relieve symptoms or block the progression of a disease. It is formidable becausethe number of potential targets is large and the size of our chemical libraries
that need to be screened against these targets is in the millions and growing
even larger. While ultra-high throughput screening effectively reduces these
numbers by screening out the inactive compounds, the numbers of compounds
that need to be screened through drug metabolism studies can still be
overwhelming.
As shown in Figure 1.1, the amount of effort in terms of compound
screening, lead optimization and attrition is a daunting task. Of the two million
compounds that might be screened for activity, perhaps 10,000 are selected and
optimized in the drug discovery stage. Next, 20 compounds might be selected
for development and five of these may survive the toxicity testing and be
suitable for phase I clinical screening. At current rates of success, one of the
five compounds would become an approved drug. In a 2003 report by the
0-8493-1963-3/05/$0.00+$1.50 2005 by CRC Press 1
Copyright © 2005 CRC Press, LLC

7/21/2019 Using Mass Spectrometry for Drug Metabolism Studies
http://slidepdf.com/reader/full/using-mass-spectrometry-for-drug-metabolism-studies 10/362
Tufts Center for the Study of Drug Development, the cost of bringing a new
drug to market was estimated to be $897 million [1]. By the time this book is
published, the average cost may well be $1 billion or more.Over the last 12–15 years, mass spectrometry (MS) has played an
increasingly important role in all phases of drug discovery and drug devel-
opment. In that same time, mass spectrometry has undergone tremendous
changes. Mass spectrometers have become more sensitive, easier to use and
have been applied to multiple areas of drug metabolism activity. At the same
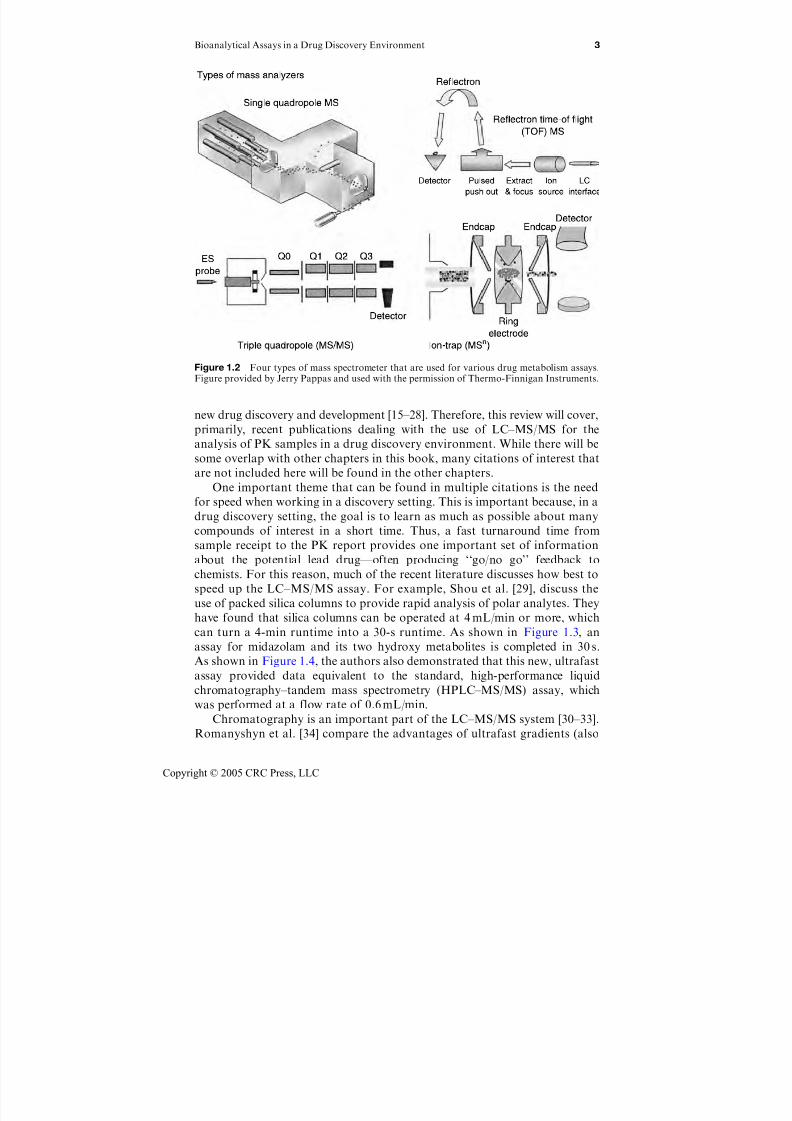
time, new types of mass spectrometers have been introduced. Figure 1.2 shows
four of the most widely used types of mass spectrometers; of these four types,
the triple quadrupole mass spectrometer (QqQ MS) has become the ‘‘gold
standard’’ for quantitative assays in the drug metabolism arena. The focus
of this chapter will be on the use of liquid chromatography combined with
tandem mass spectrometry (LC–MS/MS) for drug metabolism participation
in new drug discovery, specifically in support of in vivo pharmacokinetic (PK)
screens and studies.
1.2 Review of Recent Literature
While medicinal chemists will continue to search for in silico programs and
in vitro (for more details on in vitro assays, see Chapter 3) techniques to predict
animal and human pharmacokinetics [2–12], the need to obtain experimental
PK data from laboratory animals early in the discovery paradigm is still
paramount [4, 13–15] (for more details on how to use PK data, see Chapter 2).
Several review articles have been published in the last few years on the use of
mass spectrometry when assaying samples from in vivo PK studies in support of
Figure 1.1 Schematic chart showing the compound attrition in drug discovery to developmentto drug approval. The X axis is the stage or point in the process. The Y axis is the number of compounds at that point.
2 Using Mass Spectrometry for Drug Metabolism Studies
Copyright © 2005 CRC Press, LLC
7/21/2019 Using Mass Spectrometry for Drug Metabolism Studies
http://slidepdf.com/reader/full/using-mass-spectrometry-for-drug-metabolism-studies 11/362
new drug discovery and development [15–28]. Therefore, this review will cover,
primarily, recent publications dealing with the use of LC–MS/MS for the
analysis of PK samples in a drug discovery environment. While there will be
some overlap with other chapters in this book, many citations of interest that
are not included here will be found in the other chapters.
One important theme that can be found in multiple citations is the need
for speed when working in a discovery setting. This is important because, in a
drug discovery setting, the goal is to learn as much as possible about many
compounds of interest in a short time. Thus, a fast turnaround time from
sample receipt to the PK report provides one important set of information
about the potential lead drug—often producing ‘‘go/no go’’ feedback to
chemists. For this reason, much of the recent literature discusses how best to
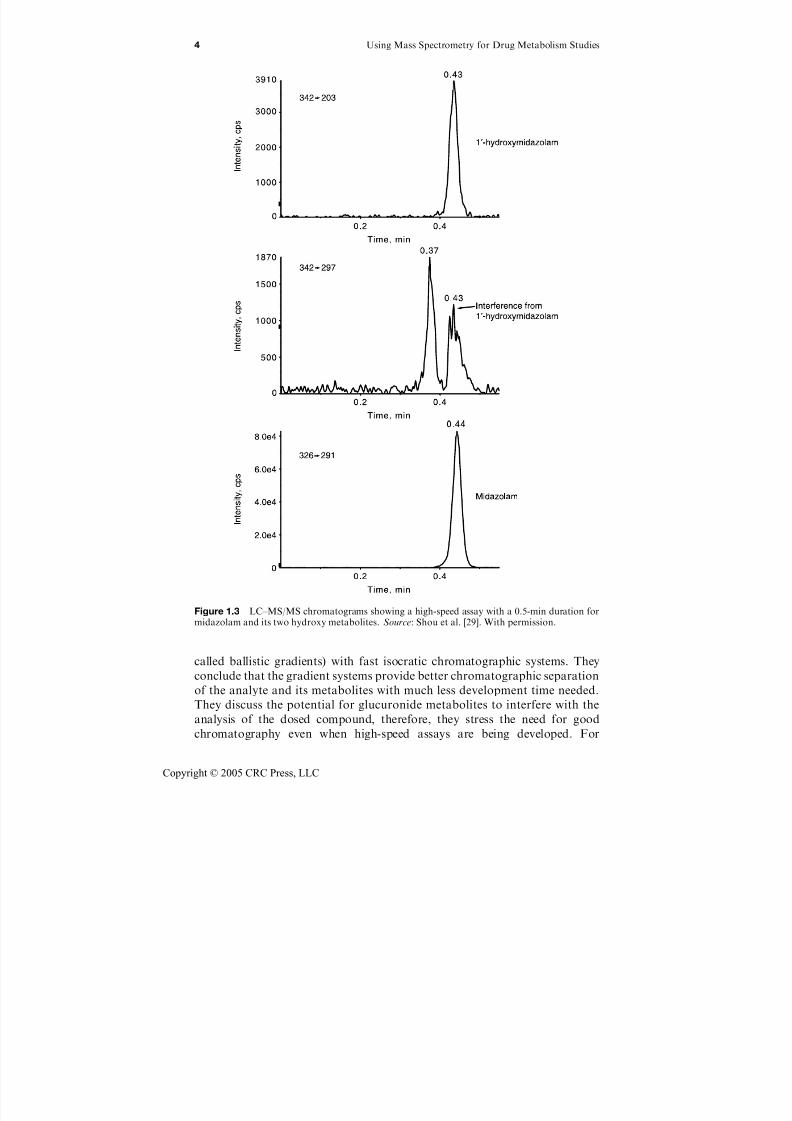
speed up the LC–MS/MS assay. For example, Shou et al. [29], discuss the
use of packed silica columns to provide rapid analysis of polar analytes. They
have found that silica columns can be operated at 4 mL/min or more, which
can turn a 4-min runtime into a 30-s runtime. As shown in Figure 1.3, an
assay for midazolam and its two hydroxy metabolites is completed in 30 s.
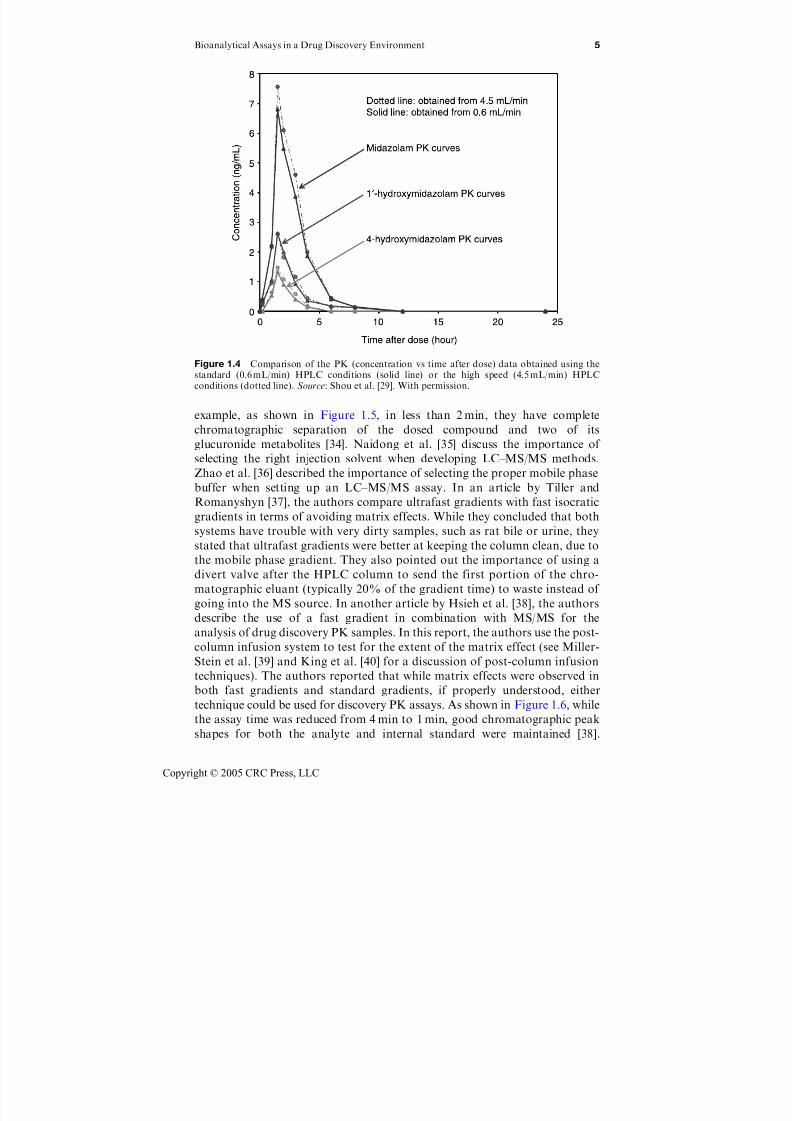
As shown in Figure 1.4, the authors also demonstrated that this new, ultrafast
assay provided data equivalent to the standard, high-performance liquid
chromatography–tandem mass spectrometry (HPLC–MS/MS) assay, which
was performed at a flow rate of 0.6 mL/min.
Chromatography is an important part of the LC–MS/MS system [30–33].
Romanyshyn et al. [34] compare the advantages of ultrafast gradients (also
Figure 1.2 Four types of mass spectrometer that are used for various drug metabolism assays.Figure provided by Jerry Pappas and used with the permission of Thermo-Finnigan Instruments.
Bioanalytical Assays in a Drug Discovery Environment 3
Copyright © 2005 CRC Press, LLC
7/21/2019 Using Mass Spectrometry for Drug Metabolism Studies
http://slidepdf.com/reader/full/using-mass-spectrometry-for-drug-metabolism-studies 12/362
called ballistic gradients) with fast isocratic chromatographic systems. They
conclude that the gradient systems provide better chromatographic separation
of the analyte and its metabolites with much less development time needed.
They discuss the potential for glucuronide metabolites to interfere with the
analysis of the dosed compound, therefore, they stress the need for good
chromatography even when high-speed assays are being developed. For
Figure 1.3 LC–MS/MS chromatograms showing a high-speed assay with a 0.5-min duration formidazolam and its two hydroxy metabolites. Source: Shou et al. [29]. With permission.
4 Using Mass Spectrometry for Drug Metabolism Studies
Copyright © 2005 CRC Press, LLC
7/21/2019 Using Mass Spectrometry for Drug Metabolism Studies
http://slidepdf.com/reader/full/using-mass-spectrometry-for-drug-metabolism-studies 13/362
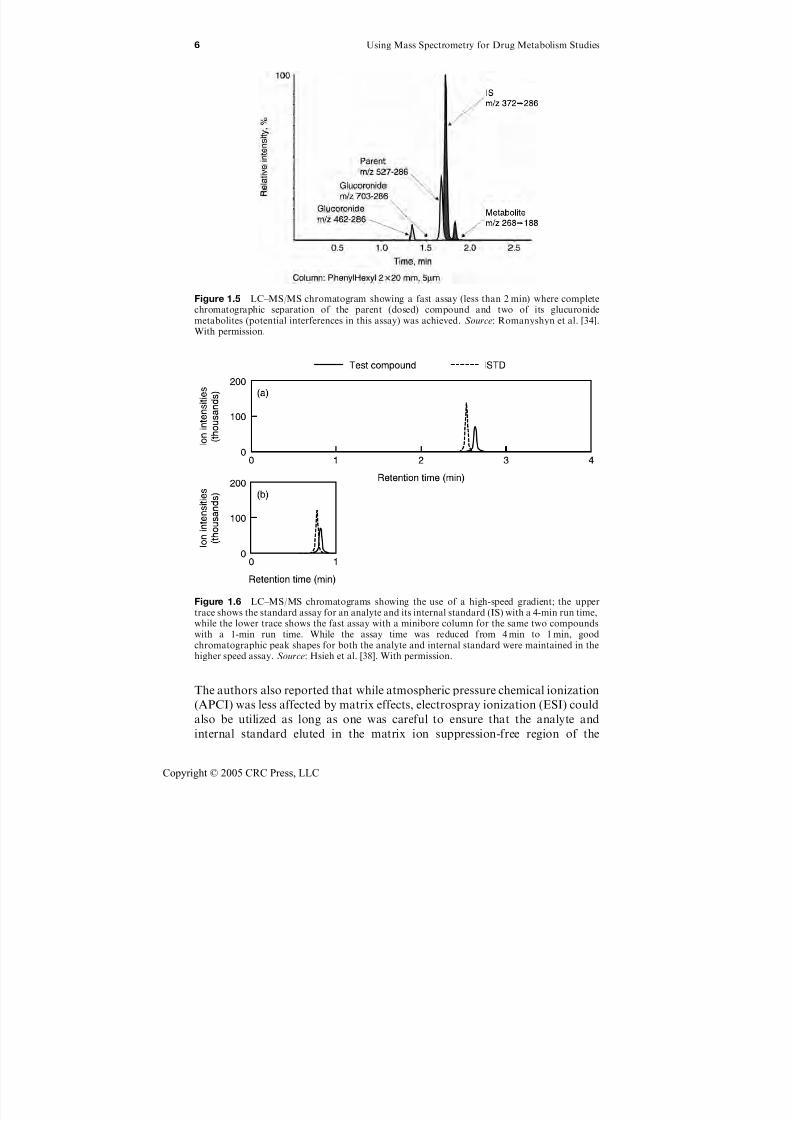
example, as shown in Figure 1.5, in less than 2 min, they have complete
chromatographic separation of the dosed compound and two of its
glucuronide metabolites [34]. Naidong et al. [35] discuss the importance of
selecting the right injection solvent when developing LC–MS/MS methods.
Zhao et al. [36] described the importance of selecting the proper mobile phase
buffer when setting up an LC–MS/MS assay. In an article by Tiller and
Romanyshyn [37], the authors compare ultrafast gradients with fast isocratic
gradients in terms of avoiding matrix effects. While they concluded that both
systems have trouble with very dirty samples, such as rat bile or urine, they
stated that ultrafast gradients were better at keeping the column clean, due to
the mobile phase gradient. They also pointed out the importance of using a
divert valve after the HPLC column to send the first portion of the chro-
matographic eluant (typically 20% of the gradient time) to waste instead of
going into the MS source. In another article by Hsieh et al. [38], the authors
describe the use of a fast gradient in combination with MS/MS for the
analysis of drug discovery PK samples. In this report, the authors use the post-
column infusion system to test for the extent of the matrix effect (see Miller-
Stein et al. [39] and King et al. [40] for a discussion of post-column infusion
techniques). The authors reported that while matrix effects were observed in
both fast gradients and standard gradients, if properly understood, either
technique could be used for discovery PK assays. As shown in Figure 1.6, while
the assay time was reduced from 4 min to 1 min, good chromatographic peak
shapes for both the analyte and internal standard were maintained [38].
Figure 1.4 Comparison of the PK (concentration vs time after dose) data obtained using thestandard (0.6 mL/min) HPLC conditions (solid line) or the high speed (4.5 mL/min) HPLC
conditions (dotted line). Source: Shou et al. [29]. With permission.
Bioanalytical Assays in a Drug Discovery Environment 5
Copyright © 2005 CRC Press, LLC
7/21/2019 Using Mass Spectrometry for Drug Metabolism Studies
http://slidepdf.com/reader/full/using-mass-spectrometry-for-drug-metabolism-studies 14/362
The authors also reported that while atmospheric pressure chemical ionization
(APCI) was less affected by matrix effects, electrospray ionization (ESI) could
also be utilized as long as one was careful to ensure that the analyte and
internal standard eluted in the matrix ion suppression-free region of the
Figure 1.6 LC–MS/MS chromatograms showing the use of a high-speed gradient; the uppertrace shows the standard assay for an analyte and its internal standard (IS) with a 4-min run time,while the lower trace shows the fast assay with a minibore column for the same two compoundswith a 1-min run time. While the assay time was reduced from 4 min to 1 min, goodchromatographic peak shapes for both the analyte and internal standard were maintained in thehigher speed assay. Source: Hsieh et al. [38]. With permission.
Figure 1.5 LC–MS/MS chromatogram showing a fast assay (less than 2 min) where completechromatographic separation of the parent (dosed) compound and two of its glucuronidemetabolites (potential interferences in this assay) was achieved. Source: Romanyshyn et al. [34].With permission.
6 Using Mass Spectrometry for Drug Metabolism Studies
Copyright © 2005 CRC Press, LLC

7/21/2019 Using Mass Spectrometry for Drug Metabolism Studies
http://slidepdf.com/reader/full/using-mass-spectrometry-for-drug-metabolism-studies 15/362
chromatogram (see Chapter 4 for more information on this topic). As a final
test that either ESI or APCI could be used in the fast gradient mode, results
were compared from a monkey i.v./p.o. PK study for a discovery compound
when the samples were assayed by a standard gradient and a fast gradient (with
a minibore column) using either APCI or ESI. As shown in Figure 1.7, this
four-way comparison resulted in very similar data being produced by each
assay methodology.
Another approach for speeding assay throughput has been the use of
parallel HPLC columns feeding into one MS/MS system [41–48]. For example,
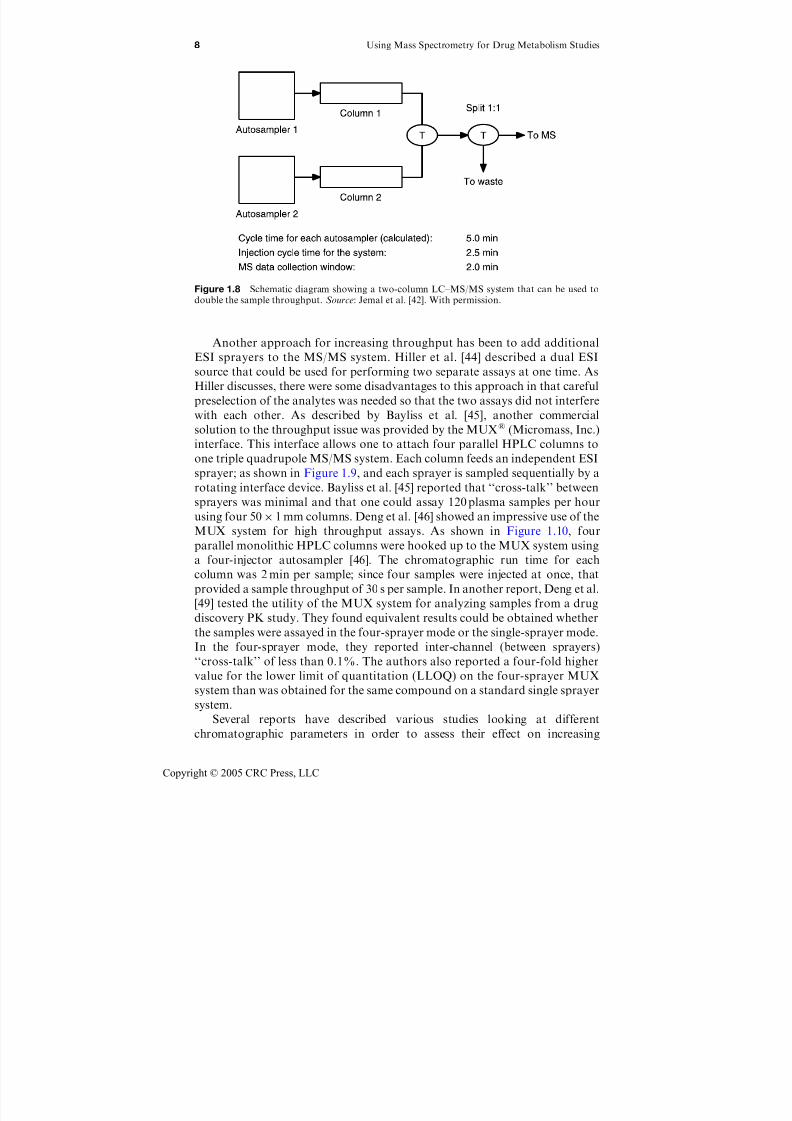
Jemal et al. [42] showed that by connecting two parallel HPLC systems with a
‘‘T’’, one could double the throughput of an assay simply by staggering the
injection times of the samples. Their two-column system, as shown in
Figure 1.8, was able to reduce the sample assay times from 5 min per sample
to 2.5 min per sample, using this procedure [42]. This concept has been
commercialized in the development of the Aria LX4 (Cohesive Technologies)
system, which was described and tested by King et al. [43] In this system, four
HPLC pumps, a specialty autosampler and various switching valves are all
under the control of a single computer which has software to determine the
timing of all the events so that a minimum amount of the MS acquisition time
is needed for each sample that is injected. The result is an increase in sample
throughput, while maintaining good chromatographic conditions for each
sample.
Figure 1.7 Comparison of the PK (concentration vs time after dose) data obtained using thestandard HPLC conditions or the high speed gradient (minibore) conditions shown in Figure 1.6.The assay was performed in each case with an APCI source and an ESI source. For the data setlabeled A, the samples were from a monkey PK study dosed using a 20% hydroxypropyl-betacyclodextrin (HPBCD) formulation. For the data set labeled B, the samples were from amonkey PK study dosed with the same compound but with a 0.4% methylcellulose (MC)formulation. Source: Hsieh et al. [38]. With permission.
Bioanalytical Assays in a Drug Discovery Environment 7
Copyright © 2005 CRC Press, LLC
7/21/2019 Using Mass Spectrometry for Drug Metabolism Studies
http://slidepdf.com/reader/full/using-mass-spectrometry-for-drug-metabolism-studies 16/362
Another approach for increasing throughput has been to add additional
ESI sprayers to the MS/MS system. Hiller et al. [44] described a dual ESI
source that could be used for performing two separate assays at one time. As
Hiller discusses, there were some disadvantages to this approach in that carefulpreselection of the analytes was needed so that the two assays did not interfere
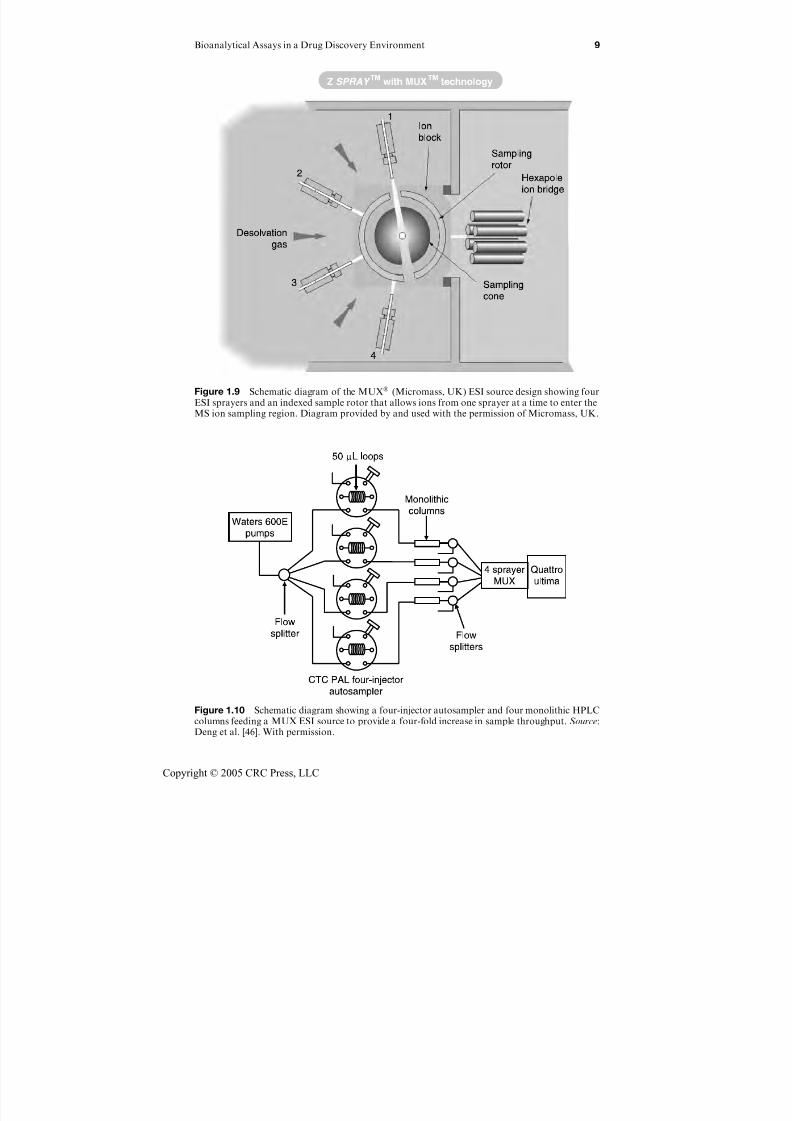
with each other. As described by Bayliss et al. [45], another commercial
solution to the throughput issue was provided by the MUX (Micromass, Inc.)
interface. This interface allows one to attach four parallel HPLC columns to
one triple quadrupole MS/MS system. Each column feeds an independent ESI
sprayer; as shown in Figure 1.9, and each sprayer is sampled sequentially by a
rotating interface device. Bayliss et al. [45] reported that ‘‘cross-talk’’ between
sprayers was minimal and that one could assay 120 plasma samples per hour
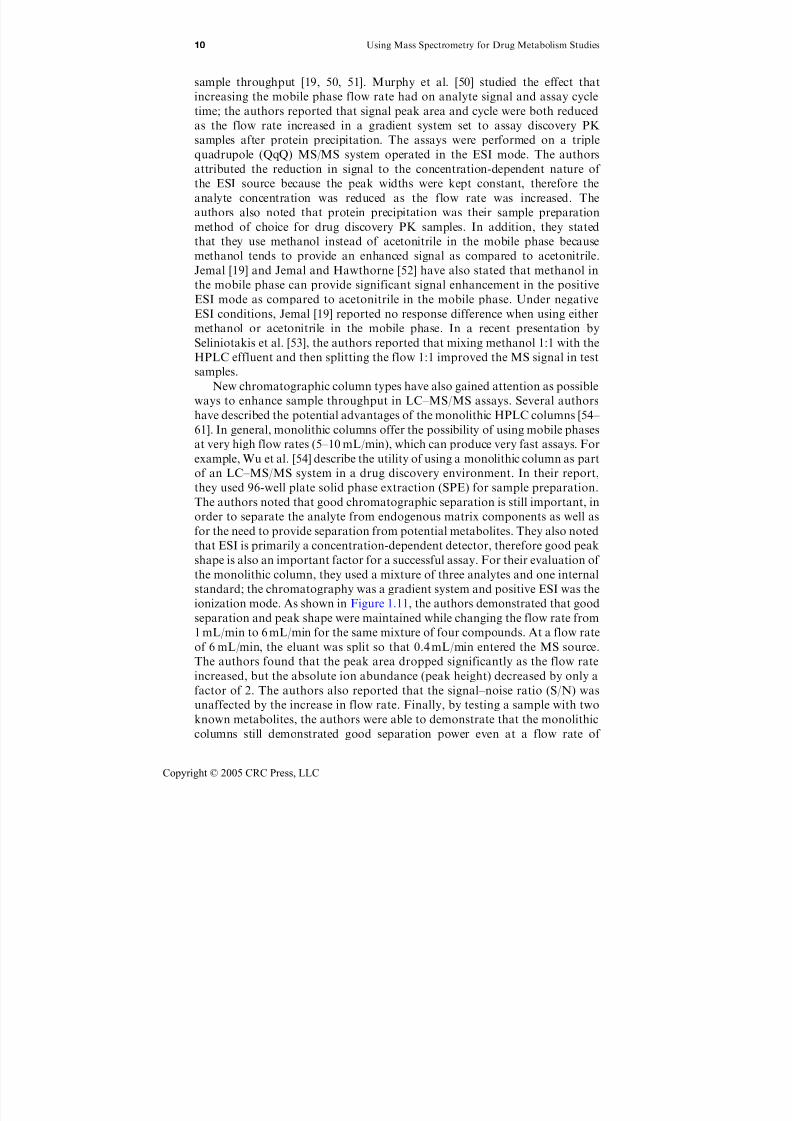
using four 50 1 mm columns. Deng et al. [46] showed an impressive use of the
MUX system for high throughput assays. As shown in Figure 1.10, four
parallel monolithic HPLC columns were hooked up to the MUX system using
a four-injector autosampler [46]. The chromatographic run time for each
column was 2 min per sample; since four samples were injected at once, that
provided a sample throughput of 30 s per sample. In another report, Deng et al.
[49] tested the utility of the MUX system for analyzing samples from a drug
discovery PK study. They found equivalent results could be obtained whether
the samples were assayed in the four-sprayer mode or the single-sprayer mode.
In the four-sprayer mode, they reported inter-channel (between sprayers)
‘‘cross-talk’’ of less than 0.1%. The authors also reported a four-fold higher
value for the lower limit of quantitation (LLOQ) on the four-sprayer MUX
system than was obtained for the same compound on a standard single sprayer
system.
Several reports have described various studies looking at different
chromatographic parameters in order to assess their effect on increasing
TT
Figure 1.8 Schematic diagram showing a two-column LC–MS/MS system that can be used todouble the sample throughput. Source: Jemal et al. [42]. With permission.
8 Using Mass Spectrometry for Drug Metabolism Studies
Copyright © 2005 CRC Press, LLC
7/21/2019 Using Mass Spectrometry for Drug Metabolism Studies
http://slidepdf.com/reader/full/using-mass-spectrometry-for-drug-metabolism-studies 17/362
Figure 1.9 Schematic diagram of the MUX (Micromass, UK) ESI source design showing fourESI sprayers and an indexed sample rotor that allows ions from one sprayer at a time to enter theMS ion sampling region. Diagram provided by and used with the permission of Micromass, UK.
Figure 1.10 Schematic diagram showing a four-injector autosampler and four monolithic HPLCcolumns feeding a MUX ESI source to provide a four-fold increase in sample throughput. Source:Deng et al. [46]. With permission.
Bioanalytical Assays in a Drug Discovery Environment 9
Copyright © 2005 CRC Press, LLC
7/21/2019 Using Mass Spectrometry for Drug Metabolism Studies
http://slidepdf.com/reader/full/using-mass-spectrometry-for-drug-metabolism-studies 18/362
sample throughput [19, 50, 51]. Murphy et al. [50] studied the effect that
increasing the mobile phase flow rate had on analyte signal and assay cycle
time; the authors reported that signal peak area and cycle were both reduced
as the flow rate increased in a gradient system set to assay discovery PKsamples after protein precipitation. The assays were performed on a triple
quadrupole (QqQ) MS/MS system operated in the ESI mode. The authors
attributed the reduction in signal to the concentration-dependent nature of
the ESI source because the peak widths were kept constant, therefore the
analyte concentration was reduced as the flow rate was increased. The
authors also noted that protein precipitation was their sample preparation
method of choice for drug discovery PK samples. In addition, they stated
that they use methanol instead of acetonitrile in the mobile phase because
methanol tends to provide an enhanced signal as compared to acetonitrile.Jemal [19] and Jemal and Hawthorne [52] have also stated that methanol in
the mobile phase can provide significant signal enhancement in the positive
ESI mode as compared to acetonitrile in the mobile phase. Under negative
ESI conditions, Jemal [19] reported no response difference when using either
methanol or acetonitrile in the mobile phase. In a recent presentation by
Seliniotakis et al. [53], the authors reported that mixing methanol 1:1 with the
HPLC effluent and then splitting the flow 1:1 improved the MS signal in test
samples.
New chromatographic column types have also gained attention as possibleways to enhance sample throughput in LC–MS/MS assays. Several authors
have described the potential advantages of the monolithic HPLC columns [54–
61]. In general, monolithic columns offer the possibility of using mobile phases
at very high flow rates (5–10 mL/min), which can produce very fast assays. For
example, Wu et al. [54] describe the utility of using a monolithic column as part
of an LC–MS/MS system in a drug discovery environment. In their report,
they used 96-well plate solid phase extraction (SPE) for sample preparation.
The authors noted that good chromatographic separation is still important, in
order to separate the analyte from endogenous matrix components as well as
for the need to provide separation from potential metabolites. They also noted
that ESI is primarily a concentration-dependent detector, therefore good peak
shape is also an important factor for a successful assay. For their evaluation of
the monolithic column, they used a mixture of three analytes and one internal
standard; the chromatography was a gradient system and positive ESI was the
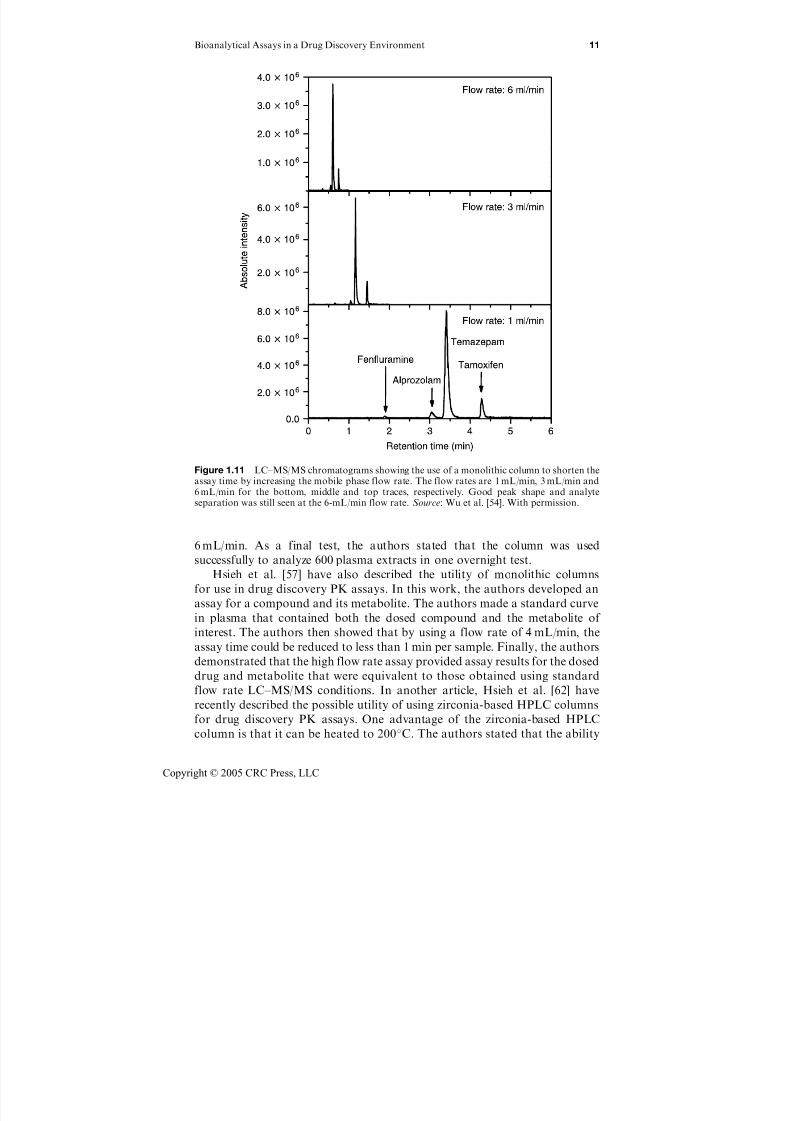
ionization mode. As shown in Figure 1.11, the authors demonstrated that good
separation and peak shape were maintained while changing the flow rate from
1 mL/min to 6 mL/min for the same mixture of four compounds. At a flow rate
of 6 mL/min, the eluant was split so that 0.4 mL/min entered the MS source.
The authors found that the peak area dropped significantly as the flow rate
increased, but the absolute ion abundance (peak height) decreased by only a
factor of 2. The authors also reported that the signal–noise ratio (S/N) was
unaffected by the increase in flow rate. Finally, by testing a sample with two
known metabolites, the authors were able to demonstrate that the monolithic
columns still demonstrated good separation power even at a flow rate of
10 Using Mass Spectrometry for Drug Metabolism Studies
Copyright © 2005 CRC Press, LLC
7/21/2019 Using Mass Spectrometry for Drug Metabolism Studies
http://slidepdf.com/reader/full/using-mass-spectrometry-for-drug-metabolism-studies 19/362
6 mL/min. As a final test, the authors stated that the column was used
successfully to analyze 600 plasma extracts in one overnight test.
Hsieh et al. [57] have also described the utility of monolithic columns
for use in drug discovery PK assays. In this work, the authors developed an
assay for a compound and its metabolite. The authors made a standard curve
in plasma that contained both the dosed compound and the metabolite of
interest. The authors then showed that by using a flow rate of 4 mL/min, the
assay time could be reduced to less than 1 min per sample. Finally, the authors
demonstrated that the high flow rate assay provided assay results for the dosed
drug and metabolite that were equivalent to those obtained using standard
flow rate LC–MS/MS conditions. In another article, Hsieh et al. [62] have
recently described the possible utility of using zirconia-based HPLC columns
for drug discovery PK assays. One advantage of the zirconia-based HPLC
column is that it can be heated to 200C. The authors stated that the ability
Figure 1.11 LC–MS/MS chromatograms showing the use of a monolithic column to shorten theassay time by increasing the mobile phase flow rate. The flow rates are 1 mL/min, 3 mL/min and6 mL/min for the bottom, middle and top traces, respectively. Good peak shape and analyteseparation was still seen at the 6-mL/min flow rate. Source: Wu et al. [54]. With permission.
Bioanalytical Assays in a Drug Discovery Environment 11
Copyright © 2005 CRC Press, LLC

7/21/2019 Using Mass Spectrometry for Drug Metabolism Studies
http://slidepdf.com/reader/full/using-mass-spectrometry-for-drug-metabolism-studies 20/362
to heat the column allows one to increase the flow rate of the mobile phase
without exceeding the pressure limits of the column.
There has been much interest in documenting the need to obtain good
chromatographic separation in order to avoid the potential issue of one ormore metabolites showing up in the same selected reaction monitoring (SRM)
transition that is selected for the parent (dosed) compound [63]. The basis for
this potential problem is that in-source fragmentation can occur for some types
of molecules and that this fragmentation can produce ions that are identical
to those formed as [MH]þ ions (positive ionization mode) from the parent
compound, thus these ions would produce a signal in the SRM transition for
the parent compound. The most commonly cited metabolite class that can
produce this effect is glucuronides. While this problem is well known to occur
in APCI sources, it is sometimes assumed to not be an issue when using ESIsources. Yan et al. [64] studied the problem, specifically looking at in-source
fragmentation of glucuronides in an ESI source. They tested over 100 N - and
O-glucuronides in both the positive and the negative ESI mode and varied
source temperature and cone voltage to see what effect, if any, these param-
eters had on the extent of in-source fragmentation. They noted that source
temperature had little effect on the amount of in-source fragmentation and that
at normal (25–40 V) cone voltage, in-source fragmentation was detected for all
glucuronides; at lower cone voltages, the in-source fragmentation was reduced
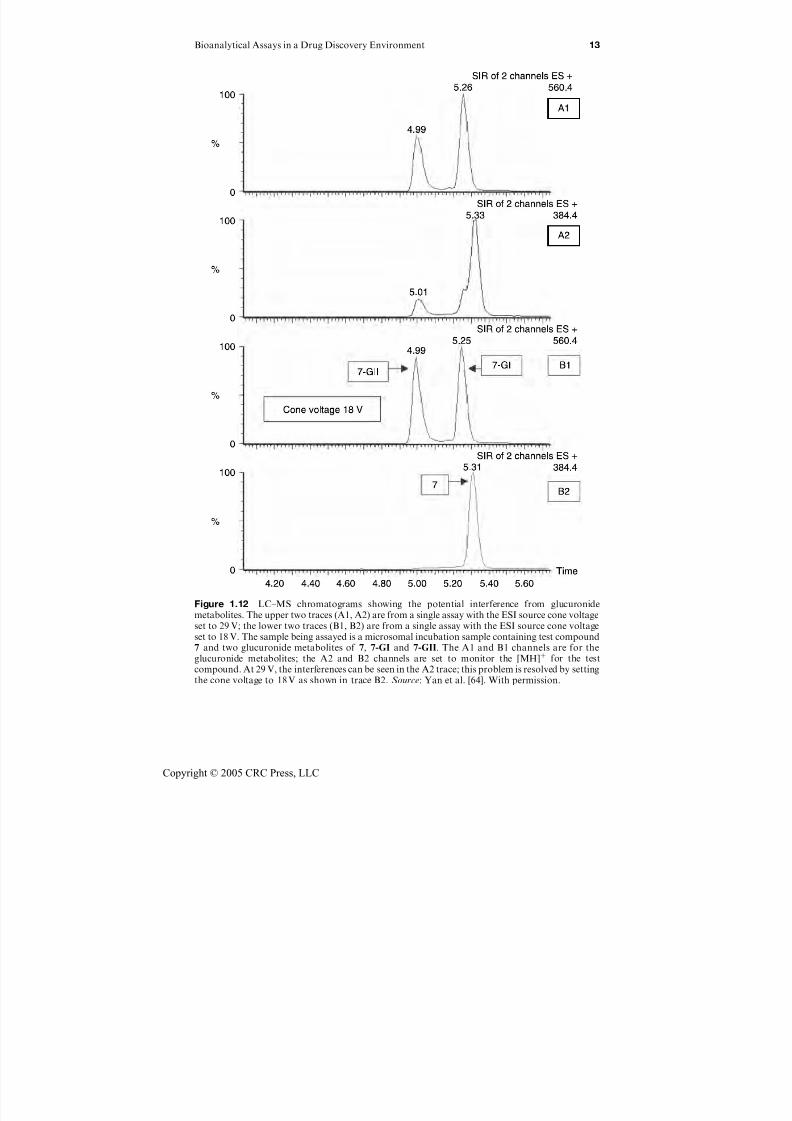
or eliminated. Figure 1.12 [64] shows an example of this effect for an assay of acompound, 7 and its two N -glucuronides, 7-GI and 7-GII. In trace A1 and A2,
the cone voltage was set to 29 V and two extra peaks can be seen in the channel
for the parent compound, 7 — one of them causing a significant shoulder on
the peak for the parent compound. These extra peaks were not observed when
the cone voltage was reduced to 18 V (trace B1 and B2).
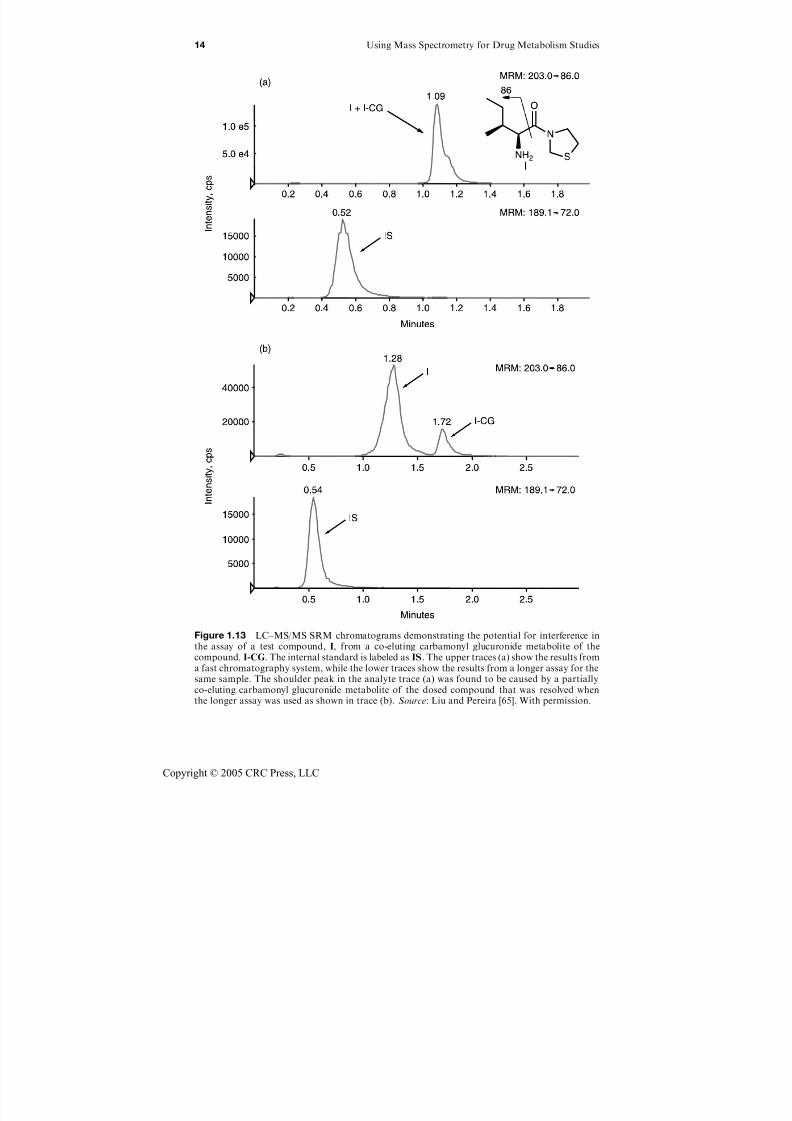
Liu and Pereira [65] reported that both carbamoyl glucuronides and
acyl glucuronides, in-source fragmentation was a problem in both ESI and
APCI modes of ionization. They stressed that this was a potential issue when
using fast gradient chromatographic systems. As an example, as shown in
Figure 1.13, the SRM trace for the parent (dosed) compound (a) shows a
significant shoulder; this shoulder is separated when a more shallow gradient
system was used (b) to assay the same sample [65]. The shoulder peak was
found to be caused by a partially co-eluting carbamonyl glucuronide metab-
olite of the dosed compound. The need to separate acyl glucuronide metab-
olites from the parent compound to avoid this assay problem has been
highlighted in several papers [63, 66–68]. (See Chapter 6 for more discussion
of acyl glucuronides.)
In papers by Tong et al. [69] and Ramanathan et al. [70], the issue of in-
source fragmentation by N -oxide metabolites is investigated. In the first paper,
they showed that for two N -oxide compounds studied, both [MH]þ and
[MH 16]þ ions were formed under APCI conditions, but not ESI conditions.
In their second report, they demonstrated that in APCI and ESI sources that
utilize a heated transport capillary tube, elevating the temperature of the
heated transport capillary tube caused thermal deoxygenation leading to
12 Using Mass Spectrometry for Drug Metabolism Studies
Copyright © 2005 CRC Press, LLC
7/21/2019 Using Mass Spectrometry for Drug Metabolism Studies
http://slidepdf.com/reader/full/using-mass-spectrometry-for-drug-metabolism-studies 21/362
Figure 1.12 LC–MS chromatograms showing the potential interference from glucuronidemetabolites. The upper two traces (A1, A2) are from a single assay with the ESI source cone voltageset to 29 V; the lower two traces (B1, B2) are from a single assay with the ESI source cone voltage
set to 18 V. The sample being assayed is a microsomal incubation sample containing test compound7 and two glucuronide metabolites of 7, 7-GI and 7-GII. The A1 and B1 channels are for theglucuronide metabolites; the A2 and B2 channels are set to monitor the [MH]þ for the testcompound. At 29 V, the interferences can be seen in the A2 trace; this problem is resolved by settingthe cone voltage to 18 V as shown in trace B2. Source: Yan et al. [64]. With permission.
Bioanalytical Assays in a Drug Discovery Environment 13
Copyright © 2005 CRC Press, LLC
7/21/2019 Using Mass Spectrometry for Drug Metabolism Studies
http://slidepdf.com/reader/full/using-mass-spectrometry-for-drug-metabolism-studies 22/362
Figure 1.13 LC–MS/MS SRM chromatograms demonstrating the potential for interference inthe assay of a test compound, I, from a co-eluting carbamonyl glucuronide metabolite of thecompound, I-CG. The internal standard is labeled as IS. The upper traces (a) show the results froma fast chromatography system, while the lower traces show the results from a longer assay for thesame sample. The shoulder peak in the analyte trace (a) was found to be caused by a partiallyco-eluting carbamonyl glucuronide metabolite of the dosed compound that was resolved whenthe longer assay was used as shown in trace (b). Source: Liu and Pereira [65]. With permission.
14 Using Mass Spectrometry for Drug Metabolism Studies
Copyright © 2005 CRC Press, LLC
7/21/2019 Using Mass Spectrometry for Drug Metabolism Studies
http://slidepdf.com/reader/full/using-mass-spectrometry-for-drug-metabolism-studies 23/362
[MH 16]þ ions for three N -oxide compounds that were studied. The authors
stated that while this could be a problem when performing quantitative assays
for dosed compounds that have N -oxide metabolites, it could also be useful for
metabolite identification purposes when trying to distinguish between isobaric
metabolites that could be either N -oxides or hydroxylated species.
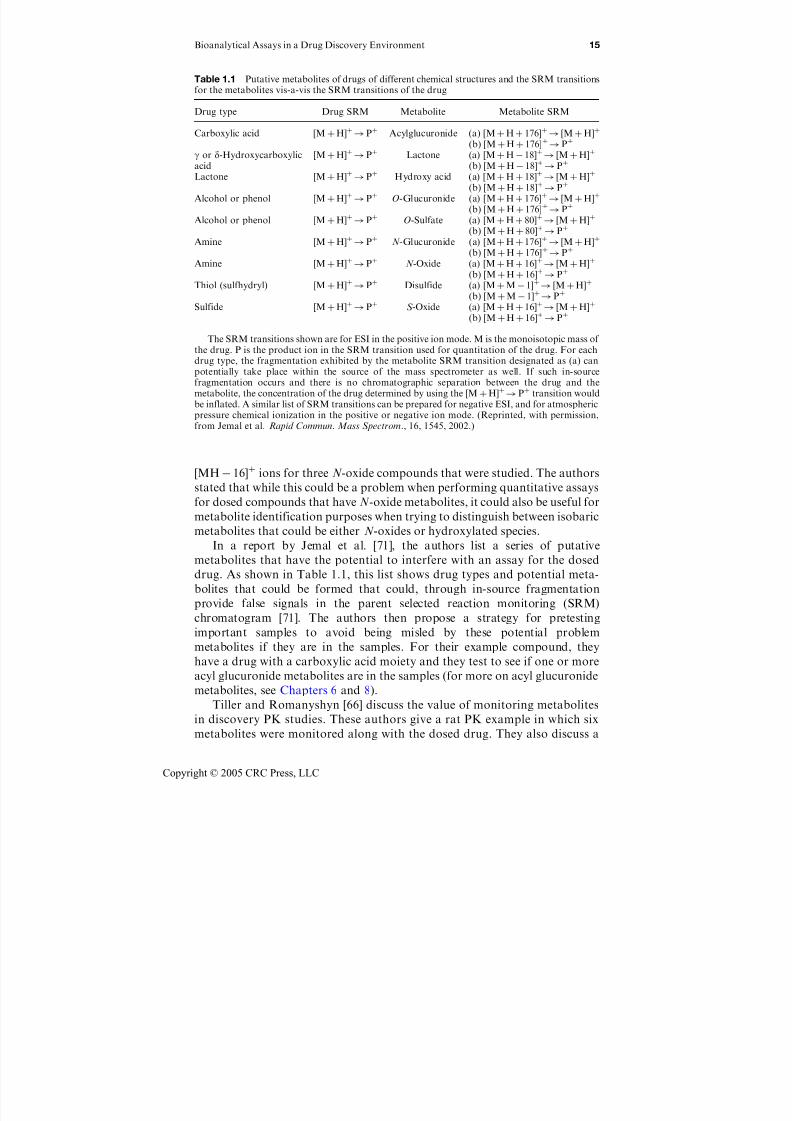
In a report by Jemal et al. [71], the authors list a series of putative
metabolites that have the potential to interfere with an assay for the dosed
drug. As shown in Table 1.1, this list shows drug types and potential meta-
bolites that could be formed that could, through in-source fragmentation
provide false signals in the parent selected reaction monitoring (SRM)
chromatogram [71]. The authors then propose a strategy for pretesting
important samples to avoid being misled by these potential problem
metabolites if they are in the samples. For their example compound, they
have a drug with a carboxylic acid moiety and they test to see if one or more
acyl glucuronide metabolites are in the samples (for more on acyl glucuronide
metabolites, see Chapters 6 and 8).
Tiller and Romanyshyn [66] discuss the value of monitoring metabolites
in discovery PK studies. These authors give a rat PK example in which six
metabolites were monitored along with the dosed drug. They also discuss a
Table 1.1 Putative metabolites of drugs of different chemical structures and the SRM transitionsfor the metabolites vis-a-vis the SRM transitions of the drug
Drug type Drug SRM Metabolite Metabolite SRM
Carboxylic acid [MþH]þ!Pþ Acylglucuronide (a) [MþHþ 176]þ! [MþH]þ
(b) [MþHþ 176]þ!Pþ
g or d-Hydroxycarboxylicacid
[MþH]þ!Pþ Lactone (a) [MþH 18]þ! [MþH]þ
(b) [MþH 18]þ!Pþ
Lactone [MþH]þ!Pþ Hydroxy acid (a) [MþHþ 18]þ! [MþH]þ
(b) [MþHþ 18]þ!Pþ
Alcohol or phenol [MþH]þ!Pþ O-Glucuronide (a) [MþHþ 176]þ! [MþH]þ
(b) [MþHþ 176]þ!Pþ
Alcohol or phenol [MþH]þ!Pþ O-Sulfate (a) [MþHþ 80]þ! [MþH]þ
(b) [MþHþ 80]þ!Pþ
Amine [MþH]þ!Pþ N -Glucuronide (a) [MþHþ 176]þ! [MþH]þ
(b) [MþHþ 176]þ
!Pþ
Amine [MþH]þ!Pþ N -Oxide (a) [MþHþ 16]þ! [MþH]þ
(b) [MþHþ 16]þ!Pþ
Thiol (sulfhydryl) [MþH]þ!Pþ Disulfide (a) [MþM 1]þ! [MþH]þ
(b) [MþM 1]þ!Pþ
Sulfide [MþH]þ!Pþ S -Oxide (a) [MþHþ 16]þ! [MþH]þ
(b) [MþHþ 16]þ!Pþ
The SRM transitions shown are for ESI in the positive ion mode. M is the monoisotopic mass of the drug. P is the product ion in the SRM transition used for quantitation of the drug. For eachdrug type, the fragmentation exhibited by the metabolite SRM transition designated as (a) canpotentially take place within the source of the mass spectrometer as well. If such in-source
fragmentation occurs and there is no chromatographic separation between the drug and themetabolite, the concentration of the drug determined by using the [MþH]þ!Pþ transition wouldbe inflated. A similar list of SRM transitions can be prepared for negative ESI, and for atmosphericpressure chemical ionization in the positive or negative ion mode. (Reprinted, with permission,from Jemal et al. Rapid Commun. Mass Spectrom., 16, 1545, 2002.)
Bioanalytical Assays in a Drug Discovery Environment 15
Copyright © 2005 CRC Press, LLC

7/21/2019 Using Mass Spectrometry for Drug Metabolism Studies
http://slidepdf.com/reader/full/using-mass-spectrometry-for-drug-metabolism-studies 24/362
dog PK study where they monitored a monohydroxy as well as a dihydroxy
metabolite. In the dog study, as shown in Figure 1.14, the hydroxylated
metabolite (C OH) was found to be at concentrations higher than the dosed
drug throughout the PK profile [66]. The pharmacodynamic (PD) observations
from this dog study correlated well with the hydroxlylated metabolite—
therefore, it was very helpful to the project team to get this type of data early in
the discovery stage. Kostiainen et al. [26] reviewed the use of LC–MS/MS for
drug metabolism studies including metabolite identification and Cox et al. [72]
and Clarke et al. [73] have described general procedures for metabolite
characterization in a drug discovery setting. Recently, Ramanathan et al. [74],
Nassar and Adams [75], and Jemal et al. [76] have all described strategies for
rapid metabolite identification for in vitro samples. (For more details on
metabolite identification, see Chapter 8.) Off-line sample preparation has
received a great deal of attention in the literature. The most common
procedures are liquid–liquid extraction [77–79], solid phase extraction [80–85],
and protein precipitation [86–88]. Of these three, the most common procedure,
in a drug discovery environment, is protein precipitation because it is easy to
implement and easy to semi-automate [88]. Most semi-automation procedures
are based on the use of 96-well plates. One of the first steps that needs to be
done is to transfer an aliquot of the plasma into the proper well of the 96-well
plate. Ideally, this step should be performed using a robot to make the transfer;
Figure 1.14 The assay results from a dog PK study. The results are plotted as amount vs timeafter dosing. The graph shows the amounts for the dosed compound, C, as well as a monitoredmonohydroxy metabolite, C OH. It can be seen that the levels of the monohydroxy metabolite,
C OH, were much higher that the levels of the dosed compound, C, for both dogs. Source: Tillerand Romanyshyn [66]. With permission.
16 Using Mass Spectrometry for Drug Metabolism Studies
Copyright © 2005 CRC Press, LLC

7/21/2019 Using Mass Spectrometry for Drug Metabolism Studies
http://slidepdf.com/reader/full/using-mass-spectrometry-for-drug-metabolism-studies 25/362
one of the practical problems is that thrombin clots tend to form in the plasma,
and this can be a problem for a robotic system [89, 90]. Sadagopan et al. [91]
investigated the merits of using EDTA as the anticoagulant instead of the more
commonly used heparin. They found that neither anticoagulant was a problemfor the LC–MS/MS assay, but EDTA was superior in that it was better in the
prevention of thrombin clots relative to heparin, therefore they recommended
using EDTA as the anticoagulant when collecting samples to be assayed by
LC–MS/MS. Berna et al. [90] also found that EDTA was better than heparin in
reducing the formation of thrombin clots in the plasma samples. In addition,
they studied a special polypropylene 96-well filter plate that could be used to
store and filter plasma samples as another means of avoiding the problem of
thrombin clots. Mallet et al. [92, 93] have described a low elution volume 96-
well solid phase extraction (SPE) plate that was designed for low volumeplasma studies (50-mL samples). The plate was designed to work with a Quadra
96 (Tomtec, Hamden, CT) robotic liquid handler. The authors state that this
new low-elution volume SPE plate should be useful for drug discovery PK
studies. Eerkes et al. [77] discuss an automated liquid/liquid extraction (L/L)
procedure based on a 96-well plate format. There has also been a lot of activity
in terms of on-line extraction procedures (see, for example, Ackermann et al.
[94], Wu [95], Kerns et al. [96] and Cass et al. [97]). A more complete discussion
of this topic can be found in Chapter 5.
As sample throughput increases, so does the number of compounds thatcan be studied each week. Another area of interest, therefore, is automated
MS/MS method development. Higton [98] has shown an MS and MS/MS
automated method building system that can create SRM methods for new test
compounds at a rate of close to 30 per hour. Whalen et al. [99] described
the Autoscan software that can be used to obtain MS as well as MS/MS
conditions for assaying 96 compounds in 1 h. In a series of articles, Watt et al.
[89] and Locker et al. [100] have described the utility and application of an
automated sample preparation system designed for drug discovery PK
samples. In the more recent of these two articles Locker et al. [100] describe
an integrated robotic system that not only makes the standard curves, but also
precipitates the samples and develops an optimized MS/MS procedure for each
analyte.
The issue of matrix ion suppression, often called matrix effects, has received
increasing attention in the literature recently [38, 40, 101–106]. Miller-Stein
et al. [39] discuss some of the issues regarding the matrix effect problem and
provide a procedure for evaluating matrix effects in a given assay by using
post-column infusion of the analyte of interest. Muller et al. [107] studied the
effect of various sample preparation techniques in terms of the observed matrix
effect in the described assay; they concluded that matrix effects could be
avoided when using standard chromatographic systems, but could be a
problem for high throughput applications. Avery [108] suggested trying more
than one potential internal standard and looking at several lots of plasma when
evaluating an analytical method. Both Schuhmacher et al. [104] and Shou and
Naidong [109] discussed the potential problems of the dosing formulation
Bioanalytical Assays in a Drug Discovery Environment 17
Copyright © 2005 CRC Press, LLC
7/21/2019 Using Mass Spectrometry for Drug Metabolism Studies
http://slidepdf.com/reader/full/using-mass-spectrometry-for-drug-metabolism-studies 26/362
vehicle in terms of potential matrix effect issues; in both articles, PEG 400
was cited as causing matrix effect problems. Mei et al. [103] described a study
of the potential for sample tubes to cause matrix effect issues. While not
commonly available in a drug discovery setting, it has generally been assumedthat the use of a stable-isotope labeled (SIL) internal standard will eliminate
any matrix effect problem; a recent article by Jemal et al. [110] showed an
example of a matrix effect problem that was observed even with the use of an
SIL internal standard. A complete discussion of matrix effects can be found
in Chapter 4.
Another area of interest is the development of new technology with new
capabilities. One example of this advance is the development of a higher mass
resolution triple quadrupole mass spectrometer. Jemal and Ouyang [111]
evaluated an enhanced mass resolution triple quadrupole mass spectrometer interms of utility, stability and reproducibility. They demonstrated the potential
utility of this new technology and also suggested ways to utilize it properly to
minimize problems. Yang et al. [112] studied the stability of an enhanced mass
resolution triple quadrupole mass spectrometer and found it to be suitable for
typical bioanalytical applications. Xu et al. [113] compared the results of a
conventional triple quadrupole mass spectrometer with those of an enhanced
mass resolution triple quadrupole mass spectrometer and found that in some
cases, improved lower limits of quantitation could be obtained from the
enhanced mass resolution triple quadrupole mass spectrometer. Additionaldiscussion of enhanced mass resolution mass spectrometers can be found in
Chapters 7 and 8. Other new technologies that may be advantageous and are
therefore important to follow are: atmospheric pressure photoionization
(APPI) as discussed by Hsieh et al. [62, 114], Raffaelli and Saba [115] and Yang
and Henion [116] (see also Chapter 9); the quadrupole linear ion trap mass
spectrometer (see Xia et al. [117] and Chapter 10); MS imaging for small
molecules (see Chapter 11); and nanospray/chip technologies (see Dethy et al.
[118], Kapron et al. [119], and Chapter 12).
1.3 Current Practices
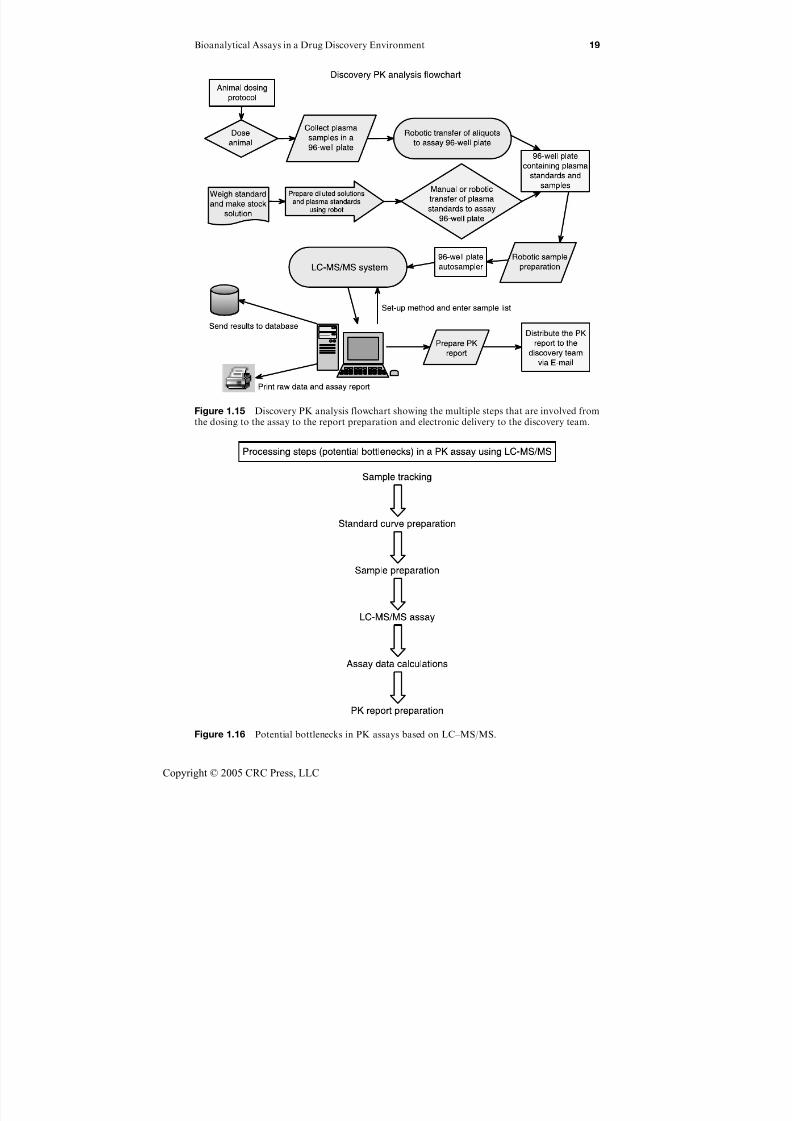
As shown in Figure 1.15, drug discovery PK analyses include multiple steps,
which need to be performed in sequence so that the PK results can be
distributed to the drug discovery project team as well as entered into a database
for future reference. Many talks and papers have discussed speeding up drug
discovery PK assays; most of these articles have focussed on one step in the
process—typically the LC–MS/MS assay step. It is important to consider the
whole process from start to completion when trying to determine how best
to decrease the time it takes to get PK results back to the drug discovery
project team.
Figure 1.16 shows the major steps in the discovery bioanalytical process as
a sequential series with the point that any one step can be the bottleneck. Over
the last several years, these steps have been streamlined so that what used to
18 Using Mass Spectrometry for Drug Metabolism Studies
Copyright © 2005 CRC Press, LLC
7/21/2019 Using Mass Spectrometry for Drug Metabolism Studies
http://slidepdf.com/reader/full/using-mass-spectrometry-for-drug-metabolism-studies 27/362
Figure 1.15 Discovery PK analysis flowchart showing the multiple steps that are involved fromthe dosing to the assay to the report preparation and electronic delivery to the discovery team.
Figure 1.16 Potential bottlenecks in PK assays based on LC–MS/MS.
Bioanalytical Assays in a Drug Discovery Environment 19
Copyright © 2005 CRC Press, LLC
7/21/2019 Using Mass Spectrometry for Drug Metabolism Studies
http://slidepdf.com/reader/full/using-mass-spectrometry-for-drug-metabolism-studies 28/362
take 4–5 weeks can now be performed in a few days. Sample tracking can be
performed using either an Excel (Microsoft Corp.) -based tracking system
or a laboratory LIMS system such as WATSON (InnaPhase Corp., www.
innaphase.com). Standard curve preparation can be readily performed using
robotic sample handling systems (e.g., Packard MultiPROBE) that can not
only make dilutions of the standard stock solution, but also add the required
amount of these solutions to the plasma matrix to make the plasma standards
that are required for the assay. As discussed above, many researchers have
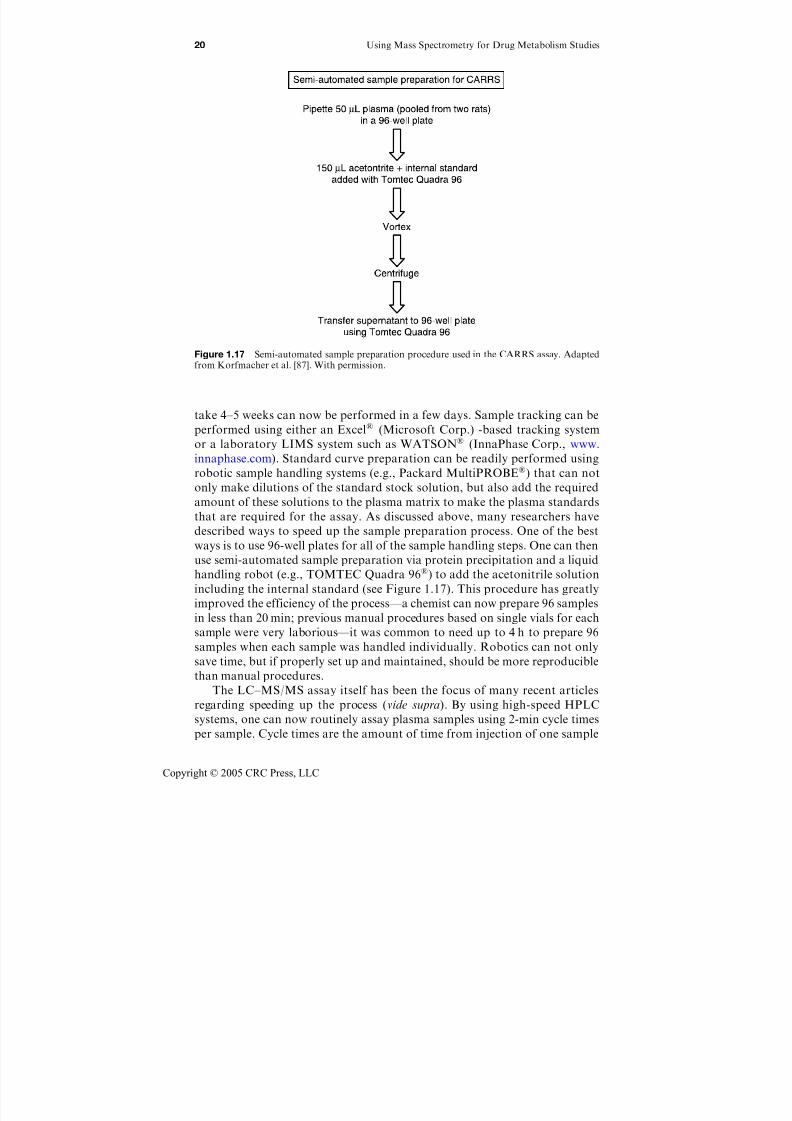
described ways to speed up the sample preparation process. One of the best
ways is to use 96-well plates for all of the sample handling steps. One can then
use semi-automated sample preparation via protein precipitation and a liquid
handling robot (e.g., TOMTEC Quadra 96) to add the acetonitrile solution
including the internal standard (see Figure 1.17). This procedure has greatly
improved the efficiency of the process—a chemist can now prepare 96 samples
in less than 20 min; previous manual procedures based on single vials for each
sample were very laborious—it was common to need up to 4 h to prepare 96
samples when each sample was handled individually. Robotics can not only
save time, but if properly set up and maintained, should be more reproducible
than manual procedures.
The LC–MS/MS assay itself has been the focus of many recent articles
regarding speeding up the process (vide supra). By using high-speed HPLC
systems, one can now routinely assay plasma samples using 2-min cycle times
per sample. Cycle times are the amount of time from injection of one sample
Figure 1.17 Semi-automated sample preparation procedure used in the CARRS assay. Adaptedfrom Korfmacher et al. [87]. With permission.
20 Using Mass Spectrometry for Drug Metabolism Studies
Copyright © 2005 CRC Press, LLC
7/21/2019 Using Mass Spectrometry for Drug Metabolism Studies
http://slidepdf.com/reader/full/using-mass-spectrometry-for-drug-metabolism-studies 29/362
to the injection of the next sample. Typical setups utilize short (2–3 cm)
narrow-bore (1–2 mm, i.d.) HPLC columns with flow rates up to 1 mL/min
or more. Often a divert valve is built into the LC–MS/MS system and can be
used to divert the first 20% of the total sample cycle time; this allows muchof the ‘‘junk’’ to be diverted to waste, thereby keeping the mass spectrometer
source cleaner than it would be without the divert valve in use. The most
commonly used mass spectrometer for bioanalytical applications is the triple
quadrupole instrument. By using the SRM mode, a skilled operator can set
up very specific MS/MS methods for the analyte and internal standard. In
the positive ionization mode, this would typically be based on selecting the
[MH]þ ions using the first quadrupole (Q1); the [MH]þ ions are then
focussed into the collision cell (q2) where they are fragmented using collision-
induced dissociation (CID) into various product ions; one of the product ionsis selected using the third quadrupole (Q3) and only ions of that specific m/z
are sent to the detector. The highly specific nature of the SRM use of the
triple quadrupole mass spectrometer was first noted by Brotherton and Yost
[120] in 1983. The basic analytical principle that Brotherton and Yost
described in their landmark article [120] was that the multiple stages of
selection in the MS/MS system reduced the noise faster than the signal,
thereby creating a net improvement in the S/N ratio. More recently,
Korfmacher et al. [86] described the basic principles for using LC–MS/MS
for drug metabolism support of new drug discovery applications. Theseprinciples include the use of SRM, whereby multiple analytes including the
internal standard, can be monitored in a single LC–MS/MS assay; these basic
principles are still in use today.
By spiking the analyte of interest into plasma from the same species as
the samples to be assayed, one can compare the response ratio of the analyte
to the internal standard (a separate compound that is added in the sample
preparation process) to make the calibration curve and then use this to
determine the concentration of the analyte in the plasma samples. The assay
data calculations are typically performed using the mass spectrometer
vendor’s software, but can also be performed using other software with
linear (or other smooth curve functions, e.g., power curve or quadratic as
needed) regression capabilities (e.g., WATSON or Excel). For assays over a
range of three orders of magnitude or more, it is common to use weighting
when performing the standard curve regression—typical weighting param-
eters are 1/x or 1/x2. Simple PK calculations (AUC, C max, T max) can be
performed using Excel or similar software. For more complicated PK
calculations (e.g., clearance, volume of distribution, mean residence time),
WATSON or other PK calculation programs are required. WATSON has
the advantage that it is able to export sample lists to major vendors’ mass
spectrometer systems and import tabular results from such systems—this is
an important capability in that it avoids having to type summary assay data
into the computer used for the PK report calculations. Once the PK reports
are completed, they can then be saved into a database or reformatted into
Excel reports, which can be issued via e-mail to the discovery project team
Bioanalytical Assays in a Drug Discovery Environment 21
Copyright © 2005 CRC Press, LLC

7/21/2019 Using Mass Spectrometry for Drug Metabolism Studies
http://slidepdf.com/reader/full/using-mass-spectrometry-for-drug-metabolism-studies 30/362
that is awaiting the data. Thus, the whole procedure outlined in Figures 1.16and 1.17 can be expedited through careful evaluation of each step in the
process, resulting in a higher throughput operation by utilizing a combina-
tion of robotics, state-of-the-art LC–MS/MS equipment and smart software
tools.
One way to view the drug discovery process is that it is a series of stages
through which compounds must pass in order to qualify for being a
development compound. These stages represent various in vitro and in vivo
tests that are performed on a series of compounds in order to select those few
compounds that have the correct properties for the desired activity. As shown
in Figure 1.18, there are multiple stages that involve measuring various drug
metabolism and pharmacokinetic (DMPK) parameters. In terms of in vivo tests
that require bioanalytical assays, there have been no clear guidelines to follow
until a compound enters the development stage where most of the bioanalytical
assays are required to be performed under good laboratory practice (GLP)
regulations [121, 122]. Before the development stage, one could envisage a
series of assay requirements that become stricter as one approaches the
development stage.
As shown in Figure 1.18, various levels (I–IV) have been assigned to the
stages leading up to and including the development stage. As shown in
Table 1.2, these drug stages have been assigned assay types (level I to level IV).
level I is the screening stage, level II is lead optimization, level III is lead
qualification and level IV is development. Screening can be defined as the stage
where a larger number of compounds are tested in order to select a smaller
number for optimization. In the optimization phase, the lead compound
Figure 1.18 Stages in new drug discovery. A large number of compounds are screened out byeach stage. The levels I–IV refer to the assay rules outlined in this chapter.
22 Using Mass Spectrometry for Drug Metabolism Studies
Copyright © 2005 CRC Press, LLC

7/21/2019 Using Mass Spectrometry for Drug Metabolism Studies
http://slidepdf.com/reader/full/using-mass-spectrometry-for-drug-metabolism-studies 31/362
structures are varied until an optimum structure is selected (see Chapter 2 for
more on this topic). In lead qualification, the optimized structure undergoes
lower throughput testing (e.g., single rising dose PK, multiple dose rat enzyme
induction study, etc.). Compounds that show the acceptable DMPK properties
after all of these assays have been completed are then considered as candidatesfor development. Table 1.2 also lists the major rules for each assay level in our
laboratory. These rules were designed to become stricter as the compounds
move from level I to level III. Level I assays are designed to be easy to
implement in a higher throughput manner. Table 1.3 lists in detail the rules for
Table 1.3 Rules for discovery (non-GLP) screen assays (level I)
1. Samples should be assayed using HPLC–MS/MS technology.
2. Sample preparation should consist of protein precipitation using an appropriate internalstandard (IS).
3. Samples should be assayed along with a standard curve in duplicate (at the beginning and endof the sample set).
4. The zero standard is prepared and assayed, but is not included in the calibration curveregression.
5. Standard curve stock solutions are prepared after correcting the standard for the salt factor.6. The standard curve should be three levels, typically ranging from 25 to 2500 (they can be lower
or higher as needed for the program) ng/mL; each standard is 10 the one below (thus, atypical set would be 25, 250 and 2500 ng/mL). The matrix of the calibration curve should befrom the same animal species and matrix type as the samples.
7. QC samples are not used and the assay is not validated.
8. After the assay, the proper standard curve range for the samples is selected; this must includeonly two concentrations in the range that covers the samples. A one order of magnitude rangeis preferred, but two orders of magnitude is acceptable, if needed to cover the samples.
9. Once the range is selected, at least three of the four assayed standards in the range must beincluded in the regression analysis. Regression is performed using unweighted linear regression(not forced through zero).
10. All standards included in the regression set must be back calculated to within 27.5% of theirnominal values.
11. The limit of quantitation (LOQ) may be set as either the lowest standard in the selected rangeor as 0.4 times the lowest standard in the selected range, but the LOQ must be greater thanthree times the mean value for the back-calculated value of the two zero standards.
12. Samples below the LOQ are reported as zero.13. If the LOQ is 0.4 times the lowest standard in the selected range, then samples with back-
calculated values between the LOQ and the lowest standard in the selected range may bereported as their calculated value provided the S/N for the analyte is at least 3.
14. Samples with back-calculated values between 1.0 and 2.0 the highest standard in theselected range are reportable by extending the calibration line up to 2 the high standard.
15. Samples found to have analyte concentrations more than 2 the highest standard in theregression set are not reportable; these samples must be reassayed after dilution or along with astandard curve that has higher concentrations so that the sample is within 2 the higheststandard.
Table 1.2 Assay levels for bioanalytical methods
Drug stage Assay type Summary of major rules GLP
Screening Level I Use a two-point standard curve NoLead optimization Level II Use a multi-point standard curve but no quality control NoLead qualification Level III Use a multi-point standard curve plus quality control NoDevelopment Level IV GLP rules Yes
Bioanalytical Assays in a Drug Discovery Environment 23
Copyright © 2005 CRC Press, LLC
7/21/2019 Using Mass Spectrometry for Drug Metabolism Studies
http://slidepdf.com/reader/full/using-mass-spectrometry-for-drug-metabolism-studies 32/362
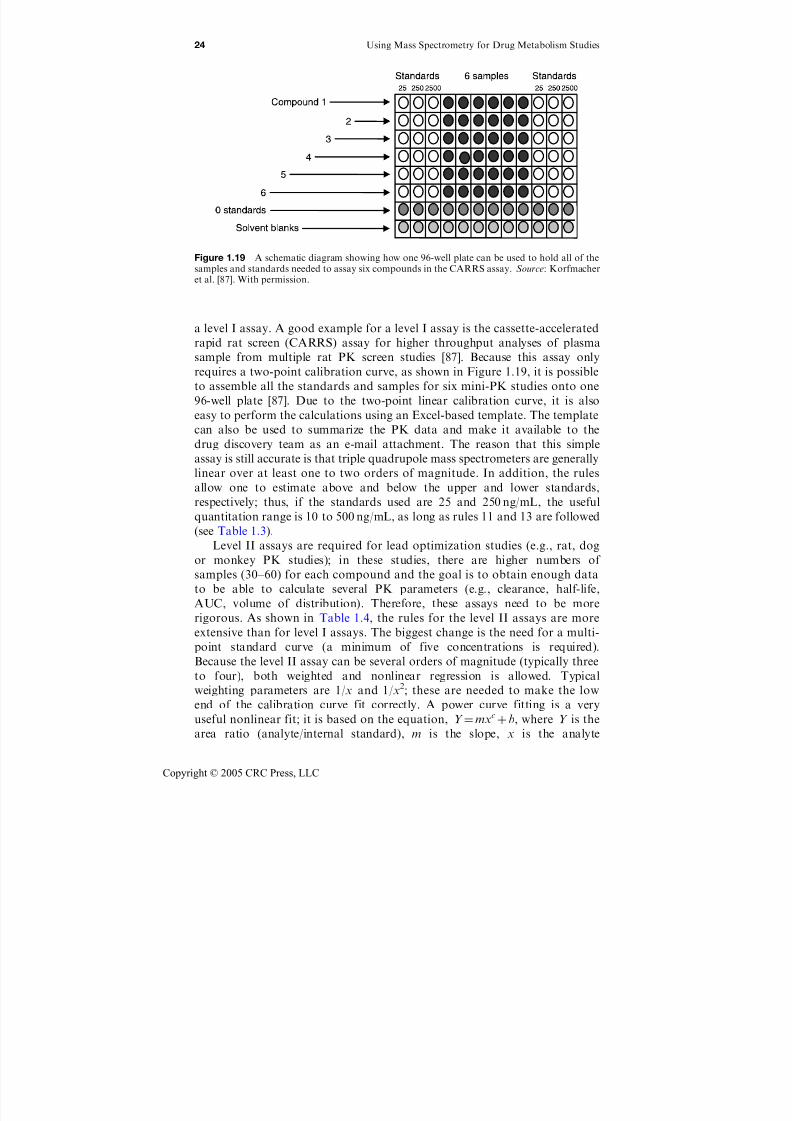
a level I assay. A good example for a level I assay is the cassette-accelerated
rapid rat screen (CARRS) assay for higher throughput analyses of plasma
sample from multiple rat PK screen studies [87]. Because this assay only
requires a two-point calibration curve, as shown in Figure 1.19, it is possible
to assemble all the standards and samples for six mini-PK studies onto one96-well plate [87]. Due to the two-point linear calibration curve, it is also
easy to perform the calculations using an Excel-based template. The template
can also be used to summarize the PK data and make it available to the
drug discovery team as an e-mail attachment. The reason that this simple
assay is still accurate is that triple quadrupole mass spectrometers are generally
linear over at least one to two orders of magnitude. In addition, the rules
allow one to estimate above and below the upper and lower standards,
respectively; thus, if the standards used are 25 and 250 ng/mL, the useful
quantitation range is 10 to 500 ng/mL, as long as rules 11 and 13 are followed
(see Table 1.3).
Level II assays are required for lead optimization studies (e.g., rat, dog
or monkey PK studies); in these studies, there are higher numbers of
samples (30–60) for each compound and the goal is to obtain enough data
to be able to calculate several PK parameters (e.g., clearance, half-life,
AUC, volume of distribution). Therefore, these assays need to be more
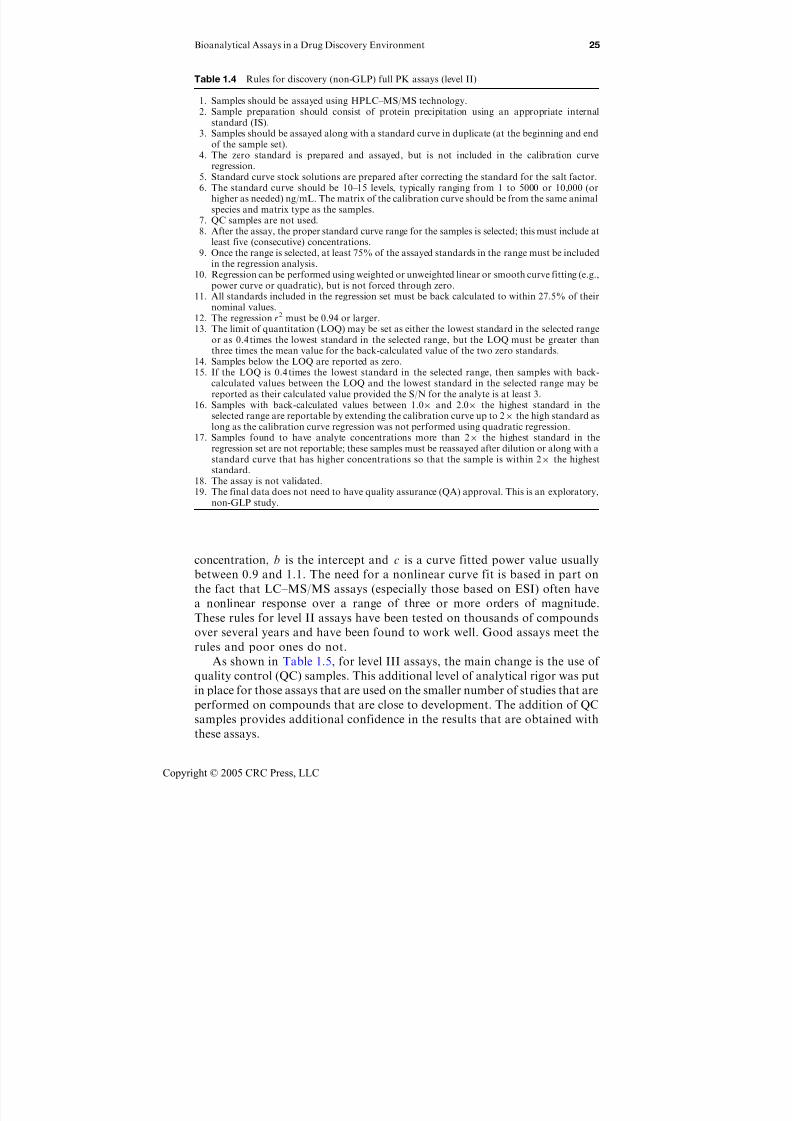
rigorous. As shown in Table 1.4, the rules for the level II assays are more
extensive than for level I assays. The biggest change is the need for a multi-
point standard curve (a minimum of five concentrations is required).
Because the level II assay can be several orders of magnitude (typically three
to four), both weighted and nonlinear regression is allowed. Typical
weighting parameters are 1/x and 1/x2; these are needed to make the low
end of the calibration curve fit correctly. A power curve fitting is a very
useful nonlinear fit; it is based on the equation, Y ¼mxc
þ b, where Y is the
area ratio (analyte/internal standard), m is the slope, x is the analyte
Figure 1.19 A schematic diagram showing how one 96-well plate can be used to hold all of thesamples and standards needed to assay six compounds in the CARRS assay. Source: Korfmacheret al. [87]. With permission.
24 Using Mass Spectrometry for Drug Metabolism Studies
Copyright © 2005 CRC Press, LLC
7/21/2019 Using Mass Spectrometry for Drug Metabolism Studies
http://slidepdf.com/reader/full/using-mass-spectrometry-for-drug-metabolism-studies 33/362
concentration, b is the intercept and c is a curve fitted power value usually
between 0.9 and 1.1. The need for a nonlinear curve fit is based in part on
the fact that LC–MS/MS assays (especially those based on ESI) often have
a nonlinear response over a range of three or more orders of magnitude.
These rules for level II assays have been tested on thousands of compounds
over several years and have been found to work well. Good assays meet the
rules and poor ones do not.
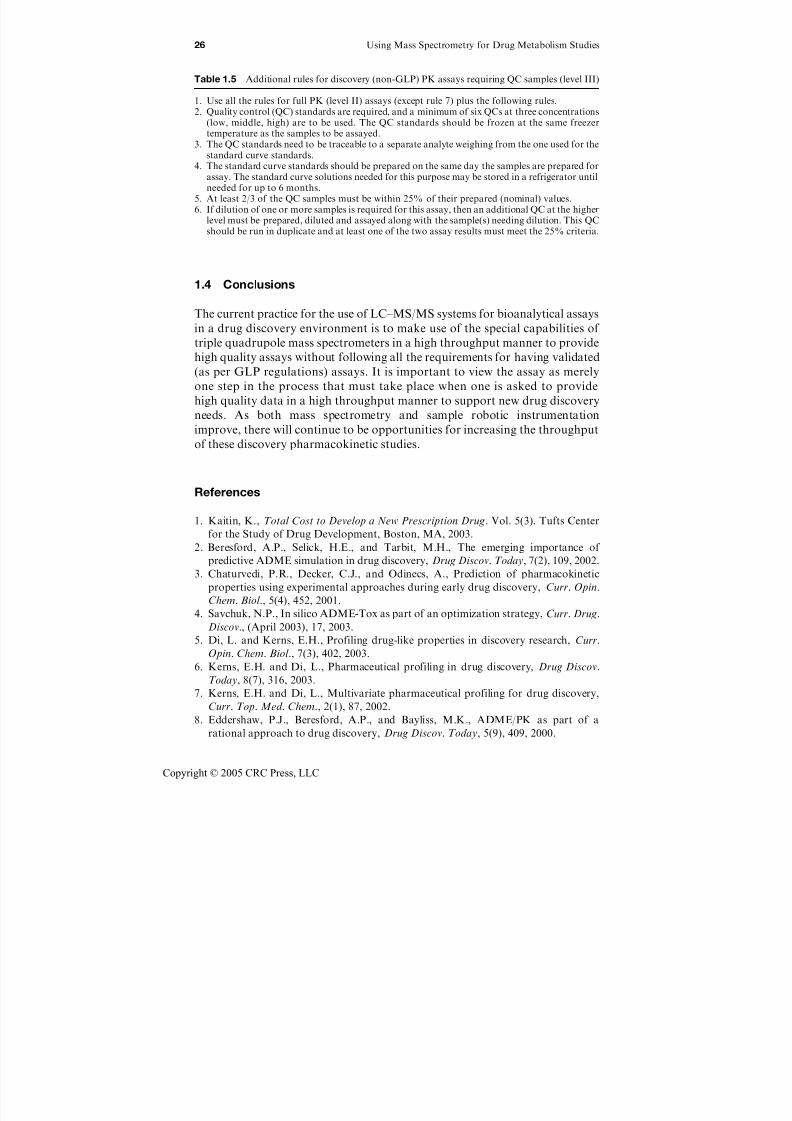
As shown in Table 1.5, for level III assays, the main change is the use of
quality control (QC) samples. This additional level of analytical rigor was put
in place for those assays that are used on the smaller number of studies that are
performed on compounds that are close to development. The addition of QC
samples provides additional confidence in the results that are obtained with
these assays.
Table 1.4 Rules for discovery (non-GLP) full PK assays (level II)
1. Samples should be assayed using HPLC–MS/MS technology.2. Sample preparation should consist of protein precipitation using an appropriate internal
standard (IS).3. Samples should be assayed along with a standard curve in duplicate (at the beginning and end
of the sample set).4. The zero standard is prepared and assayed, but is not included in the calibration curve
regression.5. Standard curve stock solutions are prepared after correcting the standard for the salt factor.6. The standard curve should be 10–15 levels, typically ranging from 1 to 5000 or 10,000 (or
higher as needed) ng/mL. The matrix of the calibration curve should be from the same animalspecies and matrix type as the samples.
7. QC samples are not used.8. After the assay, the proper standard curve range for the samples is selected; this must include at
least five (consecutive) concentrations.
9. Once the range is selected, at least 75% of the assayed standards in the range must be includedin the regression analysis.10. Regression can be performed using weighted or unweighted linear or smooth curve fitting (e.g.,
power curve or quadratic), but is not forced through zero.11. All standards included in the regression set must be back calculated to within 27.5% of their
nominal values.12. The regression r2 must be 0.94 or larger.13. The limit of quantitation (LOQ) may be set as either the lowest standard in the selected range
or as 0.4 times the lowest standard in the selected range, but the LOQ must be greater thanthree times the mean value for the back-calculated value of the two zero standards.
14. Samples below the LOQ are reported as zero.15. If the LOQ is 0.4 times the lowest standard in the selected range, then samples with back-
calculated values between the LOQ and the lowest standard in the selected range may bereported as their calculated value provided the S/N for the analyte is at least 3.
16. Samples with back-calculated values between 1.0 and 2.0 the highest standard in theselected range are reportable by extending the calibration curve up to 2 the high standard aslong as the calibration curve regression was not performed using quadratic regression.
17. Samples found to have analyte concentrations more than 2 the highest standard in theregression set are not reportable; these samples must be reassayed after dilution or along with astandard curve that has higher concentrations so that the sample is within 2 the higheststandard.
18. The assay is not validated.19. The final data does not need to have quality assurance (QA) approval. This is an exploratory,
non-GLP study.
Bioanalytical Assays in a Drug Discovery Environment 25
Copyright © 2005 CRC Press, LLC
7/21/2019 Using Mass Spectrometry for Drug Metabolism Studies
http://slidepdf.com/reader/full/using-mass-spectrometry-for-drug-metabolism-studies 34/362
1.4 Conclusions
The current practice for the use of LC–MS/MS systems for bioanalytical assays
in a drug discovery environment is to make use of the special capabilities of
triple quadrupole mass spectrometers in a high throughput manner to provide
high quality assays without following all the requirements for having validated
(as per GLP regulations) assays. It is important to view the assay as merely
one step in the process that must take place when one is asked to providehigh quality data in a high throughput manner to support new drug discovery
needs. As both mass spectrometry and sample robotic instrumentation
improve, there will continue to be opportunities for increasing the throughput
of these discovery pharmacokinetic studies.
References
1. Kaitin, K., Total Cost to Develop a New Prescription Drug. Vol. 5(3). Tufts Center
for the Study of Drug Development, Boston, MA, 2003.
2. Beresford, A.P., Selick, H.E., and Tarbit, M.H., The emerging importance of
predictive ADME simulation in drug discovery, Drug Discov. Today, 7(2), 109, 2002.
3. Chaturvedi, P.R., Decker, C.J., and Odinecs, A., Prediction of pharmacokinetic
properties using experimental approaches during early drug discovery, Curr. Opin.
Chem. Biol., 5(4), 452, 2001.
4. Savchuk, N.P., In silico ADME-Tox as part of an optimization strategy, Curr. Drug.
Discov., (April 2003), 17, 2003.
5. Di, L. and Kerns, E.H., Profiling drug-like properties in discovery research, Curr.Opin. Chem. Biol., 7(3), 402, 2003.
6. Kerns, E.H. and Di, L., Pharmaceutical profiling in drug discovery, Drug Discov.
Today, 8(7), 316, 2003.
7. Kerns, E.H. and Di, L., Multivariate pharmaceutical profiling for drug discovery,
Curr. Top. Med. Chem., 2(1), 87, 2002.
8. Eddershaw, P.J., Beresford, A.P., and Bayliss, M.K., ADME/PK as part of a
rational approach to drug discovery, Drug Discov. Today, 5(9), 409, 2000.
Table 1.5 Additional rules for discovery (non-GLP) PK assays requiring QC samples (level III)
1. Use all the rules for full PK (level II) assays (except rule 7) plus the following rules.2. Quality control (QC) standards are required, and a minimum of six QCs at three concentrations
(low, middle, high) are to be used. The QC standards should be frozen at the same freezertemperature as the samples to be assayed.
3. The QC standards need to be traceable to a separate analyte weighing from the one used for thestandard curve standards.
4. The standard curve standards should be prepared on the same day the samples are prepared forassay. The standard curve solutions needed for this purpose may be stored in a refrigerator untilneeded for up to 6 months.
5. At least 2/3 of the QC samples must be within 25% of their prepared (nominal) values.6. If dilution of one or more samples is required for this assay, then an additional QC at the higher
level must be prepared, diluted and assayed along with the sample(s) needing dilution. This QCshould be run in duplicate and at least one of the two assay results must meet the 25% criteria.
26 Using Mass Spectrometry for Drug Metabolism Studies
Copyright © 2005 CRC Press, LLC
7/21/2019 Using Mass Spectrometry for Drug Metabolism Studies
http://slidepdf.com/reader/full/using-mass-spectrometry-for-drug-metabolism-studies 35/362
9. Caldwell, G.W., Compound optimization in early- and late-phase drug discovery:
acceptable pharmacokinetic properties utilizing combined physicochemical, in vitro
and in vivo screens, Curr. Opin. Drug Discov., 3(1), 30, 2000.
10. Lipinski, C.A., Drug-like properties and the causes of poor solubility and poor
permeability, J. Pharmacol. Toxicol. Methods, 44(1), 235, 2000.
11. Korolev, D. et al. Modeling of human cytochrome p450-mediated drug metabolism
using unsupervised machine learning approach, J. Med. Chem., 46(17), 3631, 2003.
12. Bugrim, A., Nikolskaya, T., and Nikolsky, Y., Early prediction of drug metabolism
and toxicity: systems biology approach and modeling, Drug Discov. Today, 9(3),
127, 2004.
13. Newton, C.G. and Lockey, P.M., The importance of early pharmacokinetics, Curr.
Drug Discov., (April 2003), 33, 2003.
14. Spalding, D.J.M., Harker, A.J., and Bayliss, M.K., Combining high-throughput
pharmacokinetic screens at the hits-to-leads stage of drug discovery, Drug Discov.Today, 5(12), 70, 2000.
15. Korfmacher, W.A., Lead optimization strategies as part of a drug metabolism
environment, Curr. Opin. Drug Discov. Devel., 6(4), 481, 2003.
16. Ackermann, B.L., Berna, M.J., and Murphy, A.T., Recent advances in use of LC/
MS/MS for quantitative high-throughput bioanalytical support of drug discovery,
Curr. Top. Med. Chem., 2(1), 53, 2002.
17. Cox, K.A., White, R.E., and Korfmacher, W.A., Rapid determination of
pharmacokinetic properties of new chemical entities: in vivo approaches, Comb.
Chem. High Throughput Screen, 5(1), 29, 2002.
18. Hopfgartner, G., Husser, C., and Zell, M., High-throughput quantification of drugsand their metabolites in biosamples by LC-MS/MS and CE-MS/MS: possibilities
and limitations, Ther. Drug Monit., 24(1), 134, 2002.
19. Jemal, M., High-throughput quantitative bioanalysis by LC/MS/MS, Biomed.
Chromatogr., 14(6), 422, 2000.
20. O’Connor, D., Automated sample preparation and LC-MS for high-throughput
ADME quantification, Curr. Opin. Drug Discov. Devel., 5(1), 52, 2002.
21. Papac, D.I. and Shahrokh, Z., Mass spectrometry innovations in drug discovery
and development, Pharm. Res., 18(2), 131, 2001.
22. Tarbit, M.H. and Berman, J., High-throughput approaches for evaluatingabsorption, metabolism and excretion properties of lead compounds, Curr. Opin.
Chem. Biol., 2, 411, 1998.
23. Lee, M.S. and Kerns, E.H., LC/MS applications in drug development, Mass
Spectrom. Rev., 18(3–4), 187, 1999.
24. Oliveira, E.J. and Watson, D.G., Liquid chromatography–mass spectrometry in the
study of the metabolism of drugs and other xenobiotics, Biomed. Chromatogr.,
14(6), 351, 2000.
25. Rudewicz, P.J. and Yang, L., Novel approaches to high throughput quanti-
tative LC-MS/MS in a regulated environment, Am. Pharm. Rev., 4(2), 64, 2001.
26. Kostiainen, R. et al. Liquid chromatography/atmospheric pressure ionization-massspectrometry in drug metabolism studies, J. Mass Spectrom., 38(4), 357, 2003.
27. Plumb, R.S. et al. Quantitative analysis of pharmaceuticals in biological fluids using
high-performance liquid chromatography coupled to mass spectrometry: a review,
Xenobiotica, 31(8–9), 599, 2001.
28. Niessen, W.M., Progress in liquid chromatography–mass spectrometry instrumen-
tation and its impact on high-throughput screening, J. Chromatogr., A, 1000(1–2),
413, 2003.
Bioanalytical Assays in a Drug Discovery Environment 27
Copyright © 2005 CRC Press, LLC
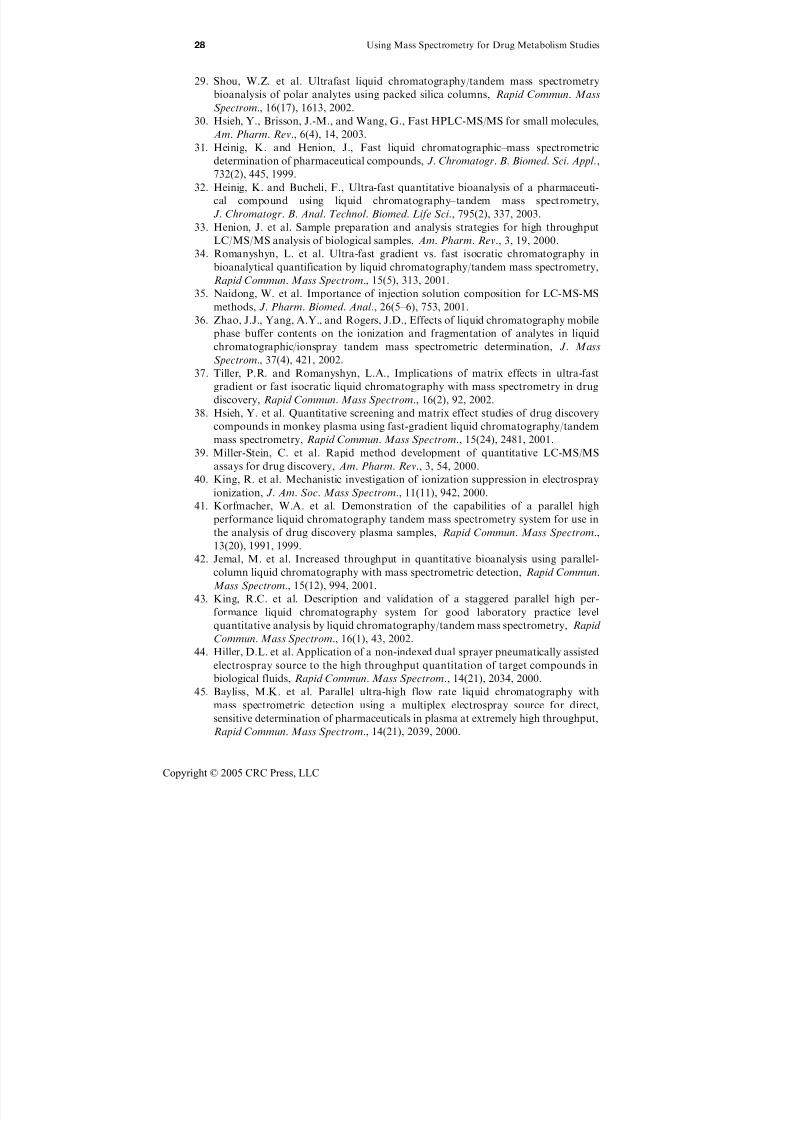
7/21/2019 Using Mass Spectrometry for Drug Metabolism Studies
http://slidepdf.com/reader/full/using-mass-spectrometry-for-drug-metabolism-studies 36/362
29. Shou, W.Z. et al. Ultrafast liquid chromatography/tandem mass spectrometry
bioanalysis of polar analytes using packed silica columns, Rapid Commun. Mass
Spectrom., 16(17), 1613, 2002.
30. Hsieh, Y., Brisson, J.-M., and Wang, G., Fast HPLC-MS/MS for small molecules,
Am. Pharm. Rev., 6(4), 14, 2003.
31. Heinig, K. and Henion, J., Fast liquid chromatographic–mass spectrometric
determination of pharmaceutical compounds, J. Chromatogr. B. Biomed. Sci. Appl.,
732(2), 445, 1999.
32. Heinig, K. and Bucheli, F., Ultra-fast quantitative bioanalysis of a pharmaceuti-
cal compound using liquid chromatography–tandem mass spectrometry,
J. Chromatogr. B. Anal. Technol. Biomed. Life Sci., 795(2), 337, 2003.
33. Henion, J. et al. Sample preparation and analysis strategies for high throughput
LC/MS/MS analysis of biological samples, Am. Pharm. Rev., 3, 19, 2000.
34. Romanyshyn, L. et al. Ultra-fast gradient vs. fast isocratic chromatography inbioanalytical quantification by liquid chromatography/tandem mass spectrometry,
Rapid Commun. Mass Spectrom., 15(5), 313, 2001.
35. Naidong, W. et al. Importance of injection solution composition for LC-MS-MS
methods, J. Pharm. Biomed. Anal., 26(5–6), 753, 2001.
36. Zhao, J.J., Yang, A.Y., and Rogers, J.D., Effects of liquid chromatography mobile
phase buffer contents on the ionization and fragmentation of analytes in liquid
chromatographic/ionspray tandem mass spectrometric determination, J. Mass
Spectrom., 37(4), 421, 2002.
37. Tiller, P.R. and Romanyshyn, L.A., Implications of matrix effects in ultra-fast
gradient or fast isocratic liquid chromatography with mass spectrometry in drugdiscovery, Rapid Commun. Mass Spectrom., 16(2), 92, 2002.
38. Hsieh, Y. et al. Quantitative screening and matrix effect studies of drug discovery
compounds in monkey plasma using fast-gradient liquid chromatography/tandem
mass spectrometry, Rapid Commun. Mass Spectrom., 15(24), 2481, 2001.
39. Miller-Stein, C. et al. Rapid method development of quantitative LC-MS/MS
assays for drug discovery, Am. Pharm. Rev., 3, 54, 2000.
40. King, R. et al. Mechanistic investigation of ionization suppression in electrospray
ionization, J. Am. Soc. Mass Spectrom., 11(11), 942, 2000.
41. Korfmacher, W.A. et al. Demonstration of the capabilities of a parallel highperformance liquid chromatography tandem mass spectrometry system for use in
the analysis of drug discovery plasma samples, Rapid Commun. Mass Spectrom.,
13(20), 1991, 1999.
42. Jemal, M. et al. Increased throughput in quantitative bioanalysis using parallel-
column liquid chromatography with mass spectrometric detection, Rapid Commun.
Mass Spectrom., 15(12), 994, 2001.
43. King, R.C. et al. Description and validation of a staggered parallel high per-
formance liquid chromatography system for good laboratory practice level
quantitative analysis by liquid chromatography/tandem mass spectrometry, Rapid
Commun. Mass Spectrom., 16(1), 43, 2002.44. Hiller, D.L. et al. Application of a non-indexed dual sprayer pneumatically assisted
electrospray source to the high throughput quantitation of target compounds in
biological fluids, Rapid Commun. Mass Spectrom., 14(21), 2034, 2000.
45. Bayliss, M.K. et al. Parallel ultra-high flow rate liquid chromatography with
mass spectrometric detection using a multiplex electrospray source for direct,
sensitive determination of pharmaceuticals in plasma at extremely high throughput,
Rapid Commun. Mass Spectrom., 14(21), 2039, 2000.
28 Using Mass Spectrometry for Drug Metabolism Studies
Copyright © 2005 CRC Press, LLC
7/21/2019 Using Mass Spectrometry for Drug Metabolism Studies
http://slidepdf.com/reader/full/using-mass-spectrometry-for-drug-metabolism-studies 37/362
46. Deng, Y. et al. High-speed gradient parallel liquid chromatography/tandem
mass spectrometry with fully automated sample preparation for bioanalysis: 30
seconds per sample from plasma, Rapid Commun. Mass Spectrom., 16(11), 1116,
2002.
47. Yang, L. et al. Evaluation of a four-channel multiplexed electrospray triple
quadrupole mass spectrometer for the simultaneous validation of LC/MS/MS
methods in four different preclinical matrixes, Anal. Chem., 73(8), 1740, 2001.
48. Xia, Y.Q. et al. Parallel extraction columns and parallel analytical columns coupled
with liquid chromatography/tandem mass spectrometry for on-line simultaneous
quantification of a drug candidate and its six metabolites in dog plasma, Rapid
Commun. Mass Spectrom., 15(22), 2135, 2001.
49. Deng, Y. et al. Multiple-sprayer tandem mass spectrometry with parallel high flow
extraction and parallel separation for high-throughput quantitation in biological
fluids, Rapid Commun. Mass Spectrom., 15(17), 1634, 2001.50. Murphy, A.T. et al. Effects of flow rate on high-throughput quantitative
analysis of protein-precipitated plasma using liquid chromatography/tandem
mass spectrometry, Rapid Commun. Mass Spectrom., 16(6), 537, 2002.
51. Dams, R. et al. Influence of the eluent composition on the ionization efficiency
for morphine of pneumatically assisted electrospray, atmospheric-pressure
chemical ionization and sonic spray, Rapid Commun. Mass Spectrom., 16(11),
1072, 2002.
52. Jemal, M. and Hawthorne, D.J., Effect of high performance liquid chroma-
tography mobile phase (methanol versus acetonitrile) on the positive and negative
ion electrospray response of a compound that contains both an unsaturatedlactone and a methyl sulfone group, Rapid Commun. Mass Spectrom., 13(1), 61,
1999.
53. Seliniotakis, E. et al. The use of post column addition to improve signal response
and reduce matrix effects in bioanalytical LC/MS/MS assays, in ASMS Conference
on Mass Spectrometry and Allied Topics, Montreal, Canada, 2003, ASMS.
54. Wu, J.T. et al. High-speed liquid chromatography/tandem mass spectrometry using
a monolithic column for high-throughput bioanalysis, Rapid Commun. Mass
Spectrom., 15(13), 1113, 2001.
55. van Nederkassel, A.M. et al. Fast separations on monolithic silica columns: methodtransfer, robustness and column ageing for some case studies, J. Pharm. Biomed.
Anal., 32(2), 233, 2003.
56. Smith, J.H. and McNair, H.M., Fast HPLC with a silica-based monolithic ODS
Column, J. Chromatogr. Sci., 41(4), 209, 2003.
57. Hsieh, Y. et al. Simultaneous determination of a drug candidate and its metabolite
in rat plasma samples using ultrafast monolithic column high-performance liquid
chromatography/tandem mass spectrometry, Rapid Commun. Mass Spectrom.,
16(10), 944, 2002.
58. Hsieh, Y. et al. Direct plasma analysis of drug compounds using monolithic column
liquid chromatography and tandem mass spectrometry, Anal. Chem., 75(8), 1812,2003.
59. Peng, S.X., Barbone, A.G., and Ritchie, D.M., High-throughput cytochrome p450
inhibition assays by ultrafast gradient liquid chromatography with tandem mass
spectrometry using monolithic columns, Rapid Commun. Mass Spectrom., 17(6),
509, 2003.
60. Tanaka, N. et al. Monolithic LC columns, Anal. Chem., 73(15), 420A,
2001.
Bioanalytical Assays in a Drug Discovery Environment 29
Copyright © 2005 CRC Press, LLC
7/21/2019 Using Mass Spectrometry for Drug Metabolism Studies
http://slidepdf.com/reader/full/using-mass-spectrometry-for-drug-metabolism-studies 38/362
61. Vallano, P.T. et al. Monolithic silica liquid chromatography columns for the
determination of cyclooxygenase II inhibitors in human plasma, J. Chromatogr., B:
Anal. Technol. Biomed. Life Sci., 779(2), 249, 2002.
62. Hsieh, Y., Merkle, K., and Wang, G., Zirconia-based column high performance
liquid chromatography/atmospheric pressure photoionization tandem mass spec-
trometric analyses of drug molecules in rat plasma, Rapid Commun. Mass
Spectrom., 17, 1775, 2003.
63. Jemal, M. and Xia, Y.Q., The need for adequate chromatographic separation in the
quantitative determination of drugs in biological samples by high performance
liquid chromatography with tandem mass spectrometry, Rapid Commun. Mass
Spectrom., 13(2), 97, 1999.
64. Yan, Z. et al. Cone voltage induced in-source dissociation of glucuronides in
electrospray and implications in biological analyses, Rapid Commun. Mass
Spectrom., 17(13), 1433, 2003.65. Liu, D.Q. and Pereira, T., Interference of a carbamoyl glucuronide metabolite in
quantitative liquid chromatography/tandem mass spectrometry, Rapid Commun.
Mass. Spectrom., 16(2), 142, 2002.
66. Tiller, P.R. and Romanyshyn, L.A., Liquid chromatography/tandem mass
spectrometric quantification with metabolite screening as a strategy to enhance
the early drug discovery process, Rapid Commun. Mass Spectrom., 16(12), 1225,
2002.
67. Poon, G.K. et al. Integrating qualitative and quantitative liquid chromatography/
tandem mass spectrometric analysis to support drug discovery, Rapid Commun.
Mass Spectrom., 13(19), 1943, 1999.68. Wainhaus, S.B. et al. Semi-quantitation of acyl glucuronides in early drug discovery
by LC-MS/MS, Am. Pharm. Rev., 5(2), 86, 2002.
69. Tong, W. et al. Fragmentation of N-oxides (deoxygenation) in atmospheric
pressure ionization: investigation of the activation process, Rapid Commun. Mass.
Spectrom., 15(22), 2085, 2001.
70. Ramanathan, R. et al. Liquid chromatography/mass spectrometry methods for
distinguishing N-oxides from hydroxylated compounds, Anal. Chem., 72(6), 1352,
2000.
71. Jemal, M., Ouyang, Z., and Powell, M.L., A strategy for a post-method-validationuse of incurred biological samples for establishing the acceptability of a liquid
chromatography/tandem mass-spectrometric method for quantitation of drugs in
biological samples, Rapid Commun. Mass Spectrom., 16(16), 1538, 2002.
72. Cox, K.A. et al. Higher throughput metabolite identification in drug discovery:
current capabilities and future trends, Am. Pharm. Rev., 4(1), 45, 2001.
73. Clarke, N.J. et al. Systematic LC/MS metabolite identification in drug discovery,
Anal. Chem., 73(15), 430A, 2001.
74. Ramanathan, R. et al. Application of semi-automated metabolite identification
software in the drug discovery process for rapid identification of metabolites and
the cytochrome P450 enzymes responsible for their formation, J. Pharm. Biomed.Anal., 28(5), 945, 2002.
75. Nassar, A.E. and Adams, P.E., Metabolite characterization in drug discovery
utilizing robotic liquid-handling, quadrupole time-of-flight mass spectrometry and
in-silico prediction, Curr. Drug Metab., 4(4), 259, 2003.
76. Jemal, M. et al. A strategy for metabolite identification using triple-quadrupole
mass spectrometry with enhanced resolution and accurate mass capability, Rapid
Commun. Mass Spectrom., 17(24), 2732, 2003.
30 Using Mass Spectrometry for Drug Metabolism Studies
Copyright © 2005 CRC Press, LLC
7/21/2019 Using Mass Spectrometry for Drug Metabolism Studies
http://slidepdf.com/reader/full/using-mass-spectrometry-for-drug-metabolism-studies 39/362
77. Eerkes, A., Shou, W.Z., and Naidong, W., Liquid/liquid extraction using 96-well
plate format in conjunction with hydrophilic interaction liquid chromatography–
tandem mass spectrometry method for the analysis of fluconazole in human plasma,
J. Pharm. Biomed. Anal., 31(5), 917, 2003.
78. Chen, Y.L. et al. Determination of ketoconazole in human plasma by high-
performance liquid chromatography–tandem mass spectrometry, J. Chromatogr.,
B: Anal. Technol. Biomed. Life Sci., 774(1), 67, 2002.
79. Brignol, N. et al. High-throughput semi-automated 96-well liquid/liquid extraction
and liquid chromatography/mass spectrometric analysis of everolimus (RAD 001)
and cyclosporin a (CsA) in whole blood, Rapid Commun. Mass Spectrom., 15(12),
898, 2001.
80. Naidong, W. et al. Liquid chromatography/tandem mass spectrometric bioanalysis
using normal-phase columns with aqueous/organic mobile phases—a novel
approach of eliminating evaporation and reconstitution steps in 96-well SPE,Rapid Commun. Mass Spectrom., 16(20), 1965, 2002.
81. Chen, Y.L. et al. Simultaneous determination of hydrocodone and hydromor-
phone in human plasma by liquid chromatography with tandem mass spectro-
metric detection, J. Chromatogr., B: Anal. Technol. Biomed. Life Sci., 769(1), 55,
2002.
82. Shou, W.Z. et al. An automatic 96-well solid phase extraction and liquid
chromatography–tandem mass spectrometry method for the analysis of morphine,
morphine-3-glucuronide and morphine-6-glucuronide in human plasma, J. Pharm.
Biomed. Anal., 27(1–2), 143, 2002.
83. Shou, W.Z. et al. A highly automated 96-well solid phase extraction and liquidchromatography/tandem mass spectrometry method for the determination of
fentanyl in human plasma, Rapid Commun. Mass Spectrom., 15(7), 466, 2001.
84. Schuster, A. et al. Quantitative determination of the HIV protease inhibitor
atazanavir (BMS-232632) in human plasma by liquid chromatography–tandem
mass spectrometry following automated solid-phase extraction, J. Chromatogr., B:
Anal. Technol. Biomed. Life Sci., 788(2), 377, 2003.
85. Yang, L. et al. Validation of a sensitive and automated 96-well solid-phase
extraction liquid chromatography–tandem mass spectrometry method for the
determination of desloratadine and 3-hydroxydesloratadine in human plasma, J.Chromatogr. B. Anal. Technol. Biomed. Life Sci., 792(2), 229, 2003.
86. Korfmacher, W.A. et al. HPLC-API/MS/MS: a powerful tool for integrat-
ing drug metabolism into the drug discovery process, Drug Discov. Today, 2, 532,
1997.
87. Korfmacher, W.A. et al. Cassette-accelerated rapid rat screen: a systematic
procedure for the dosing and liquid chromatography/atmospheric pressure
ionization tandem mass spectrometric analysis of new chemical entities as part of
new drug discovery, Rapid Commun. Mass Spectrom., 15(5), 335, 2001.
88. Shou, W.Z. et al. Development and validation of a liquid chromatography/tandem
mass spectrometry (LC/MS/MS) method for the determination of ribavirin inhuman plasma and serum, J. Pharm. Biomed. Anal., 29(1–2), 83, 2002.
89. Watt, A.P. et al. Higher throughput bioanalysis by automation of a protein
precipitation assay using a 96-well format with detection by LC-MS/MS, Anal.
Chem., 72(5), 979, 2000.
90. Berna, M. et al. Collection, storage, and filtration of in vivo study samples using 96-
well filter plates to facilitate automated sample preparation and LC/MS/MS
analysis, Anal. Chem., 74(5), 1197, 2002.
Bioanalytical Assays in a Drug Discovery Environment 31
Copyright © 2005 CRC Press, LLC
7/21/2019 Using Mass Spectrometry for Drug Metabolism Studies
http://slidepdf.com/reader/full/using-mass-spectrometry-for-drug-metabolism-studies 40/362
91. Sadagopan, N.P. et al. Investigation of EDTA anticoagulant in plasma to improve
the throughput of liquid chromatography/tandem mass spectrometric assays,
Rapid Commun. Mass Spectrom., 17(10), 1065, 2003.
92. Mallet, C.R., Mazzeo, J.R., and Neue, U., Evaluation of several solid phase
extraction liquid chromatography/tandem mass spectrometry on-line configura-
tions for high-throughput analysis of acidic and basic drugs in rat plasma, Rapid
Commun. Mass Spectrom., 15(13), 1075, 2001.
93. Mallet, C.R. et al. Performance of an ultra-low elution-volume 96-well plate: drug
discovery and development applications, Rapid Commun. Mass Spectrom., 17(2),
163, 2003.
94. Ackermann, B.L., Murphy, A.T., and Berna, M.J., The resurgence of column
switching techniques to facilitate rapid LC/MS/MS based bioanalysis in drug
discovery, Am. Pharm. Rev., 5(1), 54, 2002.
95. Wu, J.T., The development of a staggered parallel separation liquid chromatog-raphy/tandem mass spectrometry system with on-line extraction for high-
throughout screening of drug candidates in biological fluids, Rapid Commun.
Mass Spectrom., 15(2), 73, 2001.
96. Kerns, E.H. et al. Integrated high capacity solid phase extraction–MS/MS system
for pharmaceutical profiling in drug discovery, J. Pharm. Biomed. Anal., 34(1), 1,
2004.
97. Cass, R.T. et al. Rapid bioanalysis of vancomycin in serum and urine by
high-performance liquid chromatography tandem mass spectrometry using on-line
sample extraction and parallel analytical columns, Rapid Commun. Mass
Spectrom., 15(6), 406, 2001.98. Higton, D.M., A rapid, automated approach to optimisation of multiple reaction
monitoring conditions for quantitative bioanalytical mass spectrometry, Rapid
Commun. Mass Spectrom., 15(20), 1922, 2001.
99. Whalen, K.M. et al. AutoScan: an automated workstation for rapid determina-
tion of mass and tandem mass spectrometry conditions for quantitative
bioanalytical mass spectrometry, Rapid Commun. Mass Spectrom., 14(21), 2074,
2000.
100. Locker, K.L., Morrison, D., and Watt, A.P., Quantitative determination of
L-775,606, a selective 5-hydroxytryptamine 1D agonist, in rat plasma usingautomated sample preparation and detection by liquid chromatography–
tandem mass spectrometry, J. Chromatogr., B: Biomed. Sci. Appl., 750(1), 13,
2001.
101. Matuszewski, B.K., Constanzer, M.L., and Chavez-Eng, C.M., Matrix effect in
quantitative LC/MS/MS analyses of biological fluids: a method for determination
of finasteride in human plasma at picogram per milliliter concentrations, Anal.
Chem., 70(5), 882, 1998.
102. Matuszewski, B.K., Constanzer, M.L., and Chavez-Eng, C.M., Strategies for the
assessment of matrix effect in quantitative bioanalytical methods based on HPLC-
MS/MS, Anal. Chem., 75(13), 3019, 2003.103. Mei, H. et al. Investigation of matrix effects in bioanalytical high-performance
liquid chromatography/tandem mass spectrometric assays: application to drug
discovery, Rapid Commun. Mass Spectrom., 17(1), 97, 2003.
104. Schuhmacher, J. et al. Matrix effects during analysis of plasma samples by
electrospray and atmospheric pressure chemical ionization mass spectrometry:
practical approaches to their elimination, Rapid Commun. Mass Spectrom., 17(17),
1950, 2003.
32 Using Mass Spectrometry for Drug Metabolism Studies
Copyright © 2005 CRC Press, LLC
7/21/2019 Using Mass Spectrometry for Drug Metabolism Studies
http://slidepdf.com/reader/full/using-mass-spectrometry-for-drug-metabolism-studies 41/362
105. Mallet, C.R., Lu, Z., and Mazzeo, J.R., A study of ion suppression effects in
electrospray ionization from mobile phase additives and solid-phase extracts,
Rapid Commun. Mass. Spectrom., 18(1), 49, 2004.
106. Liang, H.R. et al. Ionization enhancement in atmospheric pressure chemical
ionization and suppression in electrospray ionization between target drugs
and stable-isotope-labeled internal standards in quantitative liquid chromatog-
raphy/tandem mass spectrometry, Rapid Commun. Mass Spectrom., 17(24), 2815,
2003.
107. Muller, C. et al. Ion suppression effects in liquid chromatography–electrospray–
ionisation transport-region collision induced dissociation mass spectrometry with
different serum extraction methods for systematic toxicological analysis with mass
spectra libraries, J. Chromatogr., B: Anal. Technol. Biomed. Life Sci., 773(1), 47,
2002.
108. Avery, M.J., Quantitative characterization of differential ion suppression on liquidchromatography/atmospheric pressure ionization mass spectrometric bioanalytical
methods, Rapid Commun. Mass Spectrom., 17(3), 197, 2003.
109. Shou, W.Z. and Naidong, W., Post-column infusion study of the ‘dosing vehicle
effect’ in the liquid chromatography/tandem mass spectrometric analysis of
discovery pharmacokinetic samples, Rapid Commun. Mass Spectrom., 17(6), 589,
2003.
110. Jemal, M., Schuster, A., and Whigan, D.B., Liquid chromatography/tandem mass
spectrometry methods for quantitation of mevalonic acid in human plasma and
urine: method validation, demonstration of using a surrogate analyte,
and demonstration of unacceptable matrix effect in spite of use of a stableisotope analog internal standard, Rapid Commun. Mass Spectrom., 17(15), 1723,
2003.
111. Jemal, M. and Ouyang, Z., Enhanced resolution triple-quadrupole mass spectrom-
etry for fast quantitative bioanalysis using liquid chromatography/tandem mass
spectrometry: investigations of parameters that affect ruggedness, Rapid Commun.
Mass Spectrom., 17(1), 24, 2003.
112. Yang, L. et al. Investigation of an enhanced resolution triple quadrupole mass
spectrometer for high-throughput liquid chromatography/tandem mass spectrom-
etry assays, Rapid Commun. Mass Spectrom., 16(21), 2060, 2002.113. Xu, X., Veals, J., and Korfmacher, W.A., Comparison of conventional and
enhanced mass resolution triple-quadrupole mass spectrometers for discovery
bioanalytical applications, Rapid Commun. Mass Spectrom., 17(8), 832, 2003.
114. Hsieh, Y. et al. High-performance liquid chromatography–atmospheric pressure
photoionization/tandem mass spectrometric analysis for small molecules in
plasma, Anal. Chem., 75(13), 3122, 2003.
115. Raffaelli, A. and Saba, A., Atmospheric pressure photoionization mass spectrom-
etry, Mass Spectrom. Rev., 22(5), 318, 2003.
116. Yang, C. and Henion, J., Atmospheric pressure photoionization liquid chromato-
graphic–mass spectrometric determination of idoxifene and its metabolites inhuman plasma, J. Chromatogr., A, 970(1–2), 155, 2002.
117. Xia, Y.Q. et al. Use of a quadrupole linear ion trap mass spectrometer in
metabolite identification and bioanalysis, Rapid Commun. Mass Spectrom., 17(11),
1137, 2003.
118. Dethy, J.M. et al. Demonstration of direct bioanalysis of drugs in plasma using
nanoelectrospray infusion from a silicon chip coupled with tandem mass
spectrometry, Anal. Chem., 75(4), 805, 2003.
Bioanalytical Assays in a Drug Discovery Environment 33
Copyright © 2005 CRC Press, LLC
7/21/2019 Using Mass Spectrometry for Drug Metabolism Studies
http://slidepdf.com/reader/full/using-mass-spectrometry-for-drug-metabolism-studies 42/362
119. Kapron, J.T. et al. Quantitation of midazolam in human plasma by automated
chip-based infusion nanoelectrospray tandem mass spectrometry, Rapid Commun.
Mass Spectrom., 17(18), 2019, 2003.
120. Brotherton, H.O. and Yost, R.A., Determination of drugs in blood serum by mass
spectrometry/mass spectrometry, Anal. Chem., 55(3), 549, 1983.
121. Shabir, G.A., Validation of high-performance liquid chromatography methods for
pharmaceutical analysis. Understanding the differences and similarities between
validation requirements of the US Food and Drug Administration, the US
Pharmacopeia and the International Conference on Harmonization,
J. Chromatogr., A, 987(1–2), 57, 2003.
122. Bajpai, M. and Esmay, J.D., In vitro studies in drug discovery and development:
an analysis of study objectives and application of good laboratory practices
(GLP), Drug Metab. Rev., 34(4), 679, 2002.
34 Using Mass Spectrometry for Drug Metabolism Studies
Copyright © 2005 CRC Press, LLC

7/21/2019 Using Mass Spectrometry for Drug Metabolism Studies
http://slidepdf.com/reader/full/using-mass-spectrometry-for-drug-metabolism-studies 43/362
Chapter 2
Drug Metabolism In Vitro and In Vivo Results: How Do these Data
Support Drug Discovery?
Thomas N. Thompson
2.1 Introduction
2.1.1 Scope
The application of drug metabolism and pharmacokinetic (DMPK) principles
to drug design is hardly a new concept. Throughout the past three decades,numerous reviews have documented examples of how DMPK data have
influenced drug design [1–7]. Several recent reviews have put this concept in the
context of current drug discovery in the new era of combinatorial chemistry
and high-throughput screening (HTS) [8–18]. The purpose of this chapter is
two-fold: (1) to summarize some of key points relating drug structure to
DMPK properties that have been made by these earlier reviews, and (2) to
review selected examples of new technologies that will facilitate the evaluation
of DMPK properties as part of the lead optimization process.
The emphasis of this review is on experimental techniques, particularly
those that utilize LC–MS as the mode of analysis. Therefore, although
so-called in silico techniques are making strides towards becoming a very
important tool in the effort to optimize DMPK properties, they will not be
reviewed here. The reader is referred to two excellent recent reviews for more
0-8493-1963-3/05/$0.00+$1.50 2005 by CRC Press 35
Copyright © 2005 CRC Press, LLC

7/21/2019 Using Mass Spectrometry for Drug Metabolism Studies
http://slidepdf.com/reader/full/using-mass-spectrometry-for-drug-metabolism-studies 44/362
information on in silico methods [19, 20]. Likewise, other kinds of metabolism
studies which address the potential for drug interactions, including enzyme
inhibition, enzyme induction and enzyme mapping studies (also known as
reaction phenotyping), have recently been reviewed elsewhere [21, 22], so theywill not be treated in any detail here.
2.1.2 Perspective on modern drug discovery
The process by which drugs are developed from discovery to regulatory
approval is inherently inefficient. By one estimate, 90% of all drugs in clinical
development fail to make it to the market place [23]. As shown in Figure 2.1,
among the reasons for this are poor pharmacokinetics (40%), poor clinical
efficacy (30%), toxicity (animals or humans, 20%) or other unspecified causes(10%). Given the inherent inefficiency of the development process, research
programs have a mandate to continually improve the discovery process to
ensure a higher quality in the prospective drugs that make it through to clinical
development, thereby improving the ultimate rate of successful submission [24].
One solution is the ‘‘sheer numbers’’ approach whereby increasingly more
compounds are driven through the process. While this approach presumably
results in more drugs with suitable clinical efficacy surviving to NDA
submission, it does little to improve the efficiency of this process. Moreover,
it does nothing to address the failure rate accounted for by PK and toxicityfactors. Thus, it has been recognized that the ability to improve the DMPK
profiles of leads is a strategic necessity in order to help minimize the number
failed leads [8].
Although it is understandable that many drugs fail because of toxicity
or lack of efficacy, it is not immediately obvious why in Prentis’ study the
single largest factor for failure in clinical development was due to poor
Figure 2.1 Common reasons for drugs to fail in clinical trials [8].
36 Using Mass Spectrometry for Drug Metabolism Studies
Copyright © 2005 CRC Press, LLC
7/21/2019 Using Mass Spectrometry for Drug Metabolism Studies
http://slidepdf.com/reader/full/using-mass-spectrometry-for-drug-metabolism-studies 45/362
pharmacokinetics. One possible explanation is that toxicity or lack of efficacy
is easier to detect in preclinical development. Ironically, another explanation
may lie in the previously mentioned improvements in the drug discovery
process. As the endeavor to find new drugs progressed from empirical dis-covery to rational design, a disconnect began to develop between the intrinsic
activity of a drug towards its biochemical target in vitro and biological activity
in vivo. The best explanation for this is that, in empirical drug discovery, drugs
are discovered after they are observed to be effective in an animal model of
disease. Of necessity, this demanded at least some level of a useful pharmaco-
kinetic profile. However, the desire for a more rational approach drove the
demand for ever-increasing amounts of data in order to derive structure
activity relationships. In turn, this led to an increasing reliance on in vitro
methods to provide the amount of data with the appropriate cycle time to feedthe iterative design process [11].
To further complicate the picture, chemists either did not yet appreciate the
importance of pharmacokinetics for in vivo activity, or, if they did, were
resigned that little could be done to influence pharmacokinetic properties.
As a result, too many drug candidates were developed based solely on their
ability to inhibit an enzyme or interact with a receptor with optimized in vitro
affinity, only to fail in the clinic because of unfavorable pharmacokinetic
parameters [25].
2.1.3 A rational approach to early screening for
DMPK properties
Drug discovery teams today have an impressive array of biological targets,
biochemical techniques to refine and exploit those targets and synthetic,
analytical and computational chemistry tools to design and prepare new
molecules. However, it is only comparatively recently have we been able to
automate pharmacokinetic screening to evaluate many potential drug
candidates in parallel [8, 9, 11, 26, 27].
For the first time, significant tools are now available to help define DMPK
properties either at the very point of drug design, or at least during lead
optimization. The availability of these tools has led to the realization that it is
now feasible to optimize the pharmacokinetic properties of drug candidates
with rational application of DMPK principles. For example, an in vivo efficacy
problem (lack of potency or short duration of action) can often be redefined
as a pharmacokinetic problem (e.g., low oral bioavailability, short plasma
half-life) in relevant in vitro or in vivo models. Of course, in order to use this
information to solve the problem, one has to assign selection criteria such as
threshold intrinsic clearances (CLint), inhibition constants (K i or IC50) or
permeability coefficients (Papp) for a given series of compounds. While this
takes extra time and other resources, it is obviously a far preferable position
than to have to fail molecules with poor DMPK properties later in
development. As stated by Tarbit and Berman, it is better to ‘‘fail fast, but
fail cheap’’ [28].
Drug Metabolism In Vitro and In Vivo Results 37
Copyright © 2005 CRC Press, LLC

7/21/2019 Using Mass Spectrometry for Drug Metabolism Studies
http://slidepdf.com/reader/full/using-mass-spectrometry-for-drug-metabolism-studies 46/362
2.1.3.1 Strategic considerations for incorporating early DMPK data
Powerful new high-throughput techniques notwithstanding, without a careful,
comprehensive strategy for their use, there is a danger that discovery scientistswill be inundated with more information than they can use in a timely, rational
manner. The same conclusion has been reached by other authors who have
recently written about opportunities to bring DMPK data into the discovery
process at an earlier point [11]. For example, Rodrigues called for a rational
HTS strategy based on automation, validation and integration of in vitro
absorption–metabolism (AM) models and database management (AVID)
[26, 27]. Tarbit and Berman make a similar point when they refer to
implementation of a strategy with potentially several iterations through a
‘‘virtuous cycle’’ of drug design, automated screens, data capture and dataanalysis [28]. This iteration allows optimization of drug design with respect to
DMPK properties as well as biological activity.
There is a trade-off when using pharmacokinetics to select drug candidates.
The time spent optimizing PK properties may come at the expense of time
spent optimizing affinity for the primary target. Chemists may need to accept
hand-in-mitten fits between their synthetic ligands and their targets rather than
hand-in-glove fits. As a result, we may learn less about special interactions
between ligands and receptors that might lead to high-affinity ligand–receptor
complexes, but the payoff will be in improved activity in vivo [25].Eddershaw and Dickins [21] discussed at some length the question of
whether the resources required to apply high-throughput techniques to
optimizing PK properties is worth the effort. As they point out, there has
been some debate over whether high-throughput DMPK screening is even a
good idea. The charge is that such approaches ‘‘de-intellectualize’’ the process
of candidate optimization and should therefore be resisted. However, these
authors maintain that this viewpoint fails to appreciate the enormous
opportunities provided by such systems for increasing our understanding of
the fundamental physicochemical and enzymatic factors that govern drug
metabolism. If we accept the challenge to study large, diverse compound sets
using well-defined and controlled methods, this in turn will provide reliable
data that can be used to develop computational models that describe various
aspects of drug metabolism. In this way, the drug metabolism scientist can have
a much greater ‘‘intellectual’’ influence on the drug design process than has
hitherto been possible.
2.1.3.2 Selection of the right drug metabolism tools suitable for early
DMPK studies
If the first major decision is one of strategy for using DMPK data, the second
major decision involves selection of the proper tool(s) at the proper time [8, 11].
Because many of these techniques have been recently discussed elsewhere
[16, 29, 30], few experimental details will be presented here. Table 2.1 serves as
a reminder that a continuum of techniques is available ranging from theoretical
38 Using Mass Spectrometry for Drug Metabolism Studies
Copyright © 2005 CRC Press, LLC
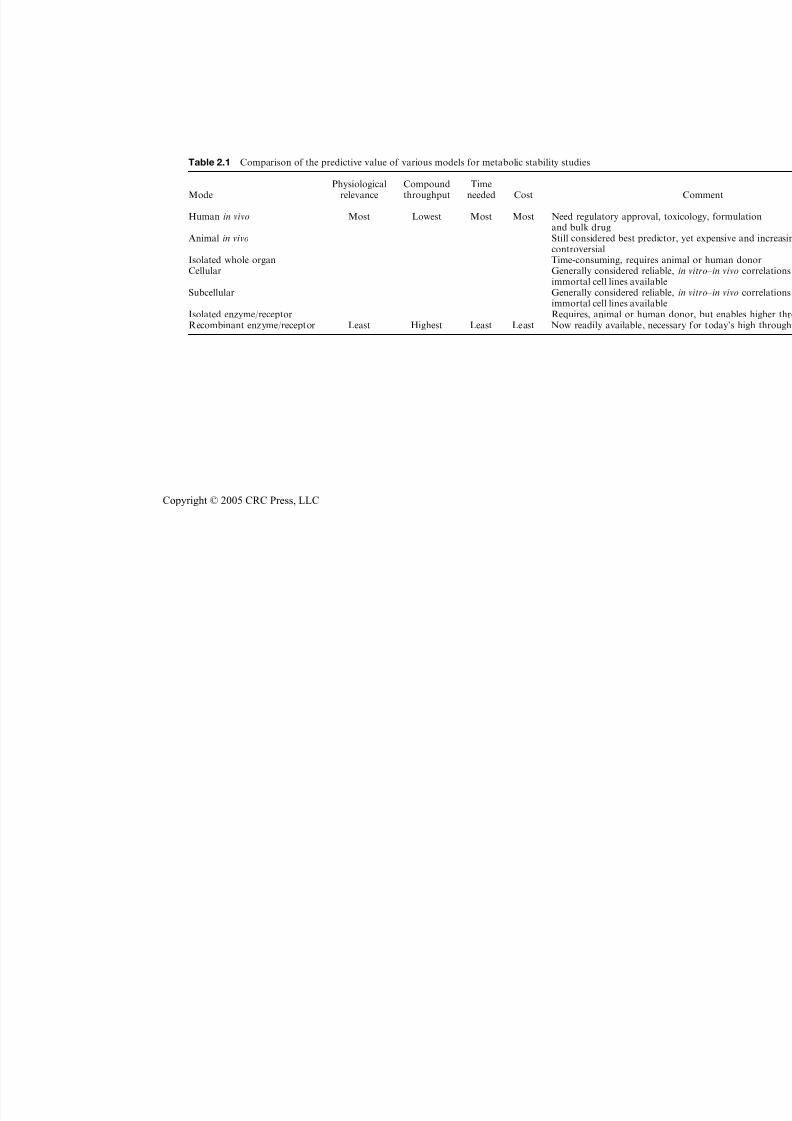
7/21/2019 Using Mass Spectrometry for Drug Metabolism Studies
http://slidepdf.com/reader/full/using-mass-spectrometry-for-drug-metabolism-studies 47/362
Table 2.1 Comparison of the predictive value of various models for metabolic stability studies
ModePhysiological
relevanceCompoundthroughput
Timeneeded Cost
Human in vivo Most Lowest Most Most Need regulatory approvaand bulk drug
Animal in vivo Still considered best predcontroversial
Isolated whole organ Time-consuming, requireCellular Generally considered reli
immortal cell lines availaSubcellular Generally considered reli
immortal cell lines availaIsolated enzyme/receptor Requires, animal or humRecombinant enzyme/receptor Least Highest Least Least Now readily available, n
Copyright © 2005 CRC Press, LLC
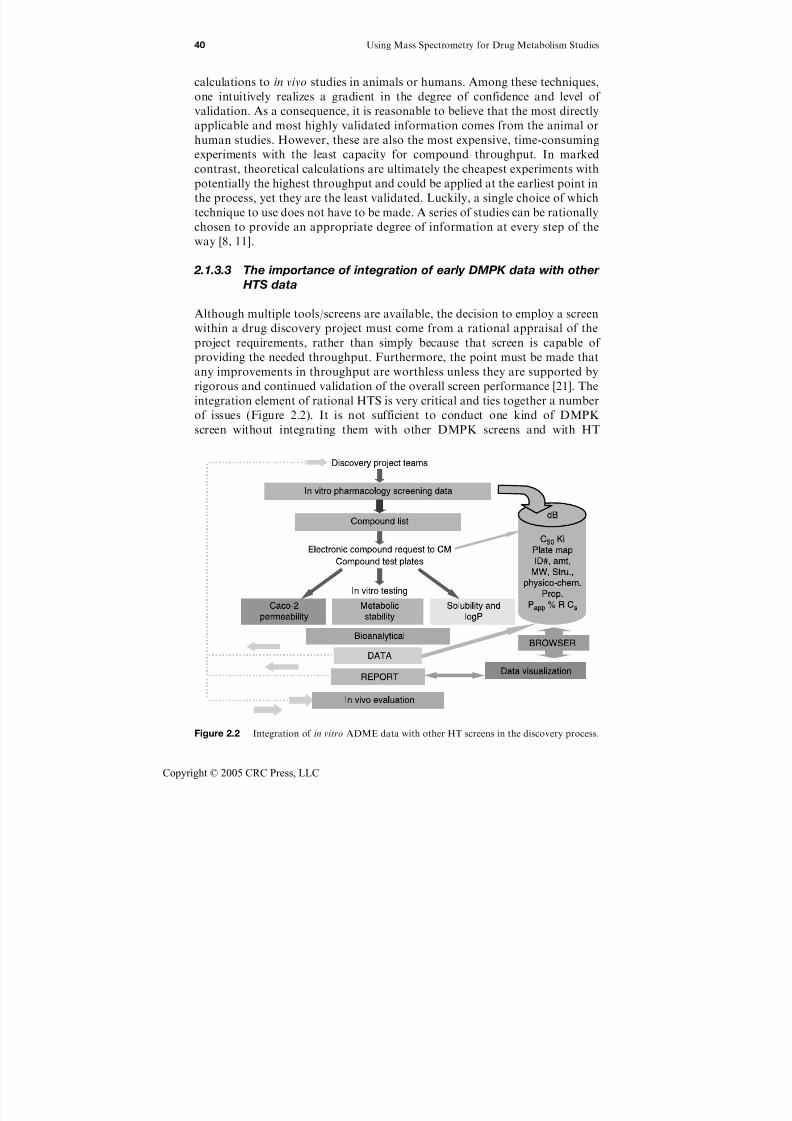
7/21/2019 Using Mass Spectrometry for Drug Metabolism Studies
http://slidepdf.com/reader/full/using-mass-spectrometry-for-drug-metabolism-studies 48/362
calculations to in vivo studies in animals or humans. Among these techniques,
one intuitively realizes a gradient in the degree of confidence and level of
validation. As a consequence, it is reasonable to believe that the most directly
applicable and most highly validated information comes from the animal orhuman studies. However, these are also the most expensive, time-consuming
experiments with the least capacity for compound throughput. In marked
contrast, theoretical calculations are ultimately the cheapest experiments with
potentially the highest throughput and could be applied at the earliest point in
the process, yet they are the least validated. Luckily, a single choice of which
technique to use does not have to be made. A series of studies can be rationally
chosen to provide an appropriate degree of information at every step of the
way [8, 11].
2.1.3.3 The importance of integration of early DMPK data with other
HTS data
Although multiple tools/screens are available, the decision to employ a screen
within a drug discovery project must come from a rational appraisal of the
project requirements, rather than simply because that screen is capable of
providing the needed throughput. Furthermore, the point must be made that
any improvements in throughput are worthless unless they are supported by
rigorous and continued validation of the overall screen performance [21]. Theintegration element of rational HTS is very critical and ties together a number
of issues (Figure 2.2). It is not sufficient to conduct one kind of DMPK
screen without integrating them with other DMPK screens and with HT
Figure 2.2 Integration of in vitro ADME data with other HT screens in the discovery process.
40 Using Mass Spectrometry for Drug Metabolism Studies
Copyright © 2005 CRC Press, LLC
7/21/2019 Using Mass Spectrometry for Drug Metabolism Studies
http://slidepdf.com/reader/full/using-mass-spectrometry-for-drug-metabolism-studies 49/362
pharmacology screens. In other words, solving a metabolic stability problem
may not necessarily lead to a compound with an overall improvement in
activity or even PK properties if the compounds with improved metabolic
stability have absorption problems [11].
2.1.3.4 The evolving role of DMPK studies in drug design
By the end of the 1980s, it was becoming common practice to obtain PK/
metabolism data, if not in the design stage, then at least before the
compound(s) advanced far into development. Initially, the PK/metabolism
data collected was predominantly whole animal data. As shown in Table 2.1
there is a natural inclination to this approach. In general, while whole animal
studies are considered more physiologically relevant, they are also moreexpensive and time consuming than in vitro studies. Gradually, as the
correlations to in vivo data became evident, in vitro metabolism (and other
DMPK) data have become more widely accepted. Because in vitro studies
generally allow for higher throughput at less cost than in vivo studies, they have
now become an important part of modern drug discovery [8, 11].
Today, drug discovery is a highly driven, fast moving and iterative process.
Medicinal chemists are constantly refining structural features in search of the
elusive ‘‘ideal’’ molecule. In order to have an impact, metabolism data must be
generated and interpreted rapidly, often in a matter of days or, at most, weeks.Usually, several iterations of metabolism studies and molecular redesign are
necessary. Furthermore, experience has shown that in the absence of timely,
real, metabolism data, the chemists will resort to the use of empirical data, i.e.,
structure–metabolism rules, literature precedent, or even anecdotal informa-
tion. These realities dictate that minimal experimental design, rapid throughput
analysis, and expedient data calculation/management are imperative [11].
Ideally, at the earliest stages, the so-called lead identification or hit finding
stage, the chemists need to know the metabolically vulnerable moieties within a
molecule. This enables them to know what changes they can make to impart
improved DMPK properties. Once chemists are armed with this information,
they can embark on a lead optimization campaign. At this point, it quite
helpful to get feedback on the effect that various structural changes have on
metabolic stability even as the pharmacological activity is being optimized.
The challenge for the metabolism groups that support drug discovery is to
generate data that are rigorous enough to make reliable assessments of
modifications the chemists should make. Yet, at the same time, acquisition of
the data should not be so rigorous as to be untenable for a large number
of compounds or impede multiple iterations of the design process [11].
2.2 Pharmacokinetic Principles used in Drug Discovery
Medicinal chemistry now has decades of extensive experience in understanding
structure–activity relationships with the 500 or so favorite targets of enzymes,
Drug Metabolism In Vitro and In Vivo Results 41
Copyright © 2005 CRC Press, LLC

7/21/2019 Using Mass Spectrometry for Drug Metabolism Studies
http://slidepdf.com/reader/full/using-mass-spectrometry-for-drug-metabolism-studies 50/362
receptors and other macromolecules. Any progress that will be made in
optimizing DMPK properties in the drug design stage will rely on the
generation of a comparable understanding of the relation of absorption,
distribution, metabolism, and excretion (ADME) properties to chemicalstructure. By understanding the factors involved in the interaction with
membranes and drug metabolizing enzymes or transporter proteins, medicinal
chemists can capitalize on experience they already possess [8].
A second key point to make is that both the pharmacokinetic and
pharmacodynamic properties are linked to the molecular properties of drugs.
Predictably, each usually has its own unique structure–activity relationship.
Experience tells us that modification of the structure to improve absorption,
metabolic stability or distribution may, and often does, adversely impact
intrinsic pharmacological activity and vice versa [2, 6]. Thus, the chemist mustthink in terms of the optimal intersection of multiple parameters to ultimately
ensure activity in vivo.
Some of the key factors and relationships between structure and DMPK
properties have been assembled from existing reviews and selected examples
from primary literature and are summarized below. The reader is directed to
several of these excellent review articles and the references therein for more
detail [1–3, 5, 6, 31–33].
As our understanding of drug disposition at the theoretical and experimental
levels improves, a pattern begins to emerge that permits some degree of prediction of the two arguably most relevant pharmacokinetics properties to
pharmacologic activity, i.e., bioavailability (F ) and half-life (t1/2). As Figure 2.3
indicates, these two key properties are related to more basic PK properties of
fraction absorbed ( f a), clearance (CLsys) and volume of distribution (V d). These
intermediate properties are, in turn, derived from basic drug properties that can
be measured in vitro in a modern drug metabolism laboratory [8, 13].
2.2.1 Oral bioavailability
Oral bioavailability (F ) is important because, along with intrinsic pharmaco-
logical activity, it determines the dose level required to achieve the desired
Figure 2.3 The relationship between early DMPK screening data and pharmacokineticproperties.
42 Using Mass Spectrometry for Drug Metabolism Studies
Copyright © 2005 CRC Press, LLC

7/21/2019 Using Mass Spectrometry for Drug Metabolism Studies
http://slidepdf.com/reader/full/using-mass-spectrometry-for-drug-metabolism-studies 51/362
effect. Oral bioavailability of drugs is defined as the fraction of the ingested
dose that is available to the systemic circulation after both absorption and first
pass clearance. Mammalian anatomy dictates that during and after absorption,
the drug encounters the intestinal wall, liver and lung, all of which maymetabolize or excrete the drug before it reaches systemic circulation. Thus, oral
bioavailability can be estimated as
F ¼ f a f G f H f L, ð2:1Þ
where f a is the fraction absorbed across the intestinal wall, and f G f H f L is the
product of the fractions escaping clearance by the gastrointestinal tract, liver
and lung. Generally speaking, intestinal and liver metabolism are the major
determinants of first pass clearance and are usually the only tissues modeled inDMPK screens [10, 12]. Figure 2.4 depicts the anatomical arrangement of
intestine and liver in first pass clearance and illustrates the processes of
permeation, efflux and metabolism, all of which will be discussed later in this
chapter.
An alternative estimate of bioavailability may be obtained as the ratio
of the systemic clearance (CLsys) to the apparent oral clearance (CLoral),
Figure 2.4 Anatomical barriers to drug bioavailability.
Drug Metabolism In Vitro and In Vivo Results 43
Copyright © 2005 CRC Press, LLC
7/21/2019 Using Mass Spectrometry for Drug Metabolism Studies
http://slidepdf.com/reader/full/using-mass-spectrometry-for-drug-metabolism-studies 52/362
as follows [10]:
F ¼ CLsys=CLoral: ð2:2Þ
2.2.2 Half-life
The other key property, half-life (t1/2), is defined as the time needed to clear the
blood compartment of 50% of the initial drug level. The half-life of any drug is
related to its apparent volume of distribution (V d) and its systemic clearance
(CLsys) as:
t12¼ 0:693ðV d=CLsysÞ: ð2:3Þ
Thus, the half-life of any drug is a function of blood and tissue binding of the
drug as well as its total clearance and is a derived parameter from CL sys and V d[2, 12].
2.2.3 Fraction absorbed
Fraction absorbed ( f a) is the fraction of dose that traverses from the luminal tothe serosal side of the intestinal wall, taking into account both unchanged and
metabolized drug. Fraction absorbed can be computed from PK determina-
tions of clearance and oral bioavailability using the following relationship:
f a ¼ F =ð1 CLH=QHÞ, ð2:4Þ
where f a is the fraction absorbed, F is the oral bioavailability, CLH is the
hepatic clearance, and QH is the hepatic blood flow in that species [13].
Methods to determine fraction absorbed can range from simple permeabilitystudies in vitro to measurements across the gut wall in situ or, ultimately, to
in vivo comparison of total radioactivity profiles after intravenous and oral
administration.
2.2.4 Clearance
Clearance is defined as the volume of blood that must be cleared of drug in a
unit of time in order to account for the rate of drug elimination. Thus,
clearance is the ratio of elimination rate of the drug to the drug concentrationin blood entering the organ. It is well known that total systemic clearance
(CLsys) of a drug is estimated as the ratio of dose to area under the curve
(AUC) following intravenous administration of the drug [12, 13]:
CLsys ¼ doseðivÞ=AUCðivÞ: ð2:5Þ
44 Using Mass Spectrometry for Drug Metabolism Studies
Copyright © 2005 CRC Press, LLC

7/21/2019 Using Mass Spectrometry for Drug Metabolism Studies
http://slidepdf.com/reader/full/using-mass-spectrometry-for-drug-metabolism-studies 53/362
The total clearance is the sum of all individual organ clearances that occur in
sequence:
CLsys ¼ CLG þ CLH þ CLr, ð2:6Þ
where CLG is clearance by the gut wall, CLH is hepatic clearance and is the sum
of liver metabolism and biliary excretion, and CLr is renal clearance. If there is
significant clearance by lung tissue, then an extra CL factor must also be added
to account for lung clearance.
2.2.5 Volume of distribution
The third intermediate PK property, volume of distribution (V d), is a measure
of the extent of drug distribution and is determined by the binding of the drug
in plasma as well as tissues. Volume of distribution is the proportionality
constant relating the drug concentration in blood or plasma to the amount of
drug in the body and is affected by plasma protein binding:
V d ¼ V p þ V tð f p= f tÞ, ð2:7Þ
where V d is the volume of distribution, V p is the plasma volume, V t is theextravascular tissue space volume, f p is the unbound fraction in plasma and f t is
the unbound fraction in tissues [2, 7, 13].
2.3 Absorption
By far, the oral route is the primary route of administration for most drugs
[34]. Consequently, absorption from the gastrointestinal tract (GIT) is an
important determinant of drug action. In order to be absorbed, a drug must
undergo transit through the GIT, dissolution from a tablet form, diffusion
through an aqueous environment, and finally, permeation through the
intestinal wall [6, 13, 18]. A drug can permeate through the intestinal wall
either between the junction of intestinal cells (paracellular) or through the
intestinal cells (transcellular). Transcellular permeability may occur by passive
diffusion through intestinal cell membranes, in which case it is governed by the
physiological environment of the GIT (intestinal motility and pH) and the
physicochemical properties of the drug (molecular weight, polar surface area,
lipophilicity and pKa). Alternately, diffusion may be due to active transport
through the intestinal cells via one of several transporter proteins. In that case,
permeability is governed by structure–activity relationships particular to the
given transporter.
Lipinski et al. have summarized several properties which appear to be
common to compounds which are well absorbed [35]. According to the
Lipinski rule of five, as these properties have come to be known, well absorbed
Drug Metabolism In Vitro and In Vivo Results 45
Copyright © 2005 CRC Press, LLC

7/21/2019 Using Mass Spectrometry for Drug Metabolism Studies
http://slidepdf.com/reader/full/using-mass-spectrometry-for-drug-metabolism-studies 54/362
compounds typically have a molecular weight <500, log P<5 and have fewer
than five H-bond donors and 10 H-bond acceptors. Generally speaking, when
exceptions to these rules occur, active transport may be involved.
2.3.1 Physicochemical properties
As mentioned, passive transport is a major mechanism of absorption and is
driven by physicochemical properties such as solubility, pKa and lipophilicity.
In a recent review, Kerns has summarized the literature concerning recent
attempts to profile drug candidate’s physicochemical properties during early
discovery phases [36]. High throughput methods to measure solubility as well
as other properties such as permeability, lipophilicity, pKa, stability and
integrity are described and compared in this article.Given the rapid pace and high numbers of compounds in the discovery
process, many attempts have been made to miniaturize classical dissolution
tests used for pharmaceutical formulations. Ideally, these tests should consume
a few milligrams of powder and should allow the evaluation of the influence
of proteins, bile acids, for example, in the media. In addition to the intrinsic
solubility values used mainly for ranking purposes, dissolution profiles over
time or as a function of the pH should also be generated because these are
more physiologically relevant to the dynamics of the GIT [18]. Recent
literature reports for high throughput methods to measure solubility includea small-scale shake flask method [37], turbidity measurements [35] and
nephelometry [38].
Lipophilicity is the ability of a compound to dissolve in a lipid
environment. Historically, it has been determined by measuring the equili-
brium solubility of a compound in a lipophilic phase such as octanol to its
solubility in aqueous media. It is usually reported as either log P, which is the
intrinsic partitioning of unchanged drug between octanol and water, or else as
log D, which is the distribution at a specific pH, usually pH 7.4. In a high
throughput format, lipophilicity has been measured by a modified shake flask
method, by potentiometric titrations and by correlation of log D with retention
time in reverse phase HPLC [36]. The latter method is typified by the work of
Lombardo et al. in which they describe a reversed phase HPLC method for the
determination of the octanol–water distribution coefficients at pH 7.4 (as log
values) for neutral and basic drugs, which they referred to as E log D7.4 [39].
2.3.2 Mechanisms of permeability
2.3.2.1 Passive diffusion
As mentioned above, passive diffusion is influenced by physicochemical
determinants such as (1) lipophilicity, (2) intrinsic aqueous solubility,
(3) surface charge and (4) molecular weight (MW) [10]. In general, aqueous
solubility is inversely related to lipophilicity. Compounds with log D7.4<0
are readily dissolved in the aqueous environment (i.e., hydrophilic), but will
46 Using Mass Spectrometry for Drug Metabolism Studies
Copyright © 2005 CRC Press, LLC

7/21/2019 Using Mass Spectrometry for Drug Metabolism Studies
http://slidepdf.com/reader/full/using-mass-spectrometry-for-drug-metabolism-studies 55/362
progressively rely on the slower paracellular mechanism as the log D7.4
decreases below 0. At the other extreme, compounds with log D7.4 greater
than 3 are considered to be highly lipophilic and hence may show poor
dissolution resulting in poor bioavailability. In contrast to these extremes,drugs with log D7.4 values above 0 but less than 3 are considered to be have an
optimal balance between lipophilicity and hydrophilicity and usually will be
rapidly absorbed by the transcellular route [6, 10].
Another common factor that has long been thought to favor passive
diffusion is relatively low molecular weight (MW), as seen by the MW
distribution of all marketed drugs. The increased absorption of compounds
of low MW can be explained, in part, on the basis of passive diffusion
principles [10].
2.3.2.2 Active transport
If drug absorption were facilitated by only by passive diffusion, then
absorption should be well predicted by physicochemical parameters as
described above and only lipophilic, un-ionized drugs would be absorbed.
However, there are consistent exceptions to those rules and both direct and
indirect evidence points to the existence of active transport mechanisms to
facilitate absorption. A review by Tsuji and Tamai [40] provides an excellent
summary of carrier-mediated intestinal absorption of amino acids, oligopep-tides, monosaccharides, monocarboxylic acids, phosphate, bile acids and
several water-soluble vitamins across brush-border and basolateral
membranes. While these active transporters undoubtedly evolved to aid the
body in absorption of essential nutrients, absorption of many drugs can also be
attributed, at least in part, to these systems (Table 2.2) [41–64].
2.3.2.3 Efflux
In addition to active transport in the absorptive (mucosal to serosal) direction,
it is now evident that active transporters exist that can limit absorption by
causing the efflux of drugs in the reverse (serosal to mucosal) direction. One
such transporter, the multidrug resistance gene product P-glycoprotein (P-gp),
was initially discovered because it is expressed at high levels in some cancers
cells and causes the net efflux of certain chemotherapeutic agents out of the
cells, rendering them ineffective. However, it is now known that P-gp exists in
many normal tissues, including the canalicular domain of hepatocytes, kidney
(proximal tubule), small intestine, colon, adrenal glands, and the capillary
endothelium of the brain and testes [65]. It is the expression of P-gp in the
intestinal brush-border membrane of the small intestine that leads to net
secretion of some drugs in the serosal-to-mucosal direction, serving as a
secretory detoxifying mechanism and as a part of the absorption barrier in the
intestine [40]. Because of its ubiquitous nature in so many other tissues, P-gp
also plays an important role in drug distribution and excretion, so it will be
considered again later in this review.
Drug Metabolism In Vitro and In Vivo Results 47
Copyright © 2005 CRC Press, LLC

7/21/2019 Using Mass Spectrometry for Drug Metabolism Studies
http://slidepdf.com/reader/full/using-mass-spectrometry-for-drug-metabolism-studies 56/362
Drug substrates of P-gp include cyclosporin A, verapamil, quinidine,
erythromycin, terfenadine, fexofenadine and HIV-1 protease inhibitors
[66–69]. This represents a chemically diverse set of compounds, and it is
evident that the structure–activity relationships for P-gp are still being deter-
mined. It is known that P-gp has significant substrate overlap with CYP 3A4,
although not all CYP 3A substrates are P-gp substrates and vice versa [65].
In order to design drugs which are not going to have limited absorption due
to P-gp efflux, the safest approach is probably to avoid interaction altogether.
Thus, there is a need for a reliable, high-throughput screen to evaluate
compounds as P-gp substrates. To this end, Polli et al. tested 66 compounds in
the high-throughput ATPase and calcein AM assays, and compared the results
to those from a medium throughput monolayer efflux assay [70]. They
determined that the efflux assay is more reliable for low and moderate Papp
compounds and is the method of choice for evaluating drug candidates despite
moderate throughput and reliance on liquid chromatography with tandem
mass spectrometry.
2.3.3 Experimental models
Prediction of the key structural features that control human intestinal
permeability has been a major area of research for many years. A range of
Table 2.2 Transporter proteins involved in intestinal absorption of drugs
Transporter Experimental model Compound Reference
Amino acid Rat intestinal perfusion Gabapentin 41a-Methyl dopa 42, 43l-Dopa 44Baclofen 45d-cycloserin 46
Oligopeptide Caco-2 cells Cefadrine 47, 48Rat, rabbit and human
transporter expressedin Xenopus laevis oocytes
Cefadroxil 49
Ceftibuten 50Captopril 51Enalopril 52
Lisinopril 53Renin inhibitor S 86 3390 54, 55Bestatin 56Thrombin inhibitors 57
Glucose Rat everted jejunum p-Nitrophenol-b-d-glucopyranoside
58
Monocarboxylicacid
Caco-2 cells Salicylic acid 59, 60, 61
Benzoic acid 60Pravastatin 62
Phosphate Rat intestinal brush bordermembrane vesicles
Foscarnet 63
Rat intestinal preparation Foscarnet 64
Adapted from Reference 40.
48 Using Mass Spectrometry for Drug Metabolism Studies
Copyright © 2005 CRC Press, LLC

7/21/2019 Using Mass Spectrometry for Drug Metabolism Studies
http://slidepdf.com/reader/full/using-mass-spectrometry-for-drug-metabolism-studies 57/362
different models of varying complexity have been used to study and optimize
absorption [13]. Three of the more common models used for higher throughput
assays are summarized below.
Over the past few years some groups have developed a purely physical– organic model for absorption based on a phospholipid membrane soaked pad
separating an aqueous donor and receiver compartment, the parallel artificial
membrane permeation assay (PAMPA) screen [71]. PAMPA is based on a
multi-well microtiter plate technology and allows reasonable throughput,
although it lacks similarity to natural membranes in that it does not possess
pores or active transport mechanisms. It enables fast determination of the
trends in the ability of the compounds to permeate membranes by passive
diffusion and is thus suited for the screening of large libraries [12]. Quantitative
structure activity relationships (QSARs) based upon the PAMPA assayproduce good data for this mechanism of absorption [13].
Cell lines are more physiologically relevant than the PAMPA assay in that
they also express transporters and, hence, can measure both active and passive
transport. The most popular and extensively characterized is the Caco-2 cell
line, derived from human adenocarcinoma. Because it is derived from human
colonic cells, its morphology is thought to be a reasonable model of human
small intestinal permeability. Caco-2 cell monolayers have been shown to
express a variety of active transporters relevant to gut absorption including the
dipeptide transporters such as PepT1 and efflux proteins such as P-gp [13, 18,72, 73]. Figure 2.5 demonstrates that permeability to Caco-2 cell monolayers
provides a good correlation with in vivo absorption in humans [73].
Caco-2 cells have some disadvantages, including a 21-day culture period.
To overcome these limitations, the use of Madin–Darby canine kidney (MDCK)
cells as an alternate cellular model for assessing intestinal epithelial drug
transport has been reported [74]. Like Caco-2 cells, MDCK cells differentiate
into columnar epithelium and form tight junctions on semipermeable
Figure 2.5 Correlation between caco-2 permeability and in vivo human absorption data [73].
Drug Metabolism In Vitro and In Vivo Results 49
Copyright © 2005 CRC Press, LLC

7/21/2019 Using Mass Spectrometry for Drug Metabolism Studies
http://slidepdf.com/reader/full/using-mass-spectrometry-for-drug-metabolism-studies 58/362
membranes. Unlike Caco-2 cells, transporter proteins are not expressed in the
simple primary culture. Nevertheless, Irvine et al. compared permeability data
from MDCK cells with that obtained from Caco-2 cells for 55 drugs [74]. These
data show that the permeability of passively absorbed compounds was similarto that obtained from Caco-2 cells. The major advantage of the use of MDCK
cells is its ability to assess reliable permeability estimates after only 3 days of
culture rather than the 21 days required by Caco-2 cells. Thus, some groups
have concluded that the ease of handling of MDCK cells with shorter culture
times (7–14 days) and their low expression of transporter proteins and
metabolizing enzymes, make them perfect for evaluation of permeability of
passively absorbed compounds [12].
2.4 Clearance
Like absorption, clearance of drugs is also determined by both compound-
specific physicochemical properties, physiological determinants, such as organ
blood flow and tissue volume, and pharmacokinetic parameters, such as dose
and route of administration. However, unlike drug absorption, which can be
improved by different formulation strategies, intrinsic clearance cannot
generally be modified unless the structure of the molecule itself is changed.
In other words, to alter a drug’s clearance behavior, a new analog must bedesigned [2, 8, 10, 11].
As shown earlier, clearance is a central parameter influencing both
bioavailability and half-life [13]. As such, predictive rules governing clearance
derived from theoretical models would be immensely useful to guide structure-
based drug design to ensure in vivo efficacy. However, probably because of the
relative contribution of enzymatic processes to overall clearance, predictive
models have had limited success to date. Nevertheless, limited success in
predicting structure–activity relationships for clearance has been achieved
within narrowly defined classes [10].
As described earlier, total clearance is the sum of all individual organ
clearances that occur in sequence. Although all organs can contribute to
clearance by virtue of either metabolic or excretory capacity, generally
speaking, metabolism by the intestine and liver, together with biliary and
renal excretion, are the major determinants of clearance.
2.4.1 Metabolic clearance
2.4.1.1 Clearance concepts
In the context of drug discovery support, metabolic clearance is often referred
to as metabolic stability. Either way, the terms describe the rate and extent to
which a molecule is metabolized. A molecule that is rapidly and extensively
metabolized is said to have a low degree of metabolic stability. Medicinal
chemists have come to understand that low metabolic stability can be
50 Using Mass Spectrometry for Drug Metabolism Studies
Copyright © 2005 CRC Press, LLC
7/21/2019 Using Mass Spectrometry for Drug Metabolism Studies
http://slidepdf.com/reader/full/using-mass-spectrometry-for-drug-metabolism-studies 59/362
a contributing factor to undesirable pharmacodynamic properties, such as
poor oral efficacy or short duration of action. By now, the theoretical basis for
this intuitive understanding has been thoroughly evaluated and well
documented. As illustrated in Figure 2.3, the ability to evaluate metabolicstability of numerous analogs early in the discovery process, together with the
ability to evaluate absorption potential improves the chances of selecting a
molecule with good in vivo activity.
Perhaps the first practical attempt to relate in vivo pharmacokinetics to
in vitro drug metabolism was reported by Rane et al. [75]. Using the concept of
intrinsic metabolic clearance (CLint), these authors demonstrated in vitro
metabolism rates for a selected set of model substrates correlated well with
hepatic extraction ratios determined from isolated perfused rat livers. More
recently, the concept of in vitro – in vivo correlations has been systematicallyreviewed [76–80]. The pivotal concept in these correlations is that of CLint,
which is related to parameters that can be measured from in vitro metabolism
experiments. According to Houston [76, 77], intrinsic clearance is defined as
the proportionality constant between drug concentration at the enzyme site
(C e) and rate of metabolism (v0):
v0 ¼ CLint C e: ð2:8Þ
Rearranging this equation leads to
v0=C e ¼ CLint: ð2:9Þ
From the Michaelis–Menten relationship for enzyme-catalyzed reactions, the
rate of metabolism is related to concentration at the catalytic site, maximum
velocity of reaction (V max) and a constant known as the Michaelis constant
(K m) which, in practical terms, is defined as the substrate concentration at half
maximal velocity:
v0 ¼ ðV maxC eÞ=ðK m þ C eÞ: ð2:10Þ
When, C eK m, Equation (3) reduces to
v0 ¼ V maxC e=K m: ð2:11Þ
By rearrangement of terms, this becomes
v0=C e ¼ V max=K m: ð2:12Þ
Because v0/C e¼CLint then
CLint ¼ V max=K m: ð2:13Þ
Drug Metabolism In Vitro and In Vivo Results 51
Copyright © 2005 CRC Press, LLC

7/21/2019 Using Mass Spectrometry for Drug Metabolism Studies
http://slidepdf.com/reader/full/using-mass-spectrometry-for-drug-metabolism-studies 60/362
Thus, when measured under appropriate conditions, a simple relationship can
be defined between a property related to in vivo kinetics, CLint, and two
parameters which can easily be measured in vitro, K m and V max. The consensus
is that reasonable correlations between in vivo pharmacokinetic properties and
parameters derived from in vitro metabolism studies are possible (Figure 2.6).
However, for good correlation, it is imperative that careful attention is paid to
appropriate experimental design in the collection of the in vitro data as well as
appropriate extrapolation to approximate in vivo conditions [76, 77].
Recently, the principles reviewed above were used by a group who
systematically made correlations between a large number of compounds for
which clinical PK data were available with properties they could derive from
in vitro experiments. A unifying concept for their work was the prediction of
human clearance from CLint data determined from in vitro metabolism
experiments [77]. The authors opted to use in vitro half-life method to
Figure 2.6 Relationship of in vitro intrinsic clearance in microsomes or hepatocytes to in vivointrinsic clearance [76].
52 Using Mass Spectrometry for Drug Metabolism Studies
Copyright © 2005 CRC Press, LLC
7/21/2019 Using Mass Spectrometry for Drug Metabolism Studies
http://slidepdf.com/reader/full/using-mass-spectrometry-for-drug-metabolism-studies 61/362
determine CLint, which is shown in Equation 2.14:
CLint ¼ 0:693wL=t12mL f u, ð2:14Þ
where wL is the liver weight, mL is the amount of liver in the incubation, t12
is the
half-life of the in vitro incubation and f u is the fraction unbound to microsomal
protein. The in vitro half-life was determined by incubating a given drug with
liver subcellular preparations for an appropriate period and measuring the
disappearance of parent drug. Half-life was determined by plotting ln%
remaining vs time, then measuring the slope of this plot:
t12¼ 0:693=slope: ð2:15Þ
This approach has the advantage that only a single substrate concentration
needs to be used, so long as the concentration is kept as low as possible given
the detection limits of the analytical method. The Pfizer workers have reported
that so long as [S ]/K m is 1 (where [S ] is the concentration of substrate in the
incubation and K m is the apparent Michaelis constant), the CLint measured will
be within 90% of the actual CLint as measured by more detailed experiments
[81]. This is a powerful tool because, when coupled with a high-throughput
analytical method, this approach lends itself to determination of in vitro CLint
for a large number of individual compounds.
2.4.1.2 Relationship of metabolic clearance to physicochemical
properties
Metabolic clearance is influenced by passive diffusion through cell membranes
to the site of the metabolizing enzymes. This diffusion, in turn, depends on
molecular properties such as lipid/water solubility and degree of ionization
[6, 8, 11]. However, once at the enzyme site, metabolic clearance is also further
influenced by other aspects of molecular structure, including geometric featuresand stereoelectronic properties. Because of the involvement of enzyme
catalysis, there is a further element of complexity due to the existence of
both substrate and product selectivity. This selectivity can be viewed in terms
not only of which reaction among many possibilities is catalyzed, but also
where they occur among many possibilities (regioselectivity) [2].
A great deal can be understood about metabolism by considering general
chemical principles related to the physical properties of drugs which, in turn,
are a consequence of their structure. Several of these physical principles are
considered below.
2.4.1.2.1 Lipophilicity
The fact that binding or transport processes influence metabolism probably
accounts for the high degree of correlations between lipophilicity and
metabolism, especially phase I metabolism. Often, variability in metabolism
Drug Metabolism In Vitro and In Vivo Results 53
Copyright © 2005 CRC Press, LLC

7/21/2019 Using Mass Spectrometry for Drug Metabolism Studies
http://slidepdf.com/reader/full/using-mass-spectrometry-for-drug-metabolism-studies 62/362
within a series, whether in vitro or in vivo, can be attributed to variation in
lipophilicity [2]. The octanol–water partition coefficient (log P, or log D7.4) has
been the most convenient measurement of lipophilicity and has been used
extensively to correlate with metabolism rates [6].
2.4.1.2.2 Ionization
Apart from lipophilicity, another important general structural property for
metabolism such as that catalyzed by cytochrome P450 is the presence of
ionizable functions. First of all, the presence of ionizable groups affects net
lipophilicity. For that reason, log D7.4 of the molecule is perhaps more a more
useful parameter than log P because it incorporates both lipophilicity and
degree of ionization at the physiologically relevant pH 7.4. Ionization is alsoimportant because the ionized group may have a key role in binding to CYPs
and thus have an effect on the regioselectivity of metabolism [6].
2.4.1.2.3 Electronic properties
Electronic properties may influence metabolism in at least two different
ways. First, electronic factors can affect binding of substrates to metabolizing
enzymes just as they do with binding to other biological receptors. Second,
electronic factors can influence the catalytic step of the interaction. Forexample, there is a slightly larger electron density in sp3-hybridized carbon
atoms in benzylic, allylic or penultimate positions, or in positions alpha to
heteroatoms, which probably explains why these sites are favorite targets of
hydroxylation [2]. Another example is the observation that by substituting
aromatic rings with strongly electron withdrawing groups (e.g., CF3, SO2NH2,
SO3 ), oxidation can be reduced or even blocked. Finally, the observation that
glutathione conjugation of para substituted 1-chloro-2-nitrobenzene deriva-
tives was correlated with their Hammett resonance -values (a measure of their
electrophilicity) is also evidence of the importance of electronic effects [2].
2.4.1.2.4 Configuration and conformation
The effect of stereochemistry on the outcome of metabolism is well
documented. This effect includes substrate specificity (i.e., substrates with
different stereochemistry proceed to products of different stereochemistry),
as well as product specificity. The degree of stereoselectivity ranges from
moderate to practically complete whereas examples of lack of at least some
degree of stereoselectivity are rare. Even when the substrate is achiral,
stereoselective formation of metabolites can be observed, a phenomenon
known as enantioselectivity. For example, in many drugs, the methylene group
is frequently a center of prochirality, and the enzymatic reaction can
discriminate between the two enantiotopic or distereotopic hydrogens [2].
Unlike configurational factors (i.e., stereochemistry), the role of conforma-
tional factors in drug metabolism is much less studied. What knowledge we do
54 Using Mass Spectrometry for Drug Metabolism Studies
Copyright © 2005 CRC Press, LLC

7/21/2019 Using Mass Spectrometry for Drug Metabolism Studies
http://slidepdf.com/reader/full/using-mass-spectrometry-for-drug-metabolism-studies 63/362
have usually comes by inference from differing outcomes observed when a
molecule of constrained conformation is compared its corresponding analog
with free rotation. Nevertheless, conformational factors may play a subtle yet
decisive role in biotransformation and must be taken into account in relevantcases for a proper assessment of structure–metabolism relationships [2].
2.4.1.3 Relationship of metabolism to enzymology
The discussion to this point has focused on the chemical properties inherent to
their structure that govern metabolism of molecules. However, any attempt to
design metabolic stability into a molecule would be futile without an
understanding of biological or enzymatic factors. One of the more significant
findings is the realization that many drug metabolizing enzymes are not singleenzymes, but, rather, are families of structurally related isoenzymes. It is this
characteristically unique protein environment around the active site provided
by each isozyme which is the key enzymatic factor accounting for regioselec-
tivity. Unfortunately, in contrast to chemical factors, it appears that the effects
of biological factors are not easily predictable. Nevertheless, understanding the
differences in structure and active site interactions among different isozymes is
key to manipulating drug structure to promote metabolic stability [2].
Recently, with the aid of new computational tools, a significant effort
has been spent developing structure–metabolism relationships for enzyme-catalyzed metabolism. In these studies, the goal is to characterize the active site
requirements of the enzyme. Use this knowledge could facilitate design of new
molecules to either enhance or limit metabolism by these enzymes. Alternately,
it is becoming possible to predict a priori whether a new drug molecule will be a
substrate or inhibitor of the isozyme in question, thus anticipating potential
drug interaction issues [8].
2.4.1.3.1. Phase I metabolism
Phase I metabolism is considered to occur when there is an enzymatic
transformation of the parent structure. The main classes of phase I metabolism
are oxidation and hydrolysis of esters or amides. Several enzyme systems are
capable of catalyzing the phase I oxidation of lipophilic substrates. Among
these are cytochrome P450, flavin-containing monooxygenases, aldehyde
oxidase and xanthine oxidase, just to name a few. Of these, cytochrome
P450 (CYP) is generally considered to have the widest significance when it
comes to metabolism of drug-like molecules. For this reason, we will consider
CYP oxidation in more detail.
CYP catalyzed oxidation. The CYPs represent an extensive family of closely
related isozymes. The catalytic mechanism has been studied extensively
through the years. According to Guengerich and Macdonald, it is likely that,
despite the differences in individual CYPs, the mechanism of cytochrome P450
catalysis is essentially the same across all isozymes [82]. The first step is
Drug Metabolism In Vitro and In Vivo Results 55
Copyright © 2005 CRC Press, LLC
7/21/2019 Using Mass Spectrometry for Drug Metabolism Studies
http://slidepdf.com/reader/full/using-mass-spectrometry-for-drug-metabolism-studies 64/362
activation of oxygen, then oxidation of the substrate proceeds by abstraction of
a hydrogen atom or an electron from the substrate and, finally, oxygen
rebound (radical recombination). As a consequence of this mechanism, it can
be reasoned that metabolism by CYPs is determined by three general factors[6 and references therein]:
The degree of steric hindrance of the access of the iron–oxygen complex to
the possible sites of metabolism The topography of the active site The possible ease of electron or hydrogen abstraction from the various
carbons or heteroatoms of the substrate
Examples of this mechanism include dealkylation of amines and ethers, and
hydroxylation at carbon or nitrogen. Extensive study of these reactions revealsseveral predictable characteristics which are a consequence of the catalytic
mechanism. For example, dealkylation of N -alkylamino sidechains proceeds
sequentially from the tertiary amine to the corresponding secondary amine,
then to the primary amine. Typically, the N-dealkylation rate is lower upon
going from the secondary amine to the primary amine, than in going from the
corresponding tertiary amine to the secondary amine. This is presumably
because of the increased basicity of the nitrogen (20 vs 10) which, in turn,
stabilizes the nitrogen to electron abstraction. This order of reactivity has been
exemplified by comparative rate studies of diltiazem, and its N -alkylmetabolites as well as amlodipine and its N -alkylated congeners. Polarity
may also be as important as basicity, as shown by studies on a series of
dihydropyrimidine based calcium channel blockers [6 and references therein].
The mechanistic aspects considered above might account for the product
selectivity of the enzymatic reaction, that is, the type of reaction which is
catalyzed. However, the characteristic stereo- and regioselectivity that CYPs
exhibit toward their substrates cannot be accounted for exclusively by the
catalytic mechanism. It is believed that structure of the apoprotein and how the
substrates fit precisely also contribute significantly to regio- and stereoselec-tivity, and even to some extent to the product selectivity of reaction as well [6].
With the aid of new computational tools, a significant effort has
recently been spent developing structure–metabolism relationships for
enzyme-catalyzed metabolism. Much of this work has centered on several of
the more prominent human CYP isozymes. To date, there have been reports
on CYPs 2D6 [83–85], 3A4 [86, 87], 2C9 [88], and 2B6 [89, 90].
Esterase and amidase catalyzed hydrolysis. A second kind of phase I
metabolism is esterase-catalyzed hydrolysis of esters or amides. The carboxyl-
esterases constitute a heterogeneous group of isozymes that can catalyze the
hydrolysis of a wide range of esters, amides, and thioesters. Therefore, they
play an important role in the metabolism of drugs and lipids [91].
Mechanistically, the ester or amide is first bound to the active site
presumably by an electrostatic interaction with the enzyme. Next, a
nucleophilic group contained on the enzyme, e.g., a serine hydroxyl, attacks
56 Using Mass Spectrometry for Drug Metabolism Studies
Copyright © 2005 CRC Press, LLC
7/21/2019 Using Mass Spectrometry for Drug Metabolism Studies
http://slidepdf.com/reader/full/using-mass-spectrometry-for-drug-metabolism-studies 65/362
the electrophilic carbonyl carbon of the ester leading to a transient charged
tetrahedral intermediate. Upon collapse of this intermediate, an alcohol (or
amine or thiol) leaving group is expelled. Finally, the remnant of the substrate,
the carboxylate moiety, is dissociated from the enzyme.Based on this mechanism, several general structure–activity relationships
emerge [91]:
Electronic factors which diminish the electrophilic nature of the carbonyl
carbon decrease the rate of hydrolysis The carboxylates of a- and b-naphthol with short acyl groups exhibited the
highest rate of hydrolysis by human, rat and mouse liver esterases Lengthening or increasing the size of the side chain of the carbonates
hindered the enzymatic hydrolysis of these compounds
A trend of generally decreasing enzyme specific activity with lipophili-city has been recorded for a- and b-naphthyl alkyl carbonates and
thiocarbonates
As with the CYPs, esterases exist as a family of isozymes, each with its own
characteristic selectivity. For example, marked substrate selectivities were
observed between rat liver hydrolase A and rat liver hydrolase B, with most of
these compounds being better substrates for hydrolase B. The esterase activities
of human and mouse liver microsomes were about five orders of magnitude
smaller than that of rat hydrolase B. The relationship between the specific
activities of the enzymes and the lipophilicity of the a- and b-naphthyl
carbonate series substrates indicates that the enzymes showed decreasing
activity with increasing lipophilicity of the substrates.
2.4.1.3.2 Phase II metabolism
Another general pathway of metabolism is phase II metabolism, sometimes
called conjugation. Generally, this is the final metabolic step in preparing a
molecule for excretion either in bile or urine. It should be noted that, usually,conjugation is a secondary step following an initial phase I reaction and, thus,
has no direct effect on metabolic clearance. However, when conjugation occurs
directly on a hydrophilic moiety of the parent compound, it can have a
quantitative effect on metabolic clearance. The major conjugation enzymes
include methyl, amino acid, sulfate, and glucuronyl transferases. Of these,
glucuronidation is arguably the most common for final metabolism of drugs,
so it will be considered here.
Mechanistically, glucuronidation involves the transfer of d-glucuronic acid
from UDP–glucuronic acid to an acceptor compound such as an alcohol,
amine or carboxylate. The reaction proceeds by nucleophilic SN2 substitution
of the acceptor at the C-1 carbon of glucuronic acid, the product of these
reactions undergoing inversion of configuration. While understanding the
mechanism can play a part in the design of drugs, structure–metabolism
relationships for glucuronidation have been much less studied than either of
the reactions described above.
Drug Metabolism In Vitro and In Vivo Results 57
Copyright © 2005 CRC Press, LLC
7/21/2019 Using Mass Spectrometry for Drug Metabolism Studies
http://slidepdf.com/reader/full/using-mass-spectrometry-for-drug-metabolism-studies 66/362
To further complicate things, as was the case for both CYPs and esterases,
UDP–glucuronyl transferases exist as a family of closely related isozymes [92].
Relatively little is known about the subtleties of substrate and active site
interactions for each of the various isozymes. Consequently, it is difficult topredict which factors cause some compounds to be poor substrates for
conjugation even though they may have a suitable handle for conjugation [6].
As a consequence, there are comparatively few rules to guide drug design other
than to avoid putting an easily conjugated group on a molecule unless it is
sterically shielded.
2.4.1.4 Experimental models for metabolism
There are multiple variations of the process for conducting metabolic stabilitystudies. Recent reviews by Thompson [8, 11] and by Eddershaw and Dickins
[21] summarizing many of the variables involved in the in vitro experiments for
determining metabolic stability. Three recent examples of typical metabolic
stability studies can be cited [93–95]. Many more such reports should appear
in the near future as this approach becomes more common. It must be
emphasized that the throughput of these studies remains much lower than
high-throughput pharmacology screens.
2.4.2 Biliary excretion
Biliary excretion can occur by passive diffusion, which is governed by
physicochemical properties, or by active transport [13]. Drugs that are actively
transported tend to be ionized (either anionic or cationic) with molecular
weights >400 and contain further polar (H-bonding) groups. Functionally,
biliary excretion is considered to be a three-step process [96]:
Uptake of drugs from blood into the hepatocyte at the sinusoidal
(basolateral) membrane by both passive diffusion and active transport Transfer of drugs to metabolic sites and/or the biliary canalicular
membrane, mediated by intracellular transfer proteins and passive
diffusion Excretion at the canalicular membrane of unchanged drug, metabolites or
a combination of both parent drug and metabolites, mainly via active
secretion
The transporter proteins with the greatest potential for hepatic drug uptake
are OATP-B, C and 8 and for efflux are P-gp and MRP2, sometimes called
cMOAT [65, 96]. The transporters involved in hepatic uptake [97–104] andefflux [98, 105–112] of drugs are listed in Tables 2.3 and 2.4, respectively, and
depicted in Figure 2.7.
2.4.2.1 Hepatic uptake
Recent expression cloning approaches have revealed the presence of multiple
members of the organic anion transporting polypeptide (OATP-1) family,
58 Using Mass Spectrometry for Drug Metabolism Studies
Copyright © 2005 CRC Press, LLC
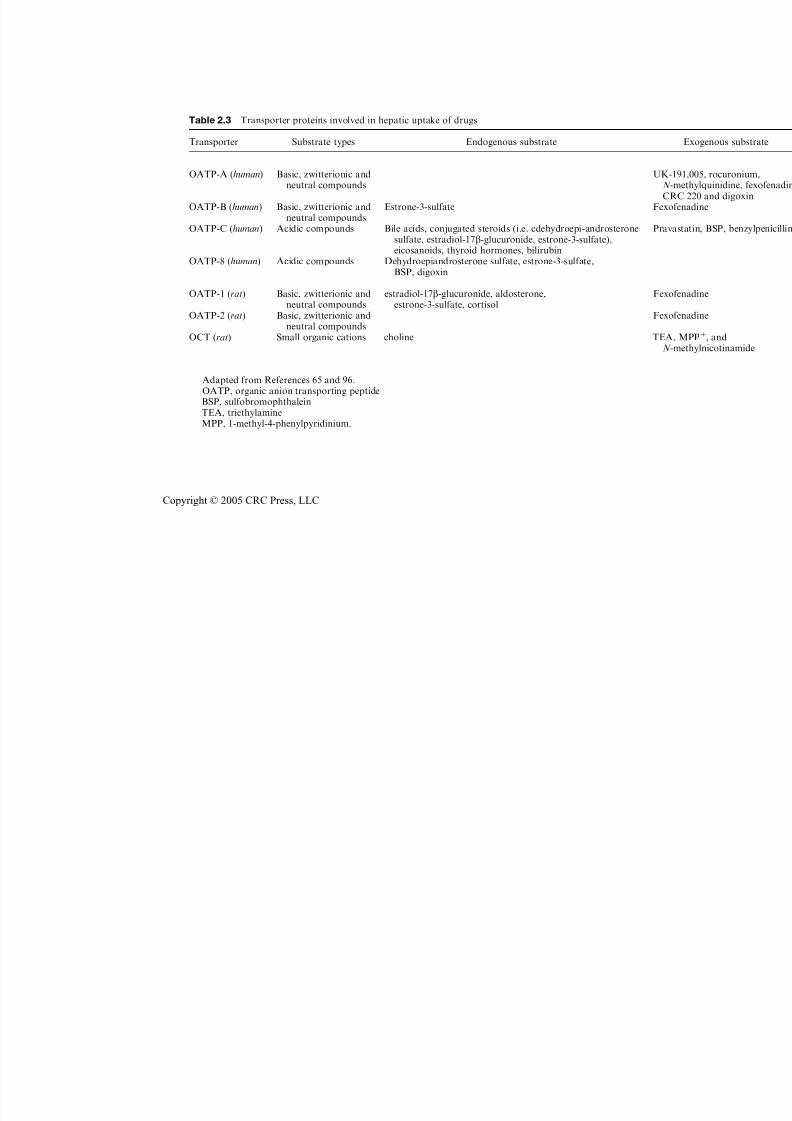
7/21/2019 Using Mass Spectrometry for Drug Metabolism Studies
http://slidepdf.com/reader/full/using-mass-spectrometry-for-drug-metabolism-studies 67/362
Table 2.3 Transporter proteins involved in hepatic uptake of drugs
Transporter Substrate types Endogenous substrate
OATP-A (human) Basic, zwitterionic andneutral compounds
OATP-B (human) Basic, zwitterionic andneutral compounds
Estrone-3-sulfate
OATP-C (human) Acidic compounds Bile acids, conjugated steroids (i.e. cdehydroepi-androsteronesulfate, estradiol-17b-glucuronide, estrone-3-sulfate),
eicosanoids, thyroid hormones, bilirubinOATP-8 (human) Acidic compounds Dehydroepiandrosterone sulfate, estrone-3-sulfate,BSP, digoxin
OATP-1 (rat) Basic, zwitterionic andneutral compounds
estradiol-17b-glucuronide, aldosterone,estrone-3-sulfate, cortisol
OATP-2 (rat) Basic, zwitterionic andneutral compounds
OCT (rat) Small organic cations choline
Adapted from References 65 and 96.OATP, organic anion transporting peptideBSP, sulfobromophthaleinTEA, triethylamineMPP, 1-methyl-4-phenylpyridinium.
Copyright © 2005 CRC Press, LLC
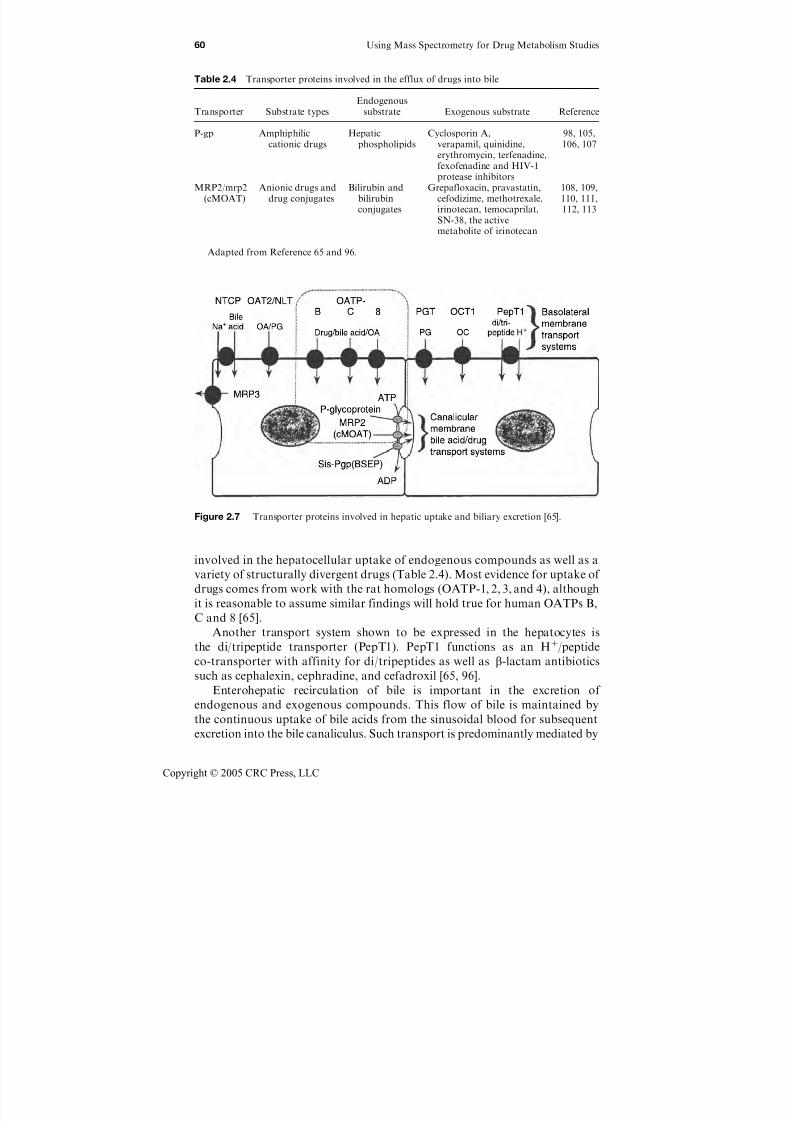
7/21/2019 Using Mass Spectrometry for Drug Metabolism Studies
http://slidepdf.com/reader/full/using-mass-spectrometry-for-drug-metabolism-studies 68/362
involved in the hepatocellular uptake of endogenous compounds as well as a
variety of structurally divergent drugs (Table 2.4). Most evidence for uptake of
drugs comes from work with the rat homologs (OATP-1, 2, 3, and 4), although
it is reasonable to assume similar findings will hold true for human OATPs B,
C and 8 [65].
Another transport system shown to be expressed in the hepatocytes is
the di/tripeptide transporter (PepT1). PepT1 functions as an Hþ/peptide
co-transporter with affinity for di/tripeptides as well as b-lactam antibiotics
such as cephalexin, cephradine, and cefadroxil [65, 96].
Enterohepatic recirculation of bile is important in the excretion of
endogenous and exogenous compounds. This flow of bile is maintained by
the continuous uptake of bile acids from the sinusoidal blood for subsequent
excretion into the bile canaliculus. Such transport is predominantly mediated by
Figure 2.7 Transporter proteins involved in hepatic uptake and biliary excretion [65].
Table 2.4 Transporter proteins involved in the efflux of drugs into bile
Transporter Substrate typesEndogenous
substrate Exogenous substrate Reference
P-gp Amphiphiliccationic drugs
Hepaticphospholipids
Cyclosporin A,verapamil, quinidine,erythromycin, terfenadine,fexofenadine and HIV-1protease inhibitors
98, 105,106, 107
MRP2/mrp2(cMOAT)
Anionic drugs anddrug conjugates
Bilirubin andbilirubinconjugates
Grepafloxacin, pravastatin,cefodizime, methotrexale,irinotecan, temocaprilat,SN-38, the activemetabolite of irinotecan
108, 109,110, 111,112, 113
Adapted from Reference 65 and 96.
60 Using Mass Spectrometry for Drug Metabolism Studies
Copyright © 2005 CRC Press, LLC
7/21/2019 Using Mass Spectrometry for Drug Metabolism Studies
http://slidepdf.com/reader/full/using-mass-spectrometry-for-drug-metabolism-studies 69/362
Naþ-dependent taurocholate cotransporting polypeptide (NTCP). So far, this
transporter has not been implicated in the excretion of any drugs. However,
given the recent findings which emphasize an important role of bile acids as
ligands for a number of orphan nuclear hormone receptors involved incholesterol metabolism (FXR) and CYP expression (PXR), NTCP is likely to be
important in the regulation of other transporter(s) and CYP expression [65, 96].
2.4.2.2 Hepatic efflux
P-glycoprotein (P-gp), the best known of efflux transporters, is a 170 kDa,
ATP-dependent transmembrane efflux pump for a large range of amphipathic
hydrophobic substrates. The human genes are MDR1 and MDR2, while the
corresponding rodent (mouse) genes are termed mdr 1 (or mdr 1b), mdr 2 andmdr 3 (or mdr 1a). P-gp is also known to have significant substrate overlap with
the drug metabolizing enzyme CYP 3A. This is an important consideration to
drug disposition in man since both CYP 3A and P-gp are co-expressed in
tissues such as the intestinal enterocytes and hepatocytes. However, it should
be emphasized that not all CYP 3A substrates are P-gp substrates and vice
versa [65].
Another transporter is the ATP-dependent canalicular multiple organic
anion transporter (cMOAT), or more commonly known as multidrug
resistance associated protein (MRP2). This transporter appears to beresponsible for the biliary excretion of organic anions, glutathione conjugates,
glutathione disulfide, and some b-lactam antibiotics.
2.4.2.3 Experimental models for biliary excretion
Prediction methods to describe the excretion kinetics quantitatively are at an
early development stage, although it is likely that with the provision of
appropriate biochemical and molecular tools or probes, structure–activity
relationships for the major hepatobiliary uptake (e.g., OATPs) and efflux (P-gp,
MRP2) proteins in different species will soon emerge [13]. However, for now,
biliary excretion processes should be considered qualitative [13, 19]. Never-
theless, work on biliary excretion models is actively being pursued. For example,
biliary excretion of selected compounds has been successfully predicted by using
sandwich hepatocytes cultures [114], which seem to rebuild a bile canalicular
network and maintain some of the biliary secretion capabilities [115].
Species differences in the transport activity mediated by cMOAT were
examined for 2,4-dinitrophenyl-S -glutathione, a typical substrate for
cMOAT, using bile duct canalicular membrane vesicles. The K m and V max
values for ATP-dependent uptake of 2,4-dinitrophenyl-S -glutathione into
canalicular membrane vesicles were determined and a close in vivo and
in vitro correlation was observed among animal species for the transport
clearance across the bile canalicular membrane. These results suggest that
the uptake experiments with canalicular membrane vesicles can be used
Drug Metabolism In Vitro and In Vivo Results 61
Copyright © 2005 CRC Press, LLC
7/21/2019 Using Mass Spectrometry for Drug Metabolism Studies
http://slidepdf.com/reader/full/using-mass-spectrometry-for-drug-metabolism-studies 70/362
to quantitatively predict in vivo excretion across the bile canalicular
membrane [116].
Cvetkovic and co-workers utilized a heterologous expression system to
determine that human OATP and rat OATPs 1 and 2, mediated the uptakeof 14C fexofenadine. Similarly, the same group used the LLC-PK1 cell, a
polarized epithelial cell line lacking P-gp, and the derivative cell line (LMDR1),
which overexpresses P-gp to establish that P-gp was a fexofenadine efflux
transporter [98].
Because identification of compounds that are P-gp substrates may predict
biliary propensity towards biliary excretion, Polli and co-workers evaluated
three assays used to determine whether compounds are P-gp substrates [70]. As
stated earlier, 66 compounds were tested in MDCK monolayer efflux, ATPase,
and calcein AM assays. All assays detected substrates across a broad range of Papp but the efflux assay was more prone to fail at high Papp whereas the
calcein AM and ATPase assays were more prone to fail at low Papp. When Papp
is low, efflux is a greater factor in the disposition of P-gp substrates. The
MDCK efflux assay is more reliable at low-to-moderate Papp and is the method
of choice for evaluating drug candidates despite low throughput and reliance
on liquid chromatography with tandem mass spectrometry [70].
2.4.3 Renal excretion
2.4.3.1 Mechanism of renal excretion
Drugs not dependent on metabolism or biliary excretion for clearance will, in
most cases, be renally cleared. Lipophilicity is an important parameter in
governing the relative proportion of metabolic versus renal clearance.
Increasing lipophilicity affects the binding of xenobiotics to the active site of
many of the enzymes of drug metabolism, particularly the CYPs. As a result,
increasing lipophilicity to log D7.4>0 will increase metabolic clearance, while atthe same time, it will likely decrease renal clearance and vice versa [6]. As a
general rule, passive renal filtration usually occurs with water-soluble
compounds with log D7.4<0, whereas reabsorption of a drug will be near
complete at log D7.4 above 0 [2, 6, 13].
Renal clearance can be often be predicted by using glomerular filtration
rate (GFR) and the fraction unbound ( f u) across species [13]:
CLr ¼ GFR f u: ð2:16Þ
However, this relation does not always hold true. Sometimes CLr exceeds
GFR, which is attributed to the presence of active secretion [2]. In fact, both
active secretion and reuptake are now known to be mediated by transporter
proteins [96]. In that case, the above relationship should be modified such that:
CLr ¼ ðGFR f uÞ þ CLsecretion CLreabsorption: ð2:17Þ
62 Using Mass Spectrometry for Drug Metabolism Studies
Copyright © 2005 CRC Press, LLC
7/21/2019 Using Mass Spectrometry for Drug Metabolism Studies
http://slidepdf.com/reader/full/using-mass-spectrometry-for-drug-metabolism-studies 71/362
For example, OAT proteins are involved in active renal secretion of substrates
such as cimetidine, methotrexate, cidofovir, and adefovir. Other drugs, such as
probenecid, b-lactam antibiotics, and nonsteroidal antiinflammatory drugs, are
also known to interact with this transporter [96].For drugs excreted primarily by active renal secretion, species differences
are known to occur, although they tend to be less prominent than with hepatic
clearance, with only up to two-fold overestimation of renal clearance from
animals to humans. One possible explanation for such species differences in
pharmacokinetics is that transport proteins are not well conserved across
species [96].
2.4.3.2 Models for renal excretion
The prediction of renal clearance for humans has been quite successful using
interspecies allometric scaling approaches, although the limitation is that it
requires experiments in four to five species. A simpler approach for predicting
human renal clearance is based on the observation that the ratio of GFR
between rats and humans is proportional to the ratio of renal clearances. Thus,
in vivo urinary excretion data in rats and other species has been used to
estimate renal clearance of drugs in humans [117].
2.5 Distribution of Drugs
The distribution of a drug to specific tissues is determined, in part, by drug-
independent physiological factors such as blood flow to the tissue and the
volume of the tissue. However, distribution is also determined by the unique
physicochemical properties of each drug which control its affinity for blood
components (usually plasma proteins) relative to its affinity for tissues [6, 13].
Furthermore, it is now understood that the presence of active transporters incertain tissues such as liver [65, 96] and brain [96, 118] also play an important
role in determining tissue distribution.
2.5.1 Active transporters
Most of the relevant drug transporters have now been identified, and increasing
evidence supports an important role of a few key transporters in the hepatic
uptake of most drugs, rather than a large number of transporters with narrow
substrate specificities. Transporters with the greatest potential for drug uptake
are OATP-B, C and 8 and for efflux are P-gp and MRP2 (cMOAT) [65]. In
particular, P-gp is perhaps the best known and studied. Although first studied
by virtue of being expressed at high levels in some cancers, it is now known
that normal tissues also express P-gp. For example, the canalicular domain of
hepatocytes, kidney (proximal tubule), small intestine (brush border), colon,
adrenal glands, and the capillary endothelium of the brain and testes all express
Drug Metabolism In Vitro and In Vivo Results 63
Copyright © 2005 CRC Press, LLC
7/21/2019 Using Mass Spectrometry for Drug Metabolism Studies
http://slidepdf.com/reader/full/using-mass-spectrometry-for-drug-metabolism-studies 72/362
P-gp. In fact, because of its ubiquitous nature, it has been suggested P-gp plays
an important role in limiting entry of xenobiotics into specific anatomic sites
such as the brain and gastrointestinal tract and in facilitating their systemic
removal by secretory mechanisms in liver and kidney [65]. The latter aspectswere covered in more detail under biliary and renal clearance.
2.5.2 Plasma protein binding
Most drugs are reversibly bound to plasma proteins such as plasma albumin,
lipoproteins and glycoproteins [2]. This is significant for distribution because it
is only the free drug in plasma that is in equilibrium with the free drug in the
tissues. Thus, the relative equilibrium between free and protein bound drug in
both plasma and tissues will affect the extent of tissue distribution [2, 6].Therefore, plasma protein binding is equally important to tissue binding as
factors affecting the drug disposition and potency of drugs [15].
2.5.2.1 Relationship of protein binding to structure
Binding on albumin can occur at two distinct sites [2]:
Site I, also called the warfarin site, binds bulky heterocyclic molecules with
a negative charge centered in a largely lipophilic structure Site II, the indole or benzodiazepine binding site, binds drugs with an
extended structure carrying a negative charge away from the nonpolar
region
Specific binding interactions will depend on the chemical class of the drug.
For neutral compounds, hydrophobic interactions can occur with plasma
proteins and many studies report a log–linear relationship between binding and
lipophilicity [2]. As log D increases, plasma protein binding increases and free
fraction decreases [6].
Acidic drugs (pK a<7.4) are predominantly negatively charged at physio-logical pH. Albumin, the predominant protein in the plasma, is a basic protein.
Therefore, organic acids are highly bound to plasma proteins via ion-pair and
lipophilic interactions with albumin [6].
Bases are positively charged at physiological pH and hence can bind by
both ion pair and hydrophobic interactions to albumin, as well as al-acid
glycoprotein and membrane phospholipids. Within the log D range of 1 to 4,
bases tend to have similar plasma protein binding to neutrals [6].
2.5.2.2 Experimental models for determining plasma protein binding
Because of the importance of plasma protein binding in drug disposition and
potency, the determination of in vitro plasma protein binding is important
during the lead optimization phase of drug discovery [15]. Equilibrium dialysis
is the preferred method for determining the free drug fraction, because it is less
susceptible to experimental artifacts. However, even low-volume standard
64 Using Mass Spectrometry for Drug Metabolism Studies
Copyright © 2005 CRC Press, LLC

7/21/2019 Using Mass Spectrometry for Drug Metabolism Studies
http://slidepdf.com/reader/full/using-mass-spectrometry-for-drug-metabolism-studies 73/362
equilibrium dialysis is currently not amenable to the HTS format. Kariv and
co-workers developed a 96-well equilibrium dialysis plate and validated their
model with three drugs of low, intermediate, and high binding properties
(propranolol, paroxetine, and losartan, respectively) [119]. The apparentfree fraction obtained by this method correlates with the published values
determined by the traditional equilibrium dialysis techniques. This technology
was further extended with the introduction of a commercially available 96-well
equilibrium dialysis block designed to be compatible with most standard
96-well format laboratory supplies and instruments [120].
Another high-throughput method of note is that described by Wring and
colleagues which utilized 96-well ultrafiltration that was automated with a
Tecan Genesis robot. Samples were analyzed by dual LC–MS/MS bioanalysis
with fast-gradient chromatography [121].Gu et al. described a method to measure binding of drugs to human serum
albumin using pulsed ultrafiltration [122]. The throughput of pulsed ultra-
filtration analyses was tripled compared to previous pulsed ultrafiltration
measurements by reducing the volume of the chamber. In addition, the use of
LC–MS with pulsed ultrafiltration permitted the simultaneous comparison
and rank ordering of ligand mixtures for binding to serum albumin. The
throughput of these pulsed ultrafiltration measurements was tripled again by
analyzing three ligands as a mixture [122].
The spectrofluorometric method of Parikh et al. shows some promise as ahigh-throughput method [123]. Measurements can be carried out with small
samples in multiwell plates and no separation of bound and unbound species is
required since the method relies on the quenching of the intrinsic tryptophan
fluorescence of serum albumin and a1-acid glycoprotein on binding of the
drug [123].
2.5.3 Tissue binding and volume of distribution
Distribution of a drug to tissues is difficult to measure directly. Consequently,
a convenient measure of distribution is the apparent volume of distribution
(V d), which is obtained indirectly by analyzing the plasma concentration/time
profile following intravenous administration. This term is indicative of the
general distribution properties of a drug but provides no information on
distribution into specific tissues [6, 13].
Factors summarizing passive diffusion into tissues are summarized in
Equations 2.18 and 2.19.
V d ¼ V p þ ðV tK pÞ, ð2:18Þ
V d ¼ V p þ ðV t f u= f utÞ, ð2:19Þ
where V p is the volume of plasma, V T is the volume of tissues, K p is the tissue-
to-plasma concentration ratio and f u and f ut are the free fractions in plasma
and tissue, respectively [124].
Drug Metabolism In Vitro and In Vivo Results 65
Copyright © 2005 CRC Press, LLC
7/21/2019 Using Mass Spectrometry for Drug Metabolism Studies
http://slidepdf.com/reader/full/using-mass-spectrometry-for-drug-metabolism-studies 74/362
Thus, it can be clearly seen that charge, lipophilicity, and plasma protein
binding are important determinants for the volume of distribution of a
drug [6]. As the above equation demonstrates, it is important to remember that
it is only free (unbound) drug that is available to distribute in and out of tissuesand that it is distribution and clearance of unbound drug that determines free
drug concentrations at steady state [13].
2.5.3.1 Relationship of tissue binding and V d to structure
As shown earlier, the half-life of a drug is related to both its clearance (CL) and
its volume of distribution (V d). In simple terms, the higher the V d, the smaller
the proportion of the dose of drug in the circulation and the less, therefore,
available for clearance [6]. It would seem that both parameters could be
modified by chemists in order to affect the duration of action. While clearance
can be manipulated by structural changes for desired effects, as a practical
matter, the structural requirements for binding to a pharmacophore can
often define the physicochemical properties that predetermine distribution
characteristics [13].
Apart from blood flow to the tissue and volume of the tissue, tissue to
plasma concentration ration (K p
) is dependent on certain molecular properties
such as pK a and lipophilicity. As might be expected, tissue distribution pat-
terns are dependent on whether molecules are neutral, acidic or basic at
physiological pH [6, 13].
For neutral compounds, the distribution of is governed by hydrophobic
interactions with plasma proteins and tissue membranes. Since charge is not a
factor, the value of log D determines distribution:
As log D increases, plasma protein binding increases and free fraction
decreases
Also as log D increases, tissue affinity increases and fraction unbound intissues decreases
For compounds with drug-like values of log D between 1 and 4 [35], V dtends to be confined in the range 0.5–5 L/kg
Acidic drugs (pK a<7.4) are predominantly negatively charged at physiological
pH, and thus can exhibit both ion pair and hydrophobic interactions resulting
in the following distribution patterns:
Acids tend to be highly bound to plasma proteins, particularly albumin.
Because of unfavorable charge–charge interactions with negativelycharged phospholipids of tissue membranes, acids tend to have very low
tissue affinity. Hence, because the value of K p is very small, the V d of acidic compounds
tends to be very low, typically 0.5 L/kg or less.
Bases are positively charged at physiological pH and hence can bind by both
ion pair and hydrophobic interactions to albumin, al-acid glycoprotein and
66 Using Mass Spectrometry for Drug Metabolism Studies
Copyright © 2005 CRC Press, LLC
7/21/2019 Using Mass Spectrometry for Drug Metabolism Studies
http://slidepdf.com/reader/full/using-mass-spectrometry-for-drug-metabolism-studies 75/362
membrane phospholipids:
Within the log D range of 1 to 4, bases tend to have similar plasma
protein binding to neutrals.
Because of favorable charge–charge interaction with membrane phospho-lipids, bases have higher tissue affinity and lower f ut than acids or neutrals.
As a result, bases can have much higher volumes of distribution than are
observed for either acids or neutrals.
2.5.3.2 Experimental methods for determining V d
Prediction of human PK remains a central goal of the drug discovery process.
Given the importance of distribution to efficacy and duration of drug action,
much effort has gone into predicting distribution. Among the various models
used to predict drug distribution some have been purely theoretical, some have
been experimental, or a hybrid of both. Most models center around three main
approaches: (1) QSAR-type models, (2) in vitro dialysis or (3) allometric
scaling.
As an example of the first approach, Lombardo et al. described a method
for the prediction of volume of distribution in humans based on two
experimentally determined physicochemical parameters, E log D7.4
[39] and
the fraction of compound ionized at pH 7.4 (derived from pK a), and on the
fraction of free drug in plasma ( f u) determined from protein binding data [125].
The fraction unbound in tissues ( f ut), was determined via a regression analysis
from 64 compounds using the parameters described, and was then used to
predict V d via the Oie–Tozer equation [126]:
V d ¼ V pð1 þ REIÞ þ f uV pðV E=V p RE
IÞ þ V R f u= f ut, ð2:20Þ
where the parameters V p, V E, and R EI
are taken to be the plasma and
extracellular fluid volumes and the ratio of extravascular to intravascular
proteins, respectively, with corresponding values in human of 0.0436 and
0.151 L/kg body weight for V p and V E, respectively and approximately 1.4
for R EI. Accuracy of this method was determined using a test set of 14
compounds, and it was demonstrated that human V d values could be predicted
to within about two-fold of the actual value.
It has been proposed that distribution of unbound drug is similar across
species and that species differences in V d can be explained by differences inplasma protein binding, giving rise to estimation of V d by allometric models.
Such approaches are typified by the report of Obach et al. who estimated V d in
humans from V d determined in dog corrected for the differences in plasma
protein binding in man and dog [81]:
V d,man ¼ V d,dog f u,man= f u,dog: ð2:21Þ
Drug Metabolism In Vitro and In Vivo Results 67
Copyright © 2005 CRC Press, LLC
7/21/2019 Using Mass Spectrometry for Drug Metabolism Studies
http://slidepdf.com/reader/full/using-mass-spectrometry-for-drug-metabolism-studies 76/362
2.5.4. CNS penetration
Combinatorial synthesis and high-throughput pharmacology screening have
greatly increased compound throughput in modern drug discovery programs.For central nervous system (CNS) drugs, there is an additional requirement of
determining permeability to the blood–brain barrier (BBB).
2.5.4.1 The blood–brain barrier
The BBB is comprised of three cell types: cerebromicrovascular endothelial
cells connected by tight junctions, astrocytes, and the supporting pericytes
[96, 118]. Brain microvascular endothelial cells lack fenestrations, have few
pinocytotic vesicles and express a variety of metabolic enzymes and effluxtransporters such as P-gp [96]. These features make the BBB a formidable
barrier the drugs must overcome to reach the brain parenchyma [127]. Passage
across the BBB is determined by physicochemical properties described below
or by being actively transported into or out of the CNS.
2.5.4.2 Relationship of structure to CNS permeability
Chemists have worked diligently to either increase or limit the permeability of
drugs to the brain depending on the therapeutic goal. By now, a number of factors are recognized that distinguish CNS drugs from non-CNS drugs [127]:
Analysis of 18 physicochemical properties revealed that the CNS drug set
had several properties associated with enhanced membrane permeability,
including fewer hydrogen bond donors, fewer positive charges, greater
lipophilicity, lower polar surface area, and reduced flexibility compared
with the non-CNS group (P<0.05). To enhance CNS penetration, a compound should have a MW<450, and
total polar surface area (PSA) <90 A ˚ [128].
For delivery to the CNS, a drug should ideally have an in vitro passivepermeability>150 nm/s.
The CNS drug set should not be a good P-gp substrate [96], defined as a
B!A/A!B ratio <2.5 [127].
2.5.4.3 Role of active transport in CNS permeability
The inverse relation between permeability to the CNS and affinity for P-gp
highlights the important role played by P-gp and other active transporters.
In particular, P-gp has come to be recognized as an important contributor to
the BBB because a number of highly lipophilic compounds which should have
ideal properties to cross the BBB have been found to have poor CNS
permeability. This unexpected poor permeability is presumably because they
are good substrates for P-gp, as demonstrated convincingly by experiments
with P-gp null mice [96 and references therein]. The role of drug transporters in
determining distribution to the CNS has been reviewed [65, 129].
68 Using Mass Spectrometry for Drug Metabolism Studies
Copyright © 2005 CRC Press, LLC

7/21/2019 Using Mass Spectrometry for Drug Metabolism Studies
http://slidepdf.com/reader/full/using-mass-spectrometry-for-drug-metabolism-studies 77/362
2.5.4.4 Experimental models for determining CNS permeability
A variety of theoretical or experimentally determined physicochemical descrip-
tors have been investigated as predictors of in vivo BBB permeability [130, 131].In general, such descriptors correlate well with in vivo brain penetration for
drugs that undergo passive transcellular diffusion. However, physicochemical
descriptors do not account for the role of cerebromicrovascular endothelial cell
metabolism or active transport or efflux in the overall BBB permeability of a
drug. In particular, major drug efflux mechanisms such as the P-gp transporter
contribute significantly to prevention of drug permeability, although its
substrate specificity is clearly very broad and not yet well defined [118].
To account for active transport or efflux, a variety of cell-based models
have been employed. However, these cell-based models are not without theirown limitations. While cultures of brain capillary endothelial cells retain many
morphological and biochemical properties (including transporters such as
P-gp) similar to the BBB in vivo, they generally do not form sufficiently tight
cell junctions. To some extent, co-culturing with astrocytes and using
astrocyte-conditioned media can help [15].
It is clear that any in vitro BBB cell model utilized for the screening of
potential CNS drugs must display reproducible substrate permeability. The
precision of such systems, is improved by comparison of the permeability data
for the test molecules to permeability data for low (e.g., sucrose) and high (e.g.,diazepam or propranolol) brain-penetrating solutes used as internal controls
within the experiment. Beyond this, a number of other general criteria for
model appropriateness may be defined [118]:
The cell model must display a restrictive paracellular pathway. The model should possess a physiologically realistic cell architecture. The model should display functional expression of transporter mecha-
nisms.
The cell model should allow for ease of culture to facilitate highthroughput screening.
For any model to be validated as an acceptable discriminatory screen, these
criteria should be taken into account.
The bovine brain microendothelial cell (BBMEC) model was one of the first
cell-based methods, which permitted study of the BBB [132]. This model had
the advantages of being an in vitro technique that exhibited many of the
characteristics of the BBB. Using this technique, morphologically intact
endothelial cells can be cultured that maintain physiologically relevant
characteristics such as (1) no fenestra, (2) few pinocytic vesicles, (3) tight
intercellular junctions, and (4) an abundance of mitochondria. Secondly, this
model maintains the biochemical characteristics of brain microvessel endothe-
lial cells, including active enzymes such as (1) alkaline phosphatase, (2) gamma-
glutamyl transpeptidase, and (3) angiotensin-converting enzyme. Finally, this
model also expresses transporter proteins such as P-gp, a protein thought to be
an important component of the overall integrity of the BBB.
Drug Metabolism In Vitro and In Vivo Results 69
Copyright © 2005 CRC Press, LLC
7/21/2019 Using Mass Spectrometry for Drug Metabolism Studies
http://slidepdf.com/reader/full/using-mass-spectrometry-for-drug-metabolism-studies 78/362
Otis et al. [133] describe modifications to the method of Audis and
Borchardt [132], in the (1) isolation and culture of the microvessel endothelial
cells themselves, (2) experimental design, and (3) analysis of the samples by
LC–MS. They reported improved throughput and cycle time while preservingthe predictive value of the original method. The result was a robust, facile
screen for determination of CNS permeability of multiple compounds.
BBMEC data has not always correlated well with in vivo data. Among the
possible reasons for this are (1) different levels of P-gp expression or metabolic
properties in these two barriers, (2) the dynamic equilibrium with brain
clearance factors that occurs in vivo, or (3) the aforementioned lack of
intracellular junctions that are not as tight as in vivo.
Cell lines derived from other tissues also have been examined. For example,
the ECV304 bladder carcinoma cell line will achieve very low paracellularpermeability and have much tighter BBB-like cell junctions if pretreated with
the differentiating agent butyric acid, or compounds which elevate cAMP, but
such cell lines still lack P-gp expression. Caco-2 cultures have also been
proposed as a model for CNS permeability. However, even though Caco-2
cultures possess P-gp and have tight cell junctions, a comparison of Caco-2
data with in vitro and in vivo BBB data revealed a poor correlation [118].
Another cell line that has been studied to overcome some of the limitations
of the bovine brain epithelial cell model is the epithelial MDCK cell line. These
cells usually possess tighter junctions than BBMEC or Caco-2, butunfortunately still have little P-gp. However, an MDCK cell line (derived
from wild-type MDCK-II cells) has been stably transfected with the human
MDR-I gene leading to the polarized overexpression of P-gp to solve this issue
[15, 118, 127].
In their 2001 review, Gumbleton and Audis have concluded that because
immortalized cell lines universally fail to generate a sufficiently restrictive
paracellular barrier for use in transendothelial permeability investigations, a
number of in vitro techniques should be exploited. This includes not only
permeability data derived from in vitro cell models, but also transfer across
artificial membranes, and physicochemical predictors derived from a drug’s
molecular structure [118].
2.6 Integration of DMPK data
Optimizing permeability, metabolic stability, solubility and other DMPK
properties through structure modification while still maintaining potency can
be quite daunting. This is primarily due to the opposing requirements of the
properties for intestinal permeability, distribution, metabolism, and biliary or
renal clearance. For example, increasing a compound’s lipophilicity generally
increases membrane permeability and receptor binding affinity, but at the same
time, also may make the compound a better substrate for CYPs, thus resulting
in more rapid metabolism [6]. Conversely, increasing a compound’s polarity
makes it more water soluble, but also less membrane permeable. Thus, design
70 Using Mass Spectrometry for Drug Metabolism Studies
Copyright © 2005 CRC Press, LLC

7/21/2019 Using Mass Spectrometry for Drug Metabolism Studies
http://slidepdf.com/reader/full/using-mass-spectrometry-for-drug-metabolism-studies 79/362
of drugs with both optimal potency and PK properties is very challenging given
the opposing requirements for absorption and metabolism and the general lack
of sufficient in vitro and in vivo data sets for a large diversity of compounds in
guiding this process.Recently, several attempts have been made to integrate in vitro intestinal
permeability and metabolic stability data in parallel with the in vivo
pharmacology and PK studies during the lead candidate selection and
optimization process [134–137]. While good correlations between in vitro and
in vivo data were made, these studies were limited to relatively small series of
compounds, and included only a limited number of species such as rats or
guinea pigs, but not humans.
These limitations were addressed in a retrospective study of Pfizer
compounds by Obach et al. [81]. In this study, the authors proposed a modelto predict human bioavailability, clearance and other PK parameters from
in vitro metabolism and in vivo animal PK data. Although this model did not
rely on integration of permeability and metabolic clearance in estimating oral
bioavailability, it did yield acceptable predictions (within a factor of 2) for the
compounds in this dataset. However, this model and others like it
predominantly rely on in vivo animal PK data for interspecies scaling needed
to predict human PK, which limits suitability for support discovery projects
where higher throughput ADME screening is needed. At the early stage of
drug discovery, the goal of integrative DMPK models should not to makeprecise, quantitative predictions, but rather, to forecast whether a given
compound will have satisfactory pharmacokinetic properties in animals or
humans. The intent should be to use a predictive model in conjunction with a
high throughput in vitro ADME screens rational lead selection. Then, as the
compounds proceed along the discovery–development continuum, more
detailed DMPK models can be applied as needed.
As an example of such an approach, Mandagere et al. [138] have described
an intuitive, graphical model for estimating oral bioavailability in humans or
any other species from in vitro data, without the need for in vivo interspecies
scaling. They demonstrated the predictive capacity and the utility of this model
with 20 structurally diverse compounds from 10 different therapeutic areas
with a wide range of %F values (Figure 2.8). The main utility of this graphical
model was its ability to rapidly classify compounds into groups of acceptable
and unacceptable bioavailability in humans and any other species. By use of
such a model, unacceptable compounds can be eliminated early, allowing focus
on the promising compounds for further in vivo evaluations.
2.7 Summary
It was reported as early as 1988 that one of the major reasons that drugs fail in
the clinics was due to poor pharmacokinetic properties [23]. In response, the
past two decades have witnessed the widespread incorporation of in vitro
ADME approaches into drug development by drug companies. The current
Drug Metabolism In Vitro and In Vivo Results 71
Copyright © 2005 CRC Press, LLC

7/21/2019 Using Mass Spectrometry for Drug Metabolism Studies
http://slidepdf.com/reader/full/using-mass-spectrometry-for-drug-metabolism-studies 80/362
philosophy of drug development is moving to a fail ‘early–fail cheaply’paradigm [28]. Currently, ADME approaches, especially in vitro ADME
methods, are being applied to drug candidates earlier in the discovery–
development continuum [8, 11, 16].
These trends notwithstanding, there are still two intransigent problems that
still persist. First, in a recent review, Smith and colleagues have maintained
that the alignment of DMPK departments with drug discovery has not
produced a radical improvement in the pharmacokinetic properties of new
chemical entities entering development as was expected [139]. At best,
molecules with adequate, rather than optimal, pharmacokinetic properties
have been developed. If anything, the greatest success of drug metabolism has
been to contribute to the development of compounds with suboptimal PK
properties which otherwise might have failed in the clinic [139].
Second, despite significant efforts by drug metabolism scientists in both
academia and industry, the ability to model or predict pharmacokinetic
properties from preclinical experimental data so far has been an elusive goal.
Again, what successes have been achieved in modeling reflect the ability to
provide qualitative rather than quantitative prediction of properties [139].
In fact, it is becoming increasingly evident that optimal pharmacokinetic
properties may be not be achievable within a given discovery program. The
reasons for the first point are complex, reflecting in part the difficulty of
combining potency, selectivity, water solubility, metabolic stability, and
membrane permeability into a single molecule [138–140]. Chemists are finding
that to achieve novel drug targets, drug design is being forced into areas of
chemical space where pharmacokinetic issues are more frequent [140].
Figure 2.8 Graphical depiction of the relation of metabolic stability and permeability to oralbioavailability [138].
72 Using Mass Spectrometry for Drug Metabolism Studies
Copyright © 2005 CRC Press, LLC
7/21/2019 Using Mass Spectrometry for Drug Metabolism Studies
http://slidepdf.com/reader/full/using-mass-spectrometry-for-drug-metabolism-studies 81/362
Because of this limitation, precise prediction of DMPK properties not only
be unnecessary, but perhaps even futile. Regarding this point, Lipinski has
stated that ADME properties exist in simpler chemistry space than activity and
that simple rules and filters work reasonably well. Ironically, structure–activityrelationships for large ADME data sets are less robust than for small data sets
because most ADME properties are multi-mechanism. In contrast to models
for single mechanism assays, models for multi-mechanism assays (e.g.,
solubility or metabolic stability) typically get worse as more data is
accumulated [140].
In light of the above facts, one of the more important developments of the
future may be to finally realize our limitations when it comes to drug design
and ADME properties. As Smith has said, the most valuable contribution of
drug metabolism and pharmacokinetics to drug discovery may, in fact, be toenable the design of pharmacokinetically acceptable rather than ideal
molecules [139]. If that postulate is accepted, then the goals for DMPK
departments become more modest, but achievable. Depending on the stage of
the discovery–development continuum, there are three goals [139]:
Educate and facilitate drug design such that disposition properties are
considered equally to those of pure, particularly in vitro, pharmacological
properties as early as possible in the drug discovery process. Ensure that disposition properties within development candidate mole-
cules are consistent with or superior to those of marketed drugs (in terms
of, for example, dose size and frequency or interaction potential). Ensure that patterns evolving from the study of drugs in clinical
pharmacokinetics are used to form the basis of more predictive preclinical
models that can then be used for education and facilitation of drug design.
Regarding the failure of ADME models to adequately predict in vivo PK
properties, Lipinksi has suggested that the solution to this dilemma is to carry
out single mechanism ADME experimental assays and to construct single
mechanism ADME computational models. This would permit the assays to be
at once high-throughput, less expensive, and more predictive. In that regard,
DMPK is at least 5 or more years behind the biology therapeutic target
area [140].
Ekins et al. concur with such a trend and raise the ante [16]. According to
these authors, we are entering the computational ADME age. While some of
the most intense efforts have been in computational methods for CYP
catalyzed reactions, they speculate that, in fact, our broad growth of
knowledge of CYPs may slow down and be followed by a shift in focus
towards phase II enzymes or phase III transporters for excretion [16].
These authors have further questioned the need for the massive quantities
of ADME data that have come to be considered essential. In their opinion,
discovery chemists are ‘‘drowning in data.’’ Our ability to generate and compile
data has far outstripped our ability to understand and use the data in a
meaningful way. They propose a more rational use of the in vitro metabolism
methods preceded by computational filtration using either simple rules,
Drug Metabolism In Vitro and In Vivo Results 73
Copyright © 2005 CRC Press, LLC
7/21/2019 Using Mass Spectrometry for Drug Metabolism Studies
http://slidepdf.com/reader/full/using-mass-spectrometry-for-drug-metabolism-studies 82/362
pharmacophore-, or descriptor-based approaches. They advocate a first tier of
computationally predicted properties to identify a smaller subset of molecules.
On this more limited subset, in vitro approaches would be applied to confirm
that acceptable DMPK properties were achieved, thus promoting a higherprobability of success. Better yet, validated in vivo clinical surrogates may be
developed in parallel. If so, whole-cell information could be combined with
more reductionist in vitro data, to provide a broader picture of metabolism,
potential for drug–drug interactions and toxicity [16].
In conclusion, even though the prospects for designing drugs with optimal
PK properties may be remote, the central role that DMPK departments have
come to play in drug discovery is still essential. One could argue that it may
even be considered liberating to realize that optimum PK properties will not be
achieved. Instead, DM efforts in drug discovery should shift to developingfaster, less expensive yet still reliable screens and to better integrate the data
that it is acquired. The appropriate data at the appropriate time will make the
biggest impact of all.
References
1. Ariens, E.J. and Simonis, A.M., Optimalization of pharmacokinetics —an essentialaspect of drug development by ‘‘metabolic stabilization,’’ in Strategy in Drug
Research, Keverling Buisman, J.A., Ed., Elsevier Scientific Publishing Company,
Amsterdam, 1982, 165.
2. Testa, B. and Mayer, J.M., Drug metabolism and pharmacokinetics: implications
for drug design, Acta. Pharm. Jugosl., 40, 315, 1990.
3. Humphrey, M.J. and Smith, D.A., Role of metabolism and pharmacokinetic studies
in the discovery of new drugs—present and future perspectives, Xenobiotica, 22,
743, 1992.
4. Chiu, S-H.L., The use of in vitro metabolism studies in the understanding of new
drugs, J. Pharmacol. Toxicol. Meth., 29, 77, 1993.
5. Smith, D.A., Design of drugs through a consideration of drug metabolism and
pharmacokinetics, Eur. J. Drug Metab. Pharmacokin., 19, 193, 1994.
6. Smith, D.A., Jones, B.C., and Walker, D.K., Design of drugs involving the concepts
and theories of drug metabolism and pharmacokinetics, Med. Res. Rev., 16, 243,
1996.
7. Lin, J.H. and Lu, A.Y.H., Role of pharmacokinetics and metabolism in drug
discovery and development, Pharmacol. Rev., 49, 403, 1997.
8. Thompson, T.N., Early ADME in support of drug discovery: The role of metabolic
stability studies, Curr. Drug Metab., 1, 215, 2000.9. White, R.E., High-throughput screening in drug metabolism and pharma-
cokinetic support of drug discovery, Annu. Rev. Pharmacol. Toxicol., 40,
133, 2000.
10. Navia, M.A. and Chaturvedi, P.R., Design principles for orally bioavailable drugs,
Drug Discov. Today, 1, 179, 1996.
11. Thompson, T.N., Optimization of metabolic stability as a goal of modern drug
design, Med. Res. Rev., 21, 412, 2001.
74 Using Mass Spectrometry for Drug Metabolism Studies
Copyright © 2005 CRC Press, LLC
7/21/2019 Using Mass Spectrometry for Drug Metabolism Studies
http://slidepdf.com/reader/full/using-mass-spectrometry-for-drug-metabolism-studies 83/362
12. Chaturvedi, P.R., Decker, C.J., and Odinecs, A., Prediction of pharmacokinetic
properties using experimental approaches during early drug discovery, Curr. Opin.
Chem. Biol., 5, 452, 2001.
13. Riley, R.J., Martin, I.J., and Cooper, A.E., The influence of DMPK as an
integrated partner in modern drug discovery, Curr. Drug Metab., 3, 527, 2002.
14. Roberts, S.A., Drug metabolism and pharmacokinetics in drug discovery, Curr.
Opin. Drug Discov. Dev., 6, 66, 2003.
15. Roberts, S.A., High-throughput screening approaches for investigating drug
metabolism and pharmacokinetics, Xenobiotica, 31, 557, 2001.
16. Ekins, S. et al. Present and future in vitro approaches for drug metabolism,
J. Pharmacol. Toxicol. Meth., 44, 313, 2000.
17. Caldwell, G.W. et al. The new pre-preclinical paradigm: compound optimization in
early and late phase drug discovery, Curr. Topics Med. Chem., 1, 353, 2001.
18. Bertrand, M., Jackson, P., and Walther, B., Rapid assessment of drug metabolismin the drug discovery process, Eur. J. Pharm. Sci., 11 (Suppl 2), S61, 2000.
19. Theil, F.P. et al. Utility of physiologically based pharmacokinetic models to drug
development and rational drug discovery candidate selection, Toxicol. Lett., 138,
29, 2003.
20. van de Waterbeemd, H., High-throughput and in silico techniques in drug
metabolism and pharmacokinetics, Curr. Opin. Drug Discov. Dev., 5, 33, 2002.
21. Eddershaw, P.J. and Dickins, M., Advances in in vitro drug metabolism screening,
Pharm. Sci. Tech. Today, 2, 13, 1999.
22. Bjornsson, T.D. et al. The conduct of in vitro and in vivo drug–drug interaction
studies: a Pharmaceutical Research and Manufacturers of America (PHRMA)perspective, Drug Metab. Disp., 31, 815, 2003.
23. Prentis, R.A, Lis, Y., and Walker, S.R., Pharmaceutical innovation by the
seven UK-owned pharmaceutical companies, Br. J. Clin. Pharmacol., 25, 387,
1988.
24. Cashman, J.R., Drug discovery and drug metabolism, Drug Discov. Today, 1, 209,
1996.
25. Peet, N.P., Selecting leads with pharmacokinetic data, Mod. Drug Discov., July/
August, 21, 1999.
26. Rodrigues, A.D., Preclinical drug metabolism in the age of high-throughputscreening: an industrial perspective, Pharm. Res., 14, 1504, 1997.
27. Rodrigues, A.D., Rational high-throughput screening in preclinical drug metabo-
lism, Med. Chem. Res., 8, 422, 1998.
28. Tarbit, M.H. and Berman, J., High-throughput approaches for evaluating
absorption distribution, metabolism and excretion properties of lead compounds,
Curr. Opin. Chem. Biol., 2, 411, 1998.
29. Wrighton, S.A., Ring, B.J., and Vandenbranden, M., The use of in vitro metabolism
techniques in the planning and interpretation of drug safety studies, Toxicol.
Pathol ., 23, 199, 1995.
30. Parkinson, A., An overview of current cytochrome P450 technology for assessingthe safety and efficacy of new molecules, Toxicol. Pathol., 24, 45, 1996.
31. Smith, D.A. and Jones, B.C., Speculations on the substrate structure–activity
relationship (SSAR) of cytochrome P450 enzymes, Biochem. Pharmacol ., 44, 2089,
1992.
32. Smith, D.A., Ackland, M.J., and Jones, B.C., Properties of cytochrome P450
isoenzymes and their substrates Part 1: active site characteristics, Drug Discov.
Today, 2, 406, 1997.
Drug Metabolism In Vitro and In Vivo Results 75
Copyright © 2005 CRC Press, LLC
7/21/2019 Using Mass Spectrometry for Drug Metabolism Studies
http://slidepdf.com/reader/full/using-mass-spectrometry-for-drug-metabolism-studies 84/362
33. Smith, D.A., Ackland, M.J., and Jones, B.C., Properties of cytochrome P450
isoenzymes and their substrates Part 2: properties of cytochrome P450 substrates,
Drug Disccv. Today, 2, 479, 1997.
34. Pelkonen, O., Boobis, A.R., and Gundert-Remy, U., In vitro prediction of
gastrointestinal absorption and bioavailability: an experts’ meeting report, Eur. J.
Clin. Pharmacol., 57, 621, 2001.
35. Lipinski, C.A. et al. Experimental and computational approaches to estimate
solubility and permeability in drug discovery and development settings, Adv. Drug
Deliv. Rev., 23, 3, 1997.
36. Kerns, E.H., High throughput physicochemical profiling for drug discovery,
J. Pharm. Sci., 90, 1838, 2001.
37. Bergstrom, C.A. et al. Experimental and computational screening models for
prediction of aqueous drug solubility, Pharm. Res., 19, 182, 2002.
38. Bevan, C. and Lloyd, R.S., A high-throughput screening method for thedetermination of aqueous drug solubility using laser nephelometry in microtiter
plates, Anal. Chem., 72, 1781, 2000.
39. Lombardo, F. et al. ElogD(oct): a tool for lipophilicity determination in drug
discovery. 2. Basic and neutral compounds, J. Med. Chem., 44, 2490, 2001.
40. Tsuji, A. and Tamai, I. Carrier-mediated intestinal transport of drugs, Pharm. Res.,
13, 963, 1996.
41. Stewart B.H. et al. Saturable transport mechanism in the intestinal absorption of
gabapentin is the underlying cause of the lack of proportionality between increasing
dose and drug levels in plasma, Pharm. Res., 10, 276, 1993.
42. Amidon, G.L., Merfeld, A.E., and Dressman, J.B., Concentration and pHdependency of a-methyldopa absorption in rat intestine, J. Pharm. Pharmacol.,
38, 363, 1986.
43. Hu, M. and Borchardt, R.T., Mechanism of l-a-methyldopa transport through a
monolayer of polarized human intestinal epithelial cells (Caco-2), Pharm. Res., 7,
1313, 1990.
44. Shindo, H., Komai, T., and Kawai, K., Studies on the metabolism of d- and
l-isomers of 3,4-dihydroxyphenylalanine (DOPA). V. Mechanism of intestinal
absorption of d- and l-DOPA-14C in rats, Chem. Pharm. Bull.,(Tokyo) 21, 2031,
1973.45. Cercos-Fortea, T. et al. Influence of leucine on intestinal baclofen absorption as a
model compound of neutral a-amino acids, Biopharm. Drug Dispos., 16, 563, 1995.
46. Thwaites, D.T. et al. d-cycloserine transport in human intestinal epithelial (Caco-2)
cells mediated by a H-coupled amino acid transporter, Br. J. Pharmacol., 115, 761,
1995.
47. Okano, K. et al. Hþ coupled uphill transport of aminocephalosporins via the
dipeptide transport system in rabbit intestinal brush-border membranes, J. Biol.
Chem., 261, 14130, 1986.
48. Inui, K., Miyamoto, M., and Saito, H., Transepithelial transport of oral
cephalosporins by monolayers of intestinal epithelial cell line Caco-2: Specifictransport systems in apical and basolateral membranes, J. Pharmacol. Exp. Therap.,
261, 195, 1992.
49. Tamai, I. et al. Functional expression of intestinal depeptide/b-lactam antibiotic
transporter in Xenopus laevis oocytes, Biochem. Pharmacol., 48, 881, 1994.
50. Tamai, I. et al. Functional expression of transporter for b-lactam antibiotics and
dipeptides in Xenopus laevis oocytes injected with messenger RNA from human, rat
and rabbit small intestines, J. Pharmacol. Exp. Therap., 273, 26, 1995.
76 Using Mass Spectrometry for Drug Metabolism Studies
Copyright © 2005 CRC Press, LLC
7/21/2019 Using Mass Spectrometry for Drug Metabolism Studies
http://slidepdf.com/reader/full/using-mass-spectrometry-for-drug-metabolism-studies 85/362
51. Boll, M. et al. Expression cloning of a cDNA from rabbit small intestine related to
proton-coupled transport of peptides, b-lactam antibiotics and ACE-inhibitors,
Pflugers-Arch., 429, 146, 1994.
52. Amidon, G.L. and Lee, H.J., Absorption of peptide and peptidomimetic drugs,
Annu. Rev. Pharmcol. Toxicol., 34, 321, 1994.
53. Yee, S. and Amidon, G.L., Oral absorption of angiotensin-converting enzyme
inhibitors and peptide prodrugs’ in Peptide-based Drug Design, Taylor, M.D and
Amidon, G.L, Eds., American Chemical Society, Washington, D.C., 1995, 299.
54. Kramer, W. et al. Interaction of renin inhibitors with the intestinal uptake system
for oligopeptides and b-lactam antibiotics, Biochim. Biophys. Acta, 1027, 25, 1990.
55. Hashimoto, N. et al. Renin inhibitor: transport mechanism in rat small intestinal
brush-border membrane vesicles, Pharm. Res., 11, 1448, 1994.
56. Takano, M. et al. Bestatine transport in rabbit intestinal brush-border membrane
vesicles, Biochem. Pharmacol ., 47, 1089, 1994.57. Walter, E. et al. Transepithelial properties of peptidomimetic thrombin inhibitors in
monolayers of a human intestinal cell line (Caco-2) and their correlation to in vivo
data, Pharm. Res., 12, 360, 1995.
58. Mizuma T. et al. Intestinal active absorption of sugar-conjugated compounds by
glucose transport system: implication of improvement of poorly absorbable drugs,
Biochem. Pharmcol., 43, 2037, 1992.
59. Osiecka, I. et al. In vitro drug absorption models. I. Brush border membrane
vesicles, isolated mucosal cells and everted intestinal rings: Characterization and
salicylate accumulation, Pharm. Res., 2, 284, 1985.
60. Takanaga, H., Tamai, I., and Tsuji, A., pH-Dependent and carrier-mediatedtransport of salicylic acid across Caco-2 cells, J. Pharm. Pharmacol., 46, 567,
1994.
61. Tsuji, A. et al. Transcellular transport of benzoic acid across Caco-2 cells by a
pH-dependent and carrier-mediated transport mechanism, Pharm. Res., 11, 30,
1994.
62. Tamai, I. et al. Proton-cotransport of pravastatin across intestinal brush-border
membrane, Pharm. Res., 12, 1727, 1995.
63. Tsuji, A. and Tamai, I., Naþ and pH dependent transport of foscarnet via the
phosphate carrier system across intestinal brush-border membrane, Biochem.Pharmacol., 38, 1019, 1989.
64. Swaan, P.W. and Tukker J.J., Carrier-mediated transport mechanism of foscarnet
(trisodium phosphonoformate hexahydrate) in rat intestinal tissue, J. Pharmacol.
Exp. Therap., 272, 242, 1994.
65. Kim R.B., Transporters and xenobiotic disposition, Toxicology, 181–182, 291,
2002.
66. Kim, R.B. et al. Interrelationship between substrates and inhibitors of human
CYP3A and P-glycoprotein, Pharm. Res., 16, 408, 1999.
67. Cvetkovic, M. et al. OATP and P-glycoprotein transporters mediate the cellular
uptake and excretion of fexofenadine, Drug Metab. Dispos., 27, 866, 1999.68. Fromm, M.F. et al. Inhibition of P-glycoprotein-mediated drug transport: a
unifying mechanism to explain the interaction between digoxin and quinidine,
Circulation, 99, 552, 1999.
69. Kim, R.B. et al. The drug transporter P-glycoprotein limits oral absorption and
brain entry of HIV-1 protease inhibitors, J. Clin. Invest., 101, 289, 1998.
70. Polli, J.W. et al. Rational use of in vitro P-glycoprotein assays in drug discovery,
J. Pharmacol. Exp. Therap., 299, 620, 2001.
Drug Metabolism In Vitro and In Vivo Results 77
Copyright © 2005 CRC Press, LLC
7/21/2019 Using Mass Spectrometry for Drug Metabolism Studies
http://slidepdf.com/reader/full/using-mass-spectrometry-for-drug-metabolism-studies 86/362
71. Kansy, M., Senner, F., and Gubernator, K., Physicochemical high throughput
screening: parallel artificial membrane permeation assay in the description of
passive absorption processes, J. Med. Chem., 41, 1007, 1998.
72. Audus K.L. et al. The use of cultured epithelial and endothelial cells for drug
transport and metabolism studies, Pharm. Res., 7, 435, 1990.
73. Artursson, P. and Karlsson, J., Correlation between oral drug absorption in
humans and apparent drug permeability coefficients in human intestinal epithelial
(Caco-2) cells, Biochem. Biophys. Res. Comm., 175, 880, 1991.
74. Irvine, J.D. et al. MDCK (Madin–Darby canine kidney) cells: A tool for membrane
permeability screening, J. Pharm. Sci ., 88, 28, 1999.
75. Rane, A., Wilkinson, G.R., and Shand, D.G., Prediction of hepatic extraction ratio
from in vitro measurements of intrinsic clearance, J. Pharmacol. Exp. Therap., 200,
420, 1977.
76. Houston, J.B., Utility of in vitro drug metabolism data in predicting in vivometabolic clearance, Biochem. Pharmacol ., 47, 1469, 1994.
77. Houston, J.B. and Carlile, D.J., Prediction of hepatic clearance from microsomes,
hepatocytes, and liver slices, Drug Metab. Rev., 29, 891, 1997.
78. Ito, K. et al. Quantitative prediction of in vivo drug clearance and drug interactions
from in vitro data on metabolism, together with binding and transport, Annu. Rev.
Pharmacol. Toxicol ., 38, 461, 1998.
79. Iwatsubo, T. et al. Prediction of in vivo drug metabolism in the human liver from
in vitro metabolism data, Pharmacol. Therap., 73, 147, 1997.
80. Lave, T. et al. The use of human hepatocytes to select compounds based on
their expected hepatic extraction ratios in humans, Clin. Pharmacokinet., 36, 211,1999.
81. Obach R.S. et al. The prediction of human pharmacokinetic parameters from
preclinical and in vitro metabolism data, J. Pharmacol. Exp. Therap., 283, 46, 1997.
82. Guengerich, F.P. and Macdonald, T.L., Mechanisms of cytochrome P450 catalysis,
FASEB J ., 4, 2453, 1990.
83. Halliday, R.C. et al. Synthetic strategies to lower affinity for CYP2D6, Eur. J. Drug
Metab. Pharmacokin., 22, 291, 1997.
84. de Groot, M.J. et al. Novel approach to predicting P450-mediated drug
metabolism: development of a combined protein and pharmacophore model forCYP2D6, J. Med. Chem., 42, 1515, 1999.
85. de Groot, M.J. et al. A novel approach to predicting P450 mediated drug
metabolism. CYP2D6 catalyzed N-dealkylation reactions and qualitative metabo-
lite predictions using a combined protein and pharmacophore model for CYP2D6,
J. Med. Chem., 42, 4062, 1999.
86. Ekins, S. et al. Three- and four-dimensional quantitative structure activity
relationship analyses of cytochrome P-4503A4 inhibitors, J. Pharmacol. Exp.
Therap., 290, 429, 1999.
87. Ekins, S. et al. Three-dimensional-quantitative structure activity relationship
analysis of cytochrome P-450 3A4 substrates, J. Pharmacol. Exp. Therap., 291,424, 1999.
88. Jones, B.C. et al. Putative active site template model for cytochrome P4502C9
(tolbutamide hydroxylase), Drug Metab. Disp., 24, 260, 1996.
89. Ekins, S. et al. Three-dimensional quantitative structure activity relationship
analyses of substrates for CYP2B6, J. Pharmacol. Exp. Therap., 288, 21, 1999.
90. Lewis, D.F.V. et al. Molecular modeling of CYP2B6, the human CYP2B isoform,
by homology with the substrate-bound CYP102 crystal structure: evaluation of
78 Using Mass Spectrometry for Drug Metabolism Studies
Copyright © 2005 CRC Press, LLC
7/21/2019 Using Mass Spectrometry for Drug Metabolism Studies
http://slidepdf.com/reader/full/using-mass-spectrometry-for-drug-metabolism-studies 87/362
CYP2B6 substrate characteristics, the cytochrome b5 binding site and compar-
isons with CYP2B1 and CYP2B4, Xenobiotica, 29, 361, 1999.
91. Huang, T.L. et al. Hydrolysis of carbonates, thiocarbonates, carbamates, and
carboxylic esters of a-naphthol, b-naphthol, and p-nitrophenol by human, rat, and
mouse liver carboxylesterases, Pharm. Res., 10, 639, 1993.
92. Parkinson, A., Biotransformation of xenobiotics, in Casserett and Doull’s
Toxicology, 5th edition, Klaassen, C.D., Ed., McGraw Hill, New York, 1996,
113.
93. Ackerman, B.L. et al. Increasing the throughput of microsomal stability screening
using fast gradient elution LC/MS. Proceedings of the 46th ASMS Conference on
Mass Spectrometry and Allied Topics, Orlando, FL, May 31–June 4, 1998.
94. Ho, J. et al. A strategy for achieving higher throughput in screening for metabolic
stability, Abstracts of the 1999 annual meeting of the American Association of
Pharmaceutical Scientists, New Orleans, LA, November, 1999.95. Korfmacher, W.A. et al. Development of an automated mass spectrometry system
for the quantitative analysis of liver microsomal incubation samples: a tool for
rapid screening of new compounds for metabolic stability, Rapid Commun. Mass
Spectrom., 13, 901, 1999.
96. Ayrton, A. and Morgan, P., Role of transport proteins in drug absorption,
distribution and excretion, Xenobiotica, 31, 469, 2001.
97. Eckhardt, U. et al. First-pass elimination of a peptidomimetic thrombin
inhibitor is due to carrier-mediated uptake by the liver, Biochem. Pharmocol.,
52, 85, 1996.
98. Cvetkovic, M. et al. OATP and P-glycoprotein transporters mediate the cellularuptake and excretion of fexofenadine, Drug Metab. Dispos., 27, 866, 1999.
99. Morgan, P. et al. Identification of OATP-mediated uptake of a series of lipophilic
bases, Abstracts of the 9th North American ISSX meeting, Nashville, TN, October
25–29, 1999.
100. van Montfoort, J.E. et al. Polyspecific organic anion transporting polypeptidss
mediate hepatic uptake of amphipathic type H organic cations, J. Pharmacol. Exp.
Therap., 291, 147, 1999.
101. Hsiang, B. et al. A novel human hepatic organic anion transporting polypeptide
(OATP2), J. Biol. Chem., 274, 37161, 1999.102. Ko ¨ nig, J. et al. Localization and genomic organization of a new hepatocellular
organic anion transporting polypeptide, J. Biol. Chem., 275, 23161, 2000.
103. Nagel, G. et al. A reevaluation of substrate specificity of the rat cation transporter
rOCT1, J. Biol. Chem., 272, 31953, 1997.
104. Zhang, L., Schaner, M.E., and Giacomini, K.M., Functional characterization of
an organic transporter (hOCT1) in a transiently transfected human cell line,
J. Pharmacol. Exp. Therap., 286, 354, 1998.
105. Kim, R.B. et al. Interrelationship between substrates and inhibitors of human
CYP3A and P-glycoprotein, Pharm. Res., 16, 408, 1999.
106. Fromm, M.F. et al. Inhibition of P-glycoprotein-mediated drug transport: aunifying mechanism to explain the interaction between digoxin and quinidine,
Circulation, 99, 552, 1999.
107. Kim, R.B. et al. The drug transporter P-glycoprotein limits oral absorption and
brain entry of HIV-1 protease inhibitors, J. Clin. Invest., 101, 289, 1998.
108. Sasabe, H., Tsuji, A., and Sugiyama, Y., Carrier-mediated mechanism for the
biliary excretion of the quinolone antibiotic grepafloxacin and its glucuronide in
rats, J. Pharmacol. Exp. Therap., 284, 1033, 1998.
Drug Metabolism In Vitro and In Vivo Results 79
Copyright © 2005 CRC Press, LLC
7/21/2019 Using Mass Spectrometry for Drug Metabolism Studies
http://slidepdf.com/reader/full/using-mass-spectrometry-for-drug-metabolism-studies 88/362
109. Yamazaki, M. et al. Biliary excretion of pravastatin in rats: contribution of the
excretion pathways mediated by the canalicular multispecific organic anion
transporter, Drug Metab. Disp., 25, 1123, 1997.
110. Sathirakul, K. et al. Multiple transporter systems for organic anions across the bile
canalicular membrane, J. Pharmacol. Exp. Therap., 284, 1033, 1994.
111. Hooijberg, J.H. et al. Antifolate resistance mediated by the multidrug resistance
proteins MRP1 and MRP2, Cancer Res., 59, 2532, 1999.
112. Chu, X.Y., Kato, Y., and Sugiyama, Y., Multiplicity of biliary excretion
mechanisms for irinotecan, CPT-11, and its metabolites in rat, Cancer Res., 57,
1934, 1997.
113. Ishizuka, H. et al. Temocaprilat, a novel antiotensin-converting enzyme inhibitor,
is exrected in bile via an ATP-dependent active transporter (cMOAT) that is
deficient in Eisai hyperbilirubinemic mutant rats (EHBR), J. Pharmacol. Exp.
Therap., 280, 1304, 1997.114. Liu, X. et al. Correlation of biliary excretion in sandwich cultured rat hepatocytes
and in vivo in rats, Drug Metab. Dispos., 27, 637, 1999.
115. LeCluyse, E.L., Audus, K.L., and Hochman, J.H., Formation of extensive
canalicular networks by rat hepatocytes cultured in collagen/sandwich configura-
tion, Am. J. Physiol ., 266, 1764, 1994.
116. Ishizuka, H., et al. Species differences in the transport activity for organic anions
across the bile canalicular membrane, J. Pharmacol. Exp. Therap., 290, 1324, 1999.
117. Lin J.H., Applications and limitations of interspecies scaling and in vitro
extrapolation in pharmacokinetics, Drug Metab. Disp., 26, 1202, 1998.
118. Gumbleton, M. and Audus, K.L., Progress and limitation in the use of in vitro cellcultures to serve as permeability screens for the blood brain barrier, J. Pharm. Sci.,
90, 1681, 2001.
119. Kariv, I., Cao, H., and Oldenburg, K.R., Development of a high throughput
equilibrium dialysis method, J. Pharm. Sci ., 90, 580, 2001.
120. Banker, M.J., Clark, T.H., and Williams, J.A., Development and validation of a
96-well equilibrium dialysis apparatus for measuring plasma protein binding,
J. Pharm. Sci., 92, 967, 2003.
121. Wring, S.A. et al. Automated plasma protein binding screen: rapid, robust and
timely for drug discovery, Abstracts of the 10th North American ISSX meeting,Indianapolis, IN, October, 2000, #85.
122. Gu, C. et al. Assays of ligand–human serum albumin binding using pulsed
ultrafiltration and liquid chromatography–mass spectrometry, Combi. Chem. High
Thr. Scr., 2, 353, 1999.
123. Parikh, H.H. et al. A rapid spectrofluorimetric technique for determining drug–
serum protein binding suitable for high-throughput screening, Pharm. Res., 17,
632, 2000.
124. Lin, J.H., Species similarities and differences in pharmacokinetics, Drug Metab.
Disp., 23, 1008, 1995.
125. Lombardo, F. et al. Prediction of volume of distribution values in humans forneutral and basic drugs using physicochemical measurements and plasma protein
binding data, J. Med. Chem., 45, 2867, 2002.
126. Oie, S. and Tozer, T.N., Effect of altered plasma protein binding on apparent
volume of distribution, J. Pharm. Sci ., 68, 1203, 1979.
127. Doan, K.M.H. et al. Passive permeability and P-glycoprotein-mediated efflux
differentiate central nervous system (CNS) and non-CNS marketed drugs,
J. Pharmacol. Exp. Ther., 303, 1029, 2002.
80 Using Mass Spectrometry for Drug Metabolism Studies
Copyright © 2005 CRC Press, LLC
7/21/2019 Using Mass Spectrometry for Drug Metabolism Studies
http://slidepdf.com/reader/full/using-mass-spectrometry-for-drug-metabolism-studies 89/362
128. van de Waterbeemd, H. et al. Estimation of blood–brain barrier crossing of drugs
using molecular size and shape, and H-bonding descriptors, J. Drug Targeting, 6,
151, 1998.
129. Lee, G. et al. Drug transporters in the central nervous system: brain barriers and
brain parenchyma considerations, Pharmacol. Rev., 53, 569, 2001.
130. Clark, D.E., Rapid calculation of polar molecular surface area and its application
to the prediction of transport phenomena. 2. Prediction of blood brain barrier
penetration, J. Pharm. Sci., 88, 815, 1999.
131. Gratton, J.A. et al. Molecular factors influencing drug transfer across the blood–
brain barrier, J. Pharm. Pharmacol., 49, 1211, 1997.
132. Audus, K.L. and Borchardt, R.T., Characterization of an in vitro blood–brain
barrier model system for studying drug transport and metabolism, Pharm. Res., 3,
81, 1986.
133. Otis, K.W. et al. Evaluation of the BBMEC model for screening the CNSpermeability of drugs, J. Pharmacol. Toxicol. Method , 45, 71, 2001.
134. Janusz, M.J. et al. Pharmacological evaluation of selected, orally active peptidyl
inhibitors of human neutrophil elastase, J. Pharmacol. Exp. Therap., 275, 1233,
1995.
135. Thompson, T.N. et al. Selection of an elastase inhibitor with improved
bioavailability from a series of structurally related analogs. Abstracts of the 4th
International ISSX meeting, Seattle, WA, August, 1995, #315.
136. Burkholder, T.P. et al. Chemical synthesis and structure activity relationships for a
series of substituted pyrrolidine NK1/NK2 receptor antagonists, Bioorg. Med.
Chem. Lett., 7, 2531, 1997.137. Stratford, R.E. et al. Application of oral bioavailability surrogates in the design of
orally active inhibitors of rhinovirus replication, J. Pharm. Sci., 88, 747, 1999.
138. Mandagere, A.K., Thompson, T.N., and Hwang, K-K., A graphical method for
estimating oral bioavailability of drugs in humans and other species from their
caco-2 permeability and in vitro liver enzyme metabolic stability rates, J. Med.
Chem., 45, 304, 2002.
139. Smith, D., Schmid, E., and Jones, B. Do drug metabolism and pharmacokinetic
departments make any contribution to drug discovery?, Clin. Pharmacokin., 41,
1005, 2002.140. Lipinski, CA., Drug-like properties and the causes of poor solubility and poor
permeability, J. Pharmacol. Toxicol. Meth., 44, 235, 2000.
Drug Metabolism In Vitro and In Vivo Results 81
Copyright © 2005 CRC Press, LLC

7/21/2019 Using Mass Spectrometry for Drug Metabolism Studies
http://slidepdf.com/reader/full/using-mass-spectrometry-for-drug-metabolism-studies 90/362
Chapter 3
High Throughput Strategies for In Vitro ADME Assays:How Fast Can We Go?
Daniel B. Kassel
3.1 Introduction
The continuing need for novel and improved drugs has led to the introduction
of myriad new technologies within the pharmaceutical industry. Notably,
advances in genomics, high-throughput screening, combinatorial chemistry,
parallel synthesis, automation, and miniaturization have enabled large
numbers of potent (active) and selective compounds to be identified at earlystages of drug discovery. However, the fact that a compound is active and
selective does not necessarily make it an attractive drug development
candidate. To convert these ‘‘actives’’ into qualified clinical candidates has
proved to be challenging. It has been reported that a significant number of
compounds nominated for clinical development fail due to poor pharmaco-
kinetics and toxicological properties (63% of all pre-clinical compounds) as
shown in Table 3.1 [1].
Rodrigues [2] provides an excellent review on desirable absorption,
distribution, metabolism, and elimination (ADME) properties (see Table 3.2)
and offers examples of how early access to ADME information greatly enhances
development success. It is generally agreed that the ‘‘ideal’’ development
candidate should contain the majority if not all of these biopharmaceutical
properties prior to candidate selection for development.
0-8493-1963-3/05/$0.00+$1.50 2005 by CRC Press 83
Copyright © 2005 CRC Press, LLC
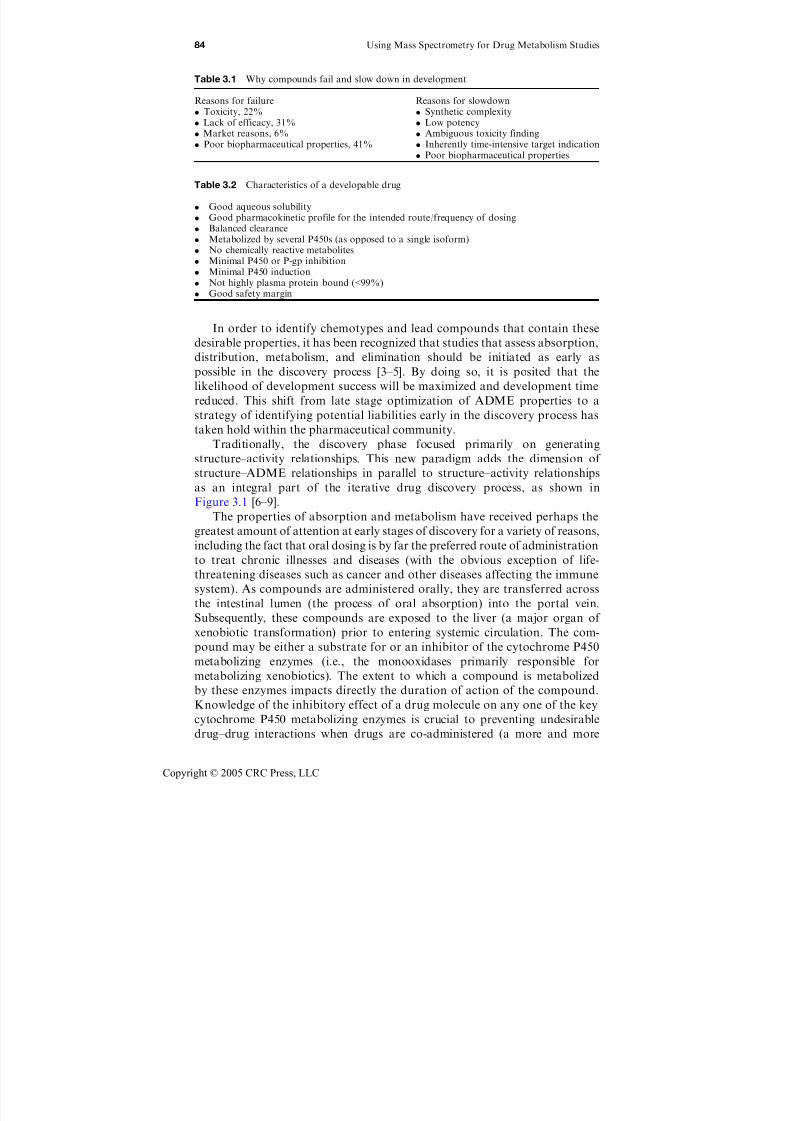
7/21/2019 Using Mass Spectrometry for Drug Metabolism Studies
http://slidepdf.com/reader/full/using-mass-spectrometry-for-drug-metabolism-studies 91/362
In order to identify chemotypes and lead compounds that contain these
desirable properties, it has been recognized that studies that assess absorption,
distribution, metabolism, and elimination should be initiated as early as
possible in the discovery process [3–5]. By doing so, it is posited that the
likelihood of development success will be maximized and development timereduced. This shift from late stage optimization of ADME properties to a
strategy of identifying potential liabilities early in the discovery process has
taken hold within the pharmaceutical community.
Traditionally, the discovery phase focused primarily on generating
structure–activity relationships. This new paradigm adds the dimension of
structure–ADME relationships in parallel to structure–activity relationships
as an integral part of the iterative drug discovery process, as shown in
Figure 3.1 [6–9].
The properties of absorption and metabolism have received perhaps the
greatest amount of attention at early stages of discovery for a variety of reasons,
including the fact that oral dosing is by far the preferred route of administration
to treat chronic illnesses and diseases (with the obvious exception of life-
threatening diseases such as cancer and other diseases affecting the immune
system). As compounds are administered orally, they are transferred across
the intestinal lumen (the process of oral absorption) into the portal vein.
Subsequently, these compounds are exposed to the liver (a major organ of
xenobiotic transformation) prior to entering systemic circulation. The com-
pound may be either a substrate for or an inhibitor of the cytochrome P450
metabolizing enzymes (i.e., the monooxidases primarily responsible for
metabolizing xenobiotics). The extent to which a compound is metabolized
by these enzymes impacts directly the duration of action of the compound.
Knowledge of the inhibitory effect of a drug molecule on any one of the key
cytochrome P450 metabolizing enzymes is crucial to preventing undesirable
drug–drug interactions when drugs are co-administered (a more and more
Table 3.2 Characteristics of a developable drug
Good aqueous solubility Good pharmacokinetic profile for the intended route/frequency of dosing Balanced clearance Metabolized by several P450s (as opposed to a single isoform) No chemically reactive metabolites Minimal P450 or P-gp inhibition Minimal P450 induction Not highly plasma protein bound (<99%) Good safety margin
Table 3.1 Why compounds fail and slow down in development
Reasons for failure Reasons for slowdown Toxicity, 22% Synthetic complexity Lack of efficacy, 31% Low potency Market reasons, 6% Ambiguous toxicity finding Poor biopharmaceutical properties, 41% Inherently time-intensive target indication
Poor biopharmaceutical properties
84 Using Mass Spectrometry for Drug Metabolism Studies
Copyright © 2005 CRC Press, LLC

7/21/2019 Using Mass Spectrometry for Drug Metabolism Studies
http://slidepdf.com/reader/full/using-mass-spectrometry-for-drug-metabolism-studies 92/362
common occurrence in the clinic). Figure 3.2 highlights some of the hurdles that
a compound must overcome in order to become an effective orally administered
drug.
Another, perhaps more pragmatic reason that absorption and metabolism
have been identified as key properties to profile for at earlier stages of
discovery is that they are the most well-established (experimentally) and most
well-validated in vitro assays. In particular, the in vitro microsomal stability
assay has been employed early in drug discovery as a precursor to in vivo
pharmacokinetic profiling for the specific purpose of rank ordering com-
pounds based on their intrinsic clearance (calculated) values and to predict
in vivo clearance [10, 11]. Microsomes are readily available, the assay is
relatively cheap to employ and easy to run. However, the ability to predict
in vivo clearance from in vitro metabolic stability data has proved challenging.
This is due in part, to the fact that metabolic stability screens incorporating
microsomes typically allow for assessment of phase 1 metabolism only
(e.g., oxidation, N-dealkylation). Alternatives to microsomes that enable
assessment of both phase 1 and phase 2 metabolism (e.g., glucuronidation,
sulfonylation) include S9 fractions, cryopreserved and fresh hepatocytes,
Figure 3.1 Iterative drug discovery now combines structure–activity with structure-ADMErelationships as well as incorporating protein structural information to facilitate the compounddesign and synthesis.
Figure 3.2 Optimization of solubility, chemical and plasma stability, cell permeability andmetabolic stability are key to ensuring successful oral delivery of compounds. Source: Lipper,R.A., [1]. With permission.
High Throughput Strategies for In Vitro ADME Assays 85
Copyright © 2005 CRC Press, LLC
7/21/2019 Using Mass Spectrometry for Drug Metabolism Studies
http://slidepdf.com/reader/full/using-mass-spectrometry-for-drug-metabolism-studies 93/362
although the ability to predict in vivo clearance from these in vitro systems has
proved to be challenging as well, principally because these in vitro assays do not
take into account other processes that affect clearance, such as plasma protein
binding. Importantly though, in vitro metabolic stability assays have provedextremely useful in the following ways: (1) to aid in the selection of the most
attractive scaffold (starting points) to minimize the number of iterations
required to produce a suitable drug candidate; (2) to prioritize/rank order
compounds for in vivo profiling; and (3) to weed out compounds that are
metabolized rapidly in vitro (t12<10 min).
Because of the large number of hits that are now routinely identified from
screening compound collections and gene family compound libraries, the
industry has recognized the need for high throughput ADME assays.
Fortunately, a large proportion of ADME assays can now be run in a highthroughput fashion, due principally to the widespread incorporation of liquid
chromatography/mass spectrometry (LC–MS) and liquid chromatography/
tandem mass spectrometry (LC–MS/MS) [12, 13]. LC–MS and LC–MS/MS
have become the preferred techniques for in vitro ADME analyses due princi-
pally to enhanced sensitivity, selectivity, and ease of automation relative to
traditional analytical methods. The selectivity advantages of LC–MS have made
possible the ability to analyze endogenous and non-fluorescent probe substrates
in cytochrome inhibition assays [14], enabled rapid permeability assessment
(e.g., Caco-2 assay) [15], provided faster methods for assessing lipophilicity andsolubility of drug leads, and provided much more facile assessment of liver
metabolism [16, 17] for which many examples are highlighted below.
To achieve high throughput, it is critical that these assays be brought
forward into the discovery process as early as possible. A streamlined approach
to doing this, is to initiate ADME assays at the time of biological screening. As
compounds are registered and requested for biological screening, they are
generally plated and arrayed in 96-well microtiter plates at a concentration of
10mM in DMSO. Many in vitro ADME screens are readily performed in
microititer plate format and it is at the time of biological screening that a
number of daughter plates may also be generated for high throughput ADME,
as shown in Figure 3.3. In addition to the metabolic stability assays, plasma
protein binding can be performed in microtiter plate format using both the
ultrafiltration method [18] and equilibirium dialysis method [19]. Furthermore,
both solubility and log P screens have been performed in microtiter plate
format [20, 21].
3.2 Fast Serial ADME Analyses Incorporating LC–MS
and LC–MS/MS
3.2.1 Fast chromatography
Recently, analysis throughput has been improved significantly and rather
simply by shortening the HPLC run time. Samples can be analyzed one at a
86 Using Mass Spectrometry for Drug Metabolism Studies
Copyright © 2005 CRC Press, LLC

7/21/2019 Using Mass Spectrometry for Drug Metabolism Studies
http://slidepdf.com/reader/full/using-mass-spectrometry-for-drug-metabolism-studies 94/362
time or as mixtures in as little as 30 s to 1 min per sample by applying fast
gradients compatible with mass spectrometric detection to assess ADME
properties [22, 23]. Figure 3.4 shows a nice example of how fast chromatog-
raphy is applied to characterizing probe substrates for cytochrome P450
Figure 3.4 Fast chromatographic SIM analyses, [M þ H]þ ions, of multiple probe substrates forthe cytochrome P450 metabolizing enzymes in under 1 min using a generic gradient of 5–95%
acetonitrile following incubation of mixture with human liver microsomes. (Courtesy of B.A.Ackermann, Eli Lilly, Inc. (personal communication).)
Figure 3.3 By coordinating plating for ADME analyses at the same time as biological screening,ADME analyses are streamlined.
High Throughput Strategies for In Vitro ADME Assays 87
Copyright © 2005 CRC Press, LLC
7/21/2019 Using Mass Spectrometry for Drug Metabolism Studies
http://slidepdf.com/reader/full/using-mass-spectrometry-for-drug-metabolism-studies 95/362
metabolizing enzymes. These fast analyses are achieved using short chromato-
graphic columns (e.g., 2.1 20 mm; 3- or 5-mm particle size). Generic gradients
are typically employed (e.g., 5% to 95% organic in from 1 to 2 min) using
mobile phases containing trifluoroacetic acid (0.035–0.05%), formic acid(0.1%) or ammonium acetate (10 mM). Flow rates are typically in the range of
1 to 5 mL/min. Compounds generally afford peaks that are symmetrical with
peak widths less than 0.05 min at baseline.
Monolithic columns have been evaluated more recently to reduce analysis
times further. Monolithic columns are attractive in that they tend to operate at
very low back pressures and are hence capable of being operated at very high
flow rates. Chromatographic integrity is generally not compromised because
peak capacity and resolution on monoliths is ostensibly independent of flow
rate. Typically, a 4.6 50 mm monolith column operates at a flow rate of 4 to 6mL/min. Performance is similar to that obtained using 3 mm packed columns
but with flow rates much greater than those normally employed. Thus, the
theoretical advantage is that chromatographic run times can be reduced by a
factor of 3 to 5 times without loss in performance. Van de Merbal et al.
described the use of monoliths in quantitative bioanalysis, showing the advant-
age of these columns over conventional C18 supports for the determination of
estradiol in plasma [24].
3.2.2 Automated data processing is instrumental to achieving highthroughput ADME
Although great strides have been made in reducing chromatographic analysis
times by the introduction of short, ballistic columns, a bottleneck to providing
rapid turn-around of in vitro ADME information to project teams is data
processing and reporting. The generation of analytical data using automated
instrumentation has produced a bottleneck since data can be generated faster
than it can be analyzed. Automated data acquisition software and hardware
has fueled the proliferation of mass spectrometry (MS)-based computer soft-
ware applications to facilitate capture and analysis of mass spectral data and
provide the information necessary for decision making. The automated post-
data acquisition analysis strategy is to extract the most appropriate
information required for decision-making in as streamlined a manner as
possible. As an example, a time-course assessment of metabolic stability (e.g.,
four time points and analyses in triplicate) generates 1152 samples for every
plate of compounds submitted. Manual processing of so many samples would
clearly render the data processing and data reporting rate limiting. To address
this, numerous groups have combined the power of vendor software programs
that automate peak area determinations with visual basic programming to
provide simple, yet elegant methods for data processing and data reporting
[25–27]. Most often, project teams are interested in both graphical and tabular
presentation of data following in vitro ADME profiling. Shown in Figure 3.5 is
a partial summary report of a plate of eight reference compounds and 88 test
compounds received from a drug discovery project. The percent remaining
88 Using Mass Spectrometry for Drug Metabolism Studies
Copyright © 2005 CRC Press, LLC

7/21/2019 Using Mass Spectrometry for Drug Metabolism Studies
http://slidepdf.com/reader/full/using-mass-spectrometry-for-drug-metabolism-studies 96/362
values of the parent compounds are color coded for easy visualization: green,
>80%; orange, 80–40%; red, <40%. The project chemist receives both the
summary report which helps ‘‘bin’’ the compounds into distinct classes of
microsomal stability and the time course stability plots for all compounds
submitted for high throughput (HT) microsomal stability analysis. This
information helps the chemists prioritize compounds for further consideration
as potential drug candidates.
3.2.3 Enhancing throughput by incorporating
pooling strategies
Another approach is to profile multiple compounds simultaneously, known as
cassette (or N-in-1) dosing. In essence, cassette dosing is a compound pooling
strategy whereby compounds are profiled as mixtures so as to increase
throughput, reduce the total number of samples to be analyzed and hence
reduce overall analysis times. Cassette dosing strategies have been used
principally for rapid pharmacokinetic profiling of drug leads. Shaffer et al.
were the first to describe the application of cassette (N-in-one) dosing to
Figure 3.5 Time-course human liver microsomal incubations of a number of positive andnegative controls as well as project compounds for which the metabolic stability profiles arerepresented in both tabular format and graphically above.
High Throughput Strategies for In Vitro ADME Assays 89
Copyright © 2005 CRC Press, LLC
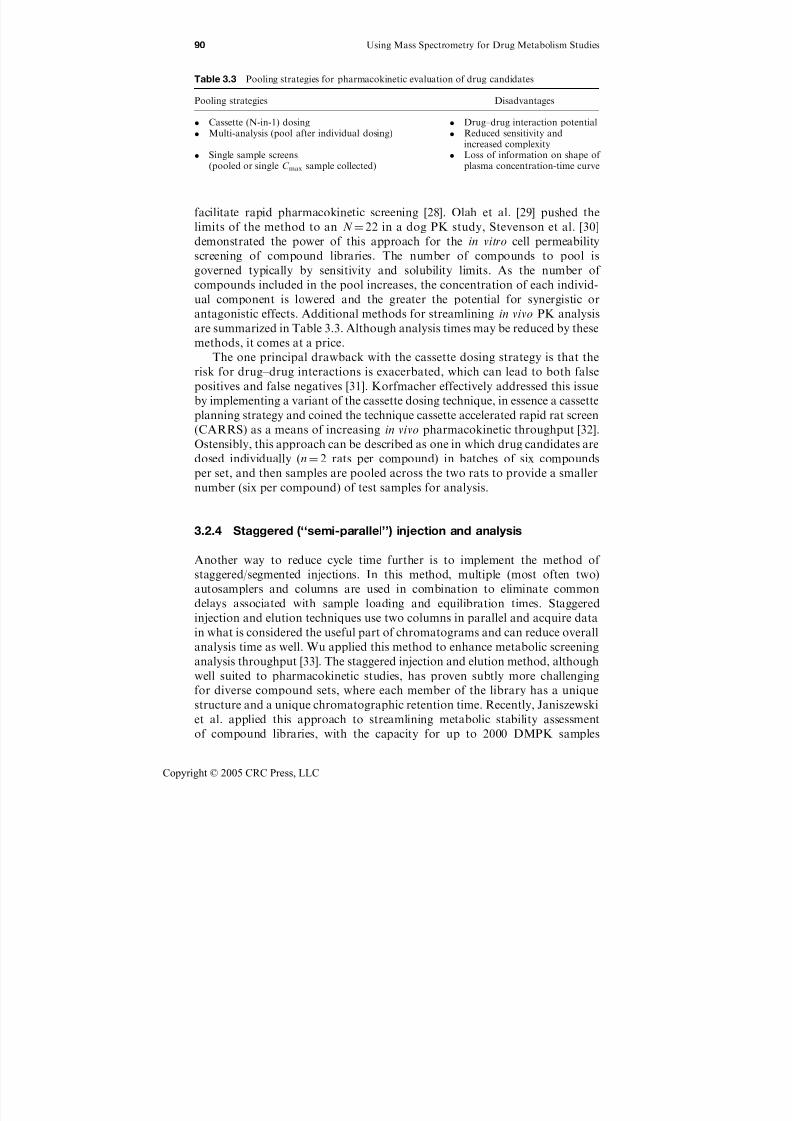
7/21/2019 Using Mass Spectrometry for Drug Metabolism Studies
http://slidepdf.com/reader/full/using-mass-spectrometry-for-drug-metabolism-studies 97/362
facilitate rapid pharmacokinetic screening [28]. Olah et al. [29] pushed the
limits of the method to an N ¼ 22 in a dog PK study, Stevenson et al. [30]
demonstrated the power of this approach for the in vitro cell permeability
screening of compound libraries. The number of compounds to pool isgoverned typically by sensitivity and solubility limits. As the number of
compounds included in the pool increases, the concentration of each individ-
ual component is lowered and the greater the potential for synergistic or
antagonistic effects. Additional methods for streamlining in vivo PK analysis
are summarized in Table 3.3. Although analysis times may be reduced by these
methods, it comes at a price.
The one principal drawback with the cassette dosing strategy is that the
risk for drug–drug interactions is exacerbated, which can lead to both false
positives and false negatives [31]. Korfmacher effectively addressed this issueby implementing a variant of the cassette dosing technique, in essence a cassette
planning strategy and coined the technique cassette accelerated rapid rat screen
(CARRS) as a means of increasing in vivo pharmacokinetic throughput [32].
Ostensibly, this approach can be described as one in which drug candidates are
dosed individually (n¼ 2 rats per compound) in batches of six compounds
per set, and then samples are pooled across the two rats to provide a smaller
number (six per compound) of test samples for analysis.
3.2.4 Staggered (‘‘semi-parallel’’) injection and analysis
Another way to reduce cycle time further is to implement the method of
staggered/segmented injections. In this method, multiple (most often two)
autosamplers and columns are used in combination to eliminate common
delays associated with sample loading and equilibration times. Staggered
injection and elution techniques use two columns in parallel and acquire data
in what is considered the useful part of chromatograms and can reduce overall
analysis time as well. Wu applied this method to enhance metabolic screening
analysis throughput [33]. The staggered injection and elution method, although
well suited to pharmacokinetic studies, has proven subtly more challenging
for diverse compound sets, where each member of the library has a unique
structure and a unique chromatographic retention time. Recently, Janiszewski
et al. applied this approach to streamlining metabolic stability assessment
of compound libraries, with the capacity for up to 2000 DMPK samples
Table 3.3 Pooling strategies for pharmacokinetic evaluation of drug candidates
Pooling strategies Disadvantages
Cassette (N-in-1) dosing Drug–drug interaction potential Multi-analysis (pool after individual dosing) Reduced sensitivity and
increased complexity Single sample screens
(pooled or single C max sample collected) Loss of information on shape of
plasma concentration-time curve
90 Using Mass Spectrometry for Drug Metabolism Studies
Copyright © 2005 CRC Press, LLC
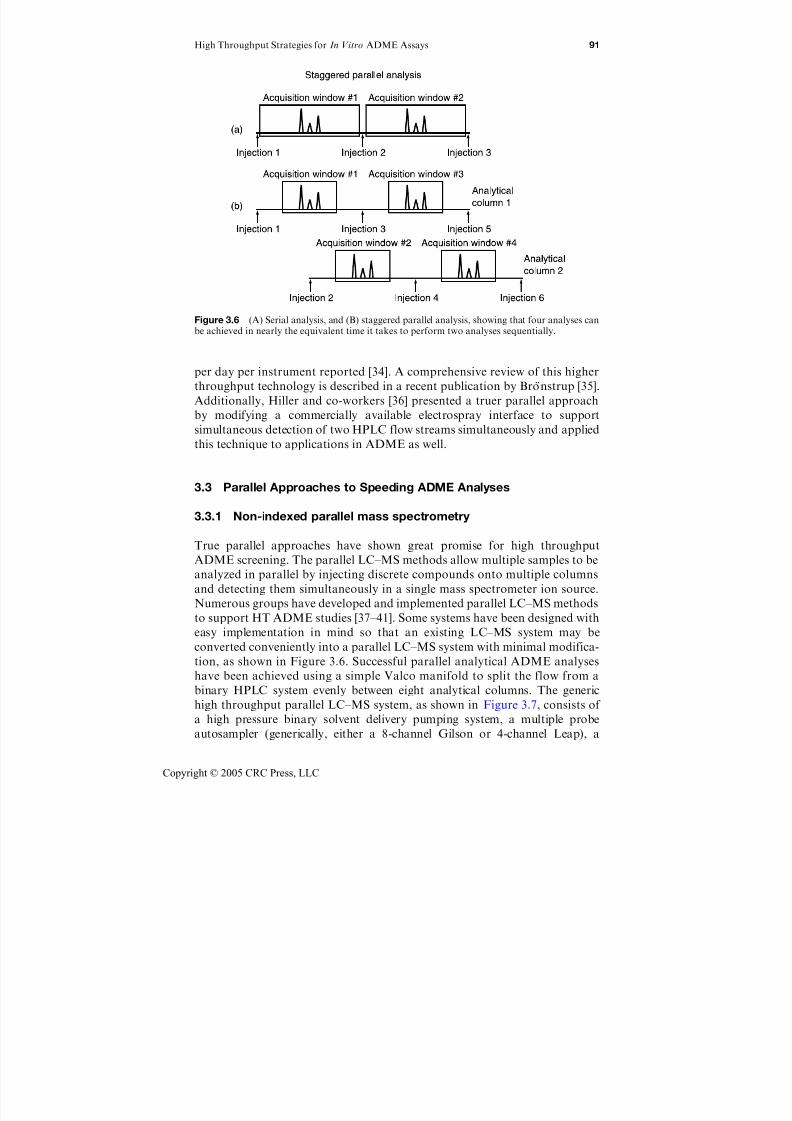
7/21/2019 Using Mass Spectrometry for Drug Metabolism Studies
http://slidepdf.com/reader/full/using-mass-spectrometry-for-drug-metabolism-studies 98/362
per day per instrument reported [34]. A comprehensive review of this higher
throughput technology is described in a recent publication by Bro ¨ nstrup [35].Additionally, Hiller and co-workers [36] presented a truer parallel approach
by modifying a commercially available electrospray interface to support
simultaneous detection of two HPLC flow streams simultaneously and applied
this technique to applications in ADME as well.
3.3 Parallel Approaches to Speeding ADME Analyses
3.3.1 Non-indexed parallel mass spectrometry
True parallel approaches have shown great promise for high throughput
ADME screening. The parallel LC–MS methods allow multiple samples to be
analyzed in parallel by injecting discrete compounds onto multiple columns
and detecting them simultaneously in a single mass spectrometer ion source.
Numerous groups have developed and implemented parallel LC–MS methods
to support HT ADME studies [37–41]. Some systems have been designed with
easy implementation in mind so that an existing LC–MS system may be
converted conveniently into a parallel LC–MS system with minimal modifica-
tion, as shown in Figure 3.6. Successful parallel analytical ADME analyses
have been achieved using a simple Valco manifold to split the flow from a
binary HPLC system evenly between eight analytical columns. The generic
high throughput parallel LC–MS system, as shown in Figure 3.7, consists of
a high pressure binary solvent delivery pumping system, a multiple probe
autosampler (generically, either a 8-channel Gilson or 4-channel Leap), a
Figure 3.6 (A) Serial analysis, and (B) staggered parallel analysis, showing that four analyses canbe achieved in nearly the equivalent time it takes to perform two analyses sequentially.
High Throughput Strategies for In Vitro ADME Assays 91
Copyright © 2005 CRC Press, LLC

7/21/2019 Using Mass Spectrometry for Drug Metabolism Studies
http://slidepdf.com/reader/full/using-mass-spectrometry-for-drug-metabolism-studies 99/362
switching valve and a single quadrupole mass spectrometer equipped with a
electrospray ionization (with or without MUX). Eight samples are injected into
the eight injection ports simultaneously and onto eight separate microbore
columns. The pump flow rate is split into eight equivalent streams using a
Valco manifold before entering the multiple probe autosampler. Eight
microbore columns (dimensions obviously can vary but as an example,
10mm 1 mm i.d., 3mm, HQ-C18, Peeke Scientific, Redwood City, CA, USA)
are connected to eight injection valves of the autosampler. For non-indexed
mass spectrometric detection, the outlets of the columns are recombined using
a second Valco manifold just prior to the ion source. The flow is then passed
through a flow divert valve before entering the mass spectrometer. The in-line
flow divert valve is used to ensure that undesirable materials eluted at the
solvent front are diverted to waste to keep the ion source from becoming
contaminated. When the valve is in the sampling position, the mobile phase is
passed directly into the ion source without splitting. Xu et al. [37] reported that
over 100,000 samples were analyzed for early ADME assessment successfully
incorporating this parallel configuration.
According to the authors, the system was used for assessing the time course
metabolic stability (four time points in triplicate) for hits identified from
screening of lead generation libraries. For each compound, a total of 12 samples
are generated (four time points in triplicate) and a single plate of compounds
Figure 3.7 Generic eight-channel parallel LC–MS system consisting of a binary HPLC system, amultiprobe autosampler, a single quadrupole mass spectrometer equipped with a multiplexed(MUX) electrospray ion source, eight microbore HPLC columns (10 mm 1 mm i.d., 3 micron)and a switching value. Total mobile phase flow rate is 2.0 mL/min (0.25 mL/min for each column).The 8-channel LC–MS system allows up to four plates of compounds (or 4 1152 samples) to berun in a single day. (Source: Sage et al. Drug Discovery, 19, 49–54, 2000. With permission.)
92 Using Mass Spectrometry for Drug Metabolism Studies
Copyright © 2005 CRC Press, LLC

7/21/2019 Using Mass Spectrometry for Drug Metabolism Studies
http://slidepdf.com/reader/full/using-mass-spectrometry-for-drug-metabolism-studies 100/362
therefore yields a total of 1152 samples requiring analysis. Single column
systems operated in the sequential sampling mode are capable of analyzing
roughly one plate in a single day (assuming a 1-min cycle time). On the other
hand, a parallel array of eight columns enables up to eight plates to be analyzedin a single day on a single instrument (theoretical maximum throughput). In
practice, Xu et al. [37] reported that their maximum throughput was four plates
of compounds in a single day, approaching 5000 samples analyzed for
metabolic stability in a single day, the highest sample throughput yet to be
reported for the metabolic stability assay to date.
Similar to what was described earlier, in the absence of automated data
processing tools, the post-analysis data reduction and validation processes
would be exceedingly tedious. To address this data management problem, a
StabilityReport macro was developed by the authors to automate these tasks.The macro imports the integration result files, deconvolutes the eight-channel
results, and generates stability plots for each compound as well as a summary
report for the whole plate. The macro then further analyzes and validates the
results of each compound, generating a flag for any compound that has
incorrect stability trend, low MS signal, or broad chromatographic peak. With
this intelligent validation tool, the post-analysis data processing time is
automatically reduced from about 1 day per plate (manually) to literally
minutes per plate.
3.3.2 Indexed (MUX) parallel mass spectrometry
The commercialized multiplexed (MUX) electrospray interface, which intro-
duces multiple LC flows directly into a multiplexed (indexed) electrospray
ion source, has also been applied successfully for high throughput ADME
applications as well [40, 41]. Yang et al. [41] identified the two main advantages
of parallel LC–MS/MS using a Micromass Ultima with MUX interface to be
(1) parallel analysis and (2) four-times the throughput relative to single column
systems. However, disadvantages were reported as (1) cross-talk between the
sprayers (negligible at concentrations <100 ng/mL but as high as 0.08% at
1000 ng/mL), (2) sensitivity less than that of a single sprayer interface (about
3 lower than the single sprayer interface) and (3) total cycle time longer than
that of a single sprayer interface (hence not compatible with ultra-fast chro-
matography). The MUX technique was validated for rabbit, rat, mouse, and
dog plasma and the authors concluded that the technique is well suited for
simultaneous method validations and early discovery studies.
3.3.2.1 Higher throughput parallel technologies on the horizon?
Recently, even more massively parallel nano-LC systems have been commer-
cialized and offer the potential for yet higher throughput ADME applications.
In particular, Nanostream, Inc. recently introduced a 24-channel microfluidic
HPLC system for high throughput analysis, chromatography hydrophobicity
index (CHI) and solubility determinations. The technology is still in its infancy
High Throughput Strategies for In Vitro ADME Assays 93
Copyright © 2005 CRC Press, LLC
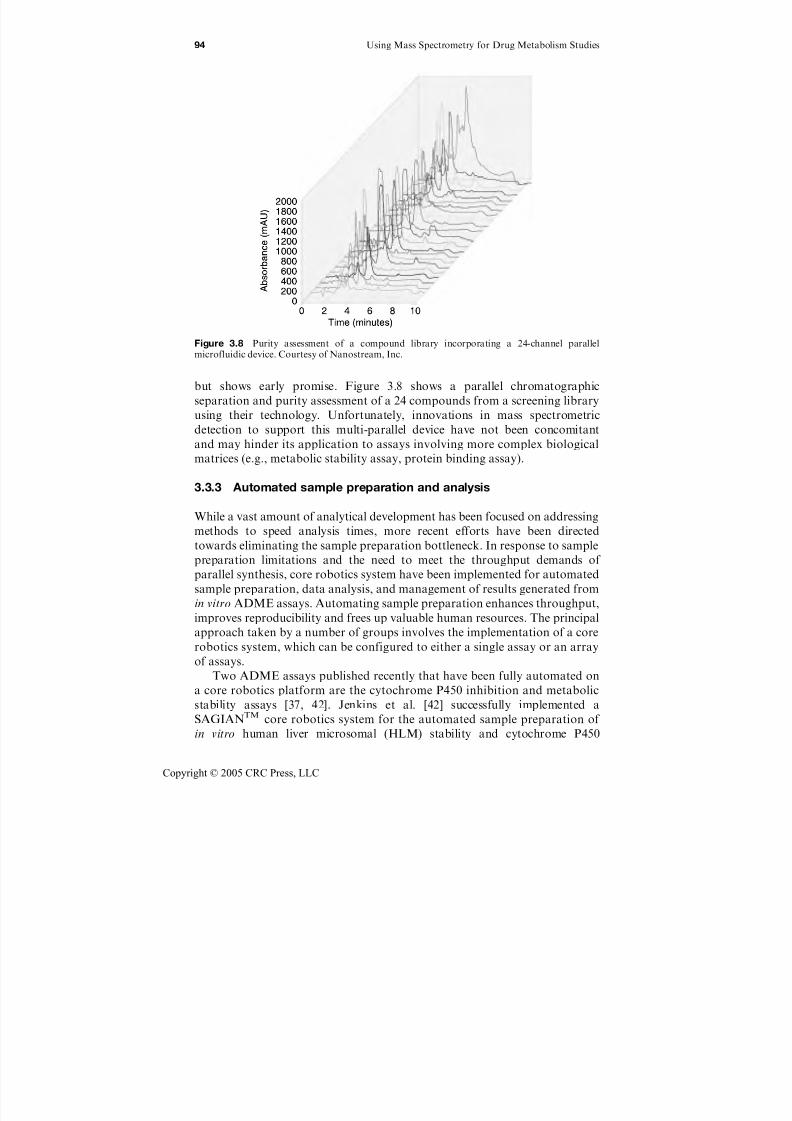
7/21/2019 Using Mass Spectrometry for Drug Metabolism Studies
http://slidepdf.com/reader/full/using-mass-spectrometry-for-drug-metabolism-studies 101/362
but shows early promise. Figure 3.8 shows a parallel chromatographicseparation and purity assessment of a 24 compounds from a screening library
using their technology. Unfortunately, innovations in mass spectrometric
detection to support this multi-parallel device have not been concomitant
and may hinder its application to assays involving more complex biological
matrices (e.g., metabolic stability assay, protein binding assay).
3.3.3 Automated sample preparation and analysis
While a vast amount of analytical development has been focused on addressing
methods to speed analysis times, more recent efforts have been directed
towards eliminating the sample preparation bottleneck. In response to sample
preparation limitations and the need to meet the throughput demands of
parallel synthesis, core robotics system have been implemented for automated
sample preparation, data analysis, and management of results generated from
in vitro ADME assays. Automating sample preparation enhances throughput,
improves reproducibility and frees up valuable human resources. The principal
approach taken by a number of groups involves the implementation of a core
robotics system, which can be configured to either a single assay or an array
of assays.
Two ADME assays published recently that have been fully automated on
a core robotics platform are the cytochrome P450 inhibition and metabolic
stability assays [37, 42]. Jenkins et al. [42] successfully implemented a
SAGIANTM core robotics system for the automated sample preparation of
in vitro human liver microsomal (HLM) stability and cytochrome P450
Figure 3.8 Purity assessment of a compound library incorporating a 24-channel parallelmicrofluidic device. Courtesy of Nanostream, Inc.
94 Using Mass Spectrometry for Drug Metabolism Studies
Copyright © 2005 CRC Press, LLC
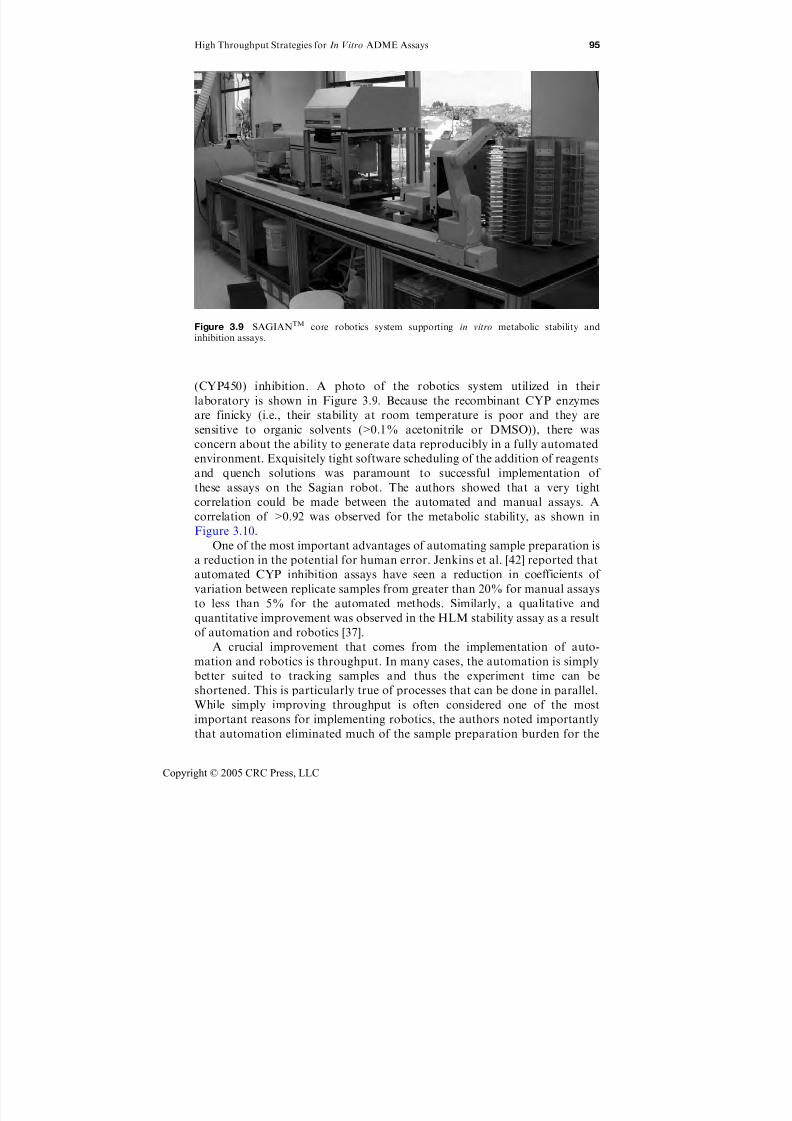
7/21/2019 Using Mass Spectrometry for Drug Metabolism Studies
http://slidepdf.com/reader/full/using-mass-spectrometry-for-drug-metabolism-studies 102/362
(CYP450) inhibition. A photo of the robotics system utilized in theirlaboratory is shown in Figure 3.9. Because the recombinant CYP enzymes
are finicky (i.e., their stability at room temperature is poor and they are
sensitive to organic solvents (>0.1% acetonitrile or DMSO)), there was
concern about the ability to generate data reproducibly in a fully automated
environment. Exquisitely tight software scheduling of the addition of reagents
and quench solutions was paramount to successful implementation of
these assays on the Sagian robot. The authors showed that a very tight
correlation could be made between the automated and manual assays. A
correlation of >0.92 was observed for the metabolic stability, as shown in
Figure 3.10.
One of the most important advantages of automating sample preparation is
a reduction in the potential for human error. Jenkins et al. [42] reported that
automated CYP inhibition assays have seen a reduction in coefficients of
variation between replicate samples from greater than 20% for manual assays
to less than 5% for the automated methods. Similarly, a qualitative and
quantitative improvement was observed in the HLM stability assay as a result
of automation and robotics [37].
A crucial improvement that comes from the implementation of auto-
mation and robotics is throughput. In many cases, the automation is simply
better suited to tracking samples and thus the experiment time can be
shortened. This is particularly true of processes that can be done in parallel.
While simply improving throughput is often considered one of the most
important reasons for implementing robotics, the authors noted importantly
that automation eliminated much of the sample preparation burden for the
Figure 3.9 SAGIANTM core robotics system supporting in vitro metabolic stability andinhibition assays.
High Throughput Strategies for In Vitro ADME Assays 95
Copyright © 2005 CRC Press, LLC

7/21/2019 Using Mass Spectrometry for Drug Metabolism Studies
http://slidepdf.com/reader/full/using-mass-spectrometry-for-drug-metabolism-studies 103/362
scientist and nearly 50% of their time could be redirected. This resulted in
some, what one might consider, less obvious advantages, including employee
retention, liberation of resources for other tasks and reduced training
requirements for new employees. As the authors rightly point out, these
enhancements, while less quantitative and measurable, should not be
overlooked as they contribute to the success of an organization.
3.4 Automated ‘‘Intelligent’’ Metabolic Stability and
Metabolite Identification
In vitro HLM stability assays are a very useful first-pass assessment of potential
metabolic liabilities. However, detailed information about the location of
metabolic soft spots is particularly useful in understanding whether the
observed liabilities are specific to a molecule’s core or introduced as part of a
side chain in the lead optimization process. Whether the metabolic liability is
associated with the core or side chain has clear implications for the degree to
which the liability can be engineered out of a chemical series.
Until very recently, metabolic stability screening and metabolite identifica-
tion (metabolite ID) have been decoupled processes, that is, the metabolic
stability assays are typically performed at a physiologically relevant concen-
tration (e.g., 0.5–1 mM) and follow up metabolite ID studies involve a second
incubation at a higher substrate concentration to ensure generation of
Figure 3.10 Reproducibility of the automated HLM stability method determined for 88 librarycompounds tested at a concentration of 4mM. Data points represent the percent remaining atT ¼ 5 min (most variable data point) for a pair of automated assays run on the same 88 compounds.Assay is highly reproducible as evidenced by the correlation coefficient of 0.92.
96 Using Mass Spectrometry for Drug Metabolism Studies
Copyright © 2005 CRC Press, LLC
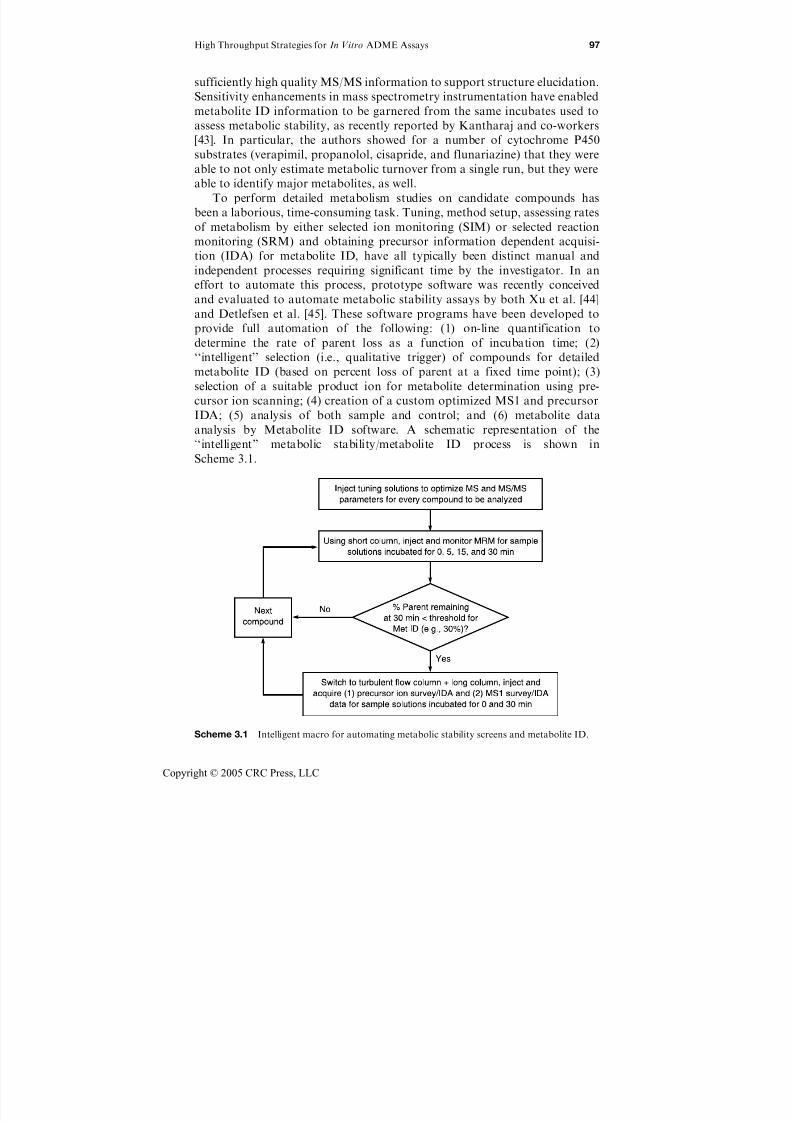
7/21/2019 Using Mass Spectrometry for Drug Metabolism Studies
http://slidepdf.com/reader/full/using-mass-spectrometry-for-drug-metabolism-studies 104/362
sufficiently high quality MS/MS information to support structure elucidation.
Sensitivity enhancements in mass spectrometry instrumentation have enabled
metabolite ID information to be garnered from the same incubates used to
assess metabolic stability, as recently reported by Kantharaj and co-workers[43]. In particular, the authors showed for a number of cytochrome P450
substrates (verapimil, propanolol, cisapride, and flunariazine) that they were
able to not only estimate metabolic turnover from a single run, but they were
able to identify major metabolites, as well.
To perform detailed metabolism studies on candidate compounds has
been a laborious, time-consuming task. Tuning, method setup, assessing rates
of metabolism by either selected ion monitoring (SIM) or selected reaction
monitoring (SRM) and obtaining precursor information dependent acquisi-
tion (IDA) for metabolite ID, have all typically been distinct manual andindependent processes requiring significant time by the investigator. In an
effort to automate this process, prototype software was recently conceived
and evaluated to automate metabolic stability assays by both Xu et al. [44]
and Detlefsen et al. [45]. These software programs have been developed to
provide full automation of the following: (1) on-line quantification to
determine the rate of parent loss as a function of incubation time; (2)
‘‘intelligent’’ selection (i.e., qualitative trigger) of compounds for detailed
metabolite ID (based on percent loss of parent at a fixed time point); (3)
selection of a suitable product ion for metabolite determination using pre-cursor ion scanning; (4) creation of a custom optimized MS1 and precursor
IDA; (5) analysis of both sample and control; and (6) metabolite data
analysis by Metabolite ID software. A schematic representation of the
‘‘intelligent’’ metabolic stability/metabolite ID process is shown in
Scheme 3.1.
Scheme 3.1 Intelligent macro for automating metabolic stability screens and metabolite ID.
High Throughput Strategies for In Vitro ADME Assays 97
Copyright © 2005 CRC Press, LLC
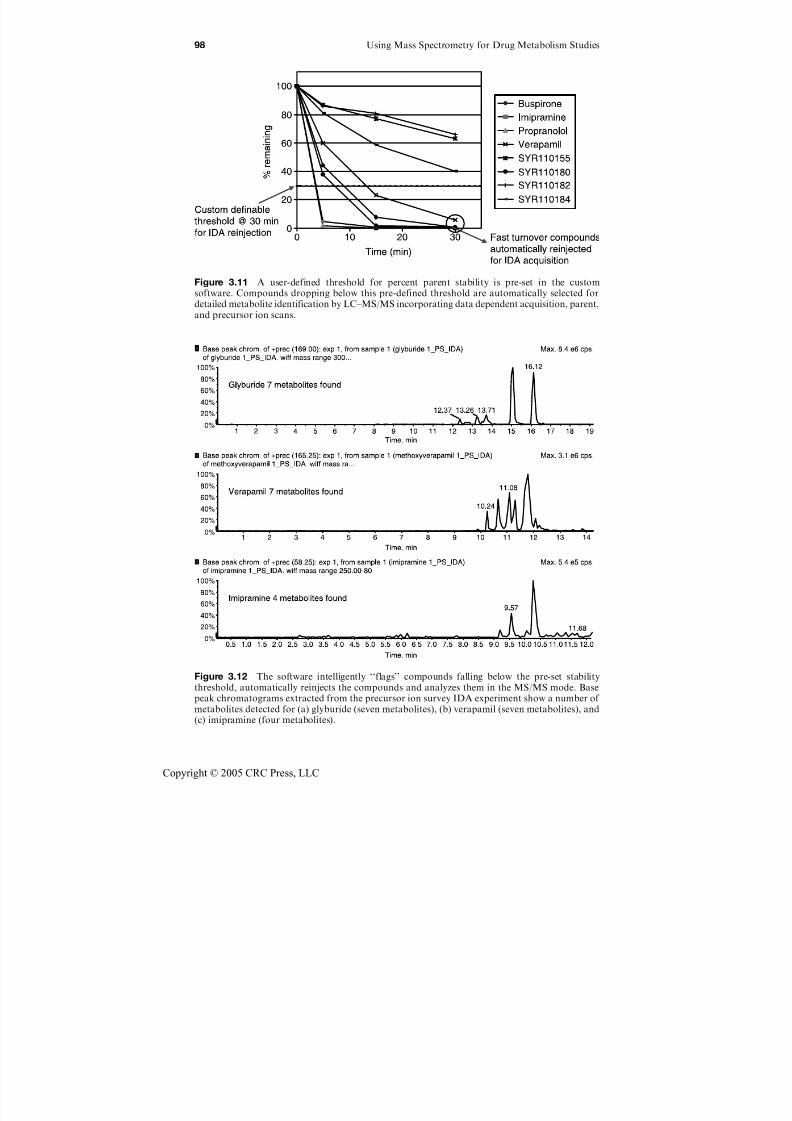
7/21/2019 Using Mass Spectrometry for Drug Metabolism Studies
http://slidepdf.com/reader/full/using-mass-spectrometry-for-drug-metabolism-studies 105/362
Figure 3.12 The software intelligently ‘‘flags’’ compounds falling below the pre-set stabilitythreshold, automatically reinjects the compounds and analyzes them in the MS/MS mode. Basepeak chromatograms extracted from the precursor ion survey IDA experiment show a number of metabolites detected for (a) glyburide (seven metabolites), (b) verapamil (seven metabolites), and(c) imipramine (four metabolites).
Figure 3.11 A user-defined threshold for percent parent stability is pre-set in the customsoftware. Compounds dropping below this pre-defined threshold are automatically selected fordetailed metabolite identification by LC–MS/MS incorporating data dependent acquisition, parent,and precursor ion scans.
98 Using Mass Spectrometry for Drug Metabolism Studies
Copyright © 2005 CRC Press, LLC

7/21/2019 Using Mass Spectrometry for Drug Metabolism Studies
http://slidepdf.com/reader/full/using-mass-spectrometry-for-drug-metabolism-studies 106/362
The software determines metabolically labile compounds by comparing the
percent parent remaining at a specific time-point (e.g., 15 min or 30 min) with
user-defined criteria for triggering follow-up IDA acquisitions. The IDA data
acquired allows the user to extract useful metabolite information usingassociated Metabolite ID software. Base peak chromatograms extracted from
the precursor ion survey IDA experiment show a number of metabolites
detected for the target compound. The analyst is then well-positioned to use
this information to narrow down the search of peaks and retrieve IDA MS/MS
data for structural information.
As an example, Figure 3.11 shows the metabolic stability plots for a plate of
compounds incubated with microsomes over a 30-min time course. Following
data acquisition, the software automatically determined the peak areas at each
time point and identified compounds that dropped below the present parentstability threshold (set to 30% in this example). Immediately following the
microsomal stability assessment, flagged samples were reinjected and precur-
sor ion IDA survey scans were automatically generated (see Figure 3.12).
The precursor ion IDA scans for the cytochrome P450 probe substrates,
verapimil, glyburide, and imipramine are shown. MS/MS spectra of each
of these candidate metabolites provide useful information for pinpointing
sites of metabolism. As this software technology enters the mainstream, it
should indeed be possible to achieve significantly enhanced metabolite ID
throughput.
3.5 Conclusions
Early ADME assessment of compounds is occurring at nearly every stage of the
discovery process, from lead generation through lead optimization. This has
occurred for two principal reasons, the first being an enlightened view of
medicinal chemists as to the importance of optimizing on drug-like properties in
addition to potency and selectivity. Second, and perhaps more importantly,
early ADME assessment is occurring due to innovations in analytical chemistry
and the wide spread proliferation of LC–MS technology. Automated sample
preparation, data acquisition, and data processing have enabled ADME
profiling studies to move into the high throughput realm. Only a few years ago it
was suggested that high throughput ADME (unlike high throughput analysis
and purification to support combinatorial chemistry and parallel synthesis)
would be difficult to achieve due the fact that ‘‘with most in vitro systems, it is
the analytical requirements that are usually rate limiting, relying heavily on
liquid chromatography coupled with mass spectrometry . . .’’ [46]. Continuedinnovations in fast chromatography, parallel analysis, and automated,
‘‘intelligent’’ data processing and reporting are rapidly challenging this view.
References
1. Lipper, R.A., How can we optimize selection of drug development candidates from
many compounds at the discovery stage?, Modern Drug Discovery, 2(1), 55, 1999.
High Throughput Strategies for In Vitro ADME Assays 99
Copyright © 2005 CRC Press, LLC

7/21/2019 Using Mass Spectrometry for Drug Metabolism Studies
http://slidepdf.com/reader/full/using-mass-spectrometry-for-drug-metabolism-studies 107/362
2. Rodrigues, A.D., New technologies and approaches for increasing drug candidate
survivability: lead identification to lead optimization, in CPSA, Princeton, NJ ,
2001, Lee, M., Ed., CPSA.
3. Thompson, T.N., Optimization of metabolic stability as a goal of modern drug
design, Med . Res. Rev., 21(5), 412, 2001.
4. Smith, D.A. and van de Waterbeemd, H., Pharmacokinetics and metabolism in
early drug discovery, Curr. Opin. Chem. Biol ., 3(4), 373, 1999.
5. Kerns, E.H., High throughput physicochemical profiling for drug discovery,
J . Pharm. Sci ., 90(11), 1838, 2001.
6. Frenette, R. et al. Substituted 4-(2,2-diphenylethyl)pyridine-N -oxides as phospho-
diesterase-4 inhibitors: SAR study directed toward the improvement of pharma-
cokinetic parameters, Bioorg. Med. Chem. Lett., 12(20), 3009, 2002.
7. Wyatt, P.G. et al. structure–activity relationship investigations of a potent and
selective benzodiazepine oxytocin antagonist, Bioorg. Med. Chem. Lett., 11(10),1301, 2001.
8. Caldwell, G.W., Compound optimization in early- and late-phase drug discovery:
acceptable pharmacokinetic properties utilizing combined physicochemical, in vitro
and in vivo screens, Curr. Opin. Drug Discov., 3(1), 30, 2000.
9. Sinko, P.J., Drug selection in early drug development: screening for acceptable
pharmacokinetic properties using combined in vitro and computational approaches,
Curr. Opin. Drug Discov. Devel., 2(1), 42, 1999.
10. Obach, R.S., Prediction of human clearance of twenty-nine drugs from hepatic
microsomal intrinsic clearance data: An examination of in vitro half-life approach
and nonspecific binding to microsomes, Drug Metab. Dispos., 27(11), 1350, 1999.11. Thompson, T.N., Early ADME in support of drug discovery: the role of metabolic
stability studies, Curr. Drug Metab., 1(3), 215, 2000.
12. Rossi, D.T. and Sinz, M., Mass Spectrometry in Drug Discovery. Marcel Dekker,
Inc., New York, 2002.
13. Ackermann, B.L., Berna, M.J., and Murphy, A.T., Recent advances in use of LC/
MS/MS for quantitative high-throughput bioanalytical support of drug discovery,
Curr. Top. Med. Chem., 2(1), 53, 2002.
14. Rodrigues, A.D. and Lin, J.H., Screening of drug candidates for their drug–drug
interaction potential, Curr. Opin. Chem. Biol., 5(4), 396, 2001.15. Li, Y. et al. Increasing the throughput and productivity of Caco-2 cell permeability
assays using liquid chromatography–mass spectrometry: application to resvera-
trol absorption and metabolism, Comb. Chem. High Throughput Screen., 6(8), 757,
2003.
16. Korfmacher, W.A. et al. HPLC-API/MS/MS: a powerful tool for integrating
drug metabolism into the drug discovery process, Drug Discov. Today, 2, 532,
1997.
17. Eddershaw, P.J. and Dickins, M., Advances in drug metabolism screening, Pharm.
Sci. Technol. Today., 2(1), 13, 1999.
18. Weiss, A.J., Performing ADME earlier—a way to gain speed and productivity.Business Briefing: Future Drug Discovery 2003. http://www.bbriefings.com/pdf/16/
fdd031_t_Millipor.pdf .
19. Kariv, I., Cao, H., and Oldenburg, K.R., Development of a high throughput
equilibrium dialysis method, J. Pharm. Sci., 90(5), 580, 2001.
20. Qian, M.J. et al. A fast screening method to measure equilibrium solubility in early
drug discovery process, in AAPS Annual Meeting and Exposition, Denver, CO,
2001, AAPS.
100 Using Mass Spectrometry for Drug Metabolism Studies
Copyright © 2005 CRC Press, LLC
7/21/2019 Using Mass Spectrometry for Drug Metabolism Studies
http://slidepdf.com/reader/full/using-mass-spectrometry-for-drug-metabolism-studies 108/362
21. Wilson, D.M. et al. High throughput log D determination using liquid
chromatography–mass spectrometry, Comb. Chem. High Throughput Screen.,
4(6), 511, 2001.
22. Ayrton, J. et al. Optimisation and routine use of generic ultra-high flow-rate liquid
chromatography with mass spectrometric detection for the direct on-line analysis of
pharmaceuticals in plasma, J. Chromatogr. A, 828(1–2), 199, 1998.
23. Scott, R.J. et al. Determination of a ‘GW cocktail’ of cytochrome P450 probe
substrates and their metabolites in plasma and urine using automated solid phase
extraction and fast gradient liquid chromatography tandem mass spectrometry,
Rapid Commun. Mass Spectrom., 13(23), 2305, 1999.
24. van de Merbel, N.C. and Poelman, H., Experiences with monolithic LC phases in
quantitative bioanalysis, J. Pharm. Biomed. Anal., 33(3), 495, 2003.
25. Whitney, J.L., Hail, M.E., and Detlefsen, D.J., Automated metabolite confirmation
using data-dependent LC/MS and intelligent chemometrics, in 50th ASMS Conference on Mass Spectrometry and Allied Topics, Orlando, FL, 2002, ASMS.
26. Williams, A., Applications of computer software for the interpretation and
management of mass spectrometry data in pharmaceutical science, Curr. Topics
Med. Chem., 2(1), 99, 2002.
27. Korfmacher, W.A. et al. Development of an automated mass spectrometry system
for the quantitative analysis of liver microsomal incubation samples: a tool for
rapid screening of new compounds for metabolic stability, Rapid Commun. Mass
Spectrom., 13(10), 901, 1999.
28. Shaffer, J.E. et al. Use of ‘‘N-in-one’’ dosing to create an in vivo pharmacokinetics
database for use in developing structure–pharmacokinetic relationships, J. Pharm.Sci., 88(3), 313, 1999.
29. Olah, T.V., McLoughlin, D.A., and Gilbert, J.D., The simultaneous determination
of mixtures of drug candidates by liquid chromatography/atmospheric pressure
chemical ionization mass spectrometry as an in vivo drug screening procedure,
Rapid Commun. Mass Spectrom., 11(1), 17, 1997.
30. Stevenson, C.L., Augustijns, P.F., and Hendren, R.W., Use of Caco-2 cells and LC/
MS/MS to screen a peptide combinatorial library for permeable structures, Int. J.
Pharm., 177(1), 103, 1999.
31. White, R.E. and Manitpisitkul, P., Pharmacokinetic theory of cassette dosing indrug discovery screening, Drug Metab. Dispos., 29(7), 957, 2001.
32. Korfmacher, W.A. et al. Cassette-accelerated rapid rat screen: a systematic
procedure for the dosing and liquid chromatography/atmospheric pressure
ionization tandem mass spectrometric analysis of new chemical entities as part of
new drug discovery, Rapid Commun. Mass Spectrom., 15(5), 335, 2001.
33. Wu, J.T., The development of a staggered parallel separation liquid chromato-
graphy/tandem mass spectrometry system with on-line extraction for high-
throughout screening of drug candidates in biological fluids, Rapid Commun.
Mass Spectrom., 15(2), 73, 2001.
34. Janiszewski, J.S. et al. A high-capacity LC/MS system for the bioanalysis of samplesgenerated from plate-based metabolic screening, Anal. Chem., 73(7), 1495, 2001.
35. Bro ¨ nstrup, M., High-throughput mass spectrometry for compound characterization
in drug discovery, Topics in Curr. Chem., 225, 283, 2003.
36. Hiller, D.L. et al. Application of a non-indexed dual sprayer pneumatically
assisted electrospray source to the high throughput quantitation of target
compounds in biological fluids, Rapid Commun. Mass Spectrom., 14(21), 2034,
2000.
High Throughput Strategies for In Vitro ADME Assays 101
Copyright © 2005 CRC Press, LLC
7/21/2019 Using Mass Spectrometry for Drug Metabolism Studies
http://slidepdf.com/reader/full/using-mass-spectrometry-for-drug-metabolism-studies 109/362
37. Xu, R. et al. Application of parallel liquid chromatography/mass spectrometry for
high throughput microsomal stability screening of compound libraries, J. Am. Soc.
Mass Spectrom., 13(2), 155, 2002.
38. Korfmacher, W.A. et al. Demonstration of the capabilities of a parallel high
performance liquid chromatography tandem mass spectrometry system for use in
the analysis of drug discovery plasma samples, Rapid Commun. Mass Spectrom.,
13(20), 1991, 1999.
39. Hiller, D.L. et al. High throughput quantitation using indexed multiprobe
electrospray technology in support of drug discovery, in 48th ASMS Conference
on Mass Spectrometry and Allied Topics, Long Beach, CA, 2000, ASMS.
40. Bayliss, M.K. et al. Parallel ultra-high flow rate liquid chromatography with mass
spectrometric detection using a multiplex electrospray source for direct, sensitive
determination of pharmaceuticals in plasma at extremely high throughput, Rapid
Commun. Mass Spectrom., 14(21), 2039, 2000.41. Yang, L. et al. Evaluation of a four-channel multiplexed electrospray triple
quadrupole mass spectrometer for the simultaneous validation of LC/MS/MS
methods in four different preclinical matrixes, Anal. Chem., 73(8), 1740, 2001.
42. Jenkins, K.M. et al. High throughput cytochrome P450 inhibition assays using
parallel LC/MS technologies. In: 48th ASMS Conference on Mass Spectrometry and
Allied Topics, Long Beach, CA, 2000. ASMS.
43. Kantharaj, E. et al. Simultaneous measurement of drug metabolic stability and
identification of metabolites using ion-trap mass spectrometry, Rapid Commun.
Mass Spectrom., 17(23), 2661, 2003.
44. Xu, R. et al. A fully automated system for metabolic stability and metabolite IDmeasurements, in 51st ASMS Conference on Mass Spectrometry and Allied Topics,
Montreal, Canada, 2003, ASMS.
45. Detlefsen, D.J. et al. A total analysis solution for metabolic stability and detailed
metabolite profiling, in 51st ASMS Conference on Mass Spectrometry and Allied
Topics, Montreal, Canada, 2003, ASMS.
46. Eddershaw, P.J., Beresford, A.P., and Bayliss, M.K., ADME/PK as part of a
rational approach to drug discovery, Drug Discov. Today., 5(9), 409, 2000.
102 Using Mass Spectrometry for Drug Metabolism Studies
Copyright © 2005 CRC Press, LLC

7/21/2019 Using Mass Spectrometry for Drug Metabolism Studies
http://slidepdf.com/reader/full/using-mass-spectrometry-for-drug-metabolism-studies 110/362
Chapter 4
Matrix Effects: Causes and Solutions
Hong Mei
4.1 Introduction
Due to the inherent selectivity and sensitivity of tandem mass spectrometry
combined with the separation power of a liquid chromatographic system,
liquid chromatography–tandem mass spectrometry (LC–MS/MS) has become
the method of choice for quantitative analysis for both drug discovery and
drug development studies in most pharmaceutical companies. When LC–MS/
MS was first introduced, it was generally assumed that the high specificity and
selectivity of LC–MS would eliminate extensive sample preparation and reducetime required for the chromatographic analysis, thus making LC–MS/MS a
much better method than the classical HPLC/UV methods.1 The fast turn-
around time of bioanalytical analysis with the use of LC–MS/MS has greatly
accelerated pharmaceutical research. However, in more recent years, matrix
ionization suppression issues in LC–MS/MS assays have been reported2–4 and
these matrix effects have become one of the most important causes for failures
and errors in bioanalysis.5
The existence of different matrix components in study samples as compared
with calibration samples can cause many fold errors in accuracy, which can
invalidate the analytical results and the calculation of pharmacokinetic
parameters based on these data. Matrix ion suppression (the most common
matrix effect) not only affects quantitative analysis in pharmacokinetic studies,
but can also hamper qualitative analysis in metabolite identification studies.
0-8493-1963-3/05/$0.00+$1.50 2005 by CRC Press 103
Copyright © 2005 CRC Press, LLC
7/21/2019 Using Mass Spectrometry for Drug Metabolism Studies
http://slidepdf.com/reader/full/using-mass-spectrometry-for-drug-metabolism-studies 111/362
For example, the severe ion suppression caused by nonvolatile salts in bile and
urine can make even major metabolites undetectable.6 With the increasing
number of LC–MS/MS assays that are applied to more complex matrices, such
as cell cultures, plasma, bile, urine, feces, and tissue samples, the issue of matrixeffects has gained more and more attention. Extensive studies have been
conducted to obtain a better understanding of the mechanism of electrospray
ionization and the factors that contribute to ionization suppression. At the
same time, different approaches for the evaluation of matrix effects have been
introduced, and various strategies for overcoming matrix effects have been
proposed.
4.1.1 What are matrix effects
In the FDA guidelines for bioanalytical validation, matrix effects are defined
as ‘‘interference from matrix components that are unrelated to the analyte.’’7
This broad definition includes both ion enhancement and ion suppression;
these effects can be caused by ionization competition of co-eluting
components, ‘‘cross-talk’’ from metabolites or internal standards, signal
enhancement caused by in-source fragmentation of metabolites, and low or
variable analyte recovery due to strong binding of analytes to biological
matrices. For bioanalytical LC–MS/MS assays, matrix effects usually refer to
signal reduction or enhancement enused by co-eluting components that are notrelated to the analytes. Matrix effects can cause significant errors in precision
and accuracy, thereby invalidating the assessment of pharmacokinetic results
based on these LC–MS/MS assays. Compared to ion enhancement, ion
suppression is more problematic in that it will reduce the sensitivity of the
assay. If one cannot control the variability caused by matrix effects, both ion
enhancement and ion suppression can be challenging, because both will result
in poor reproducibility of results. When matrix effects cause differential
suppression or enhancement between calibration samples and study samples,
the accuracy of the assay results will be significant affected.
Based on our limited understanding of LC–MS/MS matrix effects, the
following common perception of matrix effects have been widely accepted:
(1) atmospheric pressure chemical ionization (APCI) is less sensitive than
electrospray ionization (ESI) in regard to matrix effects, and (2) extensive
sample preparation may be required due to the need to separate the analyte
from co-eluting endogenous matrix components. Recently, studies have shown
that APCI can also exhibit severe matrix effects and that exogenous material
can also be a major cause of ionization suppression. Therefore, a thorough
understanding of the mechanisms of matrix effects can help one to avoid the
problem of matrix effects.
The aim of this chapter is to discuss the possible mechanisms of LC–MS/
MS matrix effects, to provide the guidelines for evaluating matrix effects and to
propose strategies for overcoming matrix effects. By using this information,
researchers should be able to develop faster and more reliable LC–MS–MS
assays that are devoid of matrix effect problems.
104 Using Mass Spectrometry for Drug Metabolism Studies
Copyright © 2005 CRC Press, LLC

7/21/2019 Using Mass Spectrometry for Drug Metabolism Studies
http://slidepdf.com/reader/full/using-mass-spectrometry-for-drug-metabolism-studies 112/362
4.2 Recent Literature Review
4.2.1 Mechanistic studies of matrix effects
The mechanism of matrix induced ion suppression or ion enhancement is still
not fully understood, this is in part due to the fact that the mechanism of
electrospray ionization has proven to be very difficult to establish. However,
extensive investigations have been conducted to gain a better understanding
of the electrospray ionization process and the causes of matrix induced ion
suppression. Some investigations have focused on each individual step involved
in the production of ions from solution phase to gas phase, while others have
tried to identify the source of the interfering matrices.
4.2.1.1 Ionization process for analyte and matrix components in ESI
There are a number of papers that have described details of how ions are first
generated in the solution phase and then converted to gas phase ions in the
electrospray ionization (ESI) process.3,8–12 Basically, there are four critical
steps in ESI that are important to mass response: (1) excess charge generation
in the Taylor cone and ESI droplets; (2) uneven fission of parent droplets
to very small, highly charged offspring droplets that readily transform to
gas phase ions; (3) formation and transformation of gas phase ions and(4) separation of neutrals from charged ions. In ESI, the liquid is an electrolyte
solution that is continuously flowing into a high voltage capillary tip where
primary droplets are formed in the Taylor cone that is generated at the
capillary tip. Due to the charge separation that is caused by the voltage
gradient, these droplets have excess charge that exists on the surface of the
droplet while solvated paired ions or neutrals are present in the inner part of
the droplet (inner phase). The concentration of excess charge is determined
by the flow rate and applied voltage, and its production rate is equal to the
maximum rate of production of vapor phase ions. With applied heating and
desolvation gas, continuous solvent evaporation at constant charge leads
to droplet shrinkage and uneven fission to form offspring droplets from the
surface phase of parent droplets, thus with significantly higher mass-to-charge
ratio on the offspring droplets. The inner phase of large parent droplets
contains ion pairs that will be less possible to be detected by the mass
spectrometer. The repeated evaporation and uneven droplet fission leads
ultimately to gas phase ions by one of two model mechanisms: evaporation
from droplet surfaces during the fission process (the charged residue model),13
or formation of final droplets containing only one ion at the end of fission
process (ion evaporation model).14 Gas phase ions would undergo gas phase
ion reactions in the atmospheric ion sampling regions. Finally, the ultimate gas
phase ions in the sampling region will be sampled through an orifice, into the
differentially pumped regions of the mass spectrometer, while the neutrals,
solids and liquids will be blocked by various means, e.g., an interface metal
plate (skimmer) and curtain gas. Any matrix components that interfere with
Matrix Effects: Causes and Solutions 105
Copyright © 2005 CRC Press, LLC
7/21/2019 Using Mass Spectrometry for Drug Metabolism Studies
http://slidepdf.com/reader/full/using-mass-spectrometry-for-drug-metabolism-studies 113/362
any of the above-mentioned process could affect the ionization efficiency of an
analyte. Many studies have already proven that for ESI, the intensity of ion
signal is dependent on the chemical nature of the analyte, as well as many other
factors, including the presence and concentration of electrolytes in the liquid,15
volatility of the solvent,11,16 surface activity of the droplet9,12,17,18 presence of
nonvolatile components,15,19 flow rate of electrosprayed solution,20 concentra-
tions of other ionizable species9,12 and competition of gas phase ion-transfer
reaction between analytes and other ionized ions.11,16,22,23
4.2.1.2 Property of analyte and ESI response
In addition to instrumental parameters, the most important factor thatdetermines ESI responses is the physical and chemical nature of the analyte and
co-eluting components. There are two models, the ion-evaporation model and
the equilibrium-partitioning model, that have been developed to predict the
ESI response of an analyte based on the properties and concentrations of the
analyte and co-eluting components.
4.2.1.2.1 Evaporation rate and ion-evaporation model
Based on the ion evaporation model (IEM) of gas phase ion formationdescribed by Irbarne & Thomson, Tang and Kebarle proposed an equation to
predict ESI response of analyte A in the presence of electrolytes (E) and other
components (M) using the evaporation rates and the concentrations.14,21,24 The
typical equations are listed below.
Two components: I A ¼ fp ka½A
ka½A þ ke½E I : ð4:1Þ
Three components: I A ¼ fp ka½A
ka½A þ km½M þ ke½E I : ð4:2Þ
As described by Tang and Kebarle, the product fp is a factor that was assumed
to be independent of the chemical nature of the ions, f is the fraction of charges
on the droplets that are converted to gas phase ions (desolvation efficiency)
and p is the ion-sampling efficiency of the system. The bracketed ions are the
concentrations of the analyte (A), a matrix component (M) and electrolyte
species (E) and the k’s are the rate constants of ion evaporation.21 The rate
constant for each ion can be calculated experimentally from the free energy of
activation (G).3 The value of G depends on the number of the charges (N )
and the radius of the droplet (R), and the distance of ion charges from the
surface of the droplet (D). D reflects the extent of solvation. Strongly solvated
ions, such as Liþ, hold on strongly to a large number of solvent molecules
and have larger D, thus need more energy to evaporate. Generally, the ion
106 Using Mass Spectrometry for Drug Metabolism Studies
Copyright © 2005 CRC Press, LLC

7/21/2019 Using Mass Spectrometry for Drug Metabolism Studies
http://slidepdf.com/reader/full/using-mass-spectrometry-for-drug-metabolism-studies 114/362
evaporation rate constant k increases with N , decreases with R and decreases
with D.3,11
Basically, this model predicts that the ions with higher charge density
and lower desolvation will have higher ESI responses. This was the firstmathematical model that established the dependence of ion intensity on its
concentration. It also successfully modeled the ion suppression effect of NH4Cl
on a series of analytes.11 Furthermore, it also explained the saturation of
calibration curve by suggesting that competition occurs when the sum of
electrolyte species (I E) and analyte ion (I A) exceeds the total fixed available
current (I ). It demonstrated that the ion intensity, I A, depends only on the ratio
of ka/kb, but not on the individual ka, as illustrated by Kebarle and Peschke in
the following relationship developed using Equation 4.1:11
I a
I b¼
ka½A
kb½B or
I a
I b¼
ka
kb
when ½A ¼ ½B: ð4:3Þ
However, this model was built using data generated by a variety of metal
cations that have different ion evaporation rates but no surface activity.
Furthermore, this model of ion evaporation failed to predict the ESI responses
for more complex organic molecules where surface activity plays an important
role. The factor of surface activity had to be accounted for in the explanation
of the analyte response at the high concentration range; however, surface
activity was not included in the mathematical equation.21 Due to this reason,
this model can only predict the response within a narrow range of analyte
concentration. Furthermore, due to the exponential relationship between k and
G, a small experimental deviation in G will cause a significant difference in
k. As a result, the calculated theoretically generated rate constant (k) based on
an experimentally obtained G for the same ion exhibited a large range of
values.11
4.2.1.2.2 Surface activity and partitioning-equilibrium model
With the consideration of the importance of surface activity, Enke developed
the partitioning-equilibrium model to predict the ESI response of an analyte
with a single charge in the presence of matrix components based on the surface
activity of the analyte and co-eluting components as well as the competition for
the limited number of excess charge sites on the surface of the initial droplet
without invoking the effect of ion evaporation.9 Excess charge on the surface of
the Taylor cone and the droplets is generated by the intense electric field at the
ESI capillary tip. The concentration of excess charge [Q] is equal to the circuit
current (I ) divided by the product of the Faraday constant (F ) and flow rate
(G). In other words, [Q] is determined by the applied voltage and flow rate.
Therefore, the rate of production of surface excess charge is a constant at a
fixed experimental condition. Thus, [Q] is also the upper limit for the
concentration of observable ions generated by the electrospray process and
Matrix Effects: Causes and Solutions 107
Copyright © 2005 CRC Press, LLC

7/21/2019 Using Mass Spectrometry for Drug Metabolism Studies
http://slidepdf.com/reader/full/using-mass-spectrometry-for-drug-metabolism-studies 115/362
equal to the sum of the concentrations of all the charged species on the surface,
e.g., [Aþ]s, and [E þ]s.9 Therefore, [Q] can be described by the following equation:
½Q ¼ IF =G ¼ ½Aþs þ ½E þs: ð4:4Þ
As described previously, ESI droplets can be divided into two parts: the
charged surface phase and the neutral interior phase. In all proposed
mechanisms of gas ion formation, gas phase ions that are freed from the
liquid phase are those charged ions at the droplet surface, even though ions are
free to partition between the surface and interior phases. Therefore, ions that
are better able to partition into and stay inside the surface phase would expect
to have higher ESI responses than ions trapped in the interior phase. Surface
affinity or surface activity is closely related to the nonpolarity of a mole-
cule. Usually, higher hydrophobicity will lead to higher surface activity. An
equilibrium-partitioning coefficient (K ) was used in this model and defined for
each analyte as the ratio of its concentration on the droplet surface phase to
that in the interior phase. For the analyte ion Aþ and the necessary electrolyte
ion Eþ, the equilibrium partition reactions and their partition coefficient can be
described as follows:
ðAþX Þi , ðAþÞs þ ðX Þi,
K A ¼ ½Aþ
s½X
i=½Aþ
X
i, ð4:5Þ
when [AþX ] [Aþ]s, and C A ¼ [AþX ] þ [Aþ]s,
K A ¼ ½Aþs½X i=C A: ð4:6Þ
ðE þX Þi , ðE þÞs þ ðX Þi,
K E ¼ ½E þs½X i=½E þX i, ð4:7Þ
when [E þ
X
] [E þ
]s, and C E ¼ [E þ
X
] þ [E þ
]s,
K E ¼ ½E þs½X i=C E: ð4:8Þ
Where X denotes the counter ions, C A and C E are the total analyte
concentration and the total electrolyte concentration, respectively. The two
components Aþ and Eþ are both competing for the supply of a fixed number of
surface charges. Therefore, this equation and equilibrium constant for this
competition can be expressed as
ðAþX Þi þ ðE þÞs , ðAþÞs þ ðE þX Þi,
K A=K E ¼ ½Aþs½E þX i=½AþX i½E þs, ð4:9Þ
when [AþX ] [Aþ]s, and [E þX ] [E þ]s,
K A=K E ¼ ½AþsC E=½E þsC A: ð4:10Þ
108 Using Mass Spectrometry for Drug Metabolism Studies
Copyright © 2005 CRC Press, LLC
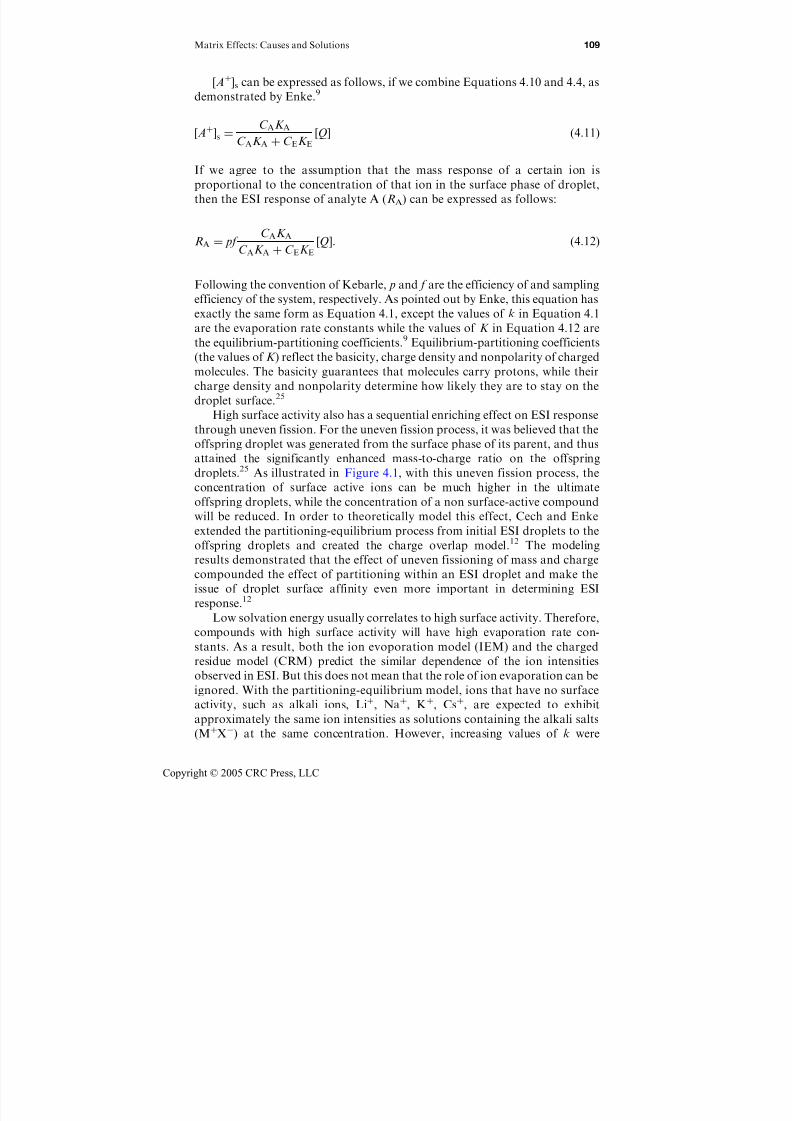
7/21/2019 Using Mass Spectrometry for Drug Metabolism Studies
http://slidepdf.com/reader/full/using-mass-spectrometry-for-drug-metabolism-studies 116/362
[Aþ]s can be expressed as follows, if we combine Equations 4.10 and 4.4, as
demonstrated by Enke.9
½Aþs ¼ C AK AC AK A þ C EK E
½Q ð4:11Þ
If we agree to the assumption that the mass response of a certain ion is
proportional to the concentration of that ion in the surface phase of droplet,
then the ESI response of analyte A (RA) can be expressed as follows:
RA ¼ pf C AK A
C AK A þ C EK E
½Q: ð4:12Þ
Following the convention of Kebarle, p and f are the efficiency of and sampling
efficiency of the system, respectively. As pointed out by Enke, this equation has
exactly the same form as Equation 4.1, except the values of k in Equation 4.1
are the evaporation rate constants while the values of K in Equation 4.12 are
the equilibrium-partitioning coefficients.9 Equilibrium-partitioning coefficients
(the values of K ) reflect the basicity, charge density and nonpolarity of charged
molecules. The basicity guarantees that molecules carry protons, while their
charge density and nonpolarity determine how likely they are to stay on thedroplet surface.25
High surface activity also has a sequential enriching effect on ESI response
through uneven fission. For the uneven fission process, it was believed that the
offspring droplet was generated from the surface phase of its parent, and thus
attained the significantly enhanced mass-to-charge ratio on the offspring
droplets.25 As illustrated in Figure 4.1, with this uneven fission process, the
concentration of surface active ions can be much higher in the ultimate
offspring droplets, while the concentration of a non surface-active compound
will be reduced. In order to theoretically model this effect, Cech and Enke
extended the partitioning-equilibrium process from initial ESI droplets to the
offspring droplets and created the charge overlap model.12 The modeling
results demonstrated that the effect of uneven fissioning of mass and charge
compounded the effect of partitioning within an ESI droplet and make the
issue of droplet surface affinity even more important in determining ESI
response.12
Low solvation energy usually correlates to high surface activity. Therefore,
compounds with high surface activity will have high evaporation rate con-
stants. As a result, both the ion evoporation model (IEM) and the charged
residue model (CRM) predict the similar dependence of the ion intensities
observed in ESI. But this does not mean that the role of ion evaporation can be
ignored. With the partitioning-equilibrium model, ions that have no surface
activity, such as alkali ions, Liþ, Naþ, Kþ, Csþ, are expected to exhibit
approximately the same ion intensities as solutions containing the alkali salts
(MþX) at the same concentration. However, increasing values of k were
Matrix Effects: Causes and Solutions 109
Copyright © 2005 CRC Press, LLC
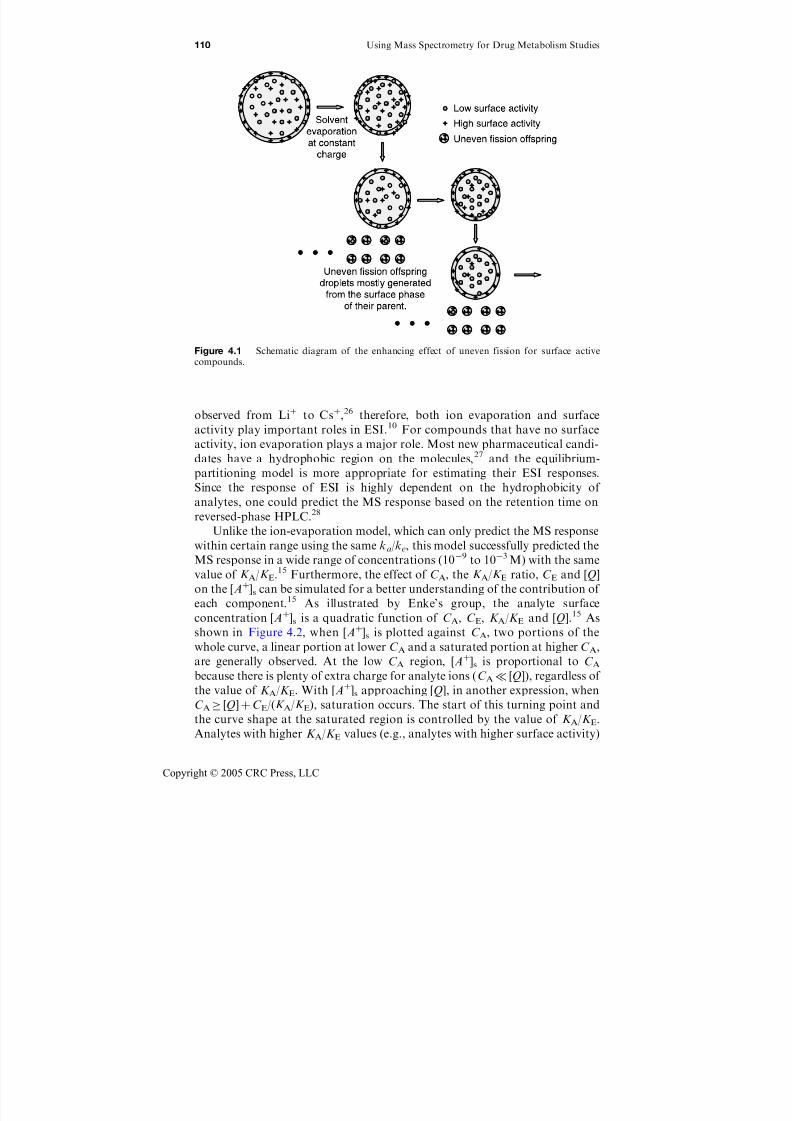
7/21/2019 Using Mass Spectrometry for Drug Metabolism Studies
http://slidepdf.com/reader/full/using-mass-spectrometry-for-drug-metabolism-studies 117/362
observed from Liþ to Csþ,26 therefore, both ion evaporation and surface
activity play important roles in ESI.10 For compounds that have no surface
activity, ion evaporation plays a major role. Most new pharmaceutical candi-
dates have a hydrophobic region on the molecules,27 and the equilibrium-
partitioning model is more appropriate for estimating their ESI responses.
Since the response of ESI is highly dependent on the hydrophobicity of
analytes, one could predict the MS response based on the retention time on
reversed-phase HPLC.28
Unlike the ion-evaporation model, which can only predict the MS response
within certain range using the same ka/ke, this model successfully predicted the
MS response in a wide range of concentrations (109 to 103 M) with the same
value of K A/K E.15 Furthermore, the effect of C A, the K A/K E ratio, C E and [Q]
on the [Aþ]s can be simulated for a better understanding of the contribution of
each component.15 As illustrated by Enke’s group, the analyte surface
concentration [Aþ]s is a quadratic function of C A, C E, K A/K E and [Q].15 As
shown in Figure 4.2, when [Aþ]s
is plotted against C A
, two portions of the
whole curve, a linear portion at lower C A and a saturated portion at higher C A,
are generally observed. At the low C A region, [Aþ]s is proportional to C Abecause there is plenty of extra charge for analyte ions (C A [Q]), regardless of
the value of K A/K E. With [Aþ]s approaching [Q], in another expression, when
C A [Q] þ C E/(K A/K E), saturation occurs. The start of this turning point and
the curve shape at the saturated region is controlled by the value of K A/K E.
Analytes with higher K A/K E values (e.g., analytes with higher surface activity)
Figure 4.1 Schematic diagram of the enhancing effect of uneven fission for surface activecompounds.
110 Using Mass Spectrometry for Drug Metabolism Studies
Copyright © 2005 CRC Press, LLC
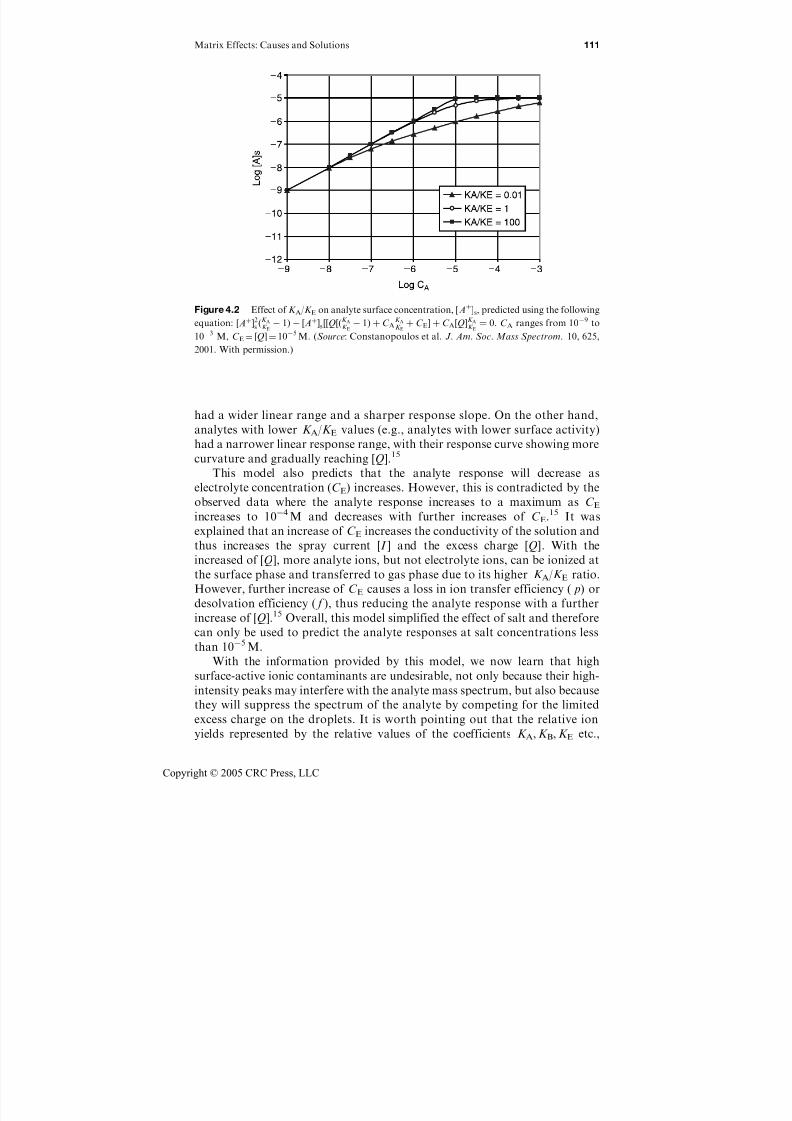
7/21/2019 Using Mass Spectrometry for Drug Metabolism Studies
http://slidepdf.com/reader/full/using-mass-spectrometry-for-drug-metabolism-studies 118/362
had a wider linear range and a sharper response slope. On the other hand,
analytes with lower K A/K E values (e.g., analytes with lower surface activity)
had a narrower linear response range, with their response curve showing more
curvature and gradually reaching [Q].15
This model also predicts that the analyte response will decrease as
electrolyte concentration (C E) increases. However, this is contradicted by the
observed data where the analyte response increases to a maximum as C Eincreases to 104 M and decreases with further increases of C E.15 It was
explained that an increase of C E increases the conductivity of the solution and
thus increases the spray current [I ] and the excess charge [Q]. With the
increased of [Q], more analyte ions, but not electrolyte ions, can be ionized at
the surface phase and transferred to gas phase due to its higher K A/K E ratio.
However, further increase of C E causes a loss in ion transfer efficiency ( p) or
desolvation efficiency ( f ), thus reducing the analyte response with a further
increase of [Q].15 Overall, this model simplified the effect of salt and therefore
can only be used to predict the analyte responses at salt concentrations less
than 105 M.
With the information provided by this model, we now learn that high
surface-active ionic contaminants are undesirable, not only because their high-
intensity peaks may interfere with the analyte mass spectrum, but also because
they will suppress the spectrum of the analyte by competing for the limited
excess charge on the droplets. It is worth pointing out that the relative ion
yields represented by the relative values of the coefficients K A, K B, K E etc.,
Figure 4.2 Effect of K A/K E on analyte surface concentration, [Aþ]s, predicted using the following
equation: ½Aþ2s ðK A
K E 1Þ ½Aþs½½Q½ðK A
K E 1Þ þ C A
K AK E
þ C E þ C A½QK AK E
¼ 0. C A ranges from 109 to
103 M, C E ¼ [Q] ¼ 105 M. (Source: Constanopoulos et al. J. Am. Soc. Mass Spectrom. 10, 625,
2001. With permission.)
Matrix Effects: Causes and Solutions 111
Copyright © 2005 CRC Press, LLC

7/21/2019 Using Mass Spectrometry for Drug Metabolism Studies
http://slidepdf.com/reader/full/using-mass-spectrometry-for-drug-metabolism-studies 119/362
depend on a complex sequence of events which require consideration not only
of bulk to surface equilibriums and ion evaporation rate, but also droplet
evolution schemes and other experimental settings.26,29 For example, the
surface partitioning coefficient of a low surface-active analyte can be higherwhen smaller initial droplets are formed with less fission steps required before
gas phase ion formation begins, such as in nanospray techniques.6,30
4.2.1.2.3 pK a and solvent pH
Since ESI requires protonation or deprotonation, it was believed, initially, that
pK a and pH of solution would play an important role in ESI response. How-
ever, protonated ions of basic analytes can be observed when the pH is higher
than the analyte pK a.31,32
One possible explanation for this phenomenon is thatthe fixed amount of surface excess charge is dictated by the solution flow, and
the applied voltage, not the solution pH.9 In other words, the analyte or other
components that stay on the surface phase of the ESI droplet can be
protonated even if their pK a values are below the solution pH. Besides, uneven
fission process will enrich the signal of the surface-active components but not
those ion pairs that stayed inside the droplet. Furthermore, gas phase ion
reactions can also generate charged ions from neutrals.32,33 Therefore, pK aand solvent pH are not as important as the surface activity in producing an
ESI response.
4.2.1.3 Possible mechanisms for ion suppression in ESI
The understanding of how the ESI response is controlled by instrument
settings, properties of the analyte and co-eluting components have brought us
closer to understanding the mechanisms of ion suppression. The following
section will focus on the possible mechanisms involved in both the solution
phase and the gas phase, as shown schematically in Figure 4.3.
4.2.1.3.1 Competing for limited surface excess charge
Even though there are different mechanisms (IEM and CRM) for gas phase ion
formation, both theories agree that initial gas ions are generated from the
surface phase of ESI droplets. Both the ion-evaporation model (Equation 4.1)
and the partitioning-equilibrium model (Equation 4.12) are used to predict that
the ESI response in the presence of other components is based on competition
for a fixed amount of ESI current (I ) or excess charge (Q) which is controlled
by the applied voltage and the flow rate. Since I is proportionally correlated to
Q as expressed by Equation 4.4, the competition for I and for Q are equivalent.
Furthermore, since the excess charges all reside on the surface of the droplets,
competition for the limited charge or competition for the limited surface space
are both possible. Based on Equation 4.12, it is clear that when total ion
concentration in the droplet exceeds [Q], there will be a competition among the
ions for the excess surface charge. Matrix induced ion suppression can be
112 Using Mass Spectrometry for Drug Metabolism Studies
Copyright © 2005 CRC Press, LLC

7/21/2019 Using Mass Spectrometry for Drug Metabolism Studies
http://slidepdf.com/reader/full/using-mass-spectrometry-for-drug-metabolism-studies 120/362
explained in part as the competition for the limited excess surface charge. The
matrix components with higher K are more surface active, therefore they would
be expected to out-compete the low K analytes for the limited excess charge or
limited space on the initial droplet surface. The uneven fission process will
produce an even more profound ion suppression effect when surface-active
matrices are present. The high surface-active matrices will out-compete the low
surface-active analyte in each uneven fission process and occupy the droplet
surface in each subsequent offspring droplet. In this case, analytes, would be
preferentially left in the interior neutral phase of each preceding droplet and
therefore became undetectable.
Surfactants are molecules with both polar and hydrophobic regions and
known to prefer the air–liquid interface. Due to their high affinity to the
droplet surface, surfactants are expected to have high ESI responses. Many
experiments have shown that surfactants significantly suppress the ESI
response of other analytes.12,14 Therefore, it is not hard to understand that
surfactants, such as Tween 80, that are used as dosing excipients to improve the
solubility of drug candidates, could cause significant ESI ion suppression for
co-eluting analytes in LC–MS/MS assays.34–36
Polymers that are used as co-solvents to improve the solubility of
hydrophobic compounds usually have both hydrophilic and hydrophobic
Figure 4.3 Schematic diagram of possible mechanisms of ionization suppression for electrosprayionization.
Matrix Effects: Causes and Solutions 113
Copyright © 2005 CRC Press, LLC
7/21/2019 Using Mass Spectrometry for Drug Metabolism Studies
http://slidepdf.com/reader/full/using-mass-spectrometry-for-drug-metabolism-studies 121/362
parts in the same molecule, therefore these polymers also have high surface
activity. The attainment of improved solubility using PEG400 is through the
bridging effect of this polymer between the hydrophobic analyte and water.
The backbone of polyethelene ( CH2CH2 )n of PEG400 will associate withthe nonpolar part of hydrophobic compounds via hydrophobic interaction
while the terminal hydroxyl group ( OH) will hydrogen bond with water. At
the same time, this hydrophobic backbone of polyethelene also provides for
sufficient surface activity of PEG400. Therefore, if PEG400 is contained in the
plasma sample and cannot be separated from analytes, matrix effects will often
be observed. Several reports have described severe matrix effects from plasma
samples obtained from laboratory animals dosed with formulations containing
PEG400.34–37
Lipophilic components such as long-chain (C12–C16) fatty acids,glycerophosphocholine lipids, phosphatidylethanolamine, sphyngomylein,
and triacylglycerols in plasma and tissue sample all have high surface activity,
therefore these components can be part of the cause of ion suppression effects.
It was demonstrated that lyso-phosphatidylcholine (C16:0, C18:0, C18:2)
present in serum contributed to the matrix effects observed in an assay for
verapamil.38 In our laboratory, we have observed that hydrophobic matrix
effects are more often observed in tissue samples, especially in brain samples;
part of the reason for this effect might be that brain tissue contains more lipid
components that are surface active than those found in plasma samples.
4.2.1.3.2 Incomplete evaporation
It is a well-known fact that the presence of nonvolatile salts such as phosphate
and sulfate in the mobile phase is deleterious for ion sources of LC–MS/MS
systems due to the deposition of solid material onto surfaces of the source.
Nonvolatile components in biological sample can also cause significant ion
suppression for early-eluting compounds. Ions that are generated in droplets
can only be detected after they are emitted into the gas phase, therefore
evaporation is a critical process for the ultimate gas phase ion generation. The
efficiency of gas phase ion generation depends on the evaporation efficiency
or desolvation efficiency ( f ), size and charge of the initial ESI droplets.
Nonvolatile material in the biological sample can change the volatility,
viscosity, and conductivity of the sprayed solution, causing incomplete
evaporation and weak Taylor cone emission, hindering the process of uneven
fission, and decreasing the efficiency of gas phase ion generation; this effect
results in a reduction of the number of analytes that are converted to the gas
phase and then detected by the mass spectrometer system.15 In order to test
these hypotheses, King and colleagues designed a set of experiments comparing
the amount of analyte and nonvolatile components depositing on the interface
plate with or without nonvolatile material present in the sprayed solution.19 If
the nonvolatile components cause incomplete evaporation, then both the
analyte and the nonvolatile components would stay in the solution phase
and be sprayed onto the interface plate. The tested nonvolatile samples were
114 Using Mass Spectrometry for Drug Metabolism Studies
Copyright © 2005 CRC Press, LLC

7/21/2019 Using Mass Spectrometry for Drug Metabolism Studies
http://slidepdf.com/reader/full/using-mass-spectrometry-for-drug-metabolism-studies 122/362
ammonium sulfate and extracted plasma samples prepared by protein
precipitation, liquid–liquid extraction and solid phase extraction, respecti-
vely. It was shown that the samples prepared by protein precipitation
contained the most nonvolatile material. Furthermore, it was demonstratedthat the amount of nonvolatile matrix components was correlated to the
extent of ion suppression. With more nonvolatile material present, more
analytes were deposited on the interface plate than were transferred to the
gas phase.19
Instrument interface designs with inefficiency in the heating and desolva-
tion processes are more prone to matrix effects due to the cause of incomplete
evaporation when analytes are eluted with nonvolatile components. For
example, it has been shown that one design of the APCI probe made by
Micromass had issues in terms of low sensitivity39
and was more prone tomatrix effects than other vendors’ designs for APCI probes.40,41 It was also
demonstrated that decreasing the interface chamber pressure by attaching a
roughing pump would improve the APCI response of this one design;39 these
findings indicated that desolvation or ion transmission characteristics of the
unmodified Micromass APCI interface were not optimized. This might be one
of the reasons that this APCI probe design was more prone to matrix effects
than other vendors’ APCI probes. A new Micromass APCI probe (IonsSabre,
Micromass, UK) has been introduced and its design includes an increased
heating capacity and efficiency by using an optimized ceramic heater withgradient heating distribution, so that the efficiency of desolvation is improved
therefore the ionization efficiency and sensitivity of this new design should be
better than the previous design. Currently, the most recent generation of APCI
probes of tandem mass spectrometers by different manufactures are all made
with enhanced heating capacity and efficiency, some with even improved gas
dynamics. The advanced Turbo V source for the Sciex API 4000 MS/MS
system is equipped with dual ceramic heaters and improved gas dynamics
which maximize the desolvation efficiency, thus providing greater efficiency in
ionization and increased sensitivity and reduced peak tailing caused by cross-
contamination at the same time. In a recent report, it was demonstrated that
fewer matrix effects were observed with the same set of samples prepared by
protein precipitation using the Sciex API 4000 as compared with the Sciex
API 3000.42
It has been demonstrated that polar matrices cause matrix effects mostly
due to incomplete evaporation as opposed to neutral evaporation.19 If this type
of ion suppression was caused by the competition of charge from matrix
components, then analytes could exist as neutrals in the gas phase in ESI, but
would be ionized by APCI. King and colleagues built a combined ESI–APCI
source, expecting to see an improved signal when using the corona discharge
for neutrals in gas phase.19 However, no improvement was observed under
these conditions for rat plasma samples prepared by protein precipitation;
these data indicated that the amount of neutral analytes existing in the gas
phase was negligible. Therefore, the nondetectable analytes in this sample set
must have existed as either liquid or solids in the ESI source.
Matrix Effects: Causes and Solutions 115
Copyright © 2005 CRC Press, LLC

7/21/2019 Using Mass Spectrometry for Drug Metabolism Studies
http://slidepdf.com/reader/full/using-mass-spectrometry-for-drug-metabolism-studies 123/362
4.2.1.3.3 Ion pairing
Ion suppression caused by strong acids, like trifluoroacetic acid (TFA), has
been a problem for ESI applications in proteomics. This type of ion sup-pression was originally believed to be primarily due to the high surface tension
and the high conductivity of the solution which resulted in unstable spray
effects.43,44 However, further studies have shown that the ion suppression
caused by TFA is also due to its strong ion-pairing effect with basic analytes.30
The strong ion-pairing of TFA with basic analytes keeps analytes in the
interior neutral phase of ESI droplets and prevents the analytes from
partitioning to the surface phase. Based on this mechanism, a solution of
TFA fix was successfully proposed and tested. The TFA fix is a method to
reduce the ion suppression caused by TFA using a post-column addition of asolution containing a high concentration of propionic acid in 2-propanol at the
flow rate half that of the mobile phase flow rate.30 As proposed by Apffel and
colleagues, when TFA ion-pairs with a basic analyte, both TFA and the
analyte are restricted in the interior neutral phase and therefore cannot be
released to the gas phase, even though TFA is a volatile acid. When a weak and
less volatile acid, such as propionic acid, is added at high concentration, its
mass effect will compete with TFA for ion pairing with the basic analyte and in
turn releases TFA into the surface phase of droplets that go into the gas phase.
At the same time the weaker association between weak acid and basic analytewill make more analytes partition into the surface phase as droplets that are
released to the gas phase. This ion-pairing mechanism was further corrobo-
rated by the observation of ion enhancement of ‘‘almost neutral’’ compounds,
such as diphenylthiourea, in the presence of 0.2% TFA. As a strong acid, TFA
cannot pair with the analyte in this situation; however, it does improve the
protonation of the analyte.45
4.2.1.3.4 Competition for protons in gas phase
ESI is a soft ionization technique that involves transferring the ions from
solution phase to gas phase. The detected gas ions are initially generated from
solution phase, and only those very stable singly charged alkali ions will stay in
the gas phase without any chemical reactions. Since the gas phase environment
is different than the solution phase, many ions can be modified in the gas phase
after they are initially generated in the solution phase. These gas phase
chemical reactions, such as charge neutralization, charge stripping and charge
transfer, can also have a significant effect on ESI response. The proton transfer
reaction is a fundamental chemical reaction that has been investigated in both
solution and gas phases. Several studies have demonstrated that gas phase
proton transfer reactions occur in ESI.11,22,23
The order of basicity in the solution phase can differ from that in the
gas phase, thus a proton transfer to a strong gas phase base can enhance the
formation of some ions while suppressing the formation of others. A special
study was conducted to study the impact of gas phase proton affinities on the
116 Using Mass Spectrometry for Drug Metabolism Studies
Copyright © 2005 CRC Press, LLC
7/21/2019 Using Mass Spectrometry for Drug Metabolism Studies
http://slidepdf.com/reader/full/using-mass-spectrometry-for-drug-metabolism-studies 124/362
ESI responses.16 This study demonstrated that ions present in solution can be
altered in the gas phase by the presence of molecules that are stronger gas
phase ions. If matrix components are stronger gas phase ions, they will out-
compete gas phase analyte ions for protons and suppress the response of analytes. It has been suggested that matrix effects caused by PEG400 are due
to gas-phase proton competition.34
4.2.1.4 Matrix sensitivity: ESI or APCI?
In order to understand what ionization mode is more subjective to matrix
effects, we first need to understand the differences in the two ionization modes.
Even though there are several models that have been proposed to explain
how gas phase ions are produced via charged droplets in electrospray, it wasgenerally agreed that for ESI, most ions are generated in solution phase
followed by transferring to the gas phase; while for APCI, molecules (not ions)
are first vaporized into gas phase followed by being ionized by the corona
discharge process. In other words, the ionization efficiency can be affected by
matrix components in both solution phase and gas phase for ESI, while only
in gas phase for APCI. The difference in ionization process in these two
different modes has been utilized to determine whether the dominant impact of
matrices is in solution phase or gas phase.19 It was found that ESI is more
susceptible to plasma matrix effects than APCI, because these matrices usuallycontain large amounts of nonvolatile components and high concentrations of
electrolytes: all these have been proven to have a dominant effect in the
reduction of ionization efficiency in the solution phase, and thus reduce the
amount of analytes being transferred to the gas phase.19 Compared to APCI,
there are more steps involved in ESI that are susceptible to matrix effects.
Matrix components can affect ionization efficiency at any of the steps of
ion formation starting from the initial ESI droplet formation to the final gas
phase ion reaction, therefore ESI is believed to be more susceptible to matrix
effects than APCI. However, ionization in APCI could also be affected to a
significant degree if the matrices were dominated by a large amount of other
ionizable species that can compete with analyte ions for gas phase protons.34
Generally speaking, for the matrix components that will affect solution phase
ion formation, such as the droplet evaporation process, charged droplet
formation and uneven fission, ESI will be more sensitive than APCI. For
matrix components that affect gas phase ion reactions, both ESI and APCI
will be affected to a significant degree. However, there are also exceptions:
when there are defects in the interface design, such as insufficient heating
and desolvation capacity for the APCI interface, then APCI can be more
susceptible to matrix effects.
4.2.1.5 Differences in interface design
It is generally believed that ESI is more subject to matrix effects than APCI.
However, it was found that different instrument interface designs could also
Matrix Effects: Causes and Solutions 117
Copyright © 2005 CRC Press, LLC
7/21/2019 Using Mass Spectrometry for Drug Metabolism Studies
http://slidepdf.com/reader/full/using-mass-spectrometry-for-drug-metabolism-studies 125/362
affect the tolerance of matrix effects with different ionization modes. A
comparative study using three different triple quadrupole mass spectrometers
was performed to evaluate their sensitivity toward matrix effects; the three
tandem MS systems were the following: PE Sciex (Concord, Ontario, Canada)API 3000, Micromass (UK) Quattro Ultima and Thermo-Finnigan (USA)
TSQ 7000 API-2.41 Identical sets of samples containing the same amount of
several test compounds were prepared using protein precipitation. The matrices
for these test samples were either HPLC grade water or rat plasma A or rat
plasma B and they were analyzed using these three different tandem mass
spectrometers. Identical mobile phases, gradient (one fast and one slow on each
system), flow rate, column and HPLC systems were used to reduce the assay
variation to only be the various ion sources. Assays were performed using both
APCI and ESI on all the samples with all three mass spectrometers. Table 4.1summarizes the observations with the fast gradient where both the analyte and
the internal standard (ISTD) eluted at 1.9 min. Significant ion suppression of
both the analyte and ISTD in rat plasma B was observed when using the
Micromass Quattro Ultima system with both ionization modes and using the
Finnigan TSQ system with ESI mode, while no ion suppression was observed
using Sciex API 3000 with either APCI or ESI mode (Table 4.1). Table 4.2
summarizes the same comparison with the slow gradient where the analyte
eluted at 4.0 min and the ISTD eluted at 3.9 min. Consistent analytical results
were obtained using the Sciex API 3000 interfaced with both ionization modesand using the Finnigan TSQ instrument interfaced with the ESI source. How-
ever, weak ion suppression was observed in rat plasma A using the Finnigan
TSQ with the APCI mode. It is interesting to note that for the same set of
samples under the same slow gradient, the mass responses of the two com-
pounds in plasma A and B showed more variation using the Micromass
Quattro Ultima interfaced with the APCI mode, while mass responses obtained
by ESI were quite consistent (Table 4.2). These compelling data suggest that
the matrix effects in HPLC–MS/MS assays are not only ionization mode
(APCI, ESI) dependent, but can also vary between different vendors’ source
designs. It was found that under the same ionization mode, different instru-
ments showed different sensitivity to the same matrix (Table 4.1), and that for
the Micromass Quattro Ultima, the APCI mode was even more sensitive to the
observed matrix effects than the ESI mode.41
4.2.1.6 Nature of matrices: hydrophilic versus hydrophobic
Identifying the nature of matrices will provide useful information for over-
coming the matrix effects. Most drug candidates are small molecules with
log P ranging from 1 to 5 and are retained on a reversed-phase HPLC
column.27 By manipulating pH, the composition of the mobile phases and
the gradient46 or selecting a mini-bore column,47 one can easily separate the
drug candidates from those polar and nonvolatile matrices that are typically
eluted at an earlier retention time on a reversed phase HPLC system.
Thus, hydrophilic or polar matrices are not an assay problem for relatively
118 Using Mass Spectrometry for Drug Metabolism Studies
Copyright © 2005 CRC Press, LLC
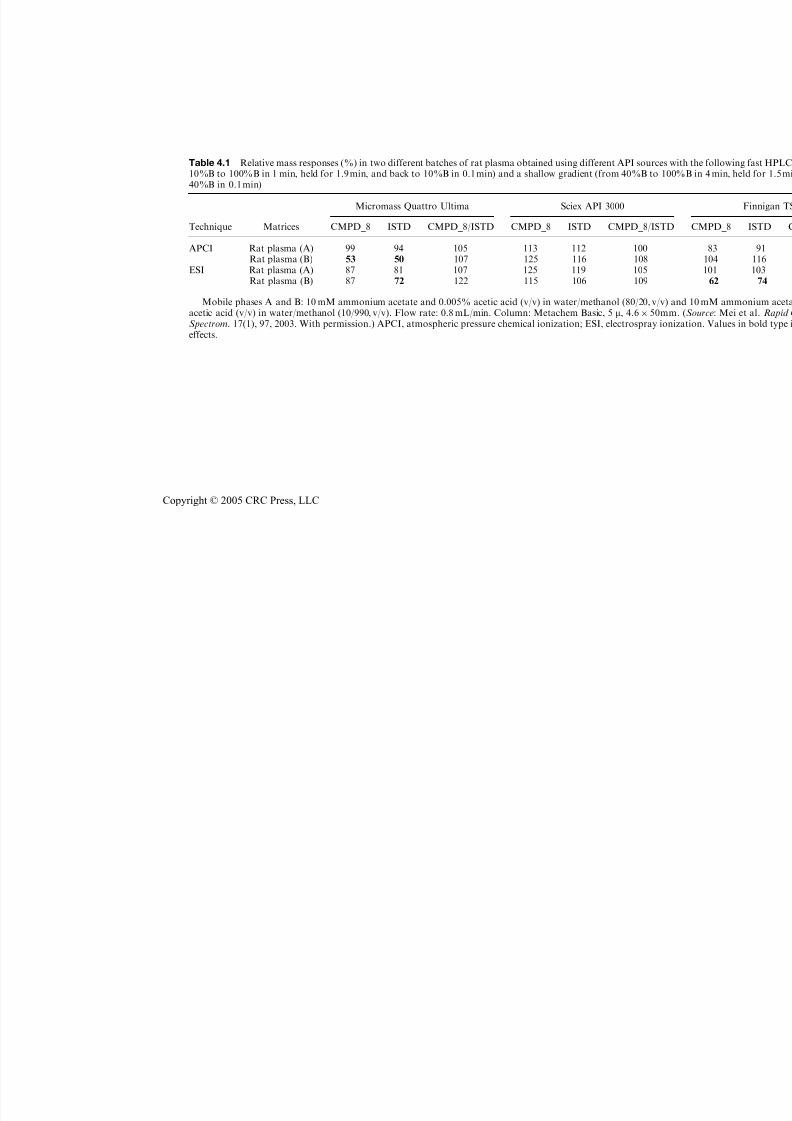
7/21/2019 Using Mass Spectrometry for Drug Metabolism Studies
http://slidepdf.com/reader/full/using-mass-spectrometry-for-drug-metabolism-studies 126/362
Table 4.1 Relative mass responses (%) in two different batches of rat plasma obtained using different API sour10%B to 100%B in 1 min, held for 1.9 min, and back to 10%B in 0.1 min) and a shallow gradient (from 40%B t40%B in 0.1 min)
Technique Matrices
Micromass Quattro Ultima Sciex API 3000
CMPD_8 ISTD CMPD_8/ISTD CMPD_8 ISTD CMPD_8/I
APCI Rat plasma (A) 99 94 105 113 112 100Rat plasma (B) 53 50 107 125 116 108
ESI Rat plasma (A) 87 81 107 125 119 105Rat plasma (B) 87 72 122 115 106 109
Mobile phases A and B: 10 mM ammonium acetate and 0.005% acetic acid (v/v) in water/methanol (80/20, vacetic acid (v/v) in water/methanol (10/990, v/v). Flow rate: 0.8 mL/min. Column: Metachem Basic, 5 m, 4.6 5Spectrom. 17(1), 97, 2003. With permission.) APCI, atmospheric pressure chemical ionization; ESI, electrospraeffects.
Copyright © 2005 CRC Press, LLC

7/21/2019 Using Mass Spectrometry for Drug Metabolism Studies
http://slidepdf.com/reader/full/using-mass-spectrometry-for-drug-metabolism-studies 127/362
Table 4.2 Relative mass responses (%) in two different batches of rat plasma obtained using different API sourto 100%B in 4 min, held for 1.5 min, and back to 40%B in 0.1 min
Technique Matrices
Micromass Quattro Ultima Sciex API 3000
CMPD_8 ISTD CMPD_8/ISTD CMPD_8 ISTD CMPD_8/I
APCI Rat Plasma (A) 206 163 127 111 110 101Rat Plasma (B) 82 69 119 106 106 100
ESI Rat Plasma (A) 114 113 101 115 110 105Rat Plasma (B) 109 109 100 108 98 110
Mobile phases A and B: 10 mM ammonium acetate and 0.005% acetic acid (v/v) in water/methanol (80/20, vacetic acid (v/v) in water/methanol (10/990, v/v). Flow rate: 0.8 mL/min. Column: Metachem Basic, 5 m, 4.6 5Spectrom. 17(1), 97, 2003. With permission.) Values in bold type indicate matrix effects.
Copyright © 2005 CRC Press, LLC
7/21/2019 Using Mass Spectrometry for Drug Metabolism Studies
http://slidepdf.com/reader/full/using-mass-spectrometry-for-drug-metabolism-studies 128/362
hydrophobic new chemical entities (NCEs). Using the post-column infusion
technique, it has been found that the majority of the problem matrices in
plasma samples are those polar components that elute at earlier retention times
on a reversed-phase HPLC system.5,47
Hydrophobic matrices that usually existin smaller amounts are often revealed as a narrow dip in the later retention
time of a reversed-phase chromatogram when using the post-column infusion
technique. For example, fatty acids and phosphatidylcholine with long carbon
chains (C16–C18) are endogenous hydrophobic matrices, which have a high
potential to co-elute with pharmaceutical compounds.38 While these types of
matrix issues are relatively challenging, they are still manageable by carefully
separating these components from analytes of interest using either various
sample preparation techniques or HPLC adjustments. The most difficult
matrix effect problems are those caused by hydrophobic components existingin relatively large amounts and with retention times that overlap the
analytes.48–50 In this situation, the chromatographic system does not provide
sufficient separation; in some cases, these matrices can also overload the
column and carry over to next injection, causing huge assay variations from
injection to injection.48 One good example of such situation is the matrix effect
caused by a polymeric material that existed in one set of samples;41 it
was demonstrated that the polymeric material was rather hydrophobic and
eluted over a wide range that overlapped with the analytes, resulting in
significant ion suppression for compounds that eluted in that part of thechromatogram.
4.2.1.7 Source of matrix effect
As opposed to the visible UV interferences, LC–MS/MS matrix effects are
often described as unknown and nonvisible.51 This characterization mystified
LC–MS/MS matrix effects and deterred our efforts in searching for their
source. If matrix effects can be described as exogenous, known, or constant as
opposed to endogenous, unknown, or variable, then they will become
manageable obstacles. The separation of large amounts of hydrophobic
matrices imposes special challenges to bioanalytical assays in the drug
discovery environment where fast turn-around time is required regardless
of whether the assay is easy or difficult. Therefore, identifying the source of
matrices becomes crucial, especially for those difficult hydrophobic matrices.
Intentionally avoiding matrices that exist in relatively large quantities is much
easier than blindly finding a way to separate them from the analytes. Some
exogenous materials such as plasticizers and anticoagulants can be present in
relatively large amounts compared to the analyte of interest and some of the
plasticizers are very strong gas phase ions. In addition, some anticoagulants,
such as Li-heparin, are strong ionizing agents, which have a high potential
to cause matrix effects. Thus, the following study was designed to identify
the possible exogenous sources of matrix effects. Compounds with a signifi-
cant hydrophobicity range which would elute at various retention times were
employed as markers for ion suppression evaluation. Rat plasma obtained
Matrix Effects: Causes and Solutions 121
Copyright © 2005 CRC Press, LLC
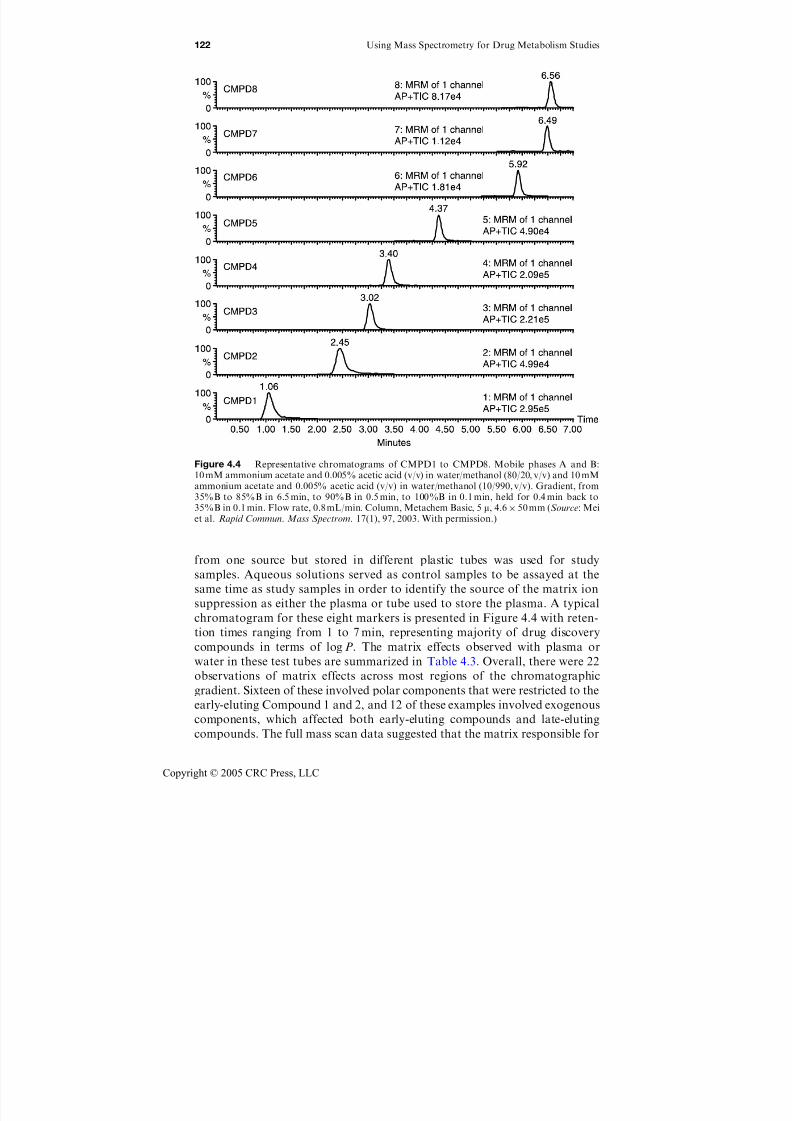
7/21/2019 Using Mass Spectrometry for Drug Metabolism Studies
http://slidepdf.com/reader/full/using-mass-spectrometry-for-drug-metabolism-studies 129/362
from one source but stored in different plastic tubes was used for study
samples. Aqueous solutions served as control samples to be assayed at the
same time as study samples in order to identify the source of the matrix ion
suppression as either the plasma or tube used to store the plasma. A typical
chromatogram for these eight markers is presented in Figure 4.4 with reten-
tion times ranging from 1 to 7 min, representing majority of drug discovery
compounds in terms of log P. The matrix effects observed with plasma or
water in these test tubes are summarized in Table 4.3. Overall, there were 22
observations of matrix effects across most regions of the chromatographic
gradient. Sixteen of these involved polar components that were restricted to the
early-eluting Compound 1 and 2, and 12 of these examples involved exogenous
components, which affected both early-eluting compounds and late-eluting
compounds. The full mass scan data suggested that the matrix responsible for
Figure 4.4 Representative chromatograms of CMPD1 to CMPD8. Mobile phases A and B:10 mM ammonium acetate and 0.005% acetic acid (v/v) in water/methanol (80/20, v/v) and 10 mMammonium acetate and 0.005% acetic acid (v/v) in water/methanol (10/990, v/v). Gradient, from35%B to 85%B in 6.5 min, to 90%B in 0.5 min, to 100%B in 0.1 min, held for 0.4 min back to
35%B in 0.1 min. Flow rate, 0.8 mL/min. Column, Metachem Basic, 5 m, 4.6 50 mm (Source: Meiet al. Rapid Commun. Mass Spectrom. 17(1), 97, 2003. With permission.)
122 Using Mass Spectrometry for Drug Metabolism Studies
Copyright © 2005 CRC Press, LLC
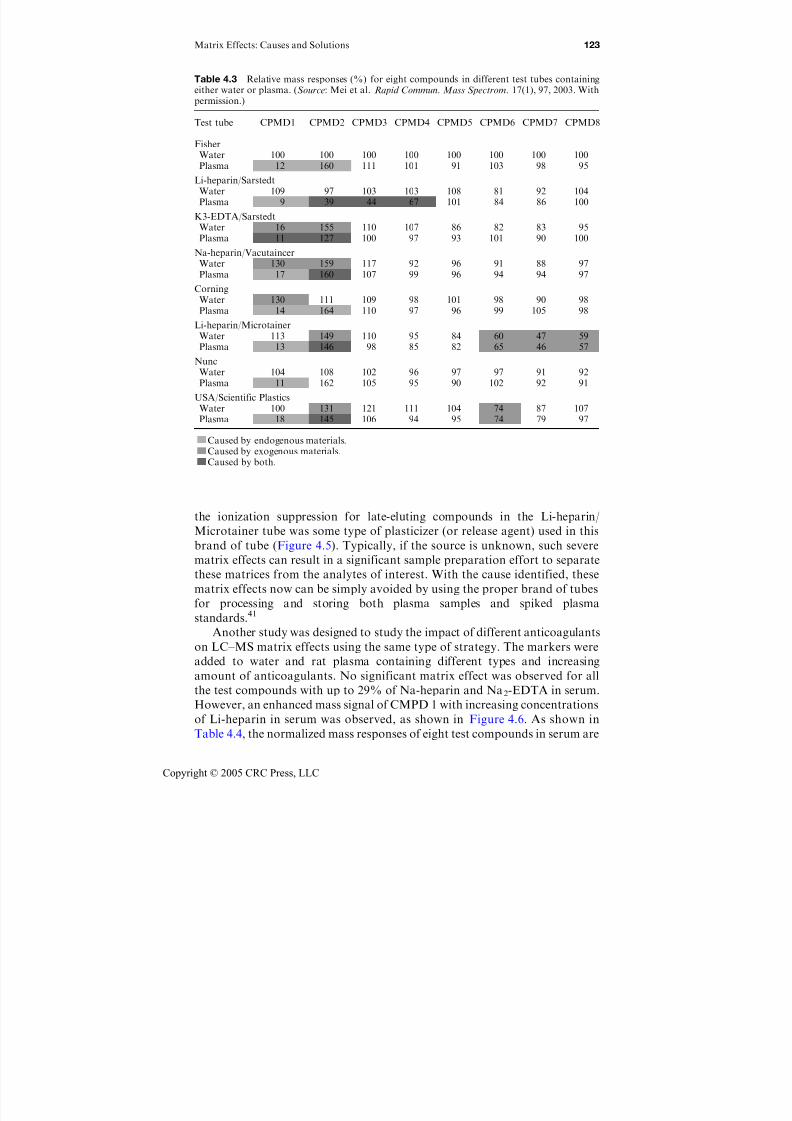
7/21/2019 Using Mass Spectrometry for Drug Metabolism Studies
http://slidepdf.com/reader/full/using-mass-spectrometry-for-drug-metabolism-studies 130/362
the ionization suppression for late-eluting compounds in the Li-heparin/
Microtainer tube was some type of plasticizer (or release agent) used in this
brand of tube (Figure 4.5). Typically, if the source is unknown, such severe
matrix effects can result in a significant sample preparation effort to separate
these matrices from the analytes of interest. With the cause identified, these
matrix effects now can be simply avoided by using the proper brand of tubes
for processing and storing both plasma samples and spiked plasma
standards.41
Another study was designed to study the impact of different anticoagulants
on LC–MS matrix effects using the same type of strategy. The markers were
added to water and rat plasma containing different types and increasing
amount of anticoagulants. No significant matrix effect was observed for all
the test compounds with up to 29% of Na-heparin and Na2-EDTA in serum.
However, an enhanced mass signal of CMPD 1 with increasing concentrations
of Li-heparin in serum was observed, as shown in Figure 4.6. As shown in
Table 4.4, the normalized mass responses of eight test compounds in serum are
Table 4.3 Relative mass responses (%) for eight compounds in different test tubes containingeither water or plasma. (Source: Mei et al. Rapid Commun. Mass Spectrom. 17(1), 97, 2003. Withpermission.)
Test tube CPMD1 CPMD2 CPMD3 CPMD4 CPMD5 CPMD6 CPMD7 CPMD8
FisherWater 100 100 100 100 100 100 100 100Plasma 12 160 111 101 91 103 98 95
Li-heparin/SarstedtWater 109 97 103 103 108 81 92 104Plasma 9 39 44 67 101 84 86 100
K3-EDTA/SarstedtWater 16 155 110 107 86 82 83 95Plasma 11 127 100 97 93 101 90 100
Na-heparin/VacutaincerWater 130 159 117 92 96 91 88 97Plasma 17 160 107 99 96 94 94 97
CorningWater 130 111 109 98 101 98 90 98Plasma 14 164 110 97 96 99 105 98
Li-heparin/MicrotainerWater 113 149 110 95 84 60 47 59Plasma 13 146 98 85 82 65 46 57
NuncWater 104 108 102 96 97 97 91 92
Plasma 11 162 105 95 90 102 92 91USA/Scientific Plastics
Water 100 131 121 111 104 74 87 107Plasma 18 145 106 94 95 74 79 97
Caused by endogenous materials.Caused by exogenous materials.Caused by both.
Matrix Effects: Causes and Solutions 123
Copyright © 2005 CRC Press, LLC
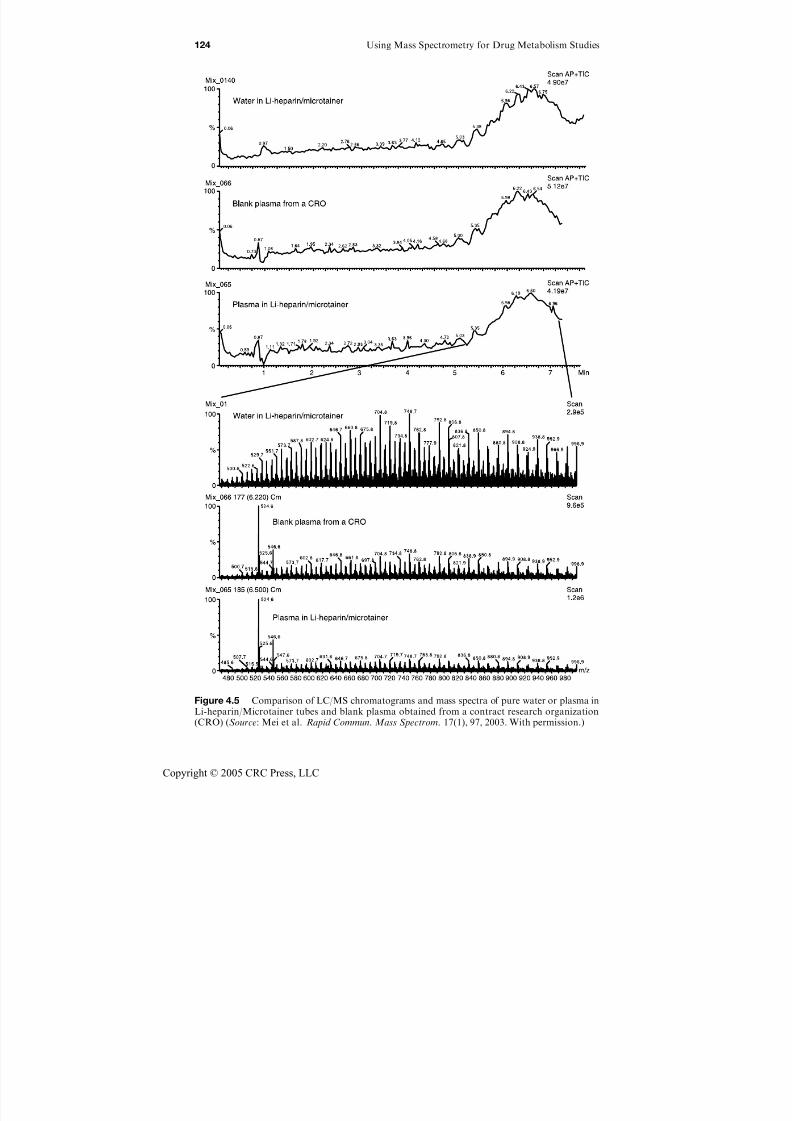
7/21/2019 Using Mass Spectrometry for Drug Metabolism Studies
http://slidepdf.com/reader/full/using-mass-spectrometry-for-drug-metabolism-studies 131/362
Figure 4.5 Comparison of LC/MS chromatograms and mass spectra of pure water or plasma inLi-heparin/Microtainer tubes and blank plasma obtained from a contract research organization(CRO) (Source: Mei et al. Rapid Commun. Mass Spectrom. 17(1), 97, 2003. With permission.)
124 Using Mass Spectrometry for Drug Metabolism Studies
Copyright © 2005 CRC Press, LLC
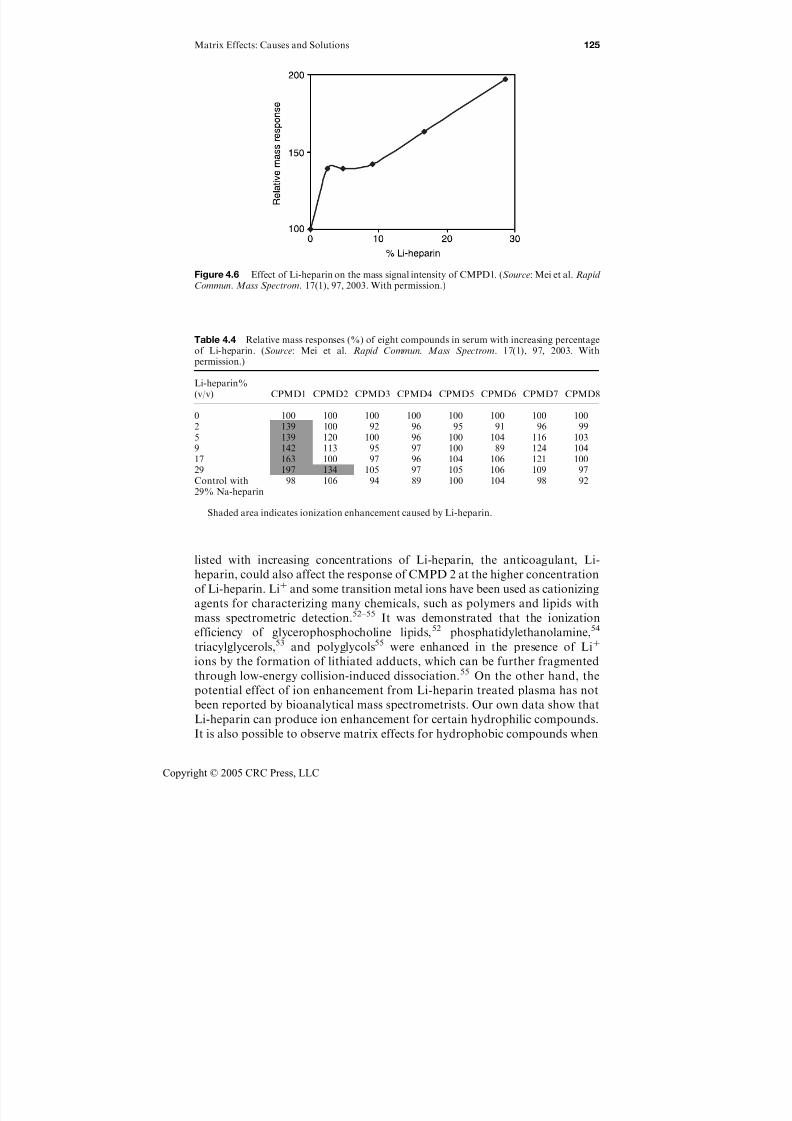
7/21/2019 Using Mass Spectrometry for Drug Metabolism Studies
http://slidepdf.com/reader/full/using-mass-spectrometry-for-drug-metabolism-studies 132/362
listed with increasing concentrations of Li-heparin, the anticoagulant, Li-
heparin, could also affect the response of CMPD 2 at the higher concentration
of Li-heparin. Liþ and some transition metal ions have been used as cationizing
agents for characterizing many chemicals, such as polymers and lipids with
mass spectrometric detection.52–55 It was demonstrated that the ionization
efficiency of glycerophosphocholine lipids,52 phosphatidylethanolamine,54
triacylglycerols,53 and polyglycols55 were enhanced in the presence of Liþ
ions by the formation of lithiated adducts, which can be further fragmented
through low-energy collision-induced dissociation.55 On the other hand, the
potential effect of ion enhancement from Li-heparin treated plasma has not
been reported by bioanalytical mass spectrometrists. Our own data show that
Li-heparin can produce ion enhancement for certain hydrophilic compounds.
It is also possible to observe matrix effects for hydrophobic compounds when
Figure 4.6 Effect of Li-heparin on the mass signal intensity of CMPD1. (Source: Mei et al. Rapid Commun. Mass Spectrom. 17(1), 97, 2003. With permission.)
Table 4.4 Relative mass responses (%) of eight compounds in serum with increasing percentageof Li-heparin. (Source: Mei et al. Rapid Commun. Mass Spectrom. 17(1), 97, 2003. Withpermission.)
Li-heparin%(v/v) CPMD1 CPMD2 CPMD3 CPMD4 CPMD5 CPMD6 CPMD7 CPMD8
0 100 100 100 100 100 100 100 1002 139 100 92 96 95 91 96 995 139 120 100 96 100 104 116 1039 142 113 95 97 100 89 124 10417 163 100 97 96 104 106 121 10029 197 134 105 97 105 106 109 97Control with29% Na-heparin
98 106 94 89 100 104 98 92
Shaded area indicates ionization enhancement caused by Li-heparin.
Matrix Effects: Causes and Solutions 125
Copyright © 2005 CRC Press, LLC
7/21/2019 Using Mass Spectrometry for Drug Metabolism Studies
http://slidepdf.com/reader/full/using-mass-spectrometry-for-drug-metabolism-studies 133/362
Liþ is present in relatively larger amounts that can overload a column.
Therefore, Li-heparin should be avoided as the anticoagulant for plasma
samples when the samples are to be assayed by HPLC–MS/MS.
Other exogenous materials that have potential matrix effects are dosingexcipients. Multiple studies have demonstrated that excipients such as PEG400,
propylene glycol, Tween 80 and even hydroxypropyl beta cyclodextrin
(HPBCD) used for either intravenous or oral formulation, can cause significant
matrix effects in both ESI and APCI modes.34,35 Another unique aspect of this
type of matrix effect is that it is variable with time, since these dosing excipients
will also undergo an absorption, distribution, and elimination process in
animals which will be reflected in the plasma samples collected at different time
points.34,35,56 Even though techniques such as appropriate sample purification
or employing negative ionization mode can diminish the problem, avoiding suchexcipients is a safer alternative.34 If one cannot avoid these dosing excipients,
then it is important to evaluate their effect, if any, on the LC–MS/MS system
that is used for assaying samples that include these excipients.
4.2.2 Evaluation of matrix effect
As discussed above, LC–MS/MS matrices can be challenging, in part, due
to their character of being unknown or unseen, as opposed to LC/UV assays
where interferences can be seen. As a result, the separation of analytes fromthose unknown matrices in LC–MS/MS assays becomes more difficult. Thus,
evaluation of matrix effects should be the first step in solving the problem.
Several approaches have been developed to evaluate the matrix effects using
different experimental techniques and each has its own advantages and
disadvantages.
4.2.2.1 Post-column infusion
In order to directly observe the location of ionization suppression in an LC–
MS/MS assay, Bonfiglio and colleagues51 developed a post-column infusion
scheme that has been widely adopted by many laboratories. In this scheme,
as presented in Figure 4.7, blank sample extracts are injected on the HPLC
column under conditions chosen for the assay while a constant amount of
analyte is infused into the HPLC stream before it enters the mass spectrometer.
Ion suppression caused by matrices is shown as the variation of MS response of
the infused analyte, as compared to the response from the injection of blank
mobile phase. This approach was successfully employed to detect potential
matrix inconsistencies between assay samples and standard samples in drug
discovery studies,5 to demonstrate that a minibore column coupled with a fast
gradient is very efficient for separating endogenous polar matrices from
analytes,47 and to study matrix effects caused by dosing excipients.35 It
has been recommended that one should run the same test two or three times to
ensure that late eluting matrix components will not interfere with subse-
quent injections.5 Even though this method has the advantage of showing
126 Using Mass Spectrometry for Drug Metabolism Studies
Copyright © 2005 CRC Press, LLC
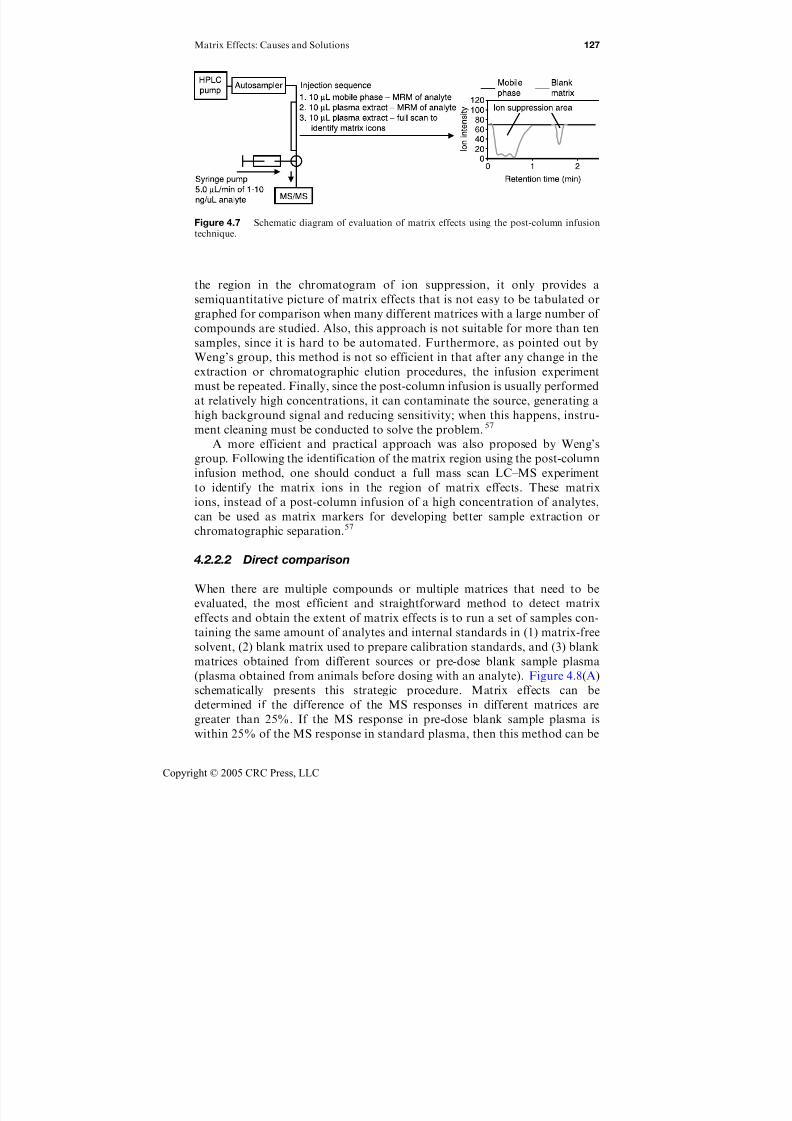
7/21/2019 Using Mass Spectrometry for Drug Metabolism Studies
http://slidepdf.com/reader/full/using-mass-spectrometry-for-drug-metabolism-studies 134/362
the region in the chromatogram of ion suppression, it only provides a
semiquantitative picture of matrix effects that is not easy to be tabulated or
graphed for comparison when many different matrices with a large number of
compounds are studied. Also, this approach is not suitable for more than ten
samples, since it is hard to be automated. Furthermore, as pointed out by
Weng’s group, this method is not so efficient in that after any change in the
extraction or chromatographic elution procedures, the infusion experiment
must be repeated. Finally, since the post-column infusion is usually performedat relatively high concentrations, it can contaminate the source, generating a
high background signal and reducing sensitivity; when this happens, instru-
ment cleaning must be conducted to solve the problem.57
A more efficient and practical approach was also proposed by Weng’s
group. Following the identification of the matrix region using the post-column
infusion method, one should conduct a full mass scan LC–MS experiment
to identify the matrix ions in the region of matrix effects. These matrix
ions, instead of a post-column infusion of a high concentration of analytes,
can be used as matrix markers for developing better sample extraction or
chromatographic separation.57
4.2.2.2 Direct comparison
When there are multiple compounds or multiple matrices that need to be
evaluated, the most efficient and straightforward method to detect matrix
effects and obtain the extent of matrix effects is to run a set of samples con-
taining the same amount of analytes and internal standards in (1) matrix-free
solvent, (2) blank matrix used to prepare calibration standards, and (3) blank
matrices obtained from different sources or pre-dose blank sample plasma
(plasma obtained from animals before dosing with an analyte). Figure 4.8(A)
schematically presents this strategic procedure. Matrix effects can be
determined if the difference of the MS responses in different matrices are
greater than 25%. If the MS response in pre-dose blank sample plasma is
within 25% of the MS response in standard plasma, then this method can be
Figure 4.7 Schematic diagram of evaluation of matrix effects using the post-column infusiontechnique.
Matrix Effects: Causes and Solutions 127
Copyright © 2005 CRC Press, LLC

7/21/2019 Using Mass Spectrometry for Drug Metabolism Studies
http://slidepdf.com/reader/full/using-mass-spectrometry-for-drug-metabolism-studies 135/362
used for quantitation in drug discovery studies. For example, this method was
efficiently utilized to compare the matrix effects among three different tandem
mass spectrometers and to investigate the endogenous and exogenous sources
of matrix effects (vide supra).41
Another use for this method is to simultaneously compare the effectiveness
of different internal standards in correcting matrix effects and to compare the
efficiency of different sample cleaning procedures in removing matrices from
plasma obtained from multiple lots and different species, thus speeding up
method development.58 Large amounts of data can be easily graphed to
facilitate the decision making process. This method can also be modified with
Figure 4.8 (A) Schematic diagram of evaluation of matrix effects using direct comparison—pre-spiking approach. (B) Schematic diagram of evaluation of matrix effects using direct comparison— post-spiking approach.
128 Using Mass Spectrometry for Drug Metabolism Studies
Copyright © 2005 CRC Press, LLC
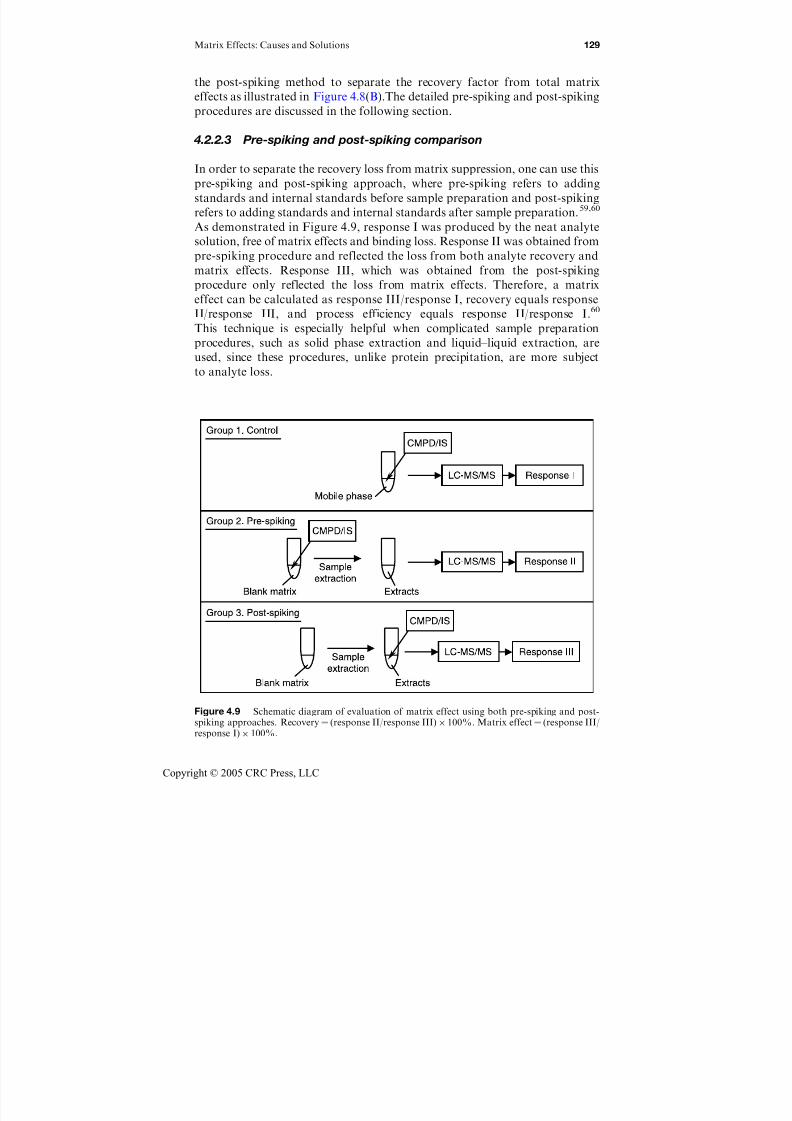
7/21/2019 Using Mass Spectrometry for Drug Metabolism Studies
http://slidepdf.com/reader/full/using-mass-spectrometry-for-drug-metabolism-studies 136/362
the post-spiking method to separate the recovery factor from total matrix
effects as illustrated in Figure 4.8(B).The detailed pre-spiking and post-spiking
procedures are discussed in the following section.
4.2.2.3 Pre-spiking and post-spiking comparison
In order to separate the recovery loss from matrix suppression, one can use this
pre-spiking and post-spiking approach, where pre-spiking refers to adding
standards and internal standards before sample preparation and post-spiking
refers to adding standards and internal standards after sample preparation.59,60
As demonstrated in Figure 4.9, response I was produced by the neat analyte
solution, free of matrix effects and binding loss. Response II was obtained from
pre-spiking procedure and reflected the loss from both analyte recovery andmatrix effects. Response III, which was obtained from the post-spiking
procedure only reflected the loss from matrix effects. Therefore, a matrix
effect can be calculated as response III/response I, recovery equals response
II/response III, and process efficiency equals response II/response I.60
This technique is especially helpful when complicated sample preparation
procedures, such as solid phase extraction and liquid–liquid extraction, are
used, since these procedures, unlike protein precipitation, are more subject
to analyte loss.
Figure 4.9 Schematic diagram of evaluation of matrix effect using both pre-spiking and post-spiking approaches. Recovery ¼ (response II/response III) 100%. Matrix effect ¼ (response III/response I) 100%.
Matrix Effects: Causes and Solutions 129
Copyright © 2005 CRC Press, LLC
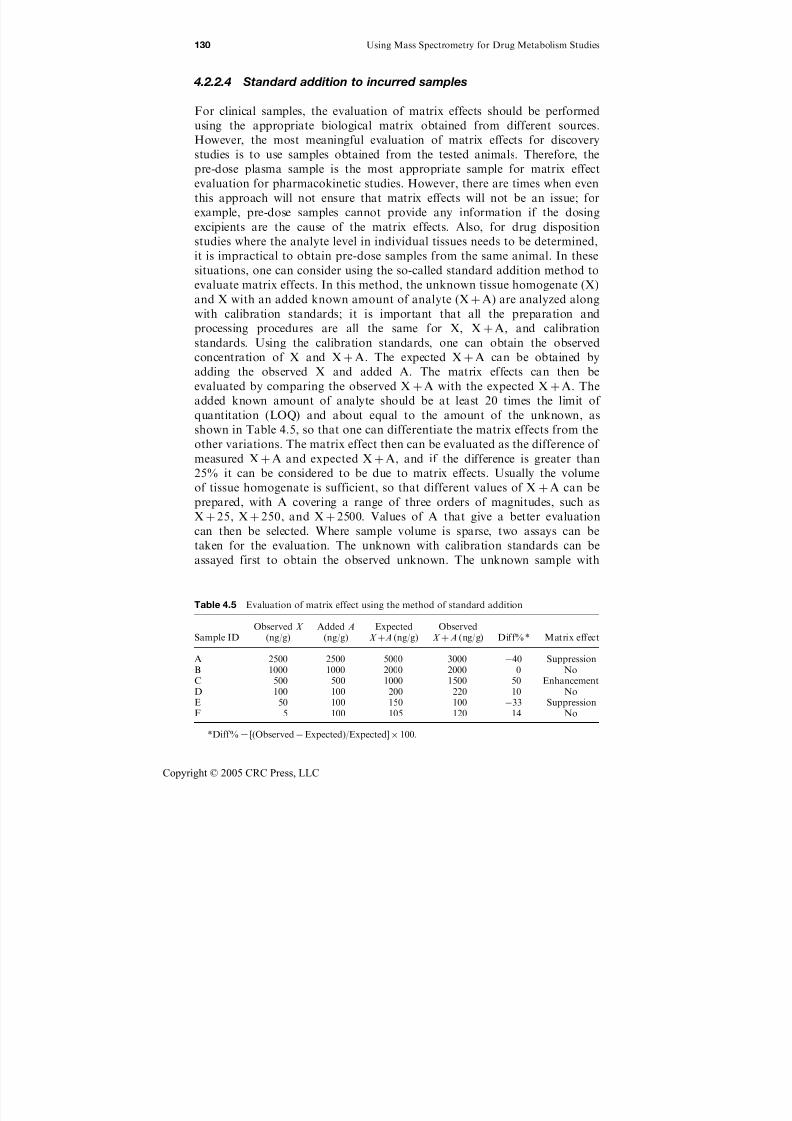
7/21/2019 Using Mass Spectrometry for Drug Metabolism Studies
http://slidepdf.com/reader/full/using-mass-spectrometry-for-drug-metabolism-studies 137/362
4.2.2.4 Standard addition to incurred samples
For clinical samples, the evaluation of matrix effects should be performed
using the appropriate biological matrix obtained from different sources.However, the most meaningful evaluation of matrix effects for discovery
studies is to use samples obtained from the tested animals. Therefore, the
pre-dose plasma sample is the most appropriate sample for matrix effect
evaluation for pharmacokinetic studies. However, there are times when even
this approach will not ensure that matrix effects will not be an issue; for
example, pre-dose samples cannot provide any information if the dosing
excipients are the cause of the matrix effects. Also, for drug disposition
studies where the analyte level in individual tissues needs to be determined,
it is impractical to obtain pre-dose samples from the same animal. In thesesituations, one can consider using the so-called standard addition method to
evaluate matrix effects. In this method, the unknown tissue homogenate (X)
and X with an added known amount of analyte (X þ A) are analyzed along
with calibration standards; it is important that all the preparation and
processing procedures are all the same for X, X þ A, and calibration
standards. Using the calibration standards, one can obtain the observed
concentration of X and X þ A. The expected X þ A can be obtained by
adding the observed X and added A. The matrix effects can then be
evaluated by comparing the observed X þ A with the expected X þ A. Theadded known amount of analyte should be at least 20 times the limit of
quantitation (LOQ) and about equal to the amount of the unknown, as
shown in Table 4.5, so that one can differentiate the matrix effects from the
other variations. The matrix effect then can be evaluated as the difference of
measured X þ A and expected X þ A, and if the difference is greater than
25% it can be considered to be due to matrix effects. Usually the volume
of tissue homogenate is sufficient, so that different values of X þ A can be
prepared, with A covering a range of three orders of magnitudes, such as
X þ 25, X þ 250, and X þ 2500. Values of A that give a better evaluation
can then be selected. Where sample volume is sparse, two assays can be
taken for the evaluation. The unknown with calibration standards can be
assayed first to obtain the observed unknown. The unknown sample with
Table 4.5 Evaluation of matrix effect using the method of standard addition
Sample ID
Observed X
(ng/g)
Added A
(ng/g)
Expected
X þA (ng/g)
Observed
X þ A (ng/g) Diff%* Matrix effect
A 2500 2500 5000 3000 40 SuppressionB 1000 1000 2000 2000 0 NoC 500 500 1000 1500 50 EnhancementD 100 100 200 220 10 NoE 50 100 150 100 33 SuppressionF 5 100 105 120 14 No
*Diff% ¼ [(Observed Expected)/Expected] 100.
130 Using Mass Spectrometry for Drug Metabolism Studies
Copyright © 2005 CRC Press, LLC

7/21/2019 Using Mass Spectrometry for Drug Metabolism Studies
http://slidepdf.com/reader/full/using-mass-spectrometry-for-drug-metabolism-studies 138/362
added analyte can be assayed during a second run. Using this procedure, it
is possible to not only evaluate the extent of the matrix effects, but also
obtain the correct analytical results at the same time (see Section 4.3.10).
4.3 Current strategies for overcoming matrix effects
4.3.1 Introducing the minimum amount of sample
The extent of the matrix effect is dependent on the amount of matrices in the
injected sample. Specifically, the observed ion suppression is proportional to
the amount of matrices in the sample that enters the ion source at the same
time as the analyte. As shown in Figure 4.10, when the volume of the injectedsample that is free of matrix interference is increased, an almost linear response
was observed; however, with the increase in volume of a protein-precipitated
plasma sample, the response did not increase, instead the response showed
a saturation tendency. In other words, increasing the injection volume of
processed biological samples does not necessarily guarantee an increase of
analyte response. The increasing amount of interfering matrices might compete
with the analytes for ionization, and limit the maximum response for the
analyte. In one report, it was noted that at the sample injection volume of 5 mL,
ion enhancement was observed while at an injection volume of 20mL, ionsuppression was observed.38. The same phenomenon has been observed in our
laboratory for some compounds; one example of this is shown in Figure 4.10.
One possible mechanism proposed by Enke’s group might explain this
phenomenon; at a low injection volume, the electrolyte content of the matrices
increased the ion conductivity and thus increased the amount of excess charge,
resulting in ion enhancement. However, with the increased sample volume, a
further increase of electrolyte would cause a loss in the ion transfer efficiency
Figure 4.10 Effect of injection volume of protein precipitated plasma on the mass responsesof caffeine.
Matrix Effects: Causes and Solutions 131
Copyright © 2005 CRC Press, LLC

7/21/2019 Using Mass Spectrometry for Drug Metabolism Studies
http://slidepdf.com/reader/full/using-mass-spectrometry-for-drug-metabolism-studies 139/362
( p) or desolvation efficiency ( f ) and the effect could be greater than the
enhancement caused by the increased excess charge, resulting in a reduced or
saturated analyte response.15 Therefore, we recommend introducing minimum
amount of sample in order to avoid ion suppression problems. With the recentimprovement in the sensitivity in the new generation of tandem mass
spectrometers made by different vendors, introducing more diluted or
lower volume of sample is an achievable approach, and this should be the
first step to reduce the chance for having matrix ionization suppression
problems.
4.3.2 Minimizing the build-up of nonvolatile material in the
ionization source
As many studies have shown, ion suppression can be caused by nonvolatile
components. The accumulation of nonvolatile material on the ion source
interface plate will increase the electrical resistance and therefore will reduce
the ion flow (I) at the applied voltage of same value and decrease the ESI signal
intensity. At the worst, salt deposits on the metal surfaces can even result
in a complete loss of ion transmission. Therefore, minimizing the build-up
of nonvolatile materials will help to maintain the instrument’s sensitivity.
Approaches such as employing a divert valve, which only delivers the portion
that contains the analytes into the MS while diverting the unwanted eluate towaste, or using a splitting device, which splits an appropriate amount of
eluate into mass spectrometer and sends the rest to waste, or injecting the
minimum volume of sample and cleaning the interface plate on a regular basis
can all be very effective techniques for maintaining the sensitivity of the
instrument.
4.3.3 Avoiding exogenous matrices
Knowing the details about the collection of bioanalytical samples can be
crucial for obtaining reliable bioanalytical results, as we have stated, exogenous
material such as plasticizers, Li-heparin or dosing excipients can be the cause of
significant matrix effects. Therefore, it is strongly recommended that detailed
information about sample collection should be obtained in order to avoid
potential exogenous matrix effects. The same brand of tubes should be used for
processing and storing both spiked plasma standards and unknown plasma
samples. The plastic tubes or 96-well plates should be pre-tested to determine
their potential for matrix effects before adopting a brand for routine use in
the laboratory. Li-heparin should be avoided for the samples to be quantified
using an LC–MS-MS assay. If PEG400 has to be used as the dosing excipient,
additional steps need be carried out to ensure that it does not cause any
interference. Detailed methods for dealing with matrix effects, such as using
good chromatographic separation, solid phase extraction, or liquid–liquid
extraction have been described and compared in the studies by Tong et al.34
and Shou et al.35
132 Using Mass Spectrometry for Drug Metabolism Studies
Copyright © 2005 CRC Press, LLC

7/21/2019 Using Mass Spectrometry for Drug Metabolism Studies
http://slidepdf.com/reader/full/using-mass-spectrometry-for-drug-metabolism-studies 140/362
4.3.4 Application of internal standards
The rationale for using an internal standard (IS) to correct for matrix effects
is based on the assumption that it will experience the same extent of ionsuppression or ion enhancement as the analyte. Therefore, under this rationale,
even though the MS response of an analyte can be enhanced or suppressed, and
the response ratio (response of analyte divided by the response of the IS) will stay
the same. In many situations, especially when using an isotope-labeled analyte
for the IS, this assumption is true. However, an isotope-labeled IS is usually
unavailable for assays in the drug discovery stage. Often internal standards that
we use are analogs of the analytes, but they can differ from the analytes in terms
of their log P and pK a. Furthermore, recent studies have shown that the IS can
sometimes interfere with the signal of analyte or vice versa via cross-talk orionization competition.61,62 Even co-eluting compounds as the IS sometimes
cannot correct for the matrix effect if they have a different pK a to the analyte. As
shown in Table 4.6, phenylpropanolamine (PPA) and pseudoephedrine (PSE)
were spiked into a rat plasma sample and they eluted at same time on the HPLC
system when the extracted sample was injected, but only PSE experienced ion
suppression. Therefore, the use of an IS cannot always guarantee the correction
of matrix effects. Careful studies need to be carried out to select a good IS with a
matched pK a and log P and appropriate concentration level, which sometimes is
impractical for drug discovery studies.
4.3.5 Preparing standards or quality control samples using the
pre-dose samples
By using blank plasma obtained from the same animal that was dosed by the
test compounds or blank plasma from the same batch of animals to prepare
calibration standards, the matrix difference between the calibration standards
and the samples can almost be eliminated, except for the matrix effects caused
by dosing excipients. If there is not enough pre-dose blank plasma for making
the calibration curve, quality control (QC) samples from the pre-dose plasma
can be prepared. Matrix effects can be corrected with the information provided
by QC samples at different levels. For example, if consistent matrix effects were
observed for QC samples at different levels, then a constant correction factor
could be used to correct the matrix effects.
Table 4.6 Relative mass responses of pseudoephedrine (PSE) and phenylpropanolamine (PPA) atthe same retention time of 0.7 min in pure water or protein precipitated plasma
Drug Water Plasma Plasma w/PEG400
PPA 100 92 101PSE 100 83 58
Shaded area indicates ionization suppresion.
Matrix Effects: Causes and Solutions 133
Copyright © 2005 CRC Press, LLC
7/21/2019 Using Mass Spectrometry for Drug Metabolism Studies
http://slidepdf.com/reader/full/using-mass-spectrometry-for-drug-metabolism-studies 141/362
4.3.6 Diluting samples with blank standard plasma
When sensitivity is not an issue, the differences in the matrix between standards
and samples can be reduced by diluting samples with blank standard plasma(plasma used to prepare calibration standards). Our laboratory has been using
this method to analyze samples with high concentrations; this technique is well
suited for rising dose pharmacokinetic studies. This approach was also found
effective for overcoming the matrix effects that can be caused by PEG400 being
used in the dosing formulation.37
4.3.7 Post-column addition of signal-enhancing agents
Ionization suppression caused by the high concentration of electrolytes canbe reduced by the addition of so-called signal-enhancing agents. A high
concentration of electrolytes can change surface tension and modify the
volatility of the sprayed solution; this can lead to the formation of larger final
droplets containing higher percentages of water and electrolytes. Furthermore,
some electrolytes can form strong ion pairs with analytes, preventing analytes
from partitioning to the droplet surface. Therefore, ionization suppression can
be reduced by adding some modifying agents that either change the surface
tension or volatility of the sprayed solution in favor of formation of analyte gas
ions or reducing the ion pairing of analytes.If only lowering surface tension is needed, then post-column addition
(PCA) of surface tension lowering agents, such as methanol, 2-propanol or
acetonitrile can be very effective.2,43,63 The ratio of mobile phase flow rate
to the flow rate of the PCA agents can be easily optimized. With these con-
ventional surface tension lowering agents, the signal can be enhanced 3–16-fold
depending on analytes and methods of sample preparation.2,62 However, these
agents also have a higher volatility than water and most electrolytes and,
therefore, they will evaporate earlier and leave more electrolytes in the final
droplets, thus further reducing the ionization suppression caused by ion
competitions requires additional properties of these agents, such as an
optimized volatility and pK a value.30
The most famous solution for improving the signal of a strong base in a
TFA-containing mobile phase is to employ a mixture containing both
propionic acid and 2-propanol. Propionic acid is a weak acid with an optimum
volatility. Propionic acid has a volatility lower than TFA which leads to the
earlier evaporation of TFA from the droplets, thus replacing strong analyte/
TFA pairs with weak analyte/propionic acid pairs that release the analyte ion
to the gas phase. If the weak acid is too volatile, such as acetic acid, then TFA
will still strongly ion pair with the analyte causing ionization suppression.
Unlike other weak acids, such as valeric acid, propionic acid still has sufficient
volatility to prevent it from causing rapid desolvation of the droplets.30
For improving the signal of acids in negative ESI, 2-(2-methoxyethoxy)-
ethanol (2-MEE) is a good choice.64,65 One or two of the following additives:
formic acid, ammonium formate, acetic acid, and ammonium acetate, is
134 Using Mass Spectrometry for Drug Metabolism Studies
Copyright © 2005 CRC Press, LLC

7/21/2019 Using Mass Spectrometry for Drug Metabolism Studies
http://slidepdf.com/reader/full/using-mass-spectrometry-for-drug-metabolism-studies 142/362
usually added to the mobile phases for improving the retention time and peak
shape. The ion suppression in this condition is caused by high surface tension
and ion competition between the analyte and co-eluting electrolytes, such as
(AcO
), in the mobile phase. The ionization suppression usually gets worsewith the increase of these additives.66 Conventional surface tension lowering
agents, such as methanol or acetonitrile, can only improve the part of the
problem that is caused by high surface tension, while 2-MEE not only can
improve the signal by lowering the surface tension, but can also improve the
signal by reducing the AcO concentration in the final droplet. This is
because 2-MEE is a surface tension lowering agent with optimal volatility
properties; it has a boiling point of 193C, higher than that of water (100C)
and acetic acid (118C). Therefore, water and AcO will be evaporated
earlier than 2-MEE in the ESI spray formation. In this way, the final dropletwill be smaller and contain more 2-MEE and a lower percentage of water
and AcO.64
Even though the post-column addition approach is quite effective in
reducing the ionization suppression problem, it is mostly applicable for
metabolite identification type studies where usually a small number of samples
are to be analyzed. For quantification of a large number of samples, one
can try to add these modifiers to the mobile phases as described in the
following section.
4.3.8 Modifying the mobile phase
The ideal mobile phases for ESI are those with an optimum surface tension
that facilitates the generation of a stable spray.67 For positive mode, the most
popular mobile phases are methanol/water or acetonitrile/water or methanol/
acetonitrile/water with a weak acid (such as acetic or formic) added to the
solution at the concentration range from 0.005% to 0.05%, or with a weak
acid buffer (such as formic acid–ammonium formate or acetic acid–ammonium
acetate). The low pH of such mobile phases can facilitate the protonation
of analytes with basic functional groups. The neutral salts (ammonium
formate or acetic acid–ammonium acetate) are useful for facilitating the
ionization of polar or neutral analytes through adduct formation. However,
some strong bases will have very short HPLC retention times or exhibit peak
tailing and may need further additives for chromatographic improvement
reasons.
TFA is a commonly used additive in HPLC for reducing the peak tailing of
basic compounds on silica-based columns. However, TFA is also notorious for
its ionization suppression of the ESI signal for basic compounds. As stated
above, post-column addition of propionic acid is an effective way to reduce
the ion suppression caused by TFA. Based on the mechanism of reducing
ionization suppression by adding propionic acid post-column, one can
reasonably assume that adding propoinic acid directly to a mobile phase
should also work. Propionic acid is a weaker acid than TFA; when they
co-exist in mobile phase, it is a very weak competitor of TFA; for ion pairing
Matrix Effects: Causes and Solutions 135
Copyright © 2005 CRC Press, LLC

7/21/2019 Using Mass Spectrometry for Drug Metabolism Studies
http://slidepdf.com/reader/full/using-mass-spectrometry-for-drug-metabolism-studies 143/362
with the analyte, therefore it should not affect the chromatographic peak
shape of the analyte. However, when the driving force for evaporation of TFA
is introduced in the electrospray process, the mass action will make propionic
acid a good competitor of TFA for ion pairing with the analyte. It has beenshown that by adding propionic acid (0.1 to 0.5%) propionic acid directly to
mobile phases containing either 0.025% or 0.05% TFA, ESI sensitivity
improved by 2–5 fold for basic compounds such as sildenafil, fluconazole,
nicotine, midazolam, and isoniazid.68 For negative ionization mode LC–ESI–
MS assays, it is necessary to use a solvent that creates stable anions. The
mixture of halogenated solvents with methanol is a very good system for
analysis of oligonucleotides in the negative mode, due to the fact that
halogenated solvents can form stable anions through electrochemical reduction
processes.67
Examples of these mixtures that have been reported arehexafluoroisopropanol with methanol69,70 and 2,2,2-trifluoroethanol with
methanol.67
4.3.9 Separation of matrices and analytes by sample preparation
The most common means of obtaining maximum sensitivity and signal
reproducibility is through comprehensive sample clean-up and purification,
even though sometimes it can be very time consuming. The commonly used
procedures are protein precipitation (PPT), liquid–liquid phase extraction(LLE) and solid phase extraction (SPE).
For drug discovery studies, where a large number of compounds need to be
assayed with a relatively small number of samples per study, it is not practical
to develop a unique sample preparation procedure for each compound using
SPE or LLE. Thus, PPT has become the main methodology for plasma sample
preparation due to its simplicity and universality for almost all small
molecules. PPT can be easily automated or semi-automated using a robotic
liquid handler and 96-well plates, and it has been implemented in many
pharmaceutical companies for drug discovery bioanalytical applications.71–74
Studies were conducted to optimize the PPT procedure based on effectiveness
of protein removal and matrix effects in LC–MS.75 It was found that the most
efficient protein precipitants for protein removal were zinc sulfate, acetonitrile,
and trichloroacetic acid. These precipitants all have excellent protein
precipitation reproducibility.75 However, using either acids or zinc sulfate as
precipitants may cause potential degradation of analytes or hydrolysis of some
conjugates such as glucuronides and sulfates, while organic precipitants usually
will not cause degradations and they are usually compatible with mobile
phases. Furthermore, acetonitrile precipitation generally has the lowest
ionization suppression potential.75 Due to all these reasons, acetonitrile has
become the most common precipitant for LC–MS assays for small molecules.
Even though the PPT approach only removes the protein and leaves behind
other matrices from the sample, HPLC usually can provide a satisfactory
separation of the analyte and most of the problematic matrices. It has been
shown that through a wise selection of the HPLC column in terms of size and
136 Using Mass Spectrometry for Drug Metabolism Studies
Copyright © 2005 CRC Press, LLC
7/21/2019 Using Mass Spectrometry for Drug Metabolism Studies
http://slidepdf.com/reader/full/using-mass-spectrometry-for-drug-metabolism-studies 144/362
separation mode, HPLC can be very efficient and effective in removing the
polar matrices.47
For drug development applications where high quality results are required
for a small number of compounds with a large number of samples per study,developing a specific sample preparation method is more common; in this
case, SPE and LLE are widely utilized techniques. SPE is probably the most
popular technique owing to its ease of automation76 and to the availability
of a wide variety of commercial sorbent materials.77,78 The advantages of
sample preparation by SPE include the removal of nonvolatile salts and the
attainment of a relatively clean extract with reduced amounts of potentially
interfering matrix components. The selectivity of SPE is usually achieved by
choosing or mixing appropriate sorbents and designing an effective washing
and elution scheme. All these can be achieved at the expense of time andexperience. Several papers have details on how to select sorbents and how
to design elution schemes to achieve separation for various analytes with
different properties.76–85
Automated SPE can be achieved by either using an on-line column
switching format or an off-line 96-well format. Generally speaking, the parallel
format (e.g., 96-well format) has a much higher throughput than the serial
format and is more suitable for large studies; however, with the serial format,
it may be easier to achieve complete automation without human intervention.
The fastest parallel processing system can achieve speeds of up to 400 samplesper hour.82
There are also various on-line extraction techniques using direct injection
of plasma (for more on this topic, see Chapter 5); some examples include
restricted access media (RAM),86 turbulent flow chromatography,87–89 molec-
ularly imprinted polymer extraction,90 and on-line solid phase extraction.
RAM columns are columns made of a hydrophilic external surface and a
hydrophobic internal surface in silica particles with controlled pore sizes. The
separation of small molecules from biological matrices is achieved by the
combination of size-exclusion and partition chromatograph. A limitation
associated with this approach is the relatively long run times (5–15 min) and
the potential sample instability in biological fluids. Its effectiveness in
removing the protein and other matrices is similar to using PTT coupled with
HPLC.91
Turbulent flow chromatography is another direct-injection sample prepara-
tion technique. In this method, the separation of small molecules from large
molecules and polar matrices is obtained by nonlaminar flow of the mobile
phase through use of large particles (50 mm) for the stationary phase. Further
separation of analytes from other components can be achieved with column
switching to an analytical column. With the demand for higher throughput,
generic turbulent flow chromatography was developed for routinely removing
protein and polar matrices from biological samples;88,89 if the washing
protocol, including both acidic and basic wash,85 is followed even more
matrix components can be removed from the sample. By adding on-line
dilution of the eluate, optimal usage of switching valves and dual extraction
Matrix Effects: Causes and Solutions 137
Copyright © 2005 CRC Press, LLC
7/21/2019 Using Mass Spectrometry for Drug Metabolism Studies
http://slidepdf.com/reader/full/using-mass-spectrometry-for-drug-metabolism-studies 145/362
column procedures, the problems of peak fronting or tailing, variable recovery,
and high carryover can be dramatically reduced.89
Molecularly imprinted polymer (MIP) extraction is a very selective cleaning
procedure for analytes. The custom made MIP will only retain the componentswith the same steric and chemical properties as the analytes, therefore the
matrix components can be completely and efficiently removed. The key step of
this approach is the preparation of steric and chemical molecular imprints by
polymeriazation of functional and cross-linking monomer in the presence
of a templating ligand, or imprint species.90 Even though there are reports of
successful applications in bioanalysis,92,93 issues of template bleeding, peak
broadening and tailing due to strong nonspecific adsorption to the polymer still
need to be solved. Therefore, the wide application of this technique depends on
its commercial availability and a better understanding of this technique byapplication scientists.
One of the more popular on-line solid phase extraction apparatus is the
Prospeckt system. Its popularity is due to its incorporation of single-time use
solid phase extraction cartridges that elute directly into the HPLC system via
three switching valves, which not only provide cleaner samples but also
eliminate carry-over issues.76,94 The separation power of this system can be
enhanced by coupling columns with different separation modes, resulting in the
so-called two dimensional or multi-dimensional LC.48,50 The 96-well format
solid phase extraction system is perhaps the most suitable method forprocessing a large number of samples.82,95 The recent development of a 96-well
format with a small bed volume of the membrane features reduced back
pressures, eliminated bed channeling, increased sample capacity, and improved
repeatability and reproducibility; this system also provides mixed separation
modes and a reduced eluate volume and has made SPE even more attractive for
many users.96–98
The routine strategy for SPE is to retain the analyte and wash out
the interfering compounds. Recently, a reversed approach was proposed to
effectively remove basic matrices by retaining the matrices using strong cation
exchange (SCX) while washing out analytes.99 This is most applicable for
bioassays of multiple analytes, since in this situation the highly specific
extraction is unlikely to be successful for all analytes. In this process, the
plasma sample was first basified and deproteinated by using acetonitrile
containing ammonium hydroxide followed by the separation using SCX. It was
found that recovery for most compounds that have pK a<8 was satisfactory
(>74%).99
Liquid–liquid extraction is believed to be a highly selective sample
preparation method that provides extracts that show the least amount of ion
suppression, thereby allowing for reproducible and accurate LC–MS/MS
analysis. LLE gained popularity when semi-automated100–103 and automated
LLE104 with 96-well format became commercially available. It has been
reported that the extraction efficiency in these small tubes can be improved by
using small inert particles with an average diameter of 1 mm to increase the
extraction surface.104,105
138 Using Mass Spectrometry for Drug Metabolism Studies
Copyright © 2005 CRC Press, LLC

7/21/2019 Using Mass Spectrometry for Drug Metabolism Studies
http://slidepdf.com/reader/full/using-mass-spectrometry-for-drug-metabolism-studies 146/362
4.3.10 Standard addition method
If finding an effective sample preparation method with appropriate internal
standards is too time-consuming, the standard addition method to correct formatrix effects can be tried. This method requires at least two LC–MS/MS
assays—the first with the unknown sample (X) and the second with the
unknown sample spiked with a known amount of standard (X þ A). If the mass
response is linear between unknown sample (RX) and spiked unknown sample
(RXþA), the following relationship can be established as shown in Figure 4.11,
from which the concentration of analyte in unknown sample (X) can be
calculated.
XRX
¼ ðX þ AÞ XRXþA RX
) X ¼ AðRXÞRXþA RX
: ð4:13Þ
This method is extremely suitable for analyzing a small number of tissue
samples, where sample volume is sufficient for preparation of multiple com-
binations of X þ A. In this situation, if linear response range could be
established with all the XþAs, one might not need to prepare a calibration
curve. As described in the section on matrix evaluation using standard
addition, if one can prepare multiple combinations of X þ A, then only one run
will be sufficient. The most appropriate A can be chosen; in other words, the
X þ A that still has an MS response in the linear range, but has a sufficient
difference from the response of X to allow for the calculation to be accurate.
This method was successfully used to quantify toxins in scallops where the
degree of signal suppression varied from scallop to scallop.106
Our laboratory has used this method to analyze brain tissue samples, where
hydrophobic matrix effects are usually more severe than in plasma samples
and can vary from animal to animal. With only limited sample preparation, the
Figure 4.11 Relationship between X and X þ A for the method of standard addition.
Matrix Effects: Causes and Solutions 139
Copyright © 2005 CRC Press, LLC
7/21/2019 Using Mass Spectrometry for Drug Metabolism Studies
http://slidepdf.com/reader/full/using-mass-spectrometry-for-drug-metabolism-studies 147/362
matrix effects caused by different matrices in different animal brains can be
easily corrected. As shown in Table 4.7, without the standard addition method,
56 and 60 ng/g as the brain levels for each rat would be reported; however, with
the standard addition method, it is clearly shown that there was about a 50%signal enhancement for the samples compared to the standards; therefore, the
correct concentration levels should be 25 and 26 ng/g, respectively, as
calculated using Equation 4.13.
4.3.11 Using a nano-splitting device
It is well known that reducing the ESI flow rate to nanoliters per minute leads
to increased desolvation, ionization and ion-transfer efficiency.107 Experiments
have clearly demonstrated that the ESI signal can be dramatically enhanced
with nanoflow ESI conditions for those low surface activity compounds, such
as oligosaccharides and glycosides.108,109 It has been reported that nanoelec-
trospray is more tolerant of samples that contain nonvolatile salts because of
its ability to generate smaller, more highly charged droplets.110 The advantage
of nano-ESI in overcoming the matrix effects can be rationalized based on the
fundamentals of the ESI process. The slower flow rate will reduce the size of
the initial ESI droplets that in turn require fewer uneven fission processes and
less solvent evaporation prior to ion release into the gas phase. The uneven
fission process is known to be a cause of many ESI matrix effects. The uneven
fission will enhance the surface-active components, such as surface-active
matrices, to compete with less surface-active components, such as polar
analytes, for the limited surface charge. Fewer uneven fission processes will
minimize the competition between surface-active matrices and polar analytes,
and thereby lead to a higher signal for polar analytes. In order to prove the
effect of flow rate on the ESI responses of low surface-active compounds,
Table 4.7 An example of using the standard addition method to correct matrix effects
Sample description (ng/g)Area of analyte
Area of IS Response
Concentrationbased on
calibration (ng/g) Diff %
Standards 50 3983 906679 0.0044 51 350 3908 926293 0.0042 49 1
500 44521 938098 0.0475 503 1500 43801 961710 0.0455 484 3
5000 470520 822707 0.5719 5481 105000 451638 943048 0.4789 4623 8
Unknown X1 4153 857104 0.0048 56 *X2 4857 942016 0.0052 60 *
Spiked unknown X1þ500 99264 967655 0.1026 1054X2þ500 97180 937134 0.1037 1065
Unknown X1 after correction 25 **X2 after correction 26 **
*Calculated using the calibration curve, where matrix effects are embedded.**Calculated using the method of standard addition (Equation 4.13), where matrix effects are
corrected. Standards were used to confirm the linear response range.
140 Using Mass Spectrometry for Drug Metabolism Studies
Copyright © 2005 CRC Press, LLC
7/21/2019 Using Mass Spectrometry for Drug Metabolism Studies
http://slidepdf.com/reader/full/using-mass-spectrometry-for-drug-metabolism-studies 148/362
Schmidt and colleagues designed an elegant experiment with a mixture of
compounds that have differences in surface activity, a low surface activity
compound (turanose) and a high surface activity compound (n-octyl-
glycogyranoside).111
Because both turanose and n-octyl-glycogyranoside areuncharged in solution, the difference of ion signal intensity at different flow
rate should only reflect the contribution of the difference in surface activity.
The suppression of turanose by n-octyl-glycogyranoside can be completely
eliminated at a flow rate of a few nL/min while the suppression increases to
5-fold at flow rates greater than 50 nL/min.111
While using a few nL/min might not be practical for routine LC–MS
quantification, reducing the flow rate to 100–200 nL/min using a nano-
splitting device is still a feasible approach. The same laboratory has tried to
apply this system for both metabolite identification6
and bioanalyticalquantitation.112 The advantage of this nanosplitting device as compared to
using a capillary LC column is that samples still can be run with faster LC
flow rates on conventional HPLC columns. Therefore, there is no need to be
concerned about overloading the column with matrix or rapid deterioration
of the column, as would be the case when using a capillary column.
Furthermore, the chromatographic quality is not affected by this splitting
device.112 With this splitting device, ionization suppression was dramatically
reduced, so that more metabolites that had been suppressed in the faster
flow rate (200mL/min) were able to be detected.6 When it was appliedto bioanalytical quantitation, one could still produce a calibration curve
with a linear dynamic range similar to the standard interface, with an
improved LOQ and chromatographic performance (for more on this topic,
see Chapter 12).112
4.3.12 Switching instruments and ionization modes
As shown in a recent study, ionization of the analyte is a very complex
phenomenon; it can be affected by many factors, including by co-eluting
components and instrument settings.29 In an earlier section, we have also
shown that matrix effects can be different with different ionization modes
or a different brand of instruments. Matrix effects observed in one brand of
instrument might not be seen in another brand. Therefore, if the source and
cause of a matrix effect is unknown and another brand of instrument is
available, it may be easier to switch to the second vendor’s system. In this case,
attempts should be made to evaluate the matrix effects in the other instrument
using both the ESI and the APCI modes, and then use the second instrument to
analyze the samples if a satisfactory evaluation is obtained.
4.4 Conclusions
Matrix effects are one of the most important causes for failures and errors in
bioanalytical LC–MS/MS assays. With increasing applications of LC–MS/MS
Matrix Effects: Causes and Solutions 141
Copyright © 2005 CRC Press, LLC
7/21/2019 Using Mass Spectrometry for Drug Metabolism Studies
http://slidepdf.com/reader/full/using-mass-spectrometry-for-drug-metabolism-studies 149/362
for pharmaceutical research, the issue of matrix effects has received more and
more attention. We have discussed possible causes of matrix effects based on
the mechanisms of electrospray ionization, summarized different approaches
for evaluation of matrix effects and proposed the strategies for overcomingmatrix effects in this chapter.
Matrix effects can be caused by polar nonvolatile components as well as
hydrophobic volatile components via different mechanisms. Polar nonvolatile
components could cause ion enhancement at low concentrations when excess
charge is increased by the increase of conductivity of spayed solution at
optimum electrolyte levels. Polar nonvolatile components can also cause ion
suppression at high concentrations when they change the physical property of
sprayed solution that reduces the desolvation efficiency ( f ) or the ion transfer
efficiency ( p). Nonpolar hydrophobic components can cause matrix effects bycompetition for the limited surface excess charge in the ESI process. Both polar
and nonpolar matrix components can cause ion suppression by strong ion-
pairing with the analytes or by competing for gas phase protons. Ion enhancing
agents that exist in biological samples, such as Liþ, can also induce matrix
effects. Endogenous components as well as exogenous components, such as
plasticizers, Li-heparin, and dosing excipients, can cause significant matrix
effects.
Matrix effect evaluation is the first step for solving the issues of matrix
effects. Post-column infusion, direct comparison of mass response in differentmatrices using pre-spiking or post-spiking approaches are the most common
procedures. The purpose of the evaluation is to locate the range, to know
the relative hydrophobicity, to identify the source of matrix effects, to select
appropriate internal standards, and to compare the effectiveness of separation
procedures.
Different strategies need to be used for solving matrix effects with different
causes and sources. For the matrix effects caused by polar nonvolatile
components, efficient separation from relatively hydrophobic analytes can be
achieved using mini-bore reversed phase columns or turbulent flow chromatog-
raphy. For polar nonvolatile analytes that are hard to separate from polar
matrices, either the nano-spray technique with a concentric nano-splitting
device or post-column addition of a signal-enhancing agent could be useful.
For a small amount of endogenous hydrophobic matrices, modifications can
be made to the chromatographic separation conditions, or other sample
preparation procedures, such as off-line or on-line solid phase extraction or
liquid–liquid extraction should be tried. For matrix effects caused by the ion
pairing of TFA, a sufficient amount of propionic acid/2-propanol should be
added to the mobile phase or these can be added to the post-column eluate. For
extensive matrix effects caused by a relatively large amount of hydrophobic
matrices in tissue samples, the method of standard addition should be tried.
The following procedures should be adopted whenever possible:
1. Employ an appropriate internal standard.
2. Introduce the minimum amount of sample into the assay system.
142 Using Mass Spectrometry for Drug Metabolism Studies
Copyright © 2005 CRC Press, LLC
7/21/2019 Using Mass Spectrometry for Drug Metabolism Studies
http://slidepdf.com/reader/full/using-mass-spectrometry-for-drug-metabolism-studies 150/362
3. Minimize the build-up of contaminants on the MS interface.
4. Use pre-dose samples to prepare the calibration standards or QCs.
5. Avoid exogenous matrices.
6. When all else fails, try a different ionization mode or a different brand of
instrument.
With a better understanding of the mechanisms of matrix effects, application
scientists should be able to work with manufacturers to design better MS
interfaces that not only increase the analyte sensitivity but also minimize or
eliminate the problem of matrix effects.
References
1. Gilbert, J.D., Olah, T.V., Barrish, A., and Greber, T.F., Determination of L-654,066,
a new 5 alpha-reductase inhibitor in plasma by liquid chromatography/
atmospheric pressure chemical ionization mass spectrometry, Bio. Mass Spectrom.,
21, 341, 1992.
2. Ikonomou, M.G., Naghipur, A., Lown, J.W., and Kebarle, P., Characterization of
the reaction products of deoxyguanosine with the anticancer agent BFNU and
BFNU-1,1,10,10-d4 in different buffers by high-performance liquid chromatography/
atmospheric pressure ionization tandem mass spectrometry, Biomed. Environ. Mass
Spectrom., 19(7), 434, 1990.
3. Kebarle, P. and Tang, L., From ions in solution to ions in the gas phase, Anal.
Chem., 65, 972A, 1993.
4. Mirza, U.A. and Chait, B.T., Effects of anions on the positive ion electrospray
ionization mass spectra of peptides and proteins, Anal. Chem., 66(18), 2898, 1994.
5. Miller-Stein, C., Bonfiglio, R., Olah, T., and King, R., Rapid method develop-
ment of quantitative LC-MS/MS assays for drug discovery, Am. Pharm. Rev., 3, 54,
2000.
6. Gangl, E.T., Annan, M.M., Spooner, N., and Vouros, P., Reduction of signal
suppression effects in ESI–MS using a nanosplitting device, Anal. Chem., 73(23),
5635, 2001.7. Shah, V.P. et al. Bioanalytical method validation—a revisit with a decade of
progress, Pharm. Res., 17(12), 1551, 2000.
8. Fenn, J.B., Ion formation from charged droplets: role of geometry, energy and time,
J. Am. Soc. Mass Spectrom., 4, 524, 1993.
9. Enke, C.G., A predictive model for matrix and analyte effects in electrospray
ionization of singly-charged ionic analytes, Anal. Chem., 69(23), 4885, 1997.
10. Kebarle, P., A brief overview of the present status of the mechanisms involved in
electrospray mass spectrometry, J. Mass Spectrom., 35(7), 804, 2000.
11. Kebarle, P. and Peschke, M., On the mechanisms by which the charged
droplets produced by electrospray lead to gas phase ions, Anal. Chem. Acta, 406,11, 2000.
12. Cech, N.B. and Enke, C.G., Effect of affinity for droplet surfaces on the fraction of
analyte molecules charged during electrospray droplet fission, Anal. Chem., 73(19),
4632, 2001.
13. Dole, M. et al. Molecular beams of macroions, J. Chem. Phys., 49, 2240, 1968.
14. Iribarne, J.V., Dziedzic, P., and Thomson, B.A., Atmospheric pressure ion
evaporation–mass spectrometry, Int. J. Mass Spectrom. Ion Phys., 50, 331, 1983.
Matrix Effects: Causes and Solutions 143
Copyright © 2005 CRC Press, LLC
7/21/2019 Using Mass Spectrometry for Drug Metabolism Studies
http://slidepdf.com/reader/full/using-mass-spectrometry-for-drug-metabolism-studies 151/362
15. Constantopoulos, T.L., Jackson, G.S., and Enke, C.G., Effects of salt concentra-
tion on analyte response using electrospray ionization mass spectrometry, J. Am.
Soc. Mass Spectrom., 10(7), 625, 1999.
16. Amad, M.H., Cech, N.B., Jackson, G.S., and Enke, C.G., Importance of gas-phase
proton affinities in determining the electrospray ionization response for analytes
and solvents, J. Mass Spectrom., 35(7), 784, 2000.
17. Tang, K. and Smith, R.D., Physical/chemical separations in the break-up of highly
charged droplets from electrosprays, J. Am. Soc. Mass Spectrom., 12(3), 343, 2001.
18. Zhou, S. and Cook, K.D., A mechanistic study of electrospray mass spectrometry:
charge gradients within electrospray droplets and their influence on ion response,
J. Am. Soc. Mass Spectrom., 12(2), 206, 2001.
19. King, R. et al. Mechanistic investigation of ionization suppression in electrospray
ionization, J. Am. Soc. Mass Spectrom., 11(11), 942, 2000.
20. Asperger, A., Efer, J., Koal, T., and Engewald, W., On the signal response of various pesticides in electrospray and atmospheric pressure chemical ionization
depending on the flow-rate of eluent applied in liquid chromatography–tandem
mass spectrometry, J. Chromatogr. A, 937(1–2), 65, 2001.
21. Tang, L. and Kebarle, P., Dependence of ion intensity in electrospray mass
spectrometry on the concentration of analytes in the electrosprayed solution, Anal.
Chem., 65, 3654, 1993.
22. Stephenson, J.L., Jr. and McLuckey, S.A., Ion/ion proton transfer reactions for
protein mixture analysis, Anal. Chem., 68(22), 4026, 1996.
23. Stephenson, J.L., Jr. and McLuckey, S.A., Counting basic sites in oligopeptides via
gas-phase ion chemistry, Anal. Chem., 69(3), 281, 1997.24. Tang, L. and Kebarle, P., Effect of the conductivity of the electrosprayed solution
on the electrospray current. Factors determining analyte sensitivity in electrospray
mass spectrometry, Anal. Chem., 63, 2709, 1991.
25. Cech, N.B. and Enke, C.G., Relating electrospray ionization response to nonpolar
character of small peptides, Anal. Chem., 72(13), 2717, 2000.
26. Leize, E., Jaffrezic, A., and Dorsselaer, A.V., Correlation between solvation energies
and electrospray mass spectrometric response factors. Study by electrospray mass
spectrometry of supramolecular complexes in thermodynamic equilibrium in
solution, J. Mass Spectrom., 31, 537, 1996.27. Lipinski, C., Drug-like properties and the causes of poor solubility and poor
permeability, J. Pharmacol. Toxicol. Methods, 44, 235, 2000.
28. Cech, N.B., Krone, J.R., and Enke, C.G., Predicting electrospray response from
chromatographic retention time, Anal. Chem., 73(2), 208, 2001.
29. Sjoberg, P.J., Bokman, C.F., Bylund, D., and Markides, K.E., Factors influencing
the determination of analyte ion surface partitioning coefficients in electrosprayed
droplets, J. Am. Soc. Mass Spectrom., 12, 1002, 2001.
30. Apffel, A., Fisher, S., Goldberg, G., Goodley, P., and Kuhlmann, F., Signal
enhancement for gradient reverse-phase high performance liquid-chromatography
electrospray-ionization mass spectrometry analysis with trifluoroacetic and otherstrong acid modifiers by post column addition of propionic-acid and isopropanol,
J. Am. Soc. Mass Spectrom., 6, 1221, 1995.
31. Wang, G. and Cole, R.B., Disparity between solution-phase equilibria and charge
distribution in positive-ion electrospray mass spectrometry, Org. Mass Spectrom.,
29, 419, 1994.
32. Zhou, S. and Cook, K.D., Protonation in electrospray mass spectrometry: wrong-
way-round or right-way-round?, J. Am. Soc. Mass Spectrom., 11(11), 961, 2000.
144 Using Mass Spectrometry for Drug Metabolism Studies
Copyright © 2005 CRC Press, LLC
7/21/2019 Using Mass Spectrometry for Drug Metabolism Studies
http://slidepdf.com/reader/full/using-mass-spectrometry-for-drug-metabolism-studies 152/362
33. Wang, G. and Cole, R.B., Solution, Gas-phase, and Instrumental Parameter
Influences on Charge-state Distribution in Electrospray Ionization Mass Spectrom-
etry, Wiley, New York, 1997.
34. Tong, X.S. et al. Effect of signal interference from dosing excipients on
pharmacokinetic screening of drug candidates by liquid chromatography/mass
spectrometry, Anal. Chem., 74(24), 6305, 2002.
35. Shou, W.Z. and Naidong, W., Post-column infusion study of the ’dosing vehicle
effect’ in the liquid chromatography/tandem mass spectrometric analysis of discovery
pharmacokinetic samples, Rapid Commun. Mass Spectrom., 17(6), 589, 2003.
36. Larger, P.J., et al. Investigation of ion-suppression from a formulation agent in
quantitative LC–MS/MS bioanalysis: a case study on Tween 80, in Proceedings of
the 51st ASMS Conference on Mass Spectrometry and Allied Topics, Montreal,
Canada, 2003.
37. Schumacher, J., Zimmer, D., Tesche, F., and Pickard, V., Matrix effects duringanalysis of plasma samples by electrospray and atmospheric pressure chemical
ionization mass spectrometry: practical approaches to their elimination, Rapid
Commun. Mass Spectrom., 17, 1950, 2003.
38. Ahnoff, M., Wurzer, A., Lindmark, B., and Jussila, R., Characterisation of serum
albumin and LysoPCs as major contributors to plasma sample matrix effects on
electrospray ionisation efficiency, in Proceedings of the 51st ASMS Conference on
Mass Spectrometry and Allied Topics, Montreal, Canada, 2003.
39. Sullivan, M., Shen, J., and Bugge, C.J.L., Improved sensitivity and ruggedness in
APCI mode for a Micromass Quattro Ultima LC-MS-MS System, in Proceedings of
the 49th ASMS Conference on Mass Spectrometry and Allied Topics, Chicago, IL,2001.
40. Shang, J.X., Zhong, W.-Z., and Heath, T.G., Examination of matrix-induced
ionization suppression in atmospheric pressure chemical ionization, Proceedings
of the 49th ASMS Conference on Mass Spectrometry and Allied Topics, Chicago,
2001.
41. Mei, H. et al. Investigation of matrix effects in bioanalytical high-performance
liquid chromatography/tandem mass spectrometric assays: application to drug
discovery, Rapid Commun. Mass Spectrom., 17(1), 97, 2003.
42. Ding, X., Duggan, J.X., and Fast, D.M., A LC–MS/MS method for quantitation of a small molecule drug candidate in rat plasma, urine and synovial fluid and matrix
effect evaluation in these three matrices using API 4000 and API 3000, in
Proceedings of the 51st ASMS Conference on Mass Spectrometry and Allied Topics ,
Montreal, Canada, 2003.
43. Eshraghi, J. and Chowdhury, S.K., Factors affecting electrospray ionization
of effluents containing trifluoroacetic acid for high-performance liquid chroma-
tography/mass spectrometry, Anal. Chem., 65(23), 3528, 1993.
44. Bruins, A.P., Covey, T.R., and Henion, J.D., Ion spray interface for combined
liquid chromatography/atmospheric pressure ionization mass spectrometry, Anal.
Chem., 59, 2642, 1987.45. Apffel, A. et al. Enhanced sensitivity for peptide mapping with electrospray
liquid chromatography–mass spectrometry in the presence of signal suppression
due to trifluoroacetic acid-containing mobile phases, J. Chromatogr., A, 712(1),
177, 1995.
46. Romanyshyn, L. et al. Ultra-fast gradient vs. fast isocratic chromatography in
bioanalytical quantification by liquid chromatography/tandem mass spectrometry,
Rapid Commun. Mass Spectrom., 15(5), 313, 2001.
Matrix Effects: Causes and Solutions 145
Copyright © 2005 CRC Press, LLC

7/21/2019 Using Mass Spectrometry for Drug Metabolism Studies
http://slidepdf.com/reader/full/using-mass-spectrometry-for-drug-metabolism-studies 153/362
47. Hsieh, Y. et al. Quantitative screening and matrix effect studies of drug discovery
compounds in monkey plasma using fast-gradient liquid chromatography/tandem
mass spectrometry, Rapid Commun. Mass Spectrom., 15(24), 2481, 2001.
48. Choi, B.K., Hercules, D.M., and Gusev, A.I., Effect of liquid chromatography
separation of complex matrices on liquid chromatography–tandem mass spectrom-
etry signal suppression, J. Chromatogr., A, 907(1–2), 337, 2001.
49. Choi, B.K., Hercules, D.M., and Gusev, A.I., LC–MS/MS signal suppression
effects in the analysis of pesticides in complex environmental matrices, Fresenius
J. Anal. Chem., 369(3–4), 370, 2001.
50. Pascoe, R., Foley, J.P., and Gusev, A.I., Reduction in matrix-related signal
suppression effects in electrospray ionization mass spectrometry using on-line two-
dimensional liquid chromatography, Anal. Chem., 73(24), 6014, 2001.
51. Bonfiglio, R., King, R.C., Olah, T.V., and Merkle, K., The effects of sample
preparation methods on the variability of the electrospray ionization responsefor model drug compounds, Rapid Commun. Mass Spectrom., 13(12), 1175,
1999.
52. Hsu, F., Bohrer, A., and Turk, J., Formation of lithiated adducts of glycerophos-
phocholine lipids facilitates their identification by electrospray ionization tandem
mass spectrometry, J. Am. Soc. Mass Spectrom., 9(5), 516, 1998.
53. Hsu, F. and Turk, J., Structural characterization of triacylglycerols as lithiated
adduct by electrospray ionization mass spectrometry using low-energy collisionally
activated dissociation on a triple stage quadrupole instrument, J. Am. Soc. Mass
Spectrom., 10(7), 587, 1999.
54. Hsu, F. and Turk, J., Characterization of phosphatidylethanolamine as a lithiatedadduct by triple quadrupole tandem mass spectrometry with electrospray
ionization, J. Am. Soc. Mass Spectrom., 35(5), 595, 2000.
55. Chen, R. and Li, L., Lithium and transition metal ions enable low energy collision-
induced dissociation of polyglycols in electrospray ionization mass spectrometry,
J. Am. Soc. Mass Spectrom., 12, 832, 2001.
56. Volosov, A.L.L. and Nicolas, J., Irregular vehicle-related ion suppression in
pharmaceutical studies, Proceedings of the 51st ASMS Conference on Mass
Spectrometry and Allied Topics, Montreal, Canada, 2003.
57. Beato, B.D. et al. Strategies for dealing with matrix effects and interferences, inProceedings of the 51st ASMS Conference on Mass Spectrometry and Allied Topics ,
Montreal, Canada, 2003.
58. Avery, M.J., Quantitative characterization of differential ion suppression on liquid
chromatography/atmospheric pressure ionization mass spectrometric bioanalytical
methods, Rapid Commun. Mass Spectrom., 17(3), 197, 2003.
59. Matuszewski, B.K., Constanzer, M.L., and Chavez-Eng, C.M., Matrix effect in
quantitative LC/MS/MS analyses of biological fluids: a method for determination
of finasteride in human plasma at picogram per milliliter concentrations, Anal.
Chem., 70, 882, 1998.
60. Matuszewski, B.K., Constanzer, M.L., and Chavez-Eng, C.M., Strategies for theassessment of matrix effect in quantitative bioanalytical methods based on HPLC–
MS/MS, Anal. Chem., 75(13), 3019, 2003.
61. Sojo, L.E., Lum, G., and Chee, P., Internal standard signal suppression by
co-eluting analyte in isotope dilution LC–ESI–MS, Analyst, 128(1), 51, 2003.
62. Liang, H.R., Foltz, R.L., Meng, M., and Bennett, P., Ionization enhancement
in atmospheric pressure chemical ionization and suppression in electrospray
ionization between target drugs and stable-isotope-labeled internal standards in
146 Using Mass Spectrometry for Drug Metabolism Studies
Copyright © 2005 CRC Press, LLC
7/21/2019 Using Mass Spectrometry for Drug Metabolism Studies
http://slidepdf.com/reader/full/using-mass-spectrometry-for-drug-metabolism-studies 154/362
quantitative liquid chromatography/tandem mass spectrometry, Rapid Commun.
Mass Spectrom., 17(24), 2815, 2003.
63. Seliniotakis, R. et al. The use of post column addition to improve signal response
and reduce matrix effects in bioanalytical LC/MS/MS assays, Proceedings of the
51st ASMS Conference on Mass Spectrometry and Allied Topics, Montreal, Canada,
2003
64. Yamaguchi, J. et al. Utility of postcolumn addition of 2-(2-methoxyethoxy)ethanol,
a signal-enhancing modifier, for metabolite screening with liquid chromatography
and negative ion electrospray ionization mass spectrometry, Anal. Chem., 71(23),
5386, 1999.
65. Yamaguchi, J. et al. Identification of rat urinary and biliary metabolites
of esonarimod, a novel antirheumatic drug, using liquid chromatography/
electrospray ionization tandem mass spectrometry with postcolumn addition of 2-
(2-methoxyethoxy)ethanol, a signal-enhancing modifier, Drug Metab. Dispos.,29(6), 806, 2001.
66. Jemal, M., Ouyang, Z., and Teitz, D.S., High performance liquid chromatography
mobile phase composition optimization for the quantitative determination of a
carboxylic acid compound in human plasma by negative ion electrospray high
performance liquid chromatography tandem mass spectrometry, Rapid Commun.
Mass Spectrom., 12(8), 429, 1998.
67. Cech, N.B. and Enke, C.G., Practical implications of some recent studies in
electrospray ionization fundamentals, Mass Spectrom. Rev., 20(6), 362, 2001.
68. Shou, W.Z., Eerkes, A., and Weng, N., Simple means to alleviate sensitivity loss by
TFA-containing mobile phases in LC–ESI/MS/MS bioanalysis, Proceedings of the 51st ASMS Conference on Mass Spectrometry and Allied Topics, Montreal,
Canada, 2003.
69. Apffel, A. et al. Analysis of oligonucleotides by HPLC–electrospray ionization mass
spectrometry, Anal. Chem., 69, 1320, 1997.
70. Fountain, K.J., Gilar, M., and Gebler, J.C., Analysis of native and chemically
modified oligonucleotides by tandem ion-pair reversed-phase high-performance
liquid chromatography/electrospray ionization mass spectrometry, Rapid Commun.
Mass Spectrom., 17(7), 646, 2003.
71. Korfmacher, W.A. et al. Cassette-accelerated rapid rat screen: a systematicprocedure for the dosing and liquid chromatography/atmospheric pressure
ionization tandem mass spectrometric analysis of new chemical entities as part of
new drug discovery, Rapid Commun. Mass Spectrom., 15(5), 335, 2001.
72. Watt, A.P., Morrison, D., Locker, K.L., and Evans, D.C., Higher throughput
bioanalysis by automation of a protein precipitation assay using a 96-well format
with detection by LC–MS/MS, Anal. Chem., 72(5), 979, 2000.
73. O’Connor, D., Clarke, D.E., Morrison, D., and Watt, A.P., Determination of drug
concentrations in plasma by a highly automated, generic and flexible protein
precipitation and liquid chromatography/tandem mass spectrometry method
applicable to the drug discovery environment, Rapid Commun. Mass Spectrom.,16(11), 1065, 2002.
74. Mei, H., Nardo, C., Wang, G., and Hsieh, Y., Application of precision 2000 in
rapid rat pharmacokinetic screen: automated standard and sample preparation, in
Proceedings of the 51st ASMS Conference on Mass Spectrometry and Allied Topics ,
Montreal, Canada, 2003.
75. Polson, C. et al. Optimization of protein precipitation based upon effectiveness
of protein removal and ionization effect in liquid chromatography-tandem mass
Matrix Effects: Causes and Solutions 147
Copyright © 2005 CRC Press, LLC
7/21/2019 Using Mass Spectrometry for Drug Metabolism Studies
http://slidepdf.com/reader/full/using-mass-spectrometry-for-drug-metabolism-studies 155/362
spectrometry, J. Chromatogr., B: Analyt. Technol. Biomed. Life Sci., 785(2), 263,
2003.
76. Rossi, D.T. and Zhang, N., Automating solid-phase extraction: current aspects and
future prospects, J. Chromatogr., A, 885(1–2), 97, 2000.
77. Wells, D., ‘‘96-well plate products for solid phase extraction’’ in sample prep
perspectives, LC–GC , July, 600, 1999.
78. Wells, D., ‘‘Accessory products for SPE using 96-well plates’’ in sample prep
perspective, LC–GC , September, 808, 1999.
79. Parker, T.D., 3rd, Wright, D.S., and Rossi, D.T., Design and evaluation of an
automated solid-phase extraction method development system for use with
biological fluids, Anal. Chem., 68(14), 2437, 1996.
80. Janiszewski, J.S., Swyden, M.C., and Fouda, H.G., High-throughput method
development approaches for bioanalytical mass spectrometry, J. Chromatogr. Sci.,
38(6), 255, 2000.81. Lingeman, H. and Hoekstra-Oussoren, S.J., Particle-loaded membranes for sample
concentration and/or clean-up in bioanalysis, J. Chromatogr., B: Biomed. Sci. Appl.,
689(1), 221, 1997.
82. Smith, G. and Loyd, T., Automated solid-phase extraction and sample
preparation—finding the right solution for your laboratory, LC–GC , May, S22,
1998.
83. Majors, R., A review of modern solid-phase extraction, LC – GC , S8, 1998.
84. Lord, H.L. and Pawliszyn, J., Recent advances in solid-phase microextraction,
LC–GC , S41, 1998.
85. Ding, J. and Neue, U.D., A new approach to the effective preparation of plasmasamples for rapid drug quantitation using on-line solid phase extraction mass
spectrometry, Rapid Commun. Mass Spectrom., 13(21), 2151, 1999.
86. Satinsky, D., Sklenarova, H., Huclova, J., and Karlicek, R., On-line coupling
of sequential injection extraction with restricted-access materials for sample
clean-up and analysis of drugs in biological matrix, Analyst, 128(4), 351,
2003.
87. Ayrton, J. et al. Optimisation and routine use of generic ultra-high flow-rate liquid
chromatography with mass spectrometric detection for the direct on-line analysis of
pharmaceuticals in plasma, J. Chromatogr., A, 828(1–2), 199, 1998.88. Herman, J.L., Generic method for on-line extraction of drug substances in the
presence of biological matrices using turbulent flow chromatography, Rapid
Commun. Mass Spectrom., 16(5), 421, 2002.
89. Grant, R.P., Cameron, C., and Mackenzie-McMurter, S., Generic serial and
parallel on-line direct-injection using turbulent flow liquid chromatography/tandem
mass spectrometry, Rapid Commun. Mass Spectrom., 16(18), 1785, 2002.
90. Andersson, L.I., Molecular imprinting for drug bioanalysis. A review on the
application of imprinted polymers to solid-phase extraction and binding assay,
J. Chromatogr., B: Biomed. Sci. Appl., 739(1), 163, 2000.
91. Hsieh, Y. et al. Direct analysis of plasma samples for drug discovery compoundsusing mixed-function column liquid chromatography tandem mass spectrometry,
Rapid Commun. Mass Spectrom., 14(15), 1384, 2000.
92. Boos, K.S. and Fleischer, C.T., Multidimensional on-line solid-phase extraction
(SPE) using restricted access materials (RAM) in combination with molecular
imprinted polymers (MIP), Fresenius J. Anal. Chem., 371(1), 16, 2001.
93. Koeber, R. et al. Evaluation of a multidimensional solid-phase extraction platform
for highly selective on-line cleanup and high-throughput LC–MS analysis of
148 Using Mass Spectrometry for Drug Metabolism Studies
Copyright © 2005 CRC Press, LLC
7/21/2019 Using Mass Spectrometry for Drug Metabolism Studies
http://slidepdf.com/reader/full/using-mass-spectrometry-for-drug-metabolism-studies 156/362
triazines in river water samples using molecularly imprinted polymers, Anal.
Chem., 73(11), 2437, 2001.
94. Beaudry, F., Le Blanc, J.C., Coutu, M., and Brown, N.K., In vivo pharmacokinetic
screening in cassette dosing experiments; the use of on-line Prospekt liquid
chromatography/atmospheric pressure chemical ionization tandem mass spectrom-
etry technology in drug discovery, Rapid Commun. Mass Spectrom., 12(17), 1216,
1998.
95. Parker, T.D., 3rd, Surendran, N., Stewart, B.H., and Rossi, D.T., Automated
sample preparation for drugs in plasma using a solid-phase extraction work-
station, J. Pharm. Biomed. Anal ., 17(4–5), 851, 1998.
96. Plumb, R.S., Gray, R.D., and Jones, C.M., Use of reduced sorbent bed and disk
membrane solid-phase extraction for the analysis of pharmaceutical compounds in
biological fluids, with applications in the 96-well format, J. Chromatogr., B:
Biomed. Sci. App., 694(1), 123, 1997.97. Simpson, H. et al. High throughput liquid chromatography/mass spectrometry
bioanalysis using 96-well disk solid phase extraction plate for the sample
preparation, Rapid Commun. Mass Spectrom., 12(2), 75, 1998.
98. Mallet, C.R. et al. Performance of an ultra-low elution-volume 96-well plate:
drug discovery and development applications, Rapid Commun. Mass Spectrom.,
17(2), 163, 2003.
99. King, R. and Mahan, E., Eliminating ionization suppression in plasma extracts, in
Proceedings of the 51st ASMS Conference on Mass Spectrometry and Allied Topics,
Montreal, Canada, 2003.
100. Zhang, N., Hoffman, K.L., Li, W., and Rossi, D.T., Semi-automated 96-wellliquid–liquid extraction for quantitation of drugs in biological fluids, J. Pharm.
Biomed. Anal ., 22(1), 131, 2000.
101. Ramos, L., Bakhtiar, R., and Tse, F.L., Liquid–liquid extraction using 96-well
plate format in conjunction with liquid chromatography/tandem mass spectrom-
etry for quantitative determination of methylphenidate (Ritalin) in human plasma,
Rapid Commun. Mass Spectrom., 14(9), 740, 2000.
102. Basileo, G. et al. Quantitative determination of paclitaxel in human plasma using
semi-automated liquid–liquid extraction in conjunction with liquid chroma-
tography/tandem mass spectrometry, J. Pharm. Biomed. Anal ., 32(4–5), 591,2003.
103. Bolden, R.D. et al. Semi-automated liquid—liquid back-extraction in a 96-well
format to decrease sample preparation time for the determination of dextro-
methorphan and dextrorphan in human plasma, J. Chromatogr., B: Analyt.
Technol. Biomed. Life Sci ., 772(1), 1, 2002.
104. Peng, S.X., Branch, T.M., and King, S.L., Fully automated 96-well liquid–liquid
extraction for analysis of biological samples by liquid chromatography with
tandem mass spectrometry, Anal. Chem., 73(3), 708, 2001.
105. Sandahl, M., Mathiasson, L., and Jonsson, J.A., On-line automated sample
preparation for liquid chromatography using parallel supported liquid membraneextraction and microporous membrane liquid–liquid extraction, J. Chromatogr.,
A, 975(1), 211, 2002.
106. Ito, S. and Tsukada, K., Matrix effect and correction by standard addition in
quantitative liquid chromatographic–mass spectrometric analysis of diarrhetic
shellfish poisoning toxins., J. Chromatogr., A, 943, 39, 2002.
107. Wilm, M. and Mann, M., Analytical properties of the nanoelectrospray ion
source, Anal. Chem., 68(1), 1, 1996.
Matrix Effects: Causes and Solutions 149
Copyright © 2005 CRC Press, LLC
7/21/2019 Using Mass Spectrometry for Drug Metabolism Studies
http://slidepdf.com/reader/full/using-mass-spectrometry-for-drug-metabolism-studies 157/362
108. Karas, M., Bahr, U., and Dulcks, T., Nano-electrospray ionization mass
spectrometry: addressing analytical problems beyond routine, Fresenius J. Anal.
Chem., 366(6–7), 669, 2000.
109. Bahr, U., Pfenninger, A., Karas, M., and Stahl, B., High-sensitivity analysis of
neutral underivatized oligosaccharides by nano-electrospray mass spectrometry,
Anal. Chem., 69, 4530, 1997.
110. Juraschek, R., Dulcks, T., and Karas, M., Nanoelectrospray—more than just a
minimized-flow electrospray ionization source, J. Am. Soc. Mass Spectrom., 10(4),
300, 1999.
111. Schmidt, A., Karas, M., and Dulcks, T., Effect of different solution flow rates on
analyte ion signals in nano-ESI MS, or: when does ESI turn into nano-ESI?, J. Am.
Soc. Mass Spectrom., 14(5), 492, 2003.
112. Andrews, C.L., Yang, E., Yu, C., and Vouros, P., The analysis of pharmaceutical
compounds by LC/MS/MS utilizing a nano-splitting device: investigation of linearity and dynamic range, in Proceedings of the 51st ASMS Conference on Mass
Spectrometry and Allied Topics, Montreal, Canada, 2003.
150 Using Mass Spectrometry for Drug Metabolism Studies
Copyright © 2005 CRC Press, LLC
7/21/2019 Using Mass Spectrometry for Drug Metabolism Studies
http://slidepdf.com/reader/full/using-mass-spectrometry-for-drug-metabolism-studies 158/362
Chapter 5
Direct Plasma Analysis Systems
Yunsheng Hsieh
5.1 Introduction
The combination of structural genomics techniques and high speed parallel
chemical synthesis has resulted in large numbers of routine samples created as
part of the in vivo and in vitro pharmacokinetic (PK) and drug metabolism
(DM) experiments that are needed to support the discovery of new medicines.
This increase in sample load has forced the development of higher throughput
screening assays to handle the workload. The high-resolution power of
chromatographic methodologies coupled to atmospheric pressure ionization– tandem mass spectrometry (API–MS/MS) has been able to reduce the need for
most traditional sample preparation procedures and has also reduced the
method development time required for drug analyses [1, 2]. Furthermore, fast
high-performance liquid chromatography (HPLC) techniques in combination
with the specificity of MS/MS detection have successfully demonstrated the
capability of separating and identifying a wide range of small molecules using
either a 1-min gradient or isocratic analyses [3–7]. However, sample
preparation steps such as the protein precipitation procedure to remove
proteins from biological samples are still essential prior to the HPLC–MS/MS
assay for small molecules. These procedures are required not only to prevent
the HPLC column from clogging in reversed-phase chromatography but also
to avoid ion source contamination and matrix ionization suppression in the
mass spectrometer [8, 9]. Therefore, most laboratories still utilize sample
0-8493-1963-3/05/$0.00+$1.50 2005 by CRC Press 151
Copyright © 2005 CRC Press, LLC
7/21/2019 Using Mass Spectrometry for Drug Metabolism Studies
http://slidepdf.com/reader/full/using-mass-spectrometry-for-drug-metabolism-studies 159/362
preparation procedures such as protein precipitation, liquid–liquid extraction
or solid phase extraction for HPLC–MS/MS analyses [10].
While these standard sample preparation procedures work well in many
cases, they are often the slow step (the bottleneck) in the assay procedure; analternative approach is direct injection analysis. Powell and Jemal [11] and
Ackermann et al. [12] have reviewed procedures for direct injection of
biological samples focusing on a dual-column approach and column switching
techniques, respectively. In this chapter, we include the most current direct
HPLC–MS/MS methods developed for the qualitative and quantitative
analysis of the drug-related components in biological fluids and their
application to new drug discovery assays.
5.2 On-line Solid-phase Extraction Procedures
Solid-phase extraction (SPE) has become one of the more popular techniques
to remove interference materials in complex samples because of its simplicity,
speed, and effectiveness. The SPE technique can be integrated into HPLC
systems by column switching to provide for on-line sample extraction [13]. For
on-line SPE, the biological samples are injected into the preconditioned
cartridge or disposable pre-column (available under the brand names
LiChrograph OSP-2 and PROSPEKT) followed by distilled water or buffersolution washing, which retains the target analytes. The potentially interfering
endogenous components are flushed into the waste with distilled water. The
purified analytes retained on the bonded phase of the cartridge are then eluted
out into a series-connected analytical column via a switching valve.
Simultaneously during the course of chromatographic separation, another
cartridge is automatically exchanged and undergoes preconditioning in
preparation for the next injection. The potential of several automated on-line
SPE systems connected to one mass spectrometer was successfully demon-
strated for the simultaneous determination of anabolic steroids and ten new
drug candidates in human urine and animal plasma, respectively [14, 15].
In on-line SPE, the compounds of interest are delivered directly from the
extraction cartridge into the mass spectrometer to exclude steps like sample
extraction, elution, evaporation, and reconstitution, normally employed in
traditional (off-line) SPE. The SPE system is often designed to operate at
conventional flow rates of 1 mL/min [16]. An increase in the flow rate will lead
to shorter times for de-salting and equilibration, but it may also result in a
lower extraction recovery for the analytes. An on-line SPE–MS/MS method for
the quantitative determination of naratriptan in the 0.05–10 ng/mL range in
human serum was validated for its accuracy, precision, and specificity [16].
In summary, on-line sample preparation approaches provide better accuracy
and precision as compared with off-line techniques. However, while it may
be advantageous to avoid carry-over from previous injections, a major
disadvantage of this type of on-line SPE is the single use of the extraction
cartridge [17].
152 Using Mass Spectrometry for Drug Metabolism Studies
Copyright © 2005 CRC Press, LLC
7/21/2019 Using Mass Spectrometry for Drug Metabolism Studies
http://slidepdf.com/reader/full/using-mass-spectrometry-for-drug-metabolism-studies 160/362
5.3 Direct Plasma Injection using Restricted Access Media
Another promising packing material designed for direct extraction of small
molecules in biological samples to allow multiple injections is the so-calledrestricted access media (RAM). The working principle of RAM phases is to
isolate macromolecules from the targeted small molecules in biological fluids
based upon their particle sizes and chromatographic interaction. The large
macromolecules such as proteins, which are unable to penetrate the hydro-
phobic pores and the hydrophilic outer layer of the packing particles, are first
eluted to waste. The small molecules such as drug compounds that penetrate
the pores are retained through hydrophobic forces. These RAM columns
permit the extraction of a wide variety of compounds in untreated
proteinaceous fluids by preventing access of macromolecules to the bondedphase via a size-exclusion process combined with a hydrophilic outer packing
surface while the low-molecular-mass analytes are retained by conventional
retention mechanisms such as hydrophobic interaction. There are four types of
RAM phases in common use which are differentiated based on their properties
of their diffusion barrier and surface topochemistry: internal-surface reverse
phase (ISRP) (ChromSpher 5 Biomatrix [18, 19], Chrompack LiChrospher
ADS [20–29]); semi-permeable surfaces (SPS) (Regis [30–32], BioTrap 500,
ChromTech [33]); dual zone (DZ, Diazem [34–36]); and mixed functional
phases (MFP) (Capcell Pak MF, Shiseido) [37–40].For ISRP type columns, the most popular RAMs, there is a physical
diffusion barrier by an appropriate pore diameter to prevent the access to
proteins, which is produced by bonding a high coverage hydrophilic phase such
as glycerylpropyl (diol) groups to small pores. The bonded reversed phase, with
the ligand being a C4, C8 or C18 moiety, covers the internal pore surfaces of
modified silica. However, the alkyl-diol silica (ADS) column provides little
chromatographic separation for the low-molecular-mass compounds. There-
fore, it was recommended that this restricted access pre-column requires an
additional analytical column for chromatographic separation in combination
with a column-switching technique, using the so-called coupled-column mode
(LC–LC) direct injection method [13] as depicted in Figure 5.1. For example,
Koch et al. [20], developed a multidimensional direct LC–LC–MS/MS method
for the quantitative determination of two secondary chain-oxidized monoester
metabolites of diethylhexylphthalate (DEHP) in human urine. The phthalate
analytes were stripped from the urine matrix by an ADS pre-column using
a 1% aqueous solution of acetic acid and methanol (90:10, v/v) as the mobile
phase at a flow rate of 0.8 mL/min. After this sample clean-up and enrichment
step, all analytes were transferred to a reversed-phase mode analytical column
following by electrospray ionization (ESI) and tandem mass spectrometric
(MS/MS) detection. As described in a short communication, Muzic, Jr. [18]
employed an ISRP column to isolate a radiopharmaceutical, (S )-[18F]
fluorocarazolol, and its metabolites from various plasma samples. ADS
pre-columns allow the extraction of a wide range of small molecules such
as tetracyclines [19], alkylphenolic compounds [27], atropine, fenoterol,
Direct Plasma Analysis Systems 153
Copyright © 2005 CRC Press, LLC
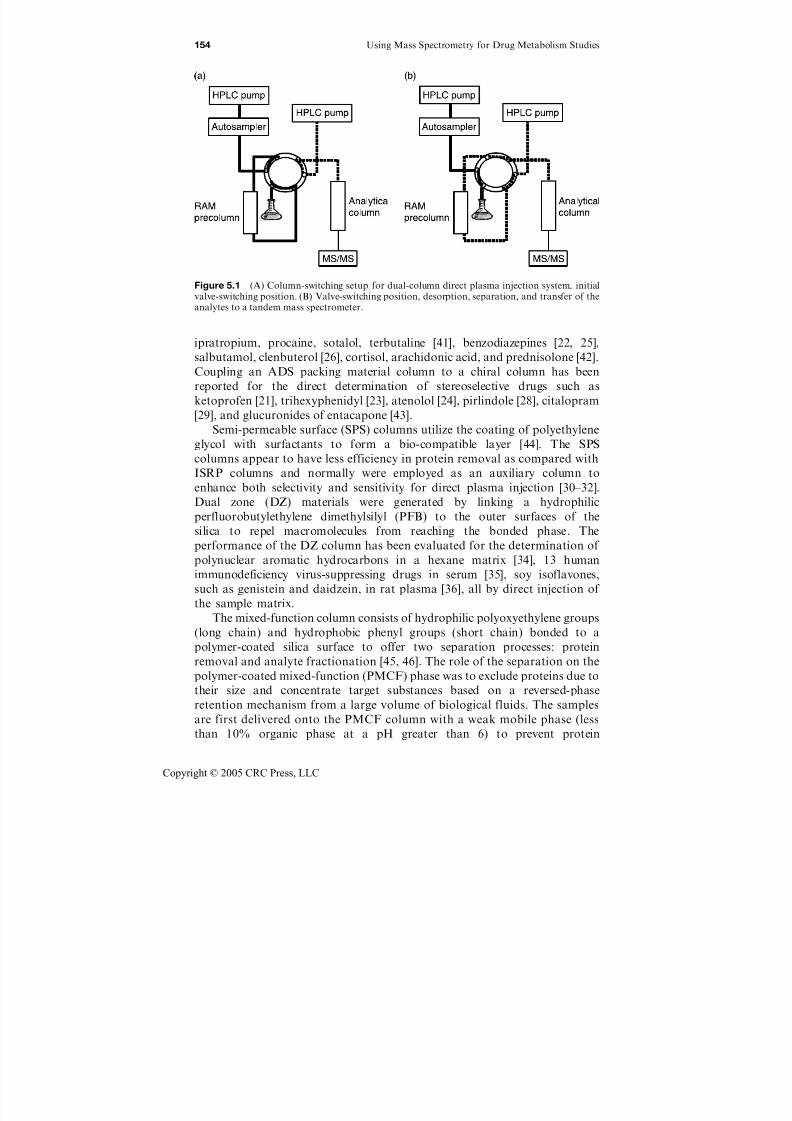
7/21/2019 Using Mass Spectrometry for Drug Metabolism Studies
http://slidepdf.com/reader/full/using-mass-spectrometry-for-drug-metabolism-studies 161/362
ipratropium, procaine, sotalol, terbutaline [41], benzodiazepines [22, 25],
salbutamol, clenbuterol [26], cortisol, arachidonic acid, and prednisolone [42].
Coupling an ADS packing material column to a chiral column has been
reported for the direct determination of stereoselective drugs such asketoprofen [21], trihexyphenidyl [23], atenolol [24], pirlindole [28], citalopram
[29], and glucuronides of entacapone [43].
Semi-permeable surface (SPS) columns utilize the coating of polyethylene
glycol with surfactants to form a bio-compatible layer [44]. The SPS
columns appear to have less efficiency in protein removal as compared with
ISRP columns and normally were employed as an auxiliary column to
enhance both selectivity and sensitivity for direct plasma injection [30–32].
Dual zone (DZ) materials were generated by linking a hydrophilic
perfluorobutylethylene dimethylsilyl (PFB) to the outer surfaces of the
silica to repel macromolecules from reaching the bonded phase. The
performance of the DZ column has been evaluated for the determination of
polynuclear aromatic hydrocarbons in a hexane matrix [34], 13 human
immunodeficiency virus-suppressing drugs in serum [35], soy isoflavones,
such as genistein and daidzein, in rat plasma [36], all by direct injection of
the sample matrix.
The mixed-function column consists of hydrophilic polyoxyethylene groups
(long chain) and hydrophobic phenyl groups (short chain) bonded to a
polymer-coated silica surface to offer two separation processes: protein
removal and analyte fractionation [45, 46]. The role of the separation on the
polymer-coated mixed-function (PMCF) phase was to exclude proteins due to
their size and concentrate target substances based on a reversed-phase
retention mechanism from a large volume of biological fluids. The samples
are first delivered onto the PMCF column with a weak mobile phase (less
than 10% organic phase at a pH greater than 6) to prevent protein
Figure 5.1 (A) Column-switching setup for dual-column direct plasma injection system, initialvalve-switching position. (B) Valve-switching position, desorption, separation, and transfer of theanalytes to a tandem mass spectrometer.
154 Using Mass Spectrometry for Drug Metabolism Studies
Copyright © 2005 CRC Press, LLC

7/21/2019 Using Mass Spectrometry for Drug Metabolism Studies
http://slidepdf.com/reader/full/using-mass-spectrometry-for-drug-metabolism-studies 162/362
precipitation. The surface structure of the PCMF was designed to allow large-
molecular-mass compounds to pass through the column due to the restricted
access to the surface formed by the longer chain with a hydrophilic group at the
end. The small molecules are retained by interacting with the hydrophobicgroups and are eluted to the detector with a stronger mobile phase (less than
10% aqueous solvent) via reversed-phase chromatographic separation. The
PCMF column was not expected to produce plate numbers as large as regular
analytical columns. However, it provides sufficient separation capability for
targeted compounds with MS/MS detection and is superior to an ADS column
in terms of chromatographic power. Direct plasma injection using a single
ADS column (without coupling to an analytical column) for quantitative
analysis of a few drug candidates was tested in our laboratory and it was found
to provide acceptable results. However, in the absence of adequatechromatography during the HPLC–MS/MS procedure, the ionization of the
administrated drugs may be suppressed by non-drug-related co-eluting
components in the complex biological samples [2, 6] or mass spectral
interference may occur from their biotransformation products such as the
acylglucuronide from an acid drug [47].
A simple and efficient direct plasma injection system using a single mixed-
function column HPLC–MS/MS procedure for the determination of a drug
discovery compound was successfully developed in our laboratory [37]. In this
method, untreated plasma samples were directly injected onto a polymer-coated mixed-function (PCMF) column for both the sample extraction and
analyte separation steps. This dual phase column allows proteins and other
macromolecules to pass through the column due to restricted access to the
surface of the packing materials while retaining the drug molecules on the
bonded reversed-phase absorbent. A 10- to 80-mL portion of the diluted plasma
sample (diluted with water containing internal standard in a 1:3 ratio) was
transferred and injected by the autosampler onto the CAPCELL MF C8
column (Phenomenex) with a largely aqueous mobile phase [4 mM ammonium
acetate in water–acetonitrile (90:10)] at a consistent flow-rate of 1–1.2 mL/min.
The post-column switching valve was first diverted to waste to remove the
macromolecules from the plasma matrix, then after 1.5 min, the valve was
switched to deliver the flow to a tandem mass spectrometer and a linear
gradient from 0 to 95% organic mobile phase [4 mM ammonium acetate in
water–acetonitrile (10:90)] was run over 1 min, then held for 2 min to elute and
separate all the analytes. The separation stages were followed by the
equilibration stage with the valve switched back to waste and mobile phase
changed from organic to aqueous mobile phase. The retention times for
analytes and internal standard were less than 3.5 min depending on the
gradient conditions. The total run cycle time was less than 5 min. Figure 5.2
compares the concepts of simultaneous or sequential process using single-
column or coupled-column modes for direct HPLC–MS/MS assays, respec-
tively. In a comparative study, the sensitivity of the test compound obtained
by the single column method was about four times higher than that obtained
by the coupled-column approach [37].
Direct Plasma Analysis Systems 155
Copyright © 2005 CRC Press, LLC
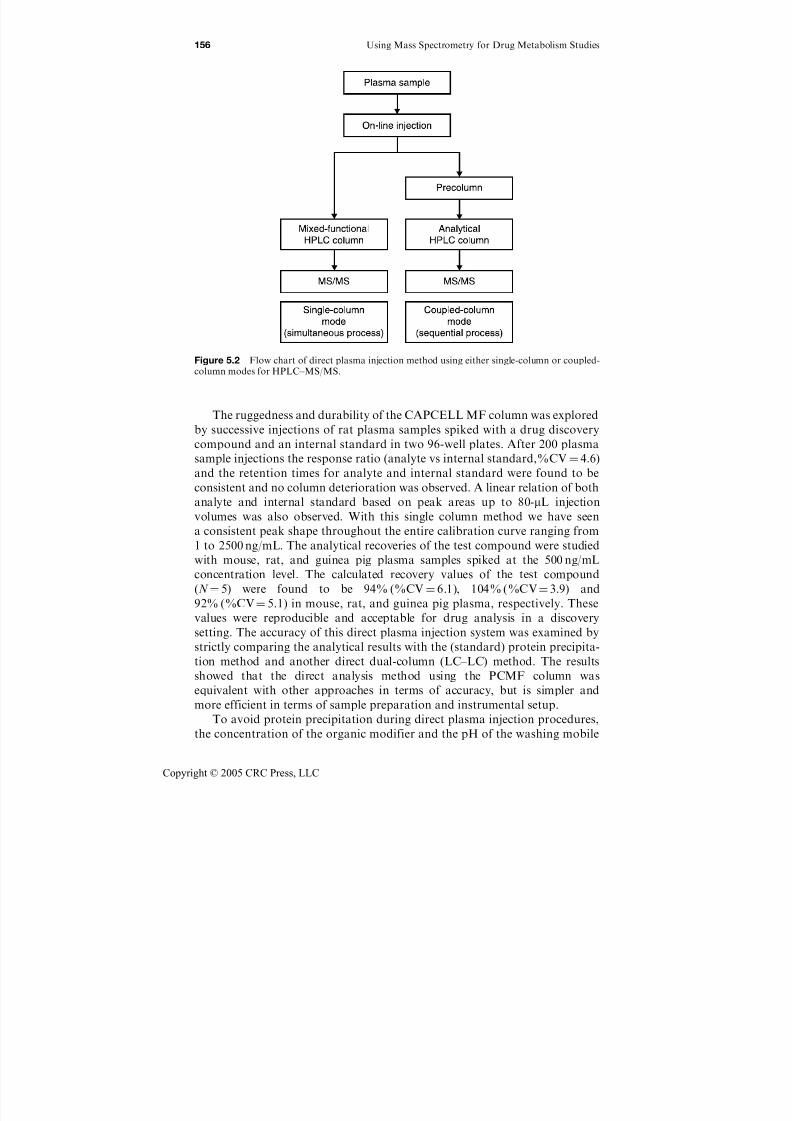
7/21/2019 Using Mass Spectrometry for Drug Metabolism Studies
http://slidepdf.com/reader/full/using-mass-spectrometry-for-drug-metabolism-studies 163/362
The ruggedness and durability of the CAPCELL MF column was explored
by successive injections of rat plasma samples spiked with a drug discovery
compound and an internal standard in two 96-well plates. After 200 plasma
sample injections the response ratio (analyte vs internal standard,%CV¼ 4.6)
and the retention times for analyte and internal standard were found to be
consistent and no column deterioration was observed. A linear relation of both
analyte and internal standard based on peak areas up to 80-mL injection
volumes was also observed. With this single column method we have seen
a consistent peak shape throughout the entire calibration curve ranging from
1 to 2500 ng/mL. The analytical recoveries of the test compound were studied
with mouse, rat, and guinea pig plasma samples spiked at the 500 ng/mL
concentration level. The calculated recovery values of the test compound
(N ¼ 5) were found to be 94% (%CV¼ 6.1), 104% (%CV¼ 3.9) and
92% (%CV¼ 5.1) in mouse, rat, and guinea pig plasma, respectively. These
values were reproducible and acceptable for drug analysis in a discovery
setting. The accuracy of this direct plasma injection system was examined by
strictly comparing the analytical results with the (standard) protein precipita-
tion method and another direct dual-column (LC–LC) method. The results
showed that the direct analysis method using the PCMF column was
equivalent with other approaches in terms of accuracy, but is simpler and
more efficient in terms of sample preparation and instrumental setup.
To avoid protein precipitation during direct plasma injection procedures,
the concentration of the organic modifier and the pH of the washing mobile
Figure 5.2 Flow chart of direct plasma injection method using either single-column or coupled-column modes for HPLC–MS/MS.
156 Using Mass Spectrometry for Drug Metabolism Studies
Copyright © 2005 CRC Press, LLC
7/21/2019 Using Mass Spectrometry for Drug Metabolism Studies
http://slidepdf.com/reader/full/using-mass-spectrometry-for-drug-metabolism-studies 164/362
phase applied for the sample-loading step must be non-denaturing. The use of
a first wash bottle filled with pure water and a second one with 50% methanol
in water for cleaning the injection needle is suggested both to prevent protein
precipitation and to avoid carry-over from previous injections. It has beensuggested that trifluoroethanol is an effective reagent for removing the build-
up of proteins in reversed-phase columns [48]. We found that trifluoroethanol
was also effective in restoring the performance of a PCMF column after
multiple direct plasma injections.
It is extremely important to learn about circulating metabolites in plasma
because they may explain pharmacodynamic or toxicological effects as well as
suggest further chemical structure modifications during the lead optimization
process for new drug discovery [38]. For example, in our recent report [38],
we used the direct HPLC–MS/MS method using a single PCMF column toseparate the dosed compound and its hydroxyl metabolites in plasma samples
in order to provide metabolite profiling information. These metabolites were
further characterized based on their MS/MS fragmentation patterns and NMR
spectra.
Two approaches for providing high throughput pharmacokinetic screening,
are cassette dosing (N-in-one dosing) [49] and sample pooling [39, 40]. While
cassette dosing seems to be an efficient way to simultaneously screen multiple
new chemical entities, the potential for drug–drug interactions is a concern for
this technique even at a low dose [50]. Alternately, sample pooling followingone-in-one dosing provides a smaller number of study samples to be assayed
while still generating substantial PK information.
Sample pooling techniques demand more sensitive and selective bioanalyt-
ical assays due to the dilution that occurs when combining plasma samples for
simultaneous determination of multiple drug molecules. The large sample
loading capacity (over 80mL) of the PCMF column results in enhanced
sensitivity, which can compensate for the dilution factor of pooled plasma
samples. This is one of the advantages of using direct plasma injection
procedure in combination with sample pooling technique [40]. The applica-
bility of simultaneous determination of six drug candidates and one internal
standard in a pooled study rat plasma sample using the PCMF column method
was demonstrated recently by Hsieh et al. [40].
The PCMF column can be coupled either to atmospheric pressure chemical
ionization (APCI), electrospray ionization (ESI) or atmospheric pressure
photoionization (APPI) MS (for more information on APPI, see Chapter 9)
sources and a tandem mass spectrometer for the quantitative determination of
drug molecules [40]. No discrepancy was observed in terms of assay accuracy
between the APCI and the ESI interfaces coupled to the tandem mass
spectrometer. In a separate study, we also compared analytical results obtained
from the traditional method using protein precipitation and off-line SPE
procedures and the direct injection method for monkey plasma analysis by
HPLC–MS/MS. Monkey plasma samples containing two analytes were
obtained from pharmacodynamic experiments that were important studies
in selecting biologically active lead compounds for a drug discovery project.
Direct Plasma Analysis Systems 157
Copyright © 2005 CRC Press, LLC
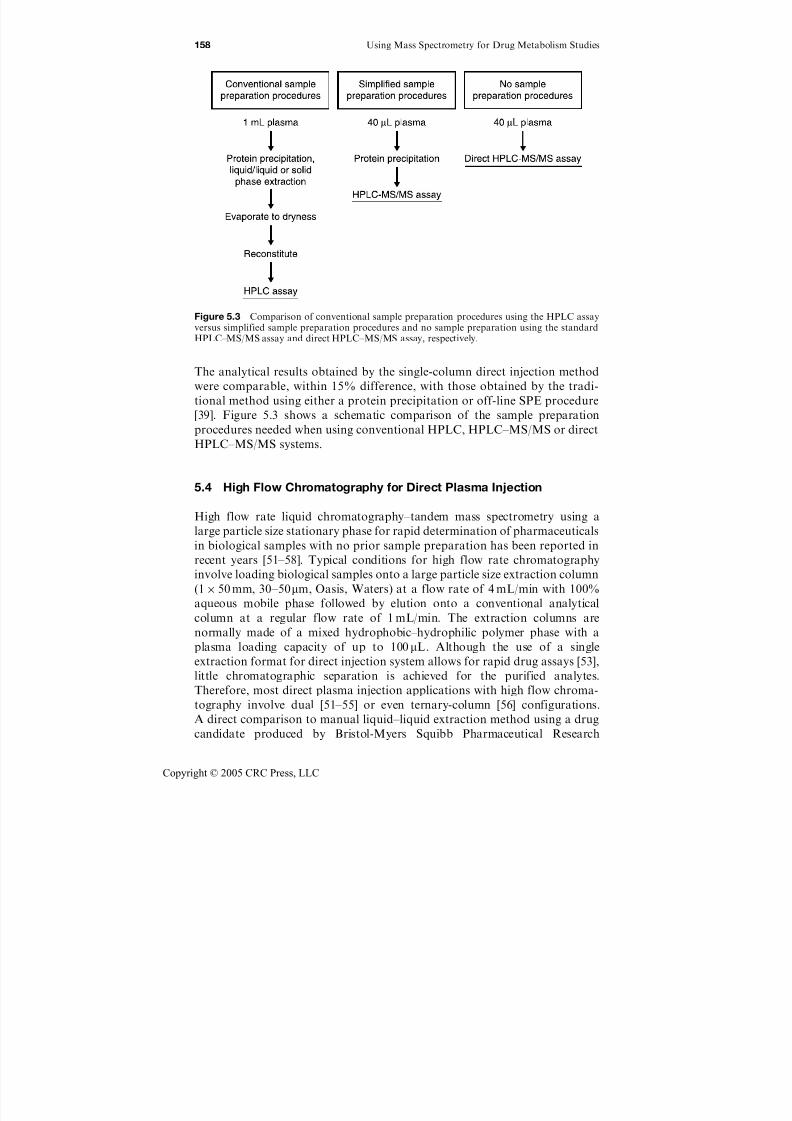
7/21/2019 Using Mass Spectrometry for Drug Metabolism Studies
http://slidepdf.com/reader/full/using-mass-spectrometry-for-drug-metabolism-studies 165/362
The analytical results obtained by the single-column direct injection method
were comparable, within 15% difference, with those obtained by the tradi-tional method using either a protein precipitation or off-line SPE procedure
[39]. Figure 5.3 shows a schematic comparison of the sample preparation
procedures needed when using conventional HPLC, HPLC–MS/MS or direct
HPLC–MS/MS systems.
5.4 High Flow Chromatography for Direct Plasma Injection
High flow rate liquid chromatography–tandem mass spectrometry using a
large particle size stationary phase for rapid determination of pharmaceuticals
in biological samples with no prior sample preparation has been reported in
recent years [51–58]. Typical conditions for high flow rate chromatography
involve loading biological samples onto a large particle size extraction column
(1 50 mm, 30–50mm, Oasis, Waters) at a flow rate of 4 mL/min with 100%
aqueous mobile phase followed by elution onto a conventional analytical
column at a regular flow rate of 1 mL/min. The extraction columns are
normally made of a mixed hydrophobic–hydrophilic polymer phase with a
plasma loading capacity of up to 100 mL. Although the use of a single
extraction format for direct injection system allows for rapid drug assays [53],
little chromatographic separation is achieved for the purified analytes.
Therefore, most direct plasma injection applications with high flow chroma-
tography involve dual [51–55] or even ternary-column [56] configurations.
A direct comparison to manual liquid–liquid extraction method using a drug
candidate produced by Bristol-Myers Squibb Pharmaceutical Research
Figure 5.3 Comparison of conventional sample preparation procedures using the HPLC assayversus simplified sample preparation procedures and no sample preparation using the standardHPLC–MS/MS assay and direct HPLC–MS/MS assay, respectively.
158 Using Mass Spectrometry for Drug Metabolism Studies
Copyright © 2005 CRC Press, LLC

7/21/2019 Using Mass Spectrometry for Drug Metabolism Studies
http://slidepdf.com/reader/full/using-mass-spectrometry-for-drug-metabolism-studies 166/362
Institute was described recently by Jemal et al. [54]. The total analysis time for
both methods was 2.0 min per sample. The accuracy and inter- and intra-day
precision obtained from the quality control samples were less than 10% for
both methods. The human pharmacokinetic results obtained by both methodswere comparable. However, the sample preparation time for the direct
injection method was about one quarter of the time required for liquid–liquid
extraction approach.
High flow rate direct-injection systems have been employed in support of
in vivo pharmacokinetic studies for multiple components such as olanzapine,
clozapine, N -desmethylclozapine [51], pravastatin and its positional isomer
[53], aminopterin, apomorphine, benzoylecgonine, carbamazepine, temazepam
[55], amitriptyline, nortriptyline, doxepin, dosulepin, dibenzepin, opipramol,
and melitracen [57]. Furthermore, the introduction of multiple sprayerinterfaces to mass spectrometers provides the potential for even higher
throughput. By combining four extraction columns in parallel to a four-way
multiple sprayer interface to the mass spectrometer, Bayliss et al. [52] were able
to monitor an isoquinoline drug from four plasma samples simultaneously,
at low ng/mL concentrations without any sample preparation and with a
throughput of up to 120 samples per hour.
Wu and co-workers [49] described the application of turbulent flow
chromatography coupled to a tandem mass spectrometer for direct pharma-
cokinetic screening using cassette dosing (14-in-1). To avoid column blockageresulting from protein precipitation by the organic mobile phase, after each
injection the aqueous solvent was first used to wash away the plasma residue
before washing with an organic solvent. Ten marketed drugs, including
alprazolam, oxazepam, temazepam, estazolam, triprolidine, phentolamine,
carbamazepine, fenfluramine, puromycin, haloperidol, and bromazepam, were
used to evaluate the turbulent-flow column-switching system for direct plasma
injection assays. On the basis of their assay results for a large number of
compounds [49], this turbulent-flow column-switching method was found to be
applicable to poorly water soluble and highly protein bound compounds. For
compounds that show extremely strong protein binding, some modifications
during sample loading or preparation to the turbulent flow chromatography
method were suggested. For example, the use of a low-flow (0.5 mL/min)
loading step prior to high-flow washing step to allow more contact time
between the analytes and extract sorbent or acidification of the plasma sample
in 0.5% formic acid to reduce protein binding were recommended. As a good
example, the use of turbulent flow chromatography–tandem mass spectrome-
try for the rapid, direct determination of an isoquinoline compound in plasma
and serum samples was reported [58].
5.5 Direct Monolithic Silica Chromatographic Systems
A useful approach to enhance column efficiency (smaller H ) is to increase the
column permeability, K ¼L/P, where , , L, andP are linear velocity of
Direct Plasma Analysis Systems 159
Copyright © 2005 CRC Press, LLC
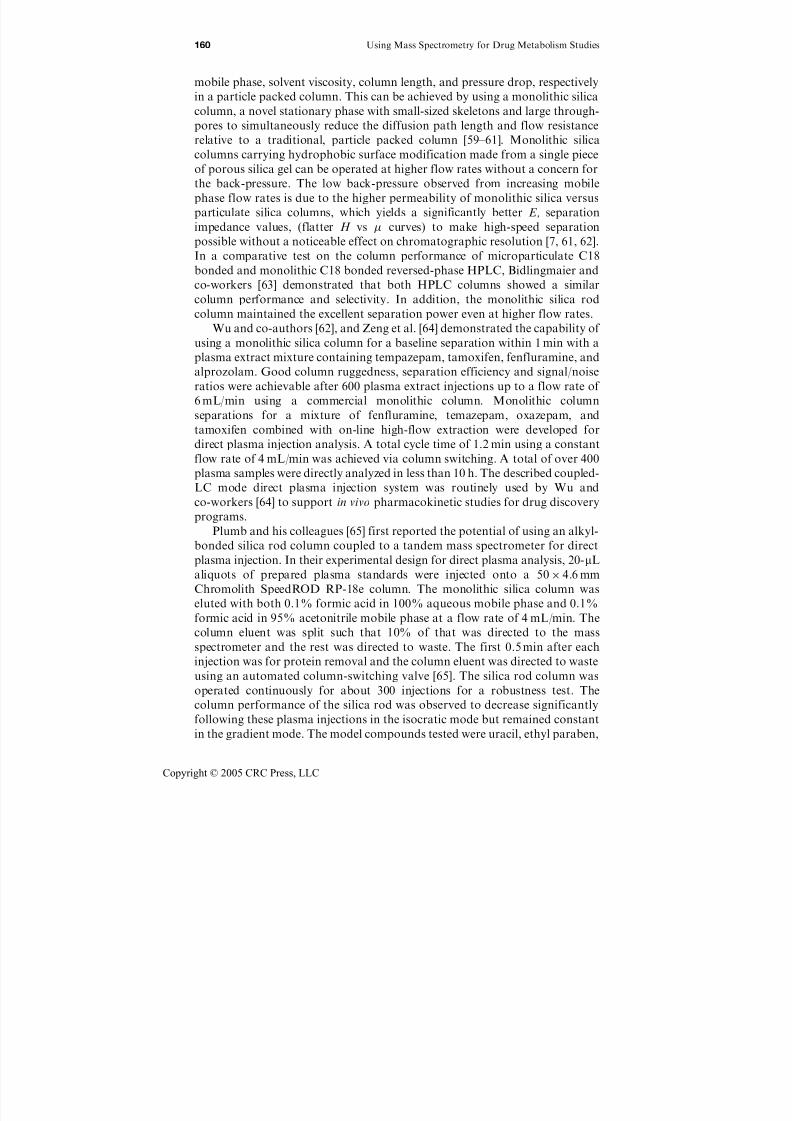
7/21/2019 Using Mass Spectrometry for Drug Metabolism Studies
http://slidepdf.com/reader/full/using-mass-spectrometry-for-drug-metabolism-studies 167/362
mobile phase, solvent viscosity, column length, and pressure drop, respectively
in a particle packed column. This can be achieved by using a monolithic silica
column, a novel stationary phase with small-sized skeletons and large through-
pores to simultaneously reduce the diffusion path length and flow resistancerelative to a traditional, particle packed column [59–61]. Monolithic silica
columns carrying hydrophobic surface modification made from a single piece
of porous silica gel can be operated at higher flow rates without a concern for
the back-pressure. The low back-pressure observed from increasing mobile
phase flow rates is due to the higher permeability of monolithic silica versus
particulate silica columns, which yields a significantly better E, separation
impedance values, (flatter H vs curves) to make high-speed separation
possible without a noticeable effect on chromatographic resolution [7, 61, 62].
In a comparative test on the column performance of microparticulate C18bonded and monolithic C18 bonded reversed-phase HPLC, Bidlingmaier and
co-workers [63] demonstrated that both HPLC columns showed a similar
column performance and selectivity. In addition, the monolithic silica rod
column maintained the excellent separation power even at higher flow rates.
Wu and co-authors [62], and Zeng et al. [64] demonstrated the capability of
using a monolithic silica column for a baseline separation within 1 min with a
plasma extract mixture containing tempazepam, tamoxifen, fenfluramine, and
alprozolam. Good column ruggedness, separation efficiency and signal/noise
ratios were achievable after 600 plasma extract injections up to a flow rate of 6 mL/min using a commercial monolithic column. Monolithic column
separations for a mixture of fenfluramine, temazepam, oxazepam, and
tamoxifen combined with on-line high-flow extraction were developed for
direct plasma injection analysis. A total cycle time of 1.2 min using a constant
flow rate of 4 mL/min was achieved via column switching. A total of over 400
plasma samples were directly analyzed in less than 10 h. The described coupled-
LC mode direct plasma injection system was routinely used by Wu and
co-workers [64] to support in vivo pharmacokinetic studies for drug discovery
programs.
Plumb and his colleagues [65] first reported the potential of using an alkyl-
bonded silica rod column coupled to a tandem mass spectrometer for direct
plasma injection. In their experimental design for direct plasma analysis, 20-mL
aliquots of prepared plasma standards were injected onto a 50 4.6 mm
Chromolith SpeedROD RP-18e column. The monolithic silica column was
eluted with both 0.1% formic acid in 100% aqueous mobile phase and 0.1%
formic acid in 95% acetonitrile mobile phase at a flow rate of 4 mL/min. The
column eluent was split such that 10% of that was directed to the mass
spectrometer and the rest was directed to waste. The first 0.5 min after each
injection was for protein removal and the column eluent was directed to waste
using an automated column-switching valve [65]. The silica rod column was
operated continuously for about 300 injections for a robustness test. The
column performance of the silica rod was observed to decrease significantly
following these plasma injections in the isocratic mode but remained constant
in the gradient mode. The model compounds tested were uracil, ethyl paraben,
160 Using Mass Spectrometry for Drug Metabolism Studies
Copyright © 2005 CRC Press, LLC

7/21/2019 Using Mass Spectrometry for Drug Metabolism Studies
http://slidepdf.com/reader/full/using-mass-spectrometry-for-drug-metabolism-studies 168/362
butyl paraben, naphthalene, and anthracene. An example showing the
importance of chromatographic resolution for direct plasma injection system
by using paracetamol and its glucuronide metabolite was also illustrated [65].
We then modified the aforementioned procedure by employing a flowprogramming technique and a monolithic silica column for the high-speed
direct determination of a drug discovery compound and its major circulating
amine metabolite (M-72) in rat plasma with a 1-min runtime [66]. A 10-mL
portion of the diluted plasma sample (diluted 1:1 with water containing the
internal standard) was injected by the autosampler onto the monolithic silica
C18 column. The switching valve was first diverted to waste for the removal of
the macromolecules from the plasma matrix at a high flow rate of 8 mL/min for
0.5 min with an aqueous mobile phase. The valve was then switched to the mass
spectrometer and a fast mobile phase and flow rate gradient from 0 to 100%organic mobile phase and from 8 mL/min to 1.2 mL/min was initiated to elute
and separate the analytes. The separation stages were followed by the
equilibration stage with the divert valve switched back to the waste and the
mobile phase changed from organic to aqueous. Figure 5.4 demonstrates that
the retention time and band width remain unchanged with increasing injection
volumes. After 200 plasma injections on a 50 4.6 mm monolithic silica
column, consistent column efficiency of close to 39,000 theoretical plates/m
and reproducible retention times for the analytes were observed as shown in
Figure 5.5. The apparent on-column recoveries of 12 test compounds in ratplasma samples were greater than 90%. The described fast direct plasma
injection method was tested over a 3-day period with the inter-day coefficient
of variation (CV) of less than 15% for both analytes [66].
It is important to be able to simultaneously assay for bioactive metabolites
to help explain the observed pharmacokinetic or toxicological behavior as well
as to suggest further chemical structure modifications for drug discovery
programs. The direct monolithic column HPLC–MS/MS method was also
applied to the simultaneous determination of a lead compound and its amine
Figure 5.4 Direct monolithic column SRM chromatograms of the compound I after 10mL,20mL, 30mL and 40 mL plasma injection. Adapted from Hsieh et al. Anal Chem, 75(8), 1812, 2003. 2003 with permission from American Chemical Society.
Direct Plasma Analysis Systems 161
Copyright © 2005 CRC Press, LLC
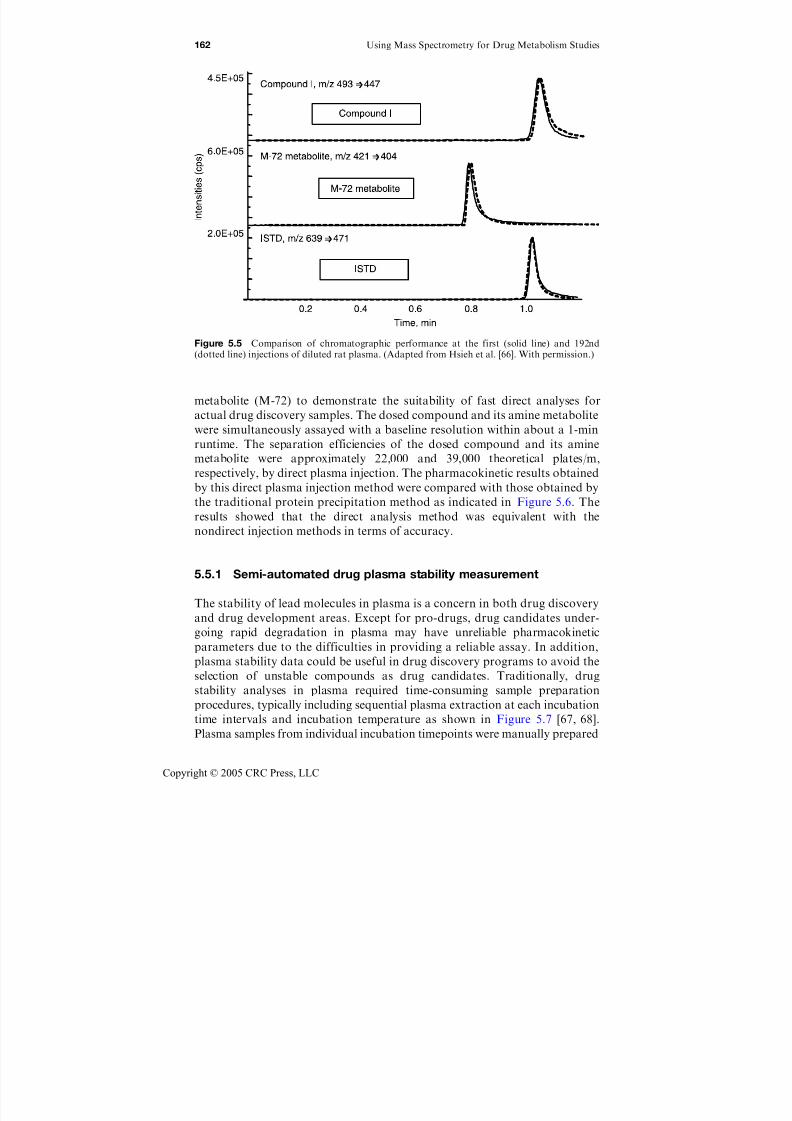
7/21/2019 Using Mass Spectrometry for Drug Metabolism Studies
http://slidepdf.com/reader/full/using-mass-spectrometry-for-drug-metabolism-studies 169/362
metabolite (M-72) to demonstrate the suitability of fast direct analyses for
actual drug discovery samples. The dosed compound and its amine metabolite
were simultaneously assayed with a baseline resolution within about a 1-min
runtime. The separation efficiencies of the dosed compound and its amine
metabolite were approximately 22,000 and 39,000 theoretical plates/m,
respectively, by direct plasma injection. The pharmacokinetic results obtained
by this direct plasma injection method were compared with those obtained by
the traditional protein precipitation method as indicated in Figure 5.6. The
results showed that the direct analysis method was equivalent with the
nondirect injection methods in terms of accuracy.
5.5.1 Semi-automated drug plasma stability measurement
The stability of lead molecules in plasma is a concern in both drug discovery
and drug development areas. Except for pro-drugs, drug candidates under-
going rapid degradation in plasma may have unreliable pharmacokinetic
parameters due to the difficulties in providing a reliable assay. In addition,
plasma stability data could be useful in drug discovery programs to avoid the
selection of unstable compounds as drug candidates. Traditionally, drug
stability analyses in plasma required time-consuming sample preparation
procedures, typically including sequential plasma extraction at each incubation
time intervals and incubation temperature as shown in Figure 5.7 [67, 68].
Plasma samples from individual incubation timepoints were manually prepared
Figure 5.5 Comparison of chromatographic performance at the first (solid line) and 192nd(dotted line) injections of diluted rat plasma. (Adapted from Hsieh et al. [66]. With permission.)
162 Using Mass Spectrometry for Drug Metabolism Studies
Copyright © 2005 CRC Press, LLC
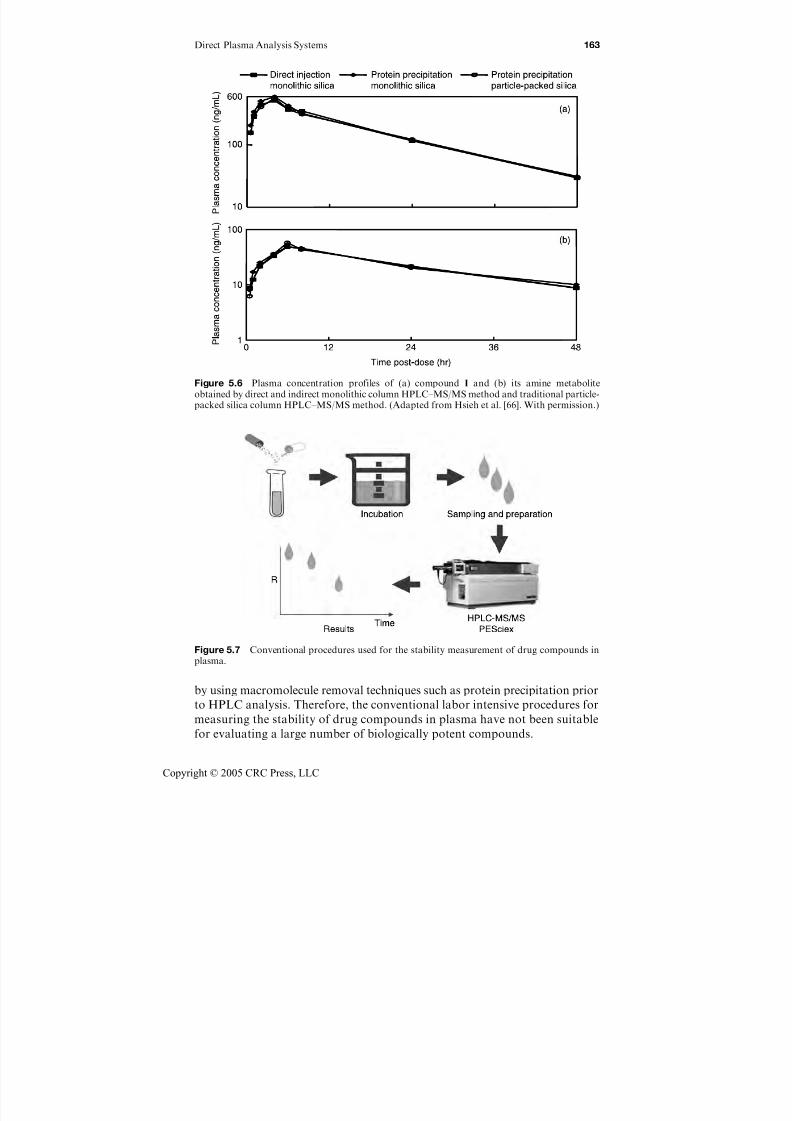
7/21/2019 Using Mass Spectrometry for Drug Metabolism Studies
http://slidepdf.com/reader/full/using-mass-spectrometry-for-drug-metabolism-studies 170/362
by using macromolecule removal techniques such as protein precipitation prior
to HPLC analysis. Therefore, the conventional labor intensive procedures for
measuring the stability of drug compounds in plasma have not been suitable
for evaluating a large number of biologically potent compounds.
Figure 5.7 Conventional procedures used for the stability measurement of drug compounds inplasma.
Figure 5.6 Plasma concentration profiles of (a) compound I and (b) its amine metaboliteobtained by direct and indirect monolithic column HPLC–MS/MS method and traditional particle-packed silica column HPLC–MS/MS method. (Adapted from Hsieh et al. [66]. With permission.)
Direct Plasma Analysis Systems 163
Copyright © 2005 CRC Press, LLC
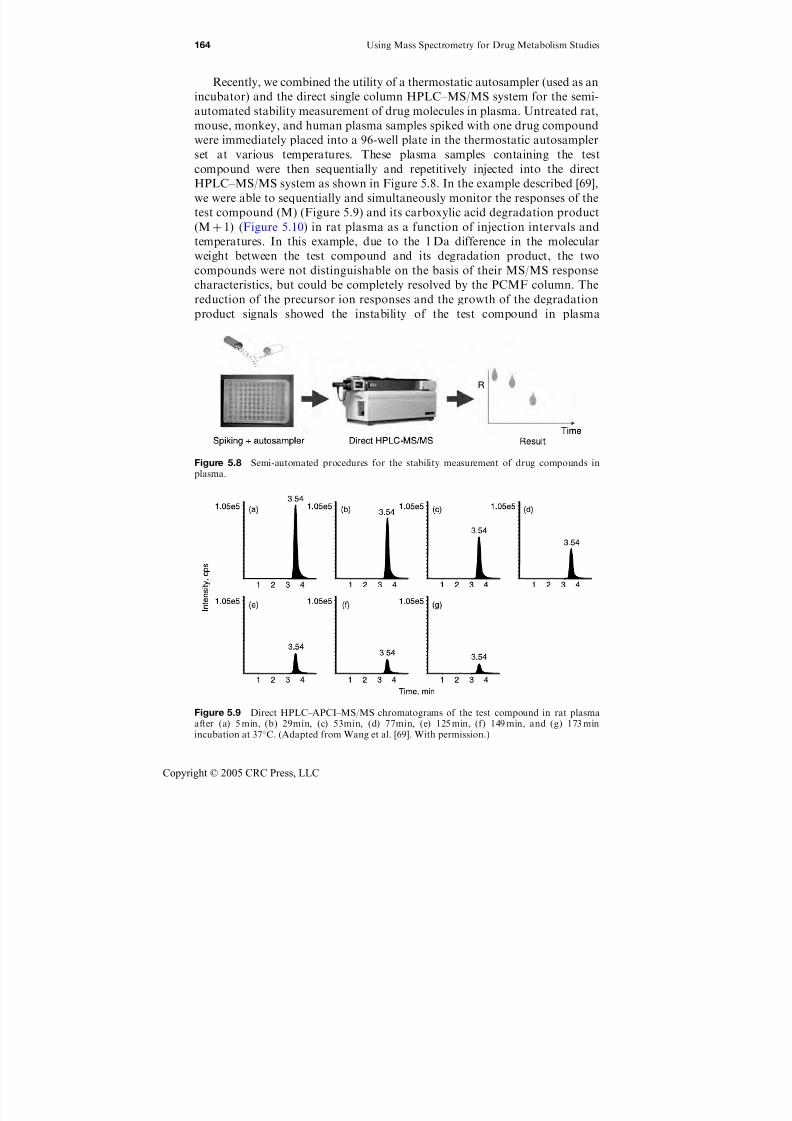
7/21/2019 Using Mass Spectrometry for Drug Metabolism Studies
http://slidepdf.com/reader/full/using-mass-spectrometry-for-drug-metabolism-studies 171/362
Recently, we combined the utility of a thermostatic autosampler (used as an
incubator) and the direct single column HPLC–MS/MS system for the semi-
automated stability measurement of drug molecules in plasma. Untreated rat,
mouse, monkey, and human plasma samples spiked with one drug compoundwere immediately placed into a 96-well plate in the thermostatic autosampler
set at various temperatures. These plasma samples containing the test
compound were then sequentially and repetitively injected into the direct
HPLC–MS/MS system as shown in Figure 5.8. In the example described [69],
we were able to sequentially and simultaneously monitor the responses of the
test compound (M) (Figure 5.9) and its carboxylic acid degradation product
(Mþ 1) (Figure 5.10) in rat plasma as a function of injection intervals and
temperatures. In this example, due to the 1 Da difference in the molecular
weight between the test compound and its degradation product, the twocompounds were not distinguishable on the basis of their MS/MS response
characteristics, but could be completely resolved by the PCMF column. The
reduction of the precursor ion responses and the growth of the degradation
product signals showed the instability of the test compound in plasma
Figure 5.9 Direct HPLC–APCI–MS/MS chromatograms of the test compound in rat plasmaafter (a) 5 min, (b) 29min, (c) 53min, (d) 77min, (e) 125 min, (f) 149 min, and (g) 173 minincubation at 37C. (Adapted from Wang et al. [69]. With permission.)
Figure 5.8 Semi-automated procedures for the stability measurement of drug compounds inplasma.
164 Using Mass Spectrometry for Drug Metabolism Studies
Copyright © 2005 CRC Press, LLC

7/21/2019 Using Mass Spectrometry for Drug Metabolism Studies
http://slidepdf.com/reader/full/using-mass-spectrometry-for-drug-metabolism-studies 172/362
(see Figure 5.11). The results of plasma stability of the test compounds
obtained by the manual method using a protein precipitation procedure and
the semi-automated direct injection method were found to be comparable [69].
We further investigated a cassette assay procedure for an even higher
throughput screen-type assay to simultaneously measure the stability of
multiple drug candidates in several plasma types [70]. The proposed ten-in-one
approach was shown to be reliable as a screen-type assay for semi-automated
plasma stability measurement and provided ten times greater sample
Figure 5.10 Direct HPLC–APCI–MS/MS chromatograms of the carboxylic acid metabolite inrat plasma after (a) 5 min, (b) 29 min, (c) 53 min, (d) 77 min, (e) 125 min, (f) 149 min, and (g)173 min. The incubation temperature was 37C. (Adapted from Wang et al. [69]. With permission.)
Figure 5.11 The disappearance of the test compound in rat plasma is correspondent to thegrowth of its Mþ 1 metabolite. (Adapted from Wang et al. [69]. With permission.)
Direct Plasma Analysis Systems 165
Copyright © 2005 CRC Press, LLC
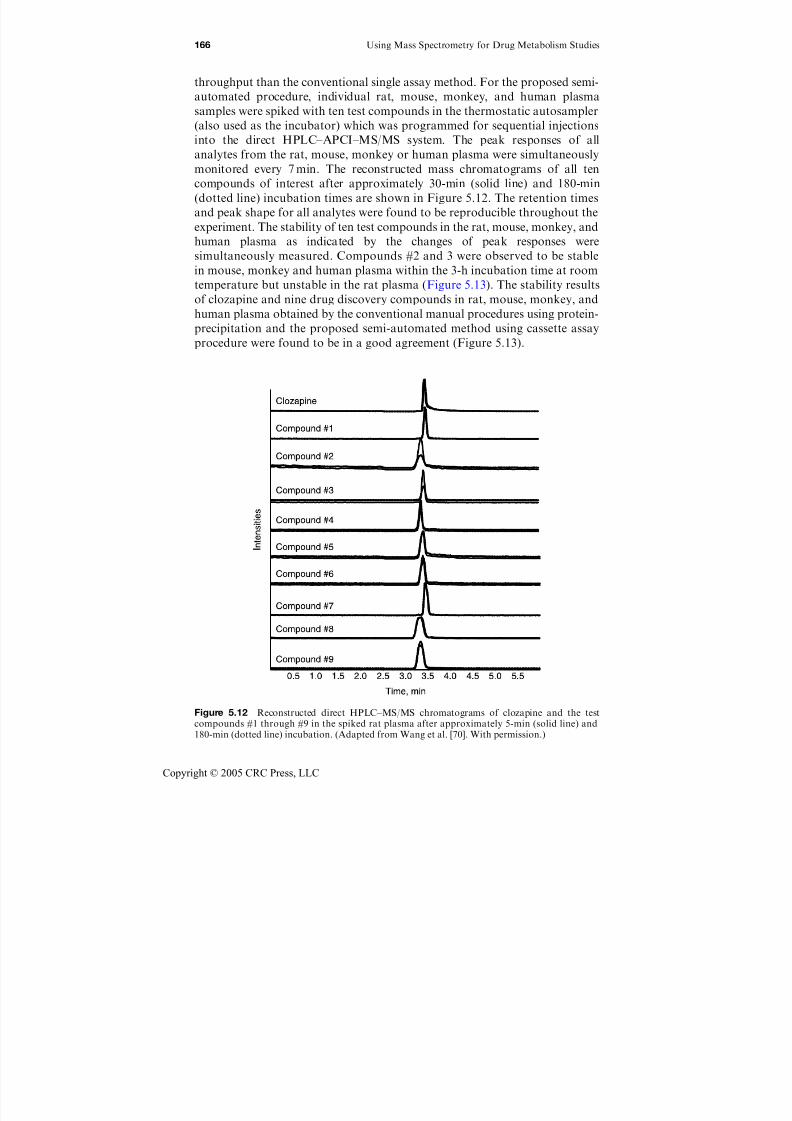
7/21/2019 Using Mass Spectrometry for Drug Metabolism Studies
http://slidepdf.com/reader/full/using-mass-spectrometry-for-drug-metabolism-studies 173/362
throughput than the conventional single assay method. For the proposed semi-
automated procedure, individual rat, mouse, monkey, and human plasma
samples were spiked with ten test compounds in the thermostatic autosampler
(also used as the incubator) which was programmed for sequential injectionsinto the direct HPLC–APCI–MS/MS system. The peak responses of all
analytes from the rat, mouse, monkey or human plasma were simultaneously
monitored every 7 min. The reconstructed mass chromatograms of all ten
compounds of interest after approximately 30-min (solid line) and 180-min
(dotted line) incubation times are shown in Figure 5.12. The retention times
and peak shape for all analytes were found to be reproducible throughout the
experiment. The stability of ten test compounds in the rat, mouse, monkey, and
human plasma as indicated by the changes of peak responses were
simultaneously measured. Compounds #2 and 3 were observed to be stablein mouse, monkey and human plasma within the 3-h incubation time at room
temperature but unstable in the rat plasma (Figure 5.13). The stability results
of clozapine and nine drug discovery compounds in rat, mouse, monkey, and
human plasma obtained by the conventional manual procedures using protein-
precipitation and the proposed semi-automated method using cassette assay
procedure were found to be in a good agreement (Figure 5.13).
Figure 5.12 Reconstructed direct HPLC–MS/MS chromatograms of clozapine and the testcompounds #1 through #9 in the spiked rat plasma after approximately 5-min (solid line) and180-min (dotted line) incubation. (Adapted from Wang et al. [70]. With permission.)
166 Using Mass Spectrometry for Drug Metabolism Studies
Copyright © 2005 CRC Press, LLC
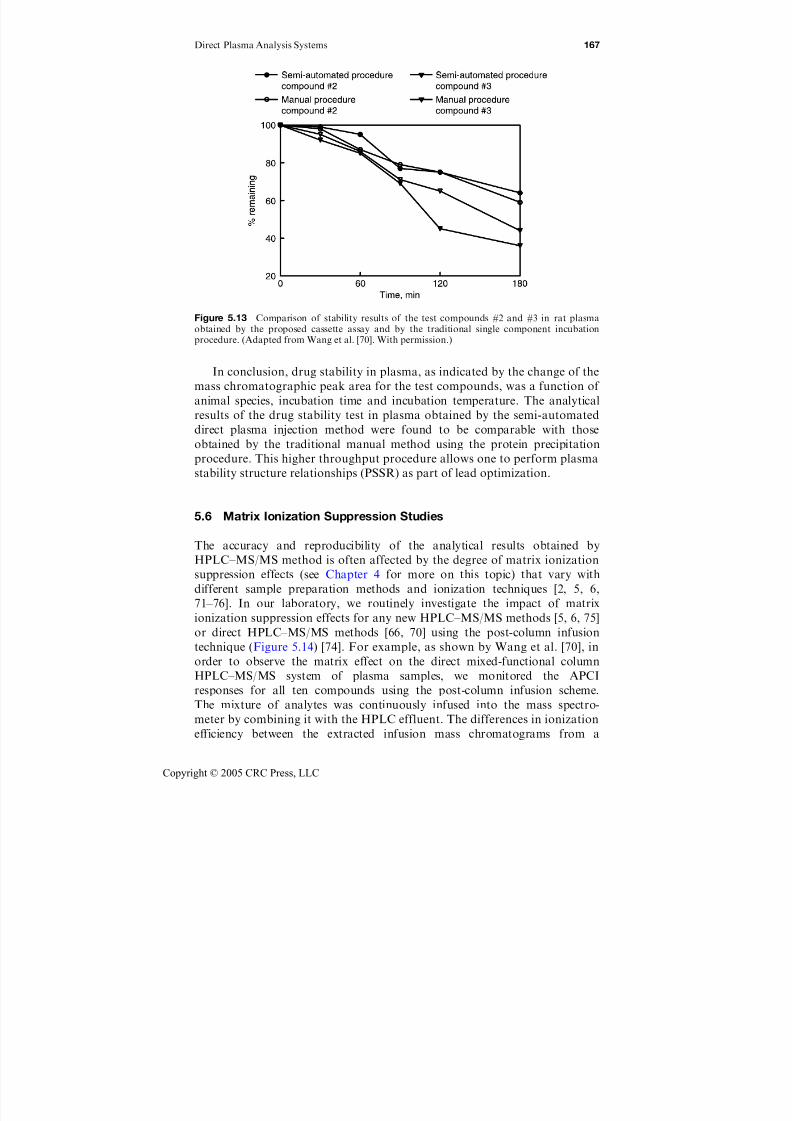
7/21/2019 Using Mass Spectrometry for Drug Metabolism Studies
http://slidepdf.com/reader/full/using-mass-spectrometry-for-drug-metabolism-studies 174/362
In conclusion, drug stability in plasma, as indicated by the change of the
mass chromatographic peak area for the test compounds, was a function of animal species, incubation time and incubation temperature. The analytical
results of the drug stability test in plasma obtained by the semi-automated
direct plasma injection method were found to be comparable with those
obtained by the traditional manual method using the protein precipitation
procedure. This higher throughput procedure allows one to perform plasma
stability structure relationships (PSSR) as part of lead optimization.
5.6 Matrix Ionization Suppression Studies
The accuracy and reproducibility of the analytical results obtained by
HPLC–MS/MS method is often affected by the degree of matrix ionization
suppression effects (see Chapter 4 for more on this topic) that vary with
different sample preparation methods and ionization techniques [2, 5, 6,
71–76]. In our laboratory, we routinely investigate the impact of matrix
ionization suppression effects for any new HPLC–MS/MS methods [5, 6, 75]
or direct HPLC–MS/MS methods [66, 70] using the post-column infusion
technique (Figure 5.14) [74]. For example, as shown by Wang et al. [70], in
order to observe the matrix effect on the direct mixed-functional column
HPLC–MS/MS system of plasma samples, we monitored the APCI
responses for all ten compounds using the post-column infusion scheme.
The mixture of analytes was continuously infused into the mass spectro-
meter by combining it with the HPLC effluent. The differences in ionization
efficiency between the extracted infusion mass chromatograms from a
Figure 5.13 Comparison of stability results of the test compounds #2 and #3 in rat plasmaobtained by the proposed cassette assay and by the traditional single component incubationprocedure. (Adapted from Wang et al. [70]. With permission.)
Direct Plasma Analysis Systems 167
Copyright © 2005 CRC Press, LLC
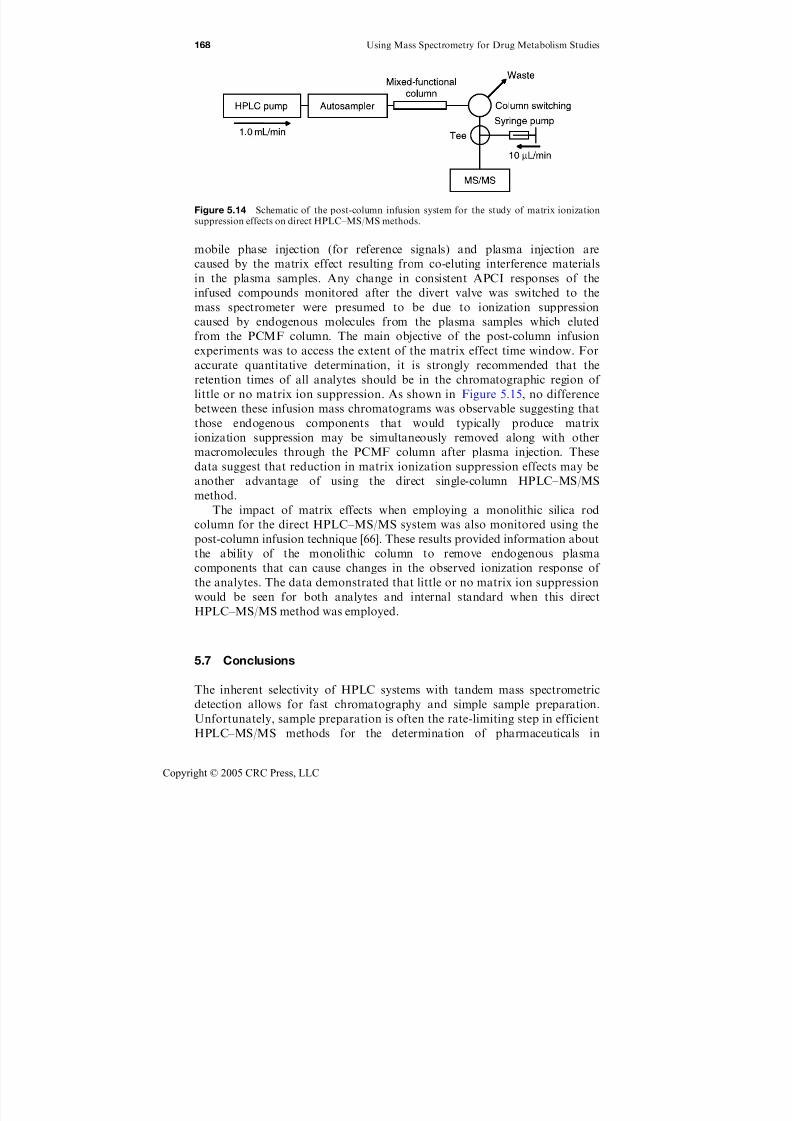
7/21/2019 Using Mass Spectrometry for Drug Metabolism Studies
http://slidepdf.com/reader/full/using-mass-spectrometry-for-drug-metabolism-studies 175/362
mobile phase injection (for reference signals) and plasma injection arecaused by the matrix effect resulting from co-eluting interference materials
in the plasma samples. Any change in consistent APCI responses of the
infused compounds monitored after the divert valve was switched to the
mass spectrometer were presumed to be due to ionization suppression
caused by endogenous molecules from the plasma samples which eluted
from the PCMF column. The main objective of the post-column infusion
experiments was to access the extent of the matrix effect time window. For
accurate quantitative determination, it is strongly recommended that the
retention times of all analytes should be in the chromatographic region of little or no matrix ion suppression. As shown in Figure 5.15, no difference
between these infusion mass chromatograms was observable suggesting that
those endogenous components that would typically produce matrix
ionization suppression may be simultaneously removed along with other
macromolecules through the PCMF column after plasma injection. These
data suggest that reduction in matrix ionization suppression effects may be
another advantage of using the direct single-column HPLC–MS/MS
method.
The impact of matrix effects when employing a monolithic silica rodcolumn for the direct HPLC–MS/MS system was also monitored using the
post-column infusion technique [66]. These results provided information about
the ability of the monolithic column to remove endogenous plasma
components that can cause changes in the observed ionization response of
the analytes. The data demonstrated that little or no matrix ion suppression
would be seen for both analytes and internal standard when this direct
HPLC–MS/MS method was employed.
5.7 Conclusions
The inherent selectivity of HPLC systems with tandem mass spectrometric
detection allows for fast chromatography and simple sample preparation.
Unfortunately, sample preparation is often the rate-limiting step in efficient
HPLC–MS/MS methods for the determination of pharmaceuticals in
Figure 5.14 Schematic of the post-column infusion system for the study of matrix ionizationsuppression effects on direct HPLC–MS/MS methods.
168 Using Mass Spectrometry for Drug Metabolism Studies
Copyright © 2005 CRC Press, LLC
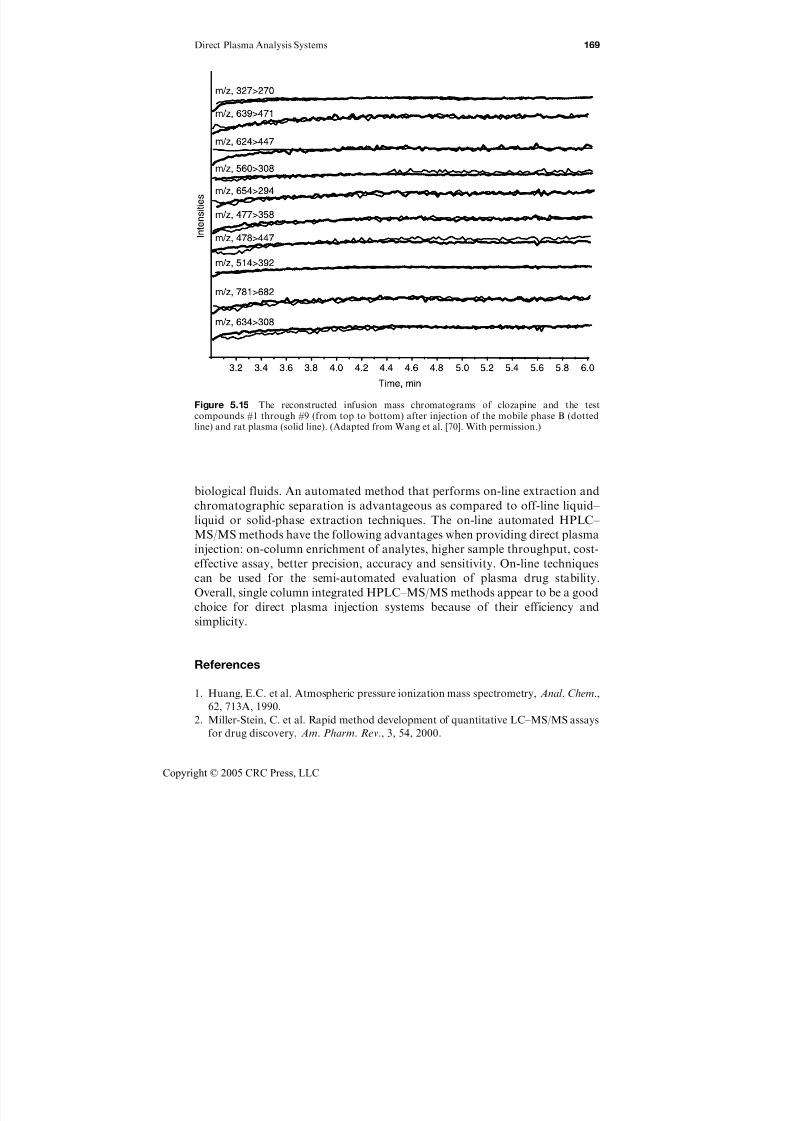
7/21/2019 Using Mass Spectrometry for Drug Metabolism Studies
http://slidepdf.com/reader/full/using-mass-spectrometry-for-drug-metabolism-studies 176/362
biological fluids. An automated method that performs on-line extraction and
chromatographic separation is advantageous as compared to off-line liquid– liquid or solid-phase extraction techniques. The on-line automated HPLC–
MS/MS methods have the following advantages when providing direct plasma
injection: on-column enrichment of analytes, higher sample throughput, cost-
effective assay, better precision, accuracy and sensitivity. On-line techniques
can be used for the semi-automated evaluation of plasma drug stability.
Overall, single column integrated HPLC–MS/MS methods appear to be a good
choice for direct plasma injection systems because of their efficiency and
simplicity.
References
1. Huang, E.C. et al. Atmospheric pressure ionization mass spectrometry, Anal. Chem.,
62, 713A, 1990.
2. Miller-Stein, C. et al. Rapid method development of quantitative LC–MS/MS assays
for drug discovery, Am. Pharm. Rev., 3, 54, 2000.
Figure 5.15 The reconstructed infusion mass chromatograms of clozapine and the testcompounds #1 through #9 (from top to bottom) after injection of the mobile phase B (dottedline) and rat plasma (solid line). (Adapted from Wang et al. [70]. With permission.)
Direct Plasma Analysis Systems 169
Copyright © 2005 CRC Press, LLC
7/21/2019 Using Mass Spectrometry for Drug Metabolism Studies
http://slidepdf.com/reader/full/using-mass-spectrometry-for-drug-metabolism-studies 177/362
3. Cheng, Y., Lu, Z., and Neue, U., Ultrafast liquid chromatography/ultraviolet and
liquid chromatography/tandem mass spectrometric analysis, Rapid Commun. Mass
Spectrom., 15(2), 141, 2001.
4. Rule, G., Chapple, M., and Henion, J., A 384-well solid-phase extraction for LC/
MS/MS determination of methotrexate and its 7-hydroxy metabolite in human
urine and plasma, Anal. Chem., 73(3), 439, 2001.
5. Hsieh, Y. et al. Simultaneous fast HPLC–MS/MS analysis of drug candidates and
hydroxyl metabolites in plasma, J. Pharm. Biomed. Anal., 33(2), 251, 2003.
6. Hsieh, Y. et al. Quantitative screening and matrix effect studies of drug discovery
compounds in monkey plasma using fast-gradient liquid chromatography/tandem
mass spectrometry, Rapid Commun. Mass Spectrom., 15(24), 2481, 2001.
7. Hsieh, Y. et al. Simultaneous determination of a drug candidate and its metabolite
in rat plasma samples using ultrafast monolithic column high-performance liquid
chromatography/tandem mass spectrometry, Rapid Commun. Mass Spectrom.,16(10), 944, 2002.
8. Henion, J. et al. Sample preparation and analysis strategies for high throughput
LC/MS/MS analysis of biological samples, Am. Pharm. Rev., 3, 19, 2000.
9. Henion, J., Brewer, E., and Rule, G., Sample preparation for LC/MS/MS:
analyzing biological and environmental samples, Anal. Chem., 70(19), 650A, 1998.
10. Plumb, R.S. et al. Quantitative analysis of pharmaceuticals in biological fluids using
high-performance liquid chromatography coupled to mass spectrometry: a review,
Xenobiotica, 31(8–9), 599, 2001.
11. Powell, M.L. and Jemal, M., Rapid chromatography coupled with direct injection
LC/MS/MS for quantitative bioanalysis, Am. Pharm. Rev., 4(3), 63, 2001.12. Ackermann, B.L., Murphy, A.T., and Berna, M.J., The resurgence of column
switching techniques to facilitate rapid LC/MS/MS based bioanalysis in drug
discovery, Am. Pharm. Rev., 5(1), 54, 2002.
13. Boos, K.S. and Grimm, C., High-performance liquid chromatography integrated
solid-phase extraction using restricted access precolumn packings, Trends Anal.
Chem., 18, 175, 1999.
14. Barron, D. et al. Direct determination of anabolic steroids in human urine by on-
line solid-phase extraction/liquid chromatography/mass spectrometry, J. Mass
Spectrom., 31(3), 309, 1996.15. McLoughlin, D.A., Olah, T.V., and Gilbert, J.D., A direct technique for the
simultaneous determination of 10 drug candidates in plasma by liquid chromato-
graphy–atmospheric pressure chemical ionization mass spectrometry interfaced to a
Prospekt solid-phase extraction system, J. Pharm. Biomed. Anal., 15(12), 1893,
1997.
16. Bowers, G.D. et al. Automated SPE and tandem MS without HPLC columns for
quantifying drugs at the picogram level, LC – GC , 15, 48, 1997.
17. Needham, S.R. and Brown, P.R., The role of the column for the analysis of drugs
and other components by HPLC/ESI/MS: part II, Am. Pharm. Rev., 4(1), 79, 2001.
18. Muzic, R.F., Jr. et al. Solid-phase analysis method for (S )-[18
F]fluorocarazolol andits metabolites, J. Chromatogr., B: Biomed. Sci. Appl., 759(2), 355, 2001.
19. Weimann, A. and Bojesen, G., Analysis of tetracyclines in raw urine by column-
switching high-performance liquid chromatography and tandem mass spec-
trometry, J. Chromatogr., B: Biomed. Sci. Appl., 721(1), 47, 1999.
20. Koch, H.M., Gonzalez-Reche, L.M., and Angerer, J., On-line clean-up by
multidimensional liquid chromatography–electrospray ionization tandem mass
spectrometry for high throughput quantification of primary and secondary
170 Using Mass Spectrometry for Drug Metabolism Studies
Copyright © 2005 CRC Press, LLC
7/21/2019 Using Mass Spectrometry for Drug Metabolism Studies
http://slidepdf.com/reader/full/using-mass-spectrometry-for-drug-metabolism-studies 178/362
phthalate metabolites in human urine, J. Chromatogr., B: Analyt. Technol. Biomed.
Life Sci., 784(1), 169, 2003.
21. Baeyens, W.R. et al. Application of the restricted-access precolumn packing
material alkyl-diol silica in a column-switching system for the determination of
ketoprofen enantiomers in horse plasma, J. Chromatogr., A, 871(1–2), 153, 2000.
22. Mullett, W.M. et al. Bio-compatible in-tube solid-phase microextraction capillary
for the direct extraction and high-performance liquid chromatographic determina-
tion of drugs in human serum, J. Chromatogr., A, 963(1–2), 325, 2002.
23. Capka, V., Xu, Y., and Chen, Y.H., Stereoselective determination of tri-
hexyphenidyl in human serum by LC–ESI–MS, J. Pharm. Biomed. Anal., 21(3),
507, 1999.
24. Lamprecht, G. et al. Enantioselective analysis of (R)- and (S )-atenolol in urine
samples by a high-performance liquid chromatography column-switching setup,
J. Chromatogr., B: Biomed. Sci. Appl., 740(2), 219, 2000.25. Mullett, W.M. and Pawliszyn, J., Direct LC analysis of five benzodiazepines in
human urine and plasma using an ADS restricted access extraction column,
J. Pharm. Biomed. Anal., 26(5–6), 899, 2001.
26. Hogendoorn, E.A. et al. The potential of restricted access media columns as applied
in coupled-column LC/LC–TSP/MS/MS for the high-speed determination of target
compounds in serum. Application to the direct trace analysis of salbutamol and
clenbuterol, Anal. Chem., 70(7), 1362, 1998.
27. Petrovic, M., Tavazzi, S., and Barcelo, D., Column-switching system with restricted
access pre-column packing for an integrated sample cleanup and liquid chromato-
graphic–mass spectrometric analysis of alkylphenolic compounds and steroid sexhormones in sediment, J. Chromatogr., A, 971(1–2), 37, 2002.
28. Chiap, P. et al. Automated determination of pirlindole enantiomers in plasma by
on-line coupling of a pre-column packed with restricted access material to a chiral
liquid chromatographic column, J. Pharm. Biomed. Anal., 27(3–4), 447, 2002.
29. Ohman, D., Carlsson, B., and Norlander, B., On-line extraction using an alkyl-diol
silica precolumn for racemic citalopram and its metabolites in plasma. Results
compared with solid-phase extraction methodology, J. Chromatogr., B: Biomed.
Sci. Appl., 753(2), 365, 2001.
30. Marrubini, G. et al. Improved coupled column liquid chromatographicmethod for high-speed direct analysis of urinary trans, trans-muconic acid, as a
biomarker of exposure to benzene, J. Chromatogr., B: Biomed. Sci. Appl., 751(2),
331, 2001.
31. Hogendoorn, E.A. et al. Semi-permeable surface analytical reversed-phase
column for the improved trace analysis of acidic pesticides in water with
coupled-column reversed-phase liquid chromatography with UV detection.
Determination of bromoxynil and bentazone in surface water, J. Chromatogr., A,
858(1), 45, 1999.
32. Yu, Z. and Westerlund, D., Direct injection of large volumes of plasma in a column-
switching system for the analysis of local anaesthetics. I. Optimization of semi-permeable surface precolumns in the system and characterization of some
interference peaks, J. Chromatogr., A, 725(1), 137, 1996.
33. Needham, S.R., Cole, M.J., and Fouda, H.G., Direct plasma injection for high-
performance liquid chromatographic–mass spectrometric quantitation of the
anxiolytic agent CP-93 393, J. Chromatogr., B: Biomed. Sci. Appl., 718(1), 87, 1998.
34. Gustavson, K.E. et al. Novel use of a dual-zone restricted access sorbent: normal-
phase solid-phase extraction separation of methyl oleate from polynuclear aromatic
Direct Plasma Analysis Systems 171
Copyright © 2005 CRC Press, LLC

7/21/2019 Using Mass Spectrometry for Drug Metabolism Studies
http://slidepdf.com/reader/full/using-mass-spectrometry-for-drug-metabolism-studies 179/362
hydrocarbons stemming from semi-permeable membrane devices, J. Chromatogr.,
A, 883(1–2), 143, 2000.
35. Simon, V.A., Thiam, M.D., and Lipford, L.C., Determination of serum levels of
thirteen human immunodeficiency virus-suppressing drugs by high-performance
liquid chromatography, J. Chromatogr., A, 913(1–2), 447, 2001.
36. Doerge, D.R., Churchwell, M.I., and Delclos, K.B., On-line sample preparation
using restricted-access media in the analysis of the soy isoflavones, genistein and
daidzein, in rat serum using liquid chromatography electrospray mass spectrometry,
Rapid Commun. Mass Spectrom., 14(8), 673, 2000.
37. Hsieh, Y. et al. Direct analysis of plasma samples for drug discovery compounds
using mixed-function column liquid chromatography tandem mass spectrometry,
Rapid Commun. Mass Spectrom., 14(15), 1384, 2000.
38. Hsieh, Y. et al. Direct simultaneous analysis of plasma samples for a drug discovery
compound and its hydroxyl metabolite using mixed-function column liquidchromatography–tandem mass spectrometry, Analyst, 126(12), 2139, 2001.
39. Hsieh, Y. et al. Direct simultaneous determination of drug discovery compounds in
monkey plasma using mixed-function column liquid chromatography/tandem mass
spectrometry, J. Pharm. Biomed. Anal., 27(1–2), 285, 2002.
40. Hsieh, Y. et al. Direct cocktail analysis of drug discovery compounds in pooled
plasma samples using liquid chromatography–tandem mass spectrometry,
J. Chromatogr., B: Analyt. Technol. Biomed. Life Sci., 767(2), 353, 2002.
41. Chiap, P. et al. Use of a novel cation-exchange restricted-access material for
automated sample clean-up prior to the determination of basic drugs in plasma by
liquid chromatography, J. Chromatogr., A, 975(1), 145, 2002.42. van der Hoeven, R.A. et al. Liquid chromatography-mass spectrometry with on-line
solid-phase extraction by a restricted-access C18 precolumn for direct plasma and
urine injection, J. Chromatogr., A, 762(1–2), 193, 1997.
43. Keski-Hynnila, H. et al. Quantitation of entacapone glucuronide in rat plasma
by on-line coupled restricted access media column and liquid chromatography–
tandem mass spectrometry, J. Chromatogr., B: Biomed. Sci. Appl., 759(2), 227,
2001.
44. Umemura, T. et al. Direct injection determination of theophylline and caffeine in
blood serum by high-performance liquid chromatography using an ODS columncoated with a zwitterionic bile acid derivative, Analyst, 123(8), 1767, 1998.
45. Shirota, O. et al. Low concentration drug analysis by semi-microcolumn liquid
chromatography with a polymer-coated mixed-function precolumn, J. Microcol.,
Sep 7, 29, 1995.
46. Kanda, T. et al. Synthesis and characterization of polymer-coated mixed-functional
stationary phases with several different hydrophobic groups for direct analysis of
biological samples by liquid chromatography, J. Chromatogr., A, 722(1–2), 115,
1996.
47. Jemal, M. and Xia, Y.Q., The need for adequate chromatographic separation in the
quantitative determination of drugs in biological samples by high performanceliquid chromatography with tandem mass spectrometry, Rapid Commun. Mass
Spectrom., 13(2), 97, 1999.
48. Bhardwaj, S. and Day, R.A., Trifluoroethanol removes bound proteins from
reversed-phase columns, LC – GC , 17, 354, 1999.
49. Wu, J.T. et al. Direct plasma sample injection in multiple-component LC–MS–MS
assays for high-throughput pharmacokinetic screening, Anal. Chem., 72(1), 61,
2000.
172 Using Mass Spectrometry for Drug Metabolism Studies
Copyright © 2005 CRC Press, LLC
7/21/2019 Using Mass Spectrometry for Drug Metabolism Studies
http://slidepdf.com/reader/full/using-mass-spectrometry-for-drug-metabolism-studies 180/362
50. White, R.E. and Manitpisitkul, P., Pharmacokinetic theory of cassette dosing in
drug discovery screening, Drug Metab. Dispos., 29(7), 957, 2001.
51. Kollroser, M. and Schober, C., Direct-injection high performance liquid
chromatography ion trap mass spectrometry for the quantitative determination of
olanzapine, clozapine and N -desmethylclozapine in human plasma, Rapid Commun.
Mass Spectrom., 16(13), 1266, 2002.
52. Bayliss, M.K. et al. Parallel ultra-high flow rate liquid chromatography with mass
spectrometric detection using a multiplex electrospray source for direct, sensitive
determination of pharmaceuticals in plasma at extremely high throughput, Rapid
Commun. Mass Spectrom., 14(21), 2039, 2000.
53. Jemal, M. et al. The use of high-flow high performance liquid chromatography
coupled with positive and negative ion electrospray tandem mass spectrometry for
quantitative bioanalysis via direct injection of the plasma/serum samples, Rapid
Commun. Mass Spectrom., 12(19), 1389, 1998.54. Jemal, M. et al. Direct injection versus liquid–liquid extraction for plasma sample
analysis by high performance liquid chromatography with tandem mass spectro-
metry, Rapid Commun. Mass Spectrom., 13(21), 2125, 1999.
55. Zeng, H., Wu, J.T., and Unger, S.E., The investigation and the use of high flow
column-switching LC/MS/MS as a high-throughput approach for direct plasma
sample analysis of single and multiple components in pharmacokinetic studies,
J. Pharm. Biomed. Anal., 27(6), 967, 2002.
56. Xia, Y.Q. et al. Ternary-column system for high-throughput direct-injection
bioanalysis by liquid chromatography/tandem mass spectrometry, Rapid Commun.
Mass Spectrom., 14(2), 105, 2000.57. Kollroser, M. and Schober, C., Simultaneous determination of seven tricyclic
antidepressant drugs in human plasma by direct-injection HPLC–APCI–MS–MS
with an ion trap detector, Ther. Drug Monit., 24(4), 537, 2002.
58. Ayrton, J. et al. The use of turbulent flow chromatography/mass spectrometry for
the rapid, direct analysis of a novel pharmaceutical compound in plasma, Rapid
Commun. Mass Spectrom., 11(18), 1953, 1997.
59. Tanaka, N. and Kobayashi, H., Monolithic columns for liquid chromatography,
Anal. Bioanal. Chem., 376(3), 298, 2003.
60. Majors, R.E., New developments in the application of monolithic HPLC columns,LC – GC , 12, 1186, 2001.
61. Tanaka, N. et al. Monolithic LC columns, Anal. Chem., 73(15), 420A, 2001.
62. Wu, J.T. et al. High-speed liquid chromatography/tandem mass spectrometry using
a monolithic column for high-throughput bioanalysis, Rapid Commun. Mass
Spectrom., 15(13), 1113, 2001.
63. Bidlingmaier, B., Unger, K.K., and von Doehren, N., Comparative study on the
column performance of microparticulate 5-m C18-bonded and monolithic C18-
bonded reversed-phase columns in high-performance liquid chromatography,
J. Chromatogr., A, 832(1–2), 11, 1999.
64. Zeng, H., Deng, Y., and Wu, J.T., Fast analysis using monolithic columnscoupled with high-flow on-line extraction and electrospray mass spectrometric
detection for the direct and simultaneous quantitation of multiple components
in plasma, J. Chromatogr., B: Anal. Technol. Biomed. Life Sci., 788(2), 331,
2003.
65. Plumb, R. et al. Direct analysis of pharmaceutical compounds in human plasma
with chromatographic resolution using an alkyl-bonded silica rod column, Rapid
Commun. Mass Spectrom., 15(12), 986, 2001.
Direct Plasma Analysis Systems 173
Copyright © 2005 CRC Press, LLC

7/21/2019 Using Mass Spectrometry for Drug Metabolism Studies
http://slidepdf.com/reader/full/using-mass-spectrometry-for-drug-metabolism-studies 181/362
66. Hsieh, Y. et al. Direct plasma analysis of drug compounds using monolithic column
liquid chromatography and tandem mass spectrometry, Anal. Chem., 75(8), 1812,
2003.
67. Peng, S.X., Strojnowski, M.J., and Bornes, D.M., Direct determination of stability
of protease inhibitors in plasma by HPLC with automated column-switching,
J. Pharm. Biomed. Anal., 19(3–4), 343, 1999.
68. Wang, G. and Hsieh, Y., Utilization of direct HPLC–MS–MS for drug stability
measurement, Am. Laboratory, 34(24), 24, 2002.
69. Wang, G. et al. Semi-automated determination of plasma stability of drug discovery
compounds using liquid chromatography–tandem mass spectrometry, J. Chroma-
togr., B: Anal. Technol. Biomed. Life Sci., 780(2), 451, 2002.
70. Wang, G. et al. High-throughput cassette assay for drug stability measurementin
plasma using direct HPLC–MS/MS, Spectroscopy-An Int. J., 17, 511, 2003.
71. Matuszewski, B.K., Constanzer, M.L., and Chavez-Eng, C.M., Matrix effect inquantitative LC/MS/MS analyses of biological fluids: a method for determination
of finasteride in human plasma at picogram per milliliter concentrations, Anal.
Chem., 70(5), 882, 1998.
72. Mei, H. et al. Comparison of matrix effects on different tandem mass spectrometers,
Proceedings of the 49th American Society for Mass Spectrometry Conference,
Chicago, IL, 2001.
73. Mei, H. et al. Investigation of matrix effects in bioanalytical high-performance
liquid chromatography/tandem mass spectrometric assays: application to drug
discovery, Rapid Commun. Mass Spectrom., 17(1), 97, 2003.
74. King, R. et al. Mechanistic investigation of ionization suppression in electrosprayionization, J. Am. Soc. Mass Spectrom., 11(11), 942, 2000.
75. Hsieh, Y., Merkle, K., and Wang, G., Zirconia-based column high performance
liquid chromatography/atmospheric pressure photoionization tandem mass spec-
trometric analyses of drug molecules in rat plasma, Rapid Commun. Mass
Spectrom., 17, 1775, 2003.
76. Matuszewski, B.K., Constanzer, M.L., and Chavez-Eng, C.M., Strategies for the
assessment of matrix effect in quantitative bioanalytical methods based on HPLC–
MS/MS, Anal. Chem., 75(13), 3019, 2003.
174 Using Mass Spectrometry for Drug Metabolism Studies
Copyright © 2005 CRC Press, LLC
7/21/2019 Using Mass Spectrometry for Drug Metabolism Studies
http://slidepdf.com/reader/full/using-mass-spectrometry-for-drug-metabolism-studies 182/362
Chapter 6
Acyl Glucuronides: Assays and Issues
Sam Wainhaus
6.1 Introduction
The analysis of acyl glucuronide conjugates formed by the glucuronidation
of endogenous substrates and xenobiotics has been a subject of rapidly grow-
ing interest due to the potential toxicological implications of these special
metabolites [1–6]. Historically, the analysis of acyl glucuronide conjugates has
been performed using HPLC separation combined with UV or fluorescence
detection [3, 7–9]. Nuclear magnetic resonance (NMR) has also been utilizedto better characterize acyl glucuronides [9–11]. HPLC combined with mass
spectrometric detection (HPLC–MS and HPLC–MS/MS) has provided
researchers with a powerful tool to study acyl glucuronide formation,
distribution, and elimination that is both complementary and supplementary
to other modes of detection. In order to achieve a thorough study of a
particular acyl glucuronide, one will most probably utilize all of these
analytical techniques. This chapter will touch on many of these techniques, but
the application of mass spectrometry for the analysis of acyl glucuronide
conjugates will be the primary focus.
Acyl glucuronide conjugates are typically formed from nonsteroidal
antiinflammatory drugs (NSAIDS). There are at least 35 reported acyl
glucuronide forming acidic drugs that have been widely used, including
ibuprofen (Advil), ketoprofen (Orudis), celecoxib (Celebrex), and
0-8493-1963-3/05/$0.00+$1.50 2005 by CRC Press 175
Copyright © 2005 CRC Press, LLC

7/21/2019 Using Mass Spectrometry for Drug Metabolism Studies
http://slidepdf.com/reader/full/using-mass-spectrometry-for-drug-metabolism-studies 183/362
naproxen (Naprosynl). However, seven of these drugs have been removed
from the market due to serious toxicities including anaphylaxis, rash, jaun-
dice, liver failure, and death. These seven drugs are alclofenac, indoprofen,
zomepirac, benoxaprofen, suprofen, ibufenac, and ticrynafen. Additionally,diclofenac (Voltarenl) has been associated with fatal autoimmune hepatitis
[12, 13]. The toxicity is idiosyncratic and therefore difficult to assess in
preclinical and clinical testing [14]. There has been considerable effort to
establish specific biomarkers in early drug discovery that are predictive of
potential acyl glucuronide mediated toxicity. Mass spectrometry and specifi-
cally liquid chromatography–mass spectrometry/mass spectrometry (LC–MS/
MS) plays a crucial role in the measurement of these important parameters.
6.2 Acyl Glucuronide Formation
Acyl glucuronide metabolites are formed by the conjugation of the carboxylic
acid moiety of a drug or metabolite with glucuronic acid. Glucuronidation
is a major metabolic pathway for detoxifying and eliminating xenobiotics,
including a wide range of hypolipidemic and NSAIDs in mammals. Acyl
glucuronides contain an ester group that is susceptible to both hydrolysis and
intramolecular acyl migration. Hydrolysis of an acyl glucuronide conjugate
converts it to the aglycone which may be the parent drug in the case of aparent drug containing a carboxylic acid moiety, or an oxidative metabolite.
Celecoxib (Celebrex), for example, undergoes oxidation of its methyl group to
an alcohol and subsequent oxidation to a carboxylic acid that forms an acyl
glucuronide conjugate as confirmed by LC–MS/MS [15]. Acyl migration
involves transfer of the acyl group from the 1b position to the C-2, C-3, or C-4
position of the glucuronic acid ring and has been observed for a variety of
NSAIDs [1, 2, 11, 16, 17]. Additionally, a,b-anomers of the aforementioned
isomeric acyl glucuronides can be formed by mutarotation [6]. Figure 6.1 shows
the formation of b-1-O-acyl glucuronide from the conjugation of uridine
diphospho-glucuronic acid (UDPGA) with a carboxylic acid containing drug
substrate that is enzymatically catalyzed by uridine glucuronosyltransferase
(UGT). These isomeric acyl glucuronides have been shown to form covalent
adducts with proteins as shown in Figure 6.1. This presents a toxicological
problem since there are many examples of highly reactive acyl glucuronides that
result in modified proteins which may be immunogenic in vivo and in vitro [1–6].
Clearly, the extent of protein binding depends on several factors that require
measurement in order to assess the likelihood of an immunotoxic response.
6.2.1 Mechanism of glucuronidation
Several mechanisms of acyl glucuronide reactivity have been proposed. The
transacylation mechanism proposed by van Breemen and Fenselau results in
covalent binding of the drug (without the glucuronic acid) and protein via
nucleophillic displacement of the glucuronosyl group by NH2, SH or
176 Using Mass Spectrometry for Drug Metabolism Studies
Copyright © 2005 CRC Press, LLC

7/21/2019 Using Mass Spectrometry for Drug Metabolism Studies
http://slidepdf.com/reader/full/using-mass-spectrometry-for-drug-metabolism-studies 184/362
OH groups on the protein molecule [19–22]. The glycation or imine
mechanism requires a spontaneous initial acyl migration step as described
above, followed by tautomerization of the pyranose ring to its aldose form.
Condensation of the aldehyde group on the ring opened tautomer can then
bind irreversibly to a protein as shown in Figure 6.1. In this case, both the drug
and glucuronic acid are bound to the protein. Both of these mechanisms have
been observed and are both probably important in terms of toxicological
consequences [2, 23–27]. Benet et al. have shown how the utilization of tandem
mass spectrometry (MS/MS) can be very helpful in this endeavor [23–25].
Benet et al. used tandem liquid secondary ion mass spectrometry to show
glucuronyl-imine linkages at six lysine residues formed from in vitro studies
of tolmetin glucuronide and human serum albumin, as shown in Figure 6.2,
thereby providing conclusive evidence for the glycation mechanism [23]. Benet
et al. also used matrix assisted laser desorption mass spectrometry (MALDI-
MS) to investigate the protein binding of benoxaprofen glucuronide. The
added sensitivity from MALDI techniques permitted differentiation of binding
sites on human serum albumin modified by the drug alone and binding
sites modified by the benoxaprofen glucuronide as shown in Figure 6.3.
Additionally, different binding sites were observed for tolmetin glucuronide
Figure 6.1 Glucuronidation is one of the major phase II metabolic pathways of carboxylic acidcompounds. Once formed, aycl glucuronides may undergo acyl migration/anomerization aroundthe sugar ring. These isomers can form aldehydes that may covalently bind to proteins and triggerimmunotoxic reaction such as anaphylaxis. Source: White, R.A., SPRI (personal communication).With permission.
Acyl Glucuronides: Assays and Issues 177
Copyright © 2005 CRC Press, LLC

7/21/2019 Using Mass Spectrometry for Drug Metabolism Studies
http://slidepdf.com/reader/full/using-mass-spectrometry-for-drug-metabolism-studies 185/362
and benoxaprofen glucuronide which could potentially explain immunological
variation observed with several NSAIDs [24]. The identification of such
binding sites in vivo will require even greater sensitivity.
Both mechanisms provide a variety of parameters that may be measured
in the drug discovery and development process to assess the potential for a
negative toxicological finding in humans as illustrated in Figure 6.4: (1) The
amount of acyl glucuronide or extent of glucuronidation can be measured in
bile, urine and plasma; (2) the extent of acyl migration, which is a critical step
in the glycation mechanism, can be measured in these matrices; and (3) the
amount of protein binding, clearly the most critical measurement, can be
measured in plasma and tissue.
6.2.2 Assessing acyl glucuronide toxicity
To date, there have been several approaches used to assess the toxic nature of
acyl glucuronide conjugates. One approach measures the reactivity of the
Figure 6.2 Liquid secondary ion mass spectrometry CID spectrum for the molecular ion of m/z 1365.6 from an HPLC fraction of a tryptic digest following the incubation of tolmetinglucuronide with human serum albumin. Fragments containing Lys-199 (Lys*) show a shift of 417 Da for tolmetin glucuronide, indicating that this lysine is the site of covalent binding.y7 y6¼m/z 545 corresponding to lysine-H2Oþ tolmetin glucuronide (m/z 417). Starred items inthe spectrum (m/z 240, 212, 122, 119, and 94) indicate fragments from the tolmetin moiety. (Source:Ding, A., Proc. Natl. Acad. Sci. USA, 90, 3797, 1993. With permission.)
178 Using Mass Spectrometry for Drug Metabolism Studies
Copyright © 2005 CRC Press, LLC
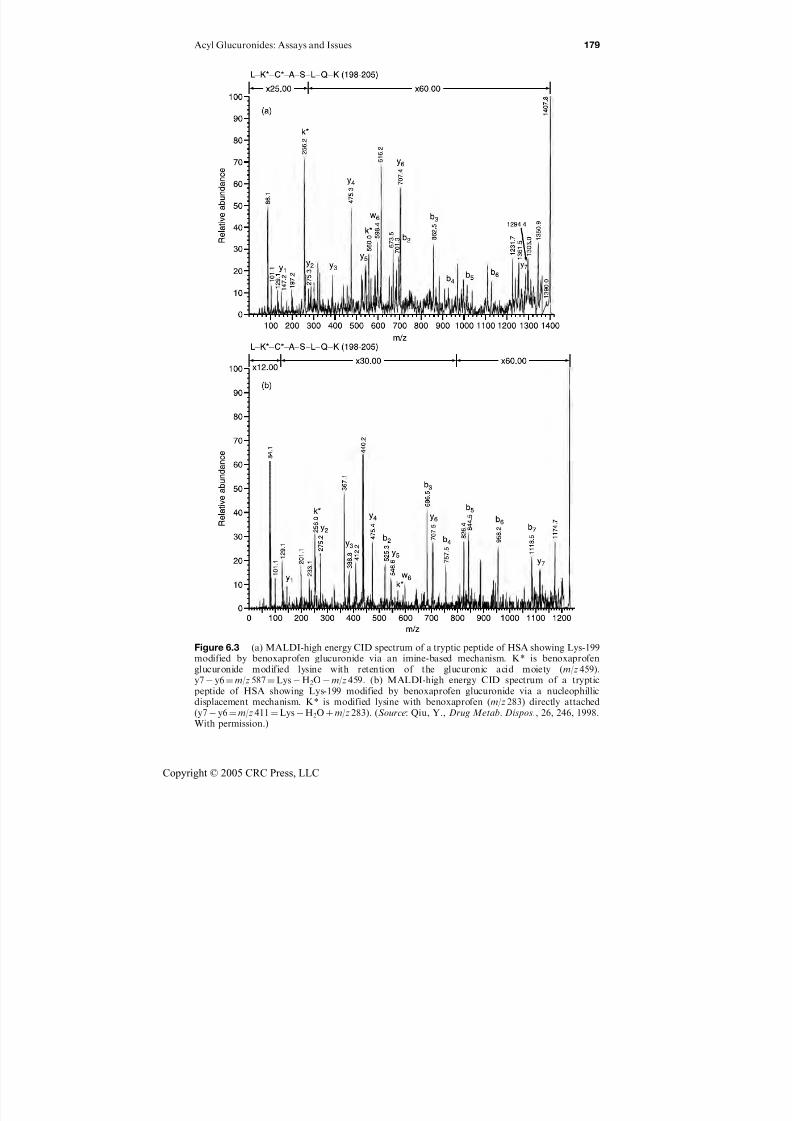
7/21/2019 Using Mass Spectrometry for Drug Metabolism Studies
http://slidepdf.com/reader/full/using-mass-spectrometry-for-drug-metabolism-studies 186/362
Figure 6.3 (a) MALDI-high energy CID spectrum of a tryptic peptide of HSA showing Lys-199modified by benoxaprofen glucuronide via an imine-based mechanism. K* is benoxaprofenglucuronide modified lysine with retention of the glucuronic acid moiety (m/z 459).y7 y6¼m/z 587¼LysH2Om/z 459. (b) MALDI-high energy CID spectrum of a trypticpeptide of HSA showing Lys-199 modified by benoxaprofen glucuronide via a nucleophillicdisplacement mechanism. K* is modified lysine with benoxaprofen (m/z 283) directly attached(y7 y6¼m/z 411¼LysH2Oþm/z 283). (Source: Qiu, Y., Drug Metab. Dispos., 26, 246, 1998.With permission.)
Acyl Glucuronides: Assays and Issues 179
Copyright © 2005 CRC Press, LLC

7/21/2019 Using Mass Spectrometry for Drug Metabolism Studies
http://slidepdf.com/reader/full/using-mass-spectrometry-for-drug-metabolism-studies 187/362
acyl glucuronide towards acyl migration. This approach requires separation
and identification of the positional isomers that can be a time consuming task
requiring careful manipulation of mobile phase pH, buffer content, organic
content, flow rate, and temperature [28]. Figure 6.5(A) shows the separation of
the acyl glucuronides of zomepirac [29]. Identification of each of these isomers
is an arduous task that is not always necessary. Identification of the 1- O-acyl
glucuronide can be achieved by treating the acyl glucuronide mixture with
b-glucuronidase thus hydrolyzing only the 1-O-acyl glucuronide as shown in
Figure 6.5(B). The extent of degradation is measured by incubation of the 1b-
O-acyl glucuronide in buffer at physiological pH and measuring the rate of
hydrolysis and acyl migration. Using this method it was possible to measure
degradation half-lives of the acyl glucuronide conjugates of telmisartan and
diclofenac as 26 and 0.5 h, respectively at pH 7.4 [18]. As stated above,
diclofenac has been shown to cause clinically adverse reactions while
telmisartan is free of such findings. The degradation half-lives for a variety
of acyl glucuronide forming drugs have been measured [18]. While some
correlation does seem to exist between half-life and potential toxicity there is
much conflicting data. Additionally, there is some variation in the absolute
numbers of the acyl glucuronide half-lives. For example, the half-life of
zomepirac acyl glucuronide was measured to be 9 min [30] and 27 min [6]. The
Figure 6.4 Acyl glucuronide is formed in the liver and either excreted via the bile duct or
systemic circulation. While in the liver it can covalently bind to liver protein resulting inhepatotoxicity. In the blood it can covalently bind to plasma protein resulting in an immunotoxicresponse or cleared renally. (Source: White, R.A., SPRI (personal communication). Withpermission.)
180 Using Mass Spectrometry for Drug Metabolism Studies
Copyright © 2005 CRC Press, LLC
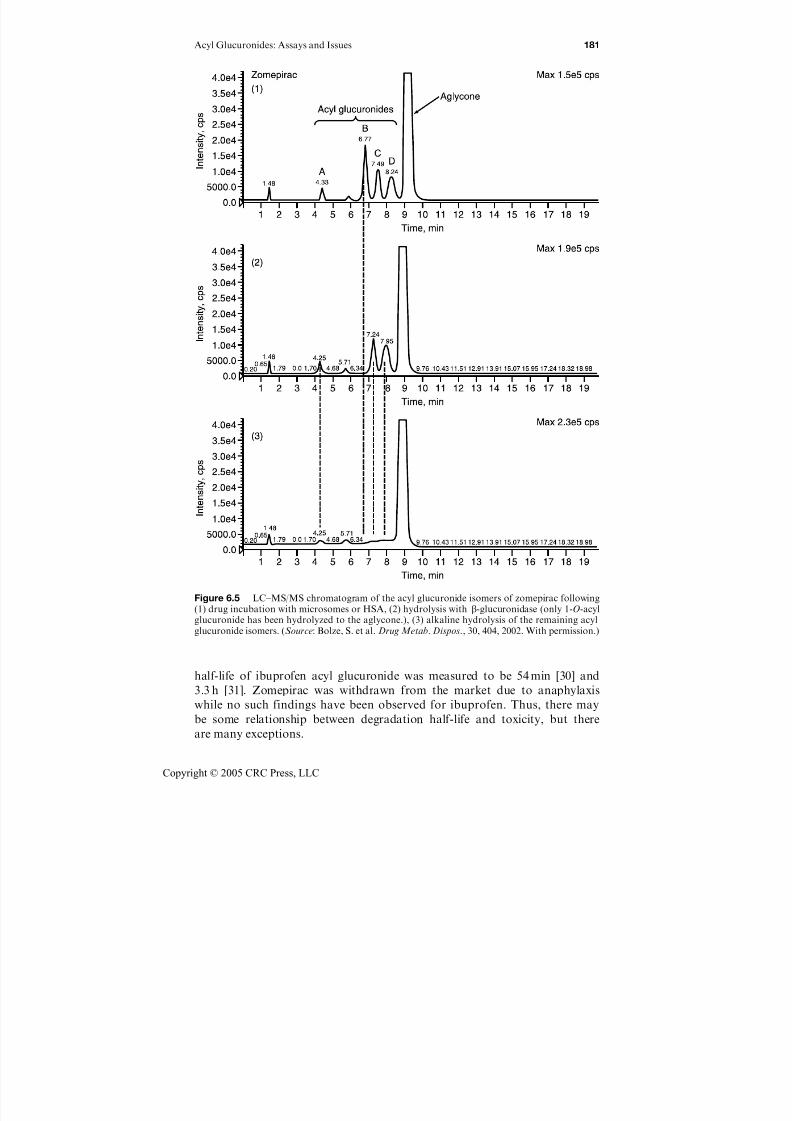
7/21/2019 Using Mass Spectrometry for Drug Metabolism Studies
http://slidepdf.com/reader/full/using-mass-spectrometry-for-drug-metabolism-studies 188/362
half-life of ibuprofen acyl glucuronide was measured to be 54 min [30] and
3.3 h [31]. Zomepirac was withdrawn from the market due to anaphylaxis
while no such findings have been observed for ibuprofen. Thus, there may
be some relationship between degradation half-life and toxicity, but there
are many exceptions.
Figure 6.5 LC–MS/MS chromatogram of the acyl glucuronide isomers of zomepirac following(1) drug incubation with microsomes or HSA, (2) hydrolysis with b-glucuronidase (only 1-O-acylglucuronide has been hydrolyzed to the aglycone.), (3) alkaline hydrolysis of the remaining acylglucuronide isomers. (Source: Bolze, S. et al. Drug Metab. Dispos., 30, 404, 2002. With permission.)
Acyl Glucuronides: Assays and Issues 181
Copyright © 2005 CRC Press, LLC

7/21/2019 Using Mass Spectrometry for Drug Metabolism Studies
http://slidepdf.com/reader/full/using-mass-spectrometry-for-drug-metabolism-studies 189/362
Another approach compares the amount of in vitro binding of acyl
glucuronide conjugates to human serum albumin (HSA) as described above.
Bolze et al. developed a novel technique whereby the acyl glucuronide is
produced in vitro and used to assess the extent of protein binding via LC–MS/MS [29]. LC–MS/MS is used to determine the amount of parent drug after the
corresponding acyl glucuronide that was bound to the HSA has been
hydrolyzed. This will be described in greater detail below. A correlation
between the extent of covalent binding and observed toxicity for a variety of
NSAIDs was observed. For example, Tolmetin, diclofenac, and zomepirac all
showed greater extent of covalent binding compared to ibuprofen and
furosemide. Tolmetin-1-O-acyl glucuronide has a degradation half-life of
0.26 h [6] and has been withdrawn from the market while furosemide-1-O-acyl
glucuronide has a half-life of 5.3 h without any negative findings. Clearly, thereappears to be a correlation between degradation half-life, HSA covalent
binding and immunotoxic response.
Unfortunately, even careful measurement of these parameters may not
be sufficient to predict the likelihood of a negative toxicological response
and additional antibody measurements may be required. However, these do
provide a risk assessment starting point to determine rank ordering of lead
candidates, the need to investigate replacement of the carboxylic acid group
with one that has similar SAR such as an isostere surrogate and comparison
with similar parameters from drugs with known toxicological findings.
6.3 Mass Spectrometry Overview
Mass Spectrometry plays a key role in determining all of the acyl glucuronide
parameters described above. The ability to measure acyl glucuronide levels in
a variety of matrices was historically performed by HPLC–UV and is now
routinely carried out using LC–MS/MS. There are a variety of methodologies
that can be used to quantify acyl glucuronide formation, assess the extent of
acyl migration and protein adduct formation. While much work has been done
with well established drugs and drugs that are at a mature stage in their
development, there is a great need to better characterize drug candidates
that are in early to late stage drug discovery. The ability to predict the
toxicity potential of a given acyl glucuronide hinges on the ability to measure
these biomarkers with the sensitivity and selectivity that is provided by
LC–MS/MS.
6.3.1 Acyl glucuronide identification
The use of liquid chromatography coupled with tandem mass spectrometry
(LC–MS/MS) has been critical in identifying potentially toxic metabolites
such as acyl glucuronide conjugates in vivo in early drug discovery. Mass
spectrometry has been extensively utilized to assist in acyl glucuronide identifi-
cation even when another analytical technique is used for quantitation.
182 Using Mass Spectrometry for Drug Metabolism Studies
Copyright © 2005 CRC Press, LLC
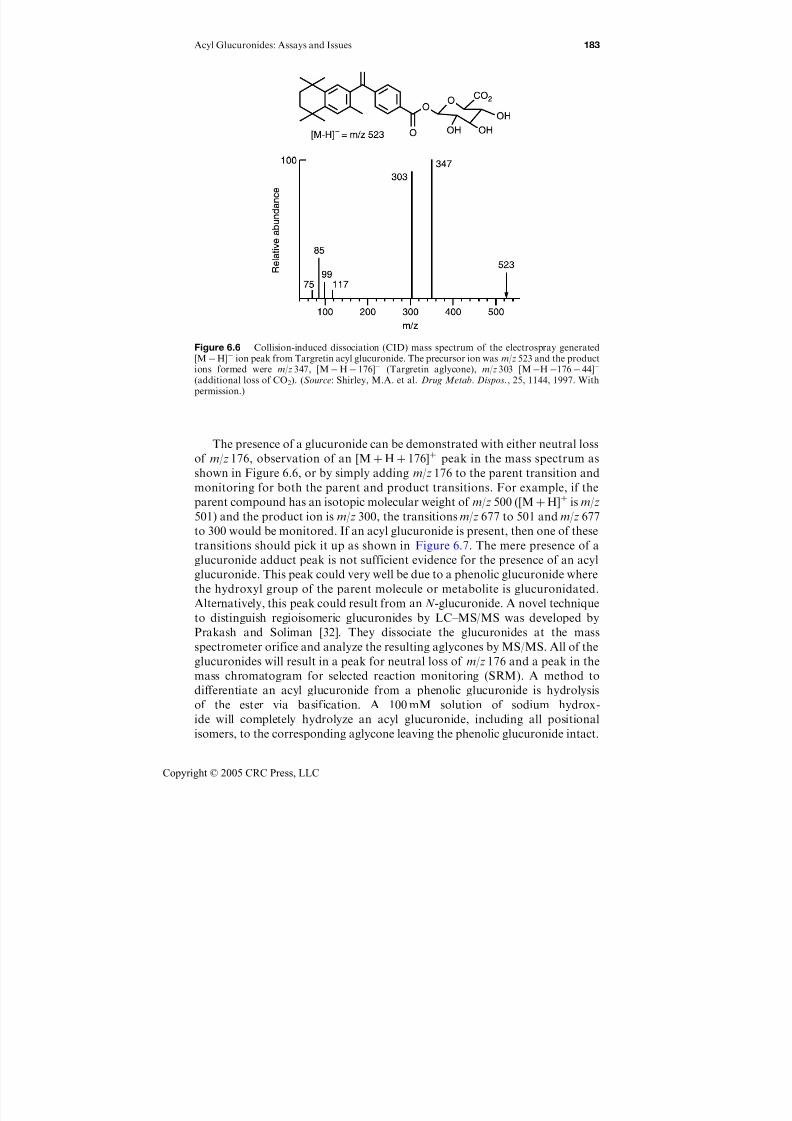
7/21/2019 Using Mass Spectrometry for Drug Metabolism Studies
http://slidepdf.com/reader/full/using-mass-spectrometry-for-drug-metabolism-studies 190/362
The presence of a glucuronide can be demonstrated with either neutral loss
of m/z 176, observation of an [M þHþ 176]þ peak in the mass spectrum as
shown in Figure 6.6, or by simply adding m/z 176 to the parent transition and
monitoring for both the parent and product transitions. For example, if the
parent compound has an isotopic molecular weight of m/z 500 ([MþH]þ is m/z
501) and the product ion is m/z 300, the transitions m/z 677 to 501 and m/z 677
to 300 would be monitored. If an acyl glucuronide is present, then one of these
transitions should pick it up as shown in Figure 6.7. The mere presence of a
glucuronide adduct peak is not sufficient evidence for the presence of an acyl
glucuronide. This peak could very well be due to a phenolic glucuronide where
the hydroxyl group of the parent molecule or metabolite is glucuronidated.
Alternatively, this peak could result from an N -glucuronide. A novel technique
to distinguish regioisomeric glucuronides by LC–MS/MS was developed by
Prakash and Soliman [32]. They dissociate the glucuronides at the mass
spectrometer orifice and analyze the resulting aglycones by MS/MS. All of the
glucuronides will result in a peak for neutral loss of m/z 176 and a peak in the
mass chromatogram for selected reaction monitoring (SRM). A method to
differentiate an acyl glucuronide from a phenolic glucuronide is hydrolysis
of the ester via basification. A 100 mM solution of sodium hydrox-
ide will completely hydrolyze an acyl glucuronide, including all positional
isomers, to the corresponding aglycone leaving the phenolic glucuronide intact.
Figure 6.6 Collision-induced dissociation (CID) mass spectrum of the electrospray generated[MH] ion peak from Targretin acyl glucuronide. The precursor ion was m/z 523 and the productions formed were m/z 347, [MH 176] (Targretin aglycone), m/z 303 [MH176 44]
(additional loss of CO2). (Source: Shirley, M.A. et al. Drug Metab. Dispos., 25, 1144, 1997. Withpermission.)
Acyl Glucuronides: Assays and Issues 183
Copyright © 2005 CRC Press, LLC
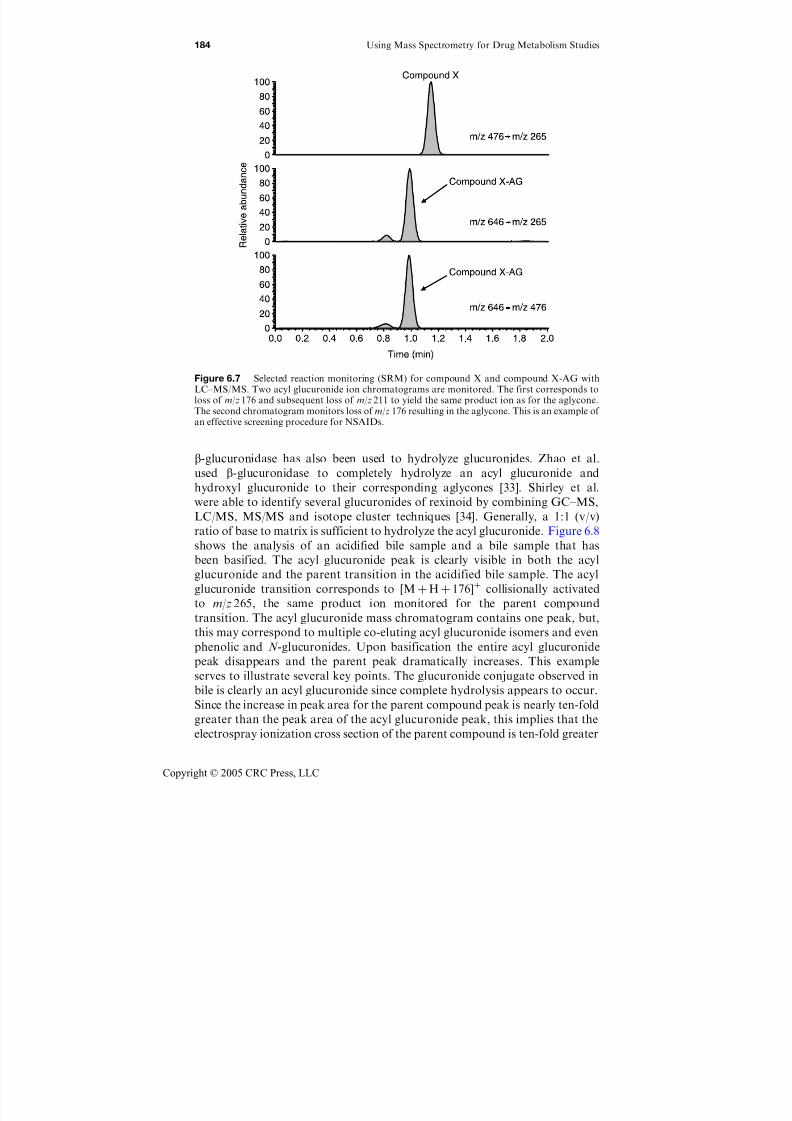
7/21/2019 Using Mass Spectrometry for Drug Metabolism Studies
http://slidepdf.com/reader/full/using-mass-spectrometry-for-drug-metabolism-studies 191/362
b-glucuronidase has also been used to hydrolyze glucuronides. Zhao et al.
used b-glucuronidase to completely hydrolyze an acyl glucuronide and
hydroxyl glucuronide to their corresponding aglycones [33]. Shirley et al.
were able to identify several glucuronides of rexinoid by combining GC–MS,
LC/MS, MS/MS and isotope cluster techniques [34]. Generally, a 1:1 (v/v)
ratio of base to matrix is sufficient to hydrolyze the acyl glucuronide. Figure 6.8
shows the analysis of an acidified bile sample and a bile sample that has
been basified. The acyl glucuronide peak is clearly visible in both the acyl
glucuronide and the parent transition in the acidified bile sample. The acyl
glucuronide transition corresponds to [MþHþ 176]þ collisionally activated
to m/z 265, the same product ion monitored for the parent compound
transition. The acyl glucuronide mass chromatogram contains one peak, but,
this may correspond to multiple co-eluting acyl glucuronide isomers and even
phenolic and N -glucuronides. Upon basification the entire acyl glucuronide
peak disappears and the parent peak dramatically increases. This example
serves to illustrate several key points. The glucuronide conjugate observed in
bile is clearly an acyl glucuronide since complete hydrolysis appears to occur.
Since the increase in peak area for the parent compound peak is nearly ten-fold
greater than the peak area of the acyl glucuronide peak, this implies that the
electrospray ionization cross section of the parent compound is ten-fold greater
Figure 6.7 Selected reaction monitoring (SRM) for compound X and compound X-AG withLC–MS/MS. Two acyl glucuronide ion chromatograms are monitored. The first corresponds toloss of m/z 176 and subsequent loss of m/z 211 to yield the same product ion as for the aglycone.The second chromatogram monitors loss of m/z 176 resulting in the aglycone. This is an example of an effective screening procedure for NSAIDs.
184 Using Mass Spectrometry for Drug Metabolism Studies
Copyright © 2005 CRC Press, LLC
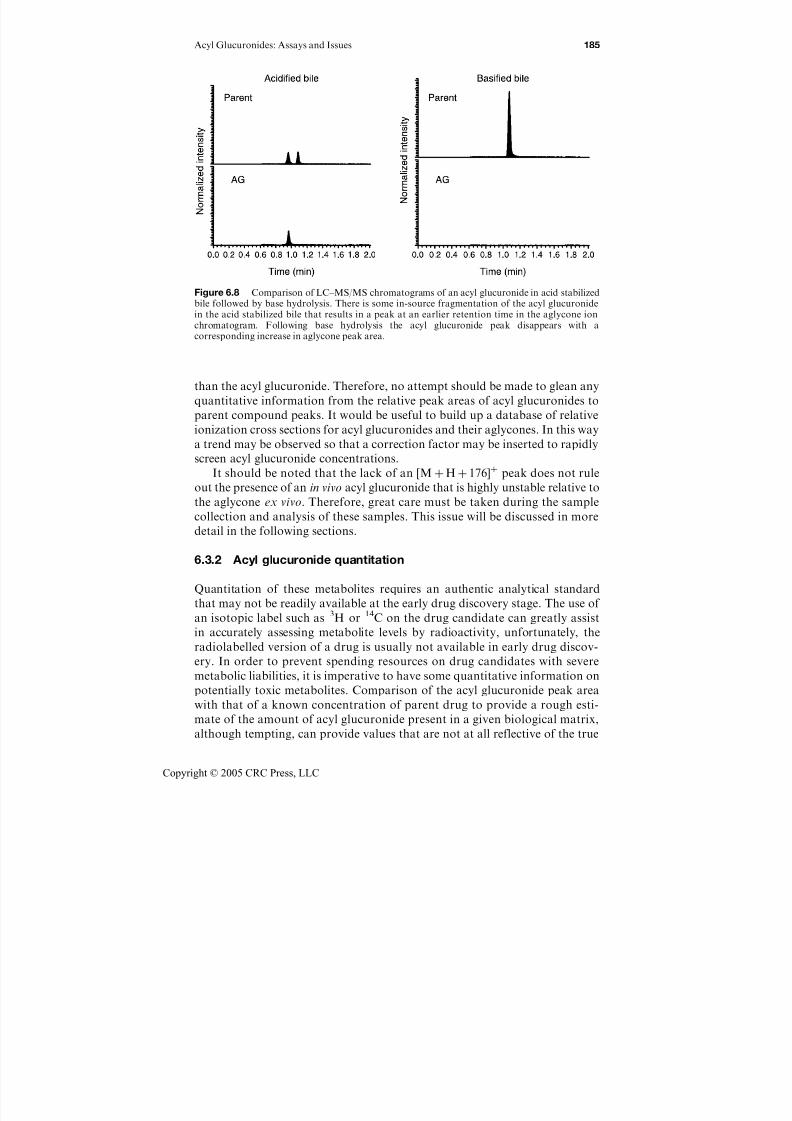
7/21/2019 Using Mass Spectrometry for Drug Metabolism Studies
http://slidepdf.com/reader/full/using-mass-spectrometry-for-drug-metabolism-studies 192/362
than the acyl glucuronide. Therefore, no attempt should be made to glean anyquantitative information from the relative peak areas of acyl glucuronides to
parent compound peaks. It would be useful to build up a database of relative
ionization cross sections for acyl glucuronides and their aglycones. In this way
a trend may be observed so that a correction factor may be inserted to rapidly
screen acyl glucuronide concentrations.
It should be noted that the lack of an [MþHþ 176]þ peak does not rule
out the presence of an in vivo acyl glucuronide that is highly unstable relative to
the aglycone ex vivo. Therefore, great care must be taken during the sample
collection and analysis of these samples. This issue will be discussed in more
detail in the following sections.
6.3.2 Acyl glucuronide quantitation
Quantitation of these metabolites requires an authentic analytical standard
that may not be readily available at the early drug discovery stage. The use of
an isotopic label such as 3H or 14C on the drug candidate can greatly assist
in accurately assessing metabolite levels by radioactivity, unfortunately, the
radiolabelled version of a drug is usually not available in early drug discov-
ery. In order to prevent spending resources on drug candidates with severe
metabolic liabilities, it is imperative to have some quantitative information on
potentially toxic metabolites. Comparison of the acyl glucuronide peak area
with that of a known concentration of parent drug to provide a rough esti-
mate of the amount of acyl glucuronide present in a given biological matrix,
although tempting, can provide values that are not at all reflective of the true
Figure 6.8 Comparison of LC–MS/MS chromatograms of an acyl glucuronide in acid stabilizedbile followed by base hydrolysis. There is some in-source fragmentation of the acyl glucuronidein the acid stabilized bile that results in a peak at an earlier retention time in the aglycone ionchromatogram. Following base hydrolysis the acyl glucuronide peak disappears with acorresponding increase in aglycone peak area.
Acyl Glucuronides: Assays and Issues 185
Copyright © 2005 CRC Press, LLC

7/21/2019 Using Mass Spectrometry for Drug Metabolism Studies
http://slidepdf.com/reader/full/using-mass-spectrometry-for-drug-metabolism-studies 193/362
acyl glucuronide concentration. Several quantitation techniques will be
described below, but we must first examine how the acyl glucuronide conjugate
is affected by the ionization process.
6.3.3 APCI vs ESI
Acyl glucuronide conjugates are inherently unstable and easily hydrolyzed to
both the aglycone and rearrangement isomers. Therefore, it is crucial to use the
least severe conditions when analyzing the sample. The choice of ion source
for a given mass spectrometric determination can be based on a variety of
parameters. In the case of acyl glucuronides the most important parameter
is analyte stability. Under the more severe atmospheric pressure chemical
ionization (APCI) conditions, acyl glucuronides can break down to theaglycone resulting in an underestimate of the acyl glucuronide concentration. If
chromatographic separation between the acyl glucuronide and aglycone is not
achieved this can also lead to an overestimate of the aglycone concentration.
Figure 6.9 shows the analysis of an acyl glucuronide under both APCI and
electrospray ionization (ESI) conditions. The acyl glucuronide and aglycone
have been chromatographically resolved here, but this cannot always be
assumed to be the case a priori. APCI typically results in much greater
in-source fragmentation of the acyl glucuronide compared to ESI. Addition-
ally, the mass spectrometer response may be much greater for the aglycone
Figure 6.9 Comparison of electrospray ionization (ESI) and atmospheric pressure chemicalionization (APCI) for the analysis of compounds that result in acyl glucuronide metabolites. APCIis a harsher ionization technique and can easily result in significant cleavage of the ester, leading toa large peak in the aglycone ion chromatogram. If chromatographic separation is not achieved,APCI could lead to an overestimate of the aglycone concentration. ESI is a softer ionizationtechnique resulting in substantially less in-source fragmentation. Hence ESI is the preferredionization technique for compounds that form glucuronide metabolites.
186 Using Mass Spectrometry for Drug Metabolism Studies
Copyright © 2005 CRC Press, LLC
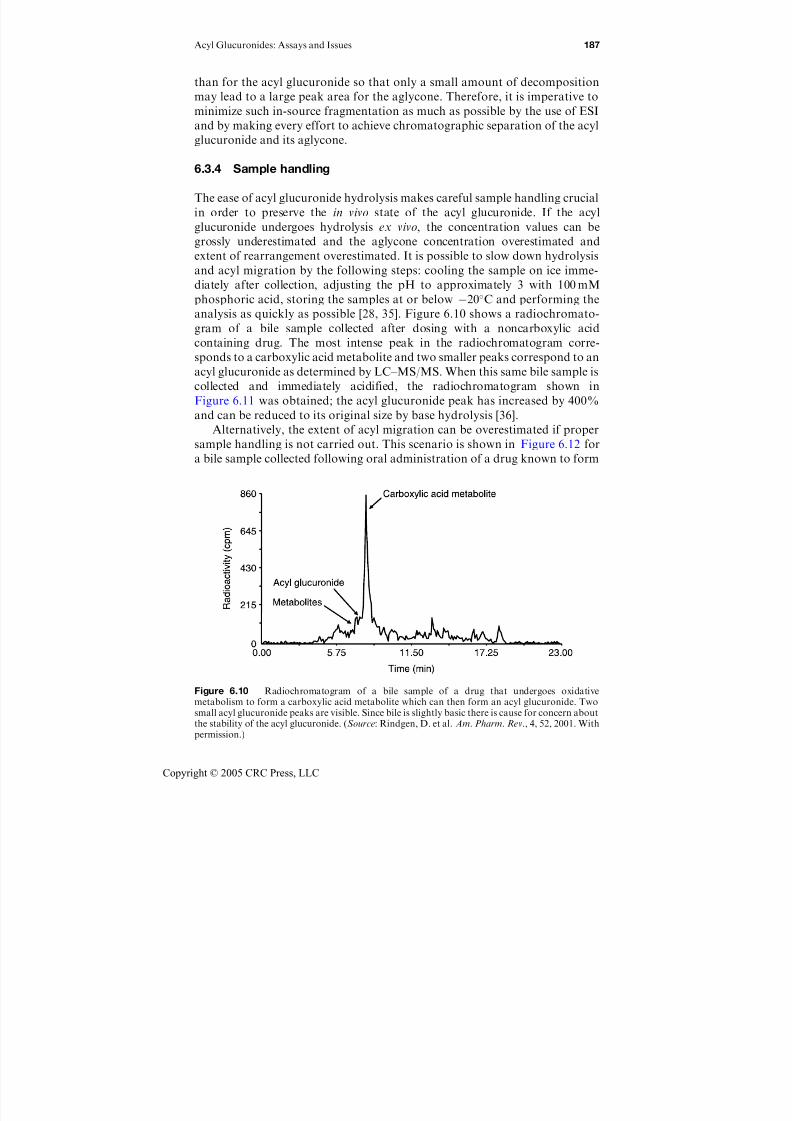
7/21/2019 Using Mass Spectrometry for Drug Metabolism Studies
http://slidepdf.com/reader/full/using-mass-spectrometry-for-drug-metabolism-studies 194/362
than for the acyl glucuronide so that only a small amount of decomposition
may lead to a large peak area for the aglycone. Therefore, it is imperative to
minimize such in-source fragmentation as much as possible by the use of ESI
and by making every effort to achieve chromatographic separation of the acylglucuronide and its aglycone.
6.3.4 Sample handling
The ease of acyl glucuronide hydrolysis makes careful sample handling crucial
in order to preserve the in vivo state of the acyl glucuronide. If the acyl
glucuronide undergoes hydrolysis ex vivo, the concentration values can be
grossly underestimated and the aglycone concentration overestimated and
extent of rearrangement overestimated. It is possible to slow down hydrolysisand acyl migration by the following steps: cooling the sample on ice imme-
diately after collection, adjusting the pH to approximately 3 with 100 mM
phosphoric acid, storing the samples at or below 20C and performing the
analysis as quickly as possible [28, 35]. Figure 6.10 shows a radiochromato-
gram of a bile sample collected after dosing with a noncarboxylic acid
containing drug. The most intense peak in the radiochromatogram corre-
sponds to a carboxylic acid metabolite and two smaller peaks correspond to an
acyl glucuronide as determined by LC–MS/MS. When this same bile sample is
collected and immediately acidified, the radiochromatogram shown inFigure 6.11 was obtained; the acyl glucuronide peak has increased by 400%
and can be reduced to its original size by base hydrolysis [36].
Alternatively, the extent of acyl migration can be overestimated if proper
sample handling is not carried out. This scenario is shown in Figure 6.12 for
a bile sample collected following oral administration of a drug known to form
Figure 6.10 Radiochromatogram of a bile sample of a drug that undergoes oxidativemetabolism to form a carboxylic acid metabolite which can then form an acyl glucuronide. Twosmall acyl glucuronide peaks are visible. Since bile is slightly basic there is cause for concern aboutthe stability of the acyl glucuronide. (Source: Rindgen, D. et al. Am. Pharm. Rev., 4, 52, 2001. Withpermission.)
Acyl Glucuronides: Assays and Issues 187
Copyright © 2005 CRC Press, LLC
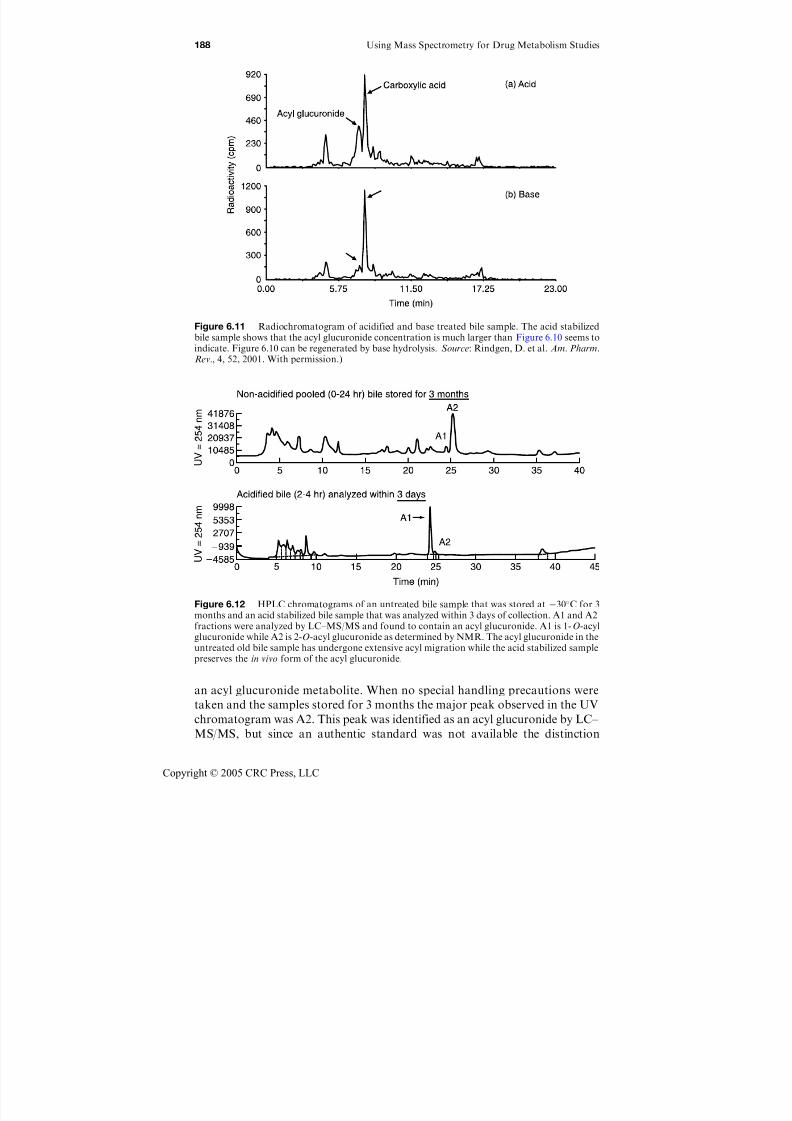
7/21/2019 Using Mass Spectrometry for Drug Metabolism Studies
http://slidepdf.com/reader/full/using-mass-spectrometry-for-drug-metabolism-studies 195/362
an acyl glucuronide metabolite. When no special handling precautions were
taken and the samples stored for 3 months the major peak observed in the UV
chromatogram was A2. This peak was identified as an acyl glucuronide by LC–
MS/MS, but since an authentic standard was not available the distinction
Figure 6.11 Radiochromatogram of acidified and base treated bile sample. The acid stabilizedbile sample shows that the acyl glucuronide concentration is much larger than Figure 6.10 seems toindicate. Figure 6.10 can be regenerated by base hydrolysis. Source: Rindgen, D. et al. Am. Pharm.Rev., 4, 52, 2001. With permission.)
Figure 6.12 HPLC chromatograms of an untreated bile sample that was stored at 30C for 3months and an acid stabilized bile sample that was analyzed within 3 days of collection. A1 and A2fractions were analyzed by LC–MS/MS and found to contain an acyl glucuronide. A1 is 1-O-acyl
glucuronide while A2 is 2-O-acyl glucuronide as determined by NMR. The acyl glucuronide in theuntreated old bile sample has undergone extensive acyl migration while the acid stabilized samplepreserves the in vivo form of the acyl glucuronide.
188 Using Mass Spectrometry for Drug Metabolism Studies
Copyright © 2005 CRC Press, LLC

7/21/2019 Using Mass Spectrometry for Drug Metabolism Studies
http://slidepdf.com/reader/full/using-mass-spectrometry-for-drug-metabolism-studies 196/362
between a 1-b-O-acyl glucuronide and one of its rearrangement isomers had to
be made by NMR. A2 was identified as 2-b-O-acyl glucuronide and A1 was
1-b-O-acyl glucuronide. Clearly, this observation raises a red flag in the
progression of a drug since a rearranged acyl glucuronide that is potentiallycapable of protein binding seemed to be the major metabolite. A more careful
experiment showed this to not be the case. When bile was collected under
the careful sample handling conditions described above and analyzed within
3 days of collection, the situation was reversed. NMR showed that the major
metabolite was now A1, the 1-b-O-acyl glucuronide. Although protein binding
via the transacylation mechanism is still possible this newer finding never-
theless implied a reduced risk. Acyl glucuronides that have undergone acyl
migration can still be hydrolyzed by base but not by b-glucuronidase. This
provides a potential technique for differentiating between the two isomers.Additionally, glucuronide conjugates of phenols and amines are possible, but
these are stable with respect to base hydrolysis thus allowing for distinction
between acyl glucuronides and phenolic or N -glucuronides as described above.
6.3.5 Difference assay
One of the simplest quantitative approaches when an authentic acyl glucu-
ronide standard is not available is the difference method [29, 37]. This tech-nique takes advantage of the base hydrolysis described above to convert all
the acyl glucuronide to aglycone followed by quantitation of the aglycone.
The difference between the original (acid stabilized) and hydrolysis aglycone
concentration corresponds to the acyl glucuronide concentration.
The technique is carried out as follows: two rats and monkeys are orally
dosed with 10 mg/kg of the acyl glucuronide-forming drug. Blood is collected
at 0.25, 0.5, 1, 2, 4, 6, 8, 24, 48, and 72 h post-dose. Bile is collected at 0–2, 2–4,
4–6, 6–8, 8–24, 24–48, and 48–72 h intervals. The plasma and bile collected is
acidified with 100 mM H3PO4 (2:1, v/v) at each time point immediately
following sample collection in order to stabilize the acyl glucuronide and stored
at 20C. Another portion of bile and plasma is basified with 100 mM NaOH
(2:1, v/v) prior to analysis in order to hydrolyze the acyl glucuronide to the
aglycone.
Standard curves of the drug are prepared in bile and plasma for each
species. Separate curves are prepared for the acidified and basified samples
since this can impact ionization. The concentration of aglycone is quantified
in all of the samples. The difference in molar concentration between the
acidified and basified samples corresponds to the molar concentration of the
acyl glucuronide at each time interval.
In order to calculate the percent of dose converted to acyl glucuonide,
the molar concentration of acyl glucuronide is multiplied by the bile volume to
give the number of micromoles of acyl glucuronide for each time interval. The
dose multiplied by the animal weight gives the mass of parent compound
administered to the animal. This value is then converted to micromoles via the
Acyl Glucuronides: Assays and Issues 189
Copyright © 2005 CRC Press, LLC

7/21/2019 Using Mass Spectrometry for Drug Metabolism Studies
http://slidepdf.com/reader/full/using-mass-spectrometry-for-drug-metabolism-studies 197/362
molar mass. The percent of dose converted to acyl glucuronide at each time
interval is simply micromoles of acyl glucuronide divided by micromoles of
parent compound multiplied by 100%.
The percent of dose converted to acyl glucuronide and plasma concentra-tion of acyl glucuronide measured by this method can be substantiated by
dosing two rats and cynomologus monkeys with 10 mg/kg of radiolabeled
drug. Bile and plasma are collected in a similar manner as mentioned above.
Both bile and plasma are counted for radioactivity and bile monitored for
metabolites by splitting the flow from the LC between a radio-flow detector
and the mass spectrometer. Additionally, the plasma parent concentration is
determined by LC–MS/MS and compared with the total radioactivity. The
amount of radioactivity recovered in bile and the relative peak area of acyl
glucuronide in the radiochromatogram allows the determination of percent of dose converted to acyl glucuronide.
The acyl glucuronide concentration in bile following a 10 mg/kg oral dose
of compound X is shown in Table 6.1 for rat and monkey. The mean acyl
glucuronide concentration of compound X-AG in monkey bile is three to
twelve-fold that of rat bile for a given time interval (0–24 h) and is at least
several hundred micromolar through 24 h post-dose. The mean ratio of
compound X to compound X-AG in monkey bile is only 0.03 (0–24 h) while
this value is 1.7 in rat (0–24 h). Additionally, the concentration of compound X
in rat bile is one- to twenty six-fold that of monkey bile for a given time interval(0–24 h). We did not observe any compound X-AG in rat or monkey plasma
with this assay. This assay provided several important pieces of information
about compound X and its propensity to form acyl glucuronide conjugates in
rat and monkey several months prior to the availability of radiolabeled
compound X. It is useful to convert this data to percent of dose converted to
acyl glucuronide by using the bile volume at each time point and the animal
weights. Table 6.1 shows the percent of dose converted to acyl glucuronide as
measured in rat and cynomologus monkey. The sums of the mean values over
72 h are 38% and 17% for monkey and rat, respectively. The mean
Table 6.1 Rat monkey acyl glucuronide and aglycone bile concentrations as measured by thedifference assay using LC–MS/MS. The % of dose converted to acyl glucuronide (AG) is calculatedfor each time interval
Parameter (mean) 0–2 h 2–4 h 4–6 h 6–8 h 8–24 h 24–48 h 48–72 h Total
Monkey (mean values)Percent of dose converted to AG 2.2 4.8 3.9 5.1 12 9.2 1.1 38.3Bile volume (mL) 7.7 6.9 6.5 17.2 56.9 108.9 126.4 330.5Parent (mM) 6 14 15 11 20 13 0.7AG (mM) 377 723 680 662 262 85 9
Rat (mean)Percent of dose converted to AG 5 1.3 3.4 2.2 4.9 0.4 .05 17.3Bile volume (ml) 2.4 2.0 5.0 2.1 10.2 18.9 11 51.6Parent (mM) 156 198 148 98 20 1 0.2AG (mM) 135 59 94 61 29 0.9 0.4
190 Using Mass Spectrometry for Drug Metabolism Studies
Copyright © 2005 CRC Press, LLC
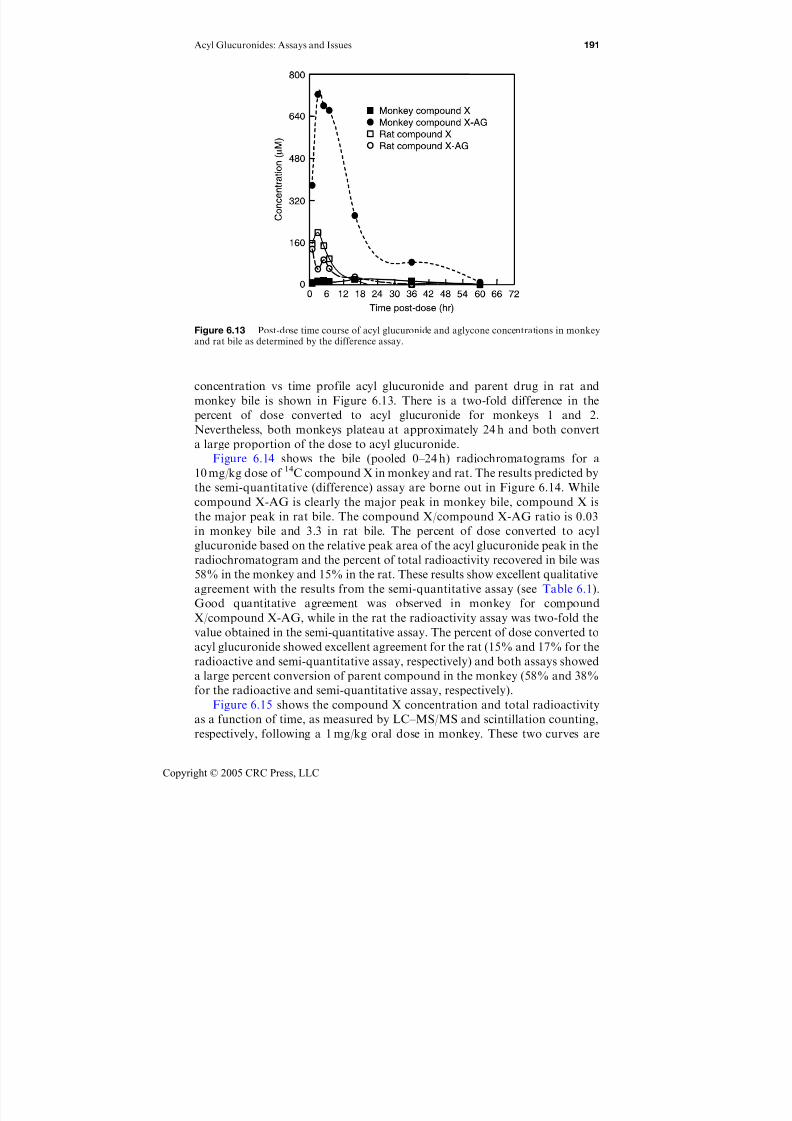
7/21/2019 Using Mass Spectrometry for Drug Metabolism Studies
http://slidepdf.com/reader/full/using-mass-spectrometry-for-drug-metabolism-studies 198/362
concentration vs time profile acyl glucuronide and parent drug in rat andmonkey bile is shown in Figure 6.13. There is a two-fold difference in the
percent of dose converted to acyl glucuronide for monkeys 1 and 2.
Nevertheless, both monkeys plateau at approximately 24 h and both convert
a large proportion of the dose to acyl glucuronide.
Figure 6.14 shows the bile (pooled 0–24 h) radiochromatograms for a
10 mg/kg dose of 14C compound X in monkey and rat. The results predicted by
the semi-quantitative (difference) assay are borne out in Figure 6.14. While
compound X-AG is clearly the major peak in monkey bile, compound X is
the major peak in rat bile. The compound X/compound X-AG ratio is 0.03
in monkey bile and 3.3 in rat bile. The percent of dose converted to acyl
glucuronide based on the relative peak area of the acyl glucuronide peak in the
radiochromatogram and the percent of total radioactivity recovered in bile was
58% in the monkey and 15% in the rat. These results show excellent qualitative
agreement with the results from the semi-quantitative assay (see Table 6.1).
Good quantitative agreement was observed in monkey for compound
X/compound X-AG, while in the rat the radioactivity assay was two-fold the
value obtained in the semi-quantitative assay. The percent of dose converted to
acyl glucuronide showed excellent agreement for the rat (15% and 17% for the
radioactive and semi-quantitative assay, respectively) and both assays showed
a large percent conversion of parent compound in the monkey (58% and 38%
for the radioactive and semi-quantitative assay, respectively).
Figure 6.15 shows the compound X concentration and total radioactivity
as a function of time, as measured by LC–MS/MS and scintillation counting,
respectively, following a 1 mg/kg oral dose in monkey. These two curves are
Figure 6.13 Post-dose time course of acyl glucuronide and aglycone concentrations in monkeyand rat bile as determined by the difference assay.
Acyl Glucuronides: Assays and Issues 191
Copyright © 2005 CRC Press, LLC

7/21/2019 Using Mass Spectrometry for Drug Metabolism Studies
http://slidepdf.com/reader/full/using-mass-spectrometry-for-drug-metabolism-studies 199/362
virtually indistinguishable indicating a lack of circulating metabolites. These
results agree with the semi-quantitative assay for compound X-AG in plasma
which showed no detectable levels of compound X-AG as stated above.
Therefore, the data obtained using the semi-quantitative assay can add to the
Figure 6.14 Radiochromatogram of monkey and rat bile. A much larger fraction of the dose isconverted into acyl glucuronide in monkeys than in rats. These data support earlier findings fromthe difference assay.
Figure 6.15 LC–MS/MS determination of 14C parent drug in plasma compared with totalradioactivity converted to ng eq/mL. The data suggests that no circulating metabolites are present.
192 Using Mass Spectrometry for Drug Metabolism Studies
Copyright © 2005 CRC Press, LLC

7/21/2019 Using Mass Spectrometry for Drug Metabolism Studies
http://slidepdf.com/reader/full/using-mass-spectrometry-for-drug-metabolism-studies 200/362
degradation half-life and HSA binding assays described above to form a more
complete picture of the risk assessment involved for a given drug candidate or
to rank order a series of drug candidates.
6.4 Isolation of Acyl Glucuronide
The rate-limiting step in most assays is absence of an authentic acyl
glucuronide standard. We have seen that it is sometimes possible to form
acyl glucuronides in vitro to such an extent that these may be utilized in a
reactivity experiment [18, 29]. There are also additional techniques to prepare
an acyl glucuronide in the literature [38]. We have utilized the technique of
having the animal do the work of the synthetic organic chemist. In the eventthat the difference assay indicates that there is a large conversion of drug
to acyl glucuronide as measured in bile it is possible to isolate this acyl
glucuronide, by ramping up the dose and collecting bile. Two monkeys were
dosed p.o. with 100 mg/kg of compound X. Bile was collected over 6 h in cold
100 mM phosphoric acid to preserve the acyl glucuronide at pH 3–4. The
retention time of the acyl glucuronide was known based on previous data. This
fraction was collected, purified and identified as an acyl glucuronide by LC–
MS/MS. Additionally, the acyl glucuronide was further characterized as the
1-b-O-acyl glucuronide by NMR. This relatively fast ‘‘synthesis’’ opens thedoor to all of the assays discussed above including degradation half-life in a
variety of matrices and protein binding. Additionally, if the radiolabeled drug
is dosed then radiolabeled acyl glucuronide is obtained that may be used for
covalent binding experiments.
The extracted isolated acyl glucuronide may then be used to construct a
calibration curve in a given matrix. Figure 6.16 shows an acyl glucuronide
calibration curve in plasma from 25 ng/mL to 5000 ng/mL. Both the aglycone
and acyl glucuronide were quantified simultaneously and the concentration
versus time curve is shown in Figure 6.17. The difference assay would not be
useful for the plasma since there is a large concentration of aglycone and a
small concentration of acyl glucuronide. In this case, the aglycone formed by
hydrolyzing the acyl glucuronide is lost in the percent error. This is also
observed when the total radioactivity measured in plasma is compared with
parent drug measured by LC–MS/MS. Typically, when a significant amount
of metabolites are formed a significant difference between total radioactivity
and parent concentration is observed. However, if a profile like that shown in
Figure 6.15 is observed the conclusion is that no circulating metabolites are
present. For acyl glucuronides it is important to know the percentage of
circulating acyl glucuronide relative to parent. This information can be
obtained from the concentration versus time curve shown in Figure 6.17 and is
less than 10%. Since solutions of the acyl glucuronide deteriorate over time
it is extremely difficult to obtain a validated quantitative assay for acyl
glucuronides. The use of the nonvalidated quantitative procedures described
above can potentially be viewed as satisfying due diligence by the FDA. For
Acyl Glucuronides: Assays and Issues 193
Copyright © 2005 CRC Press, LLC
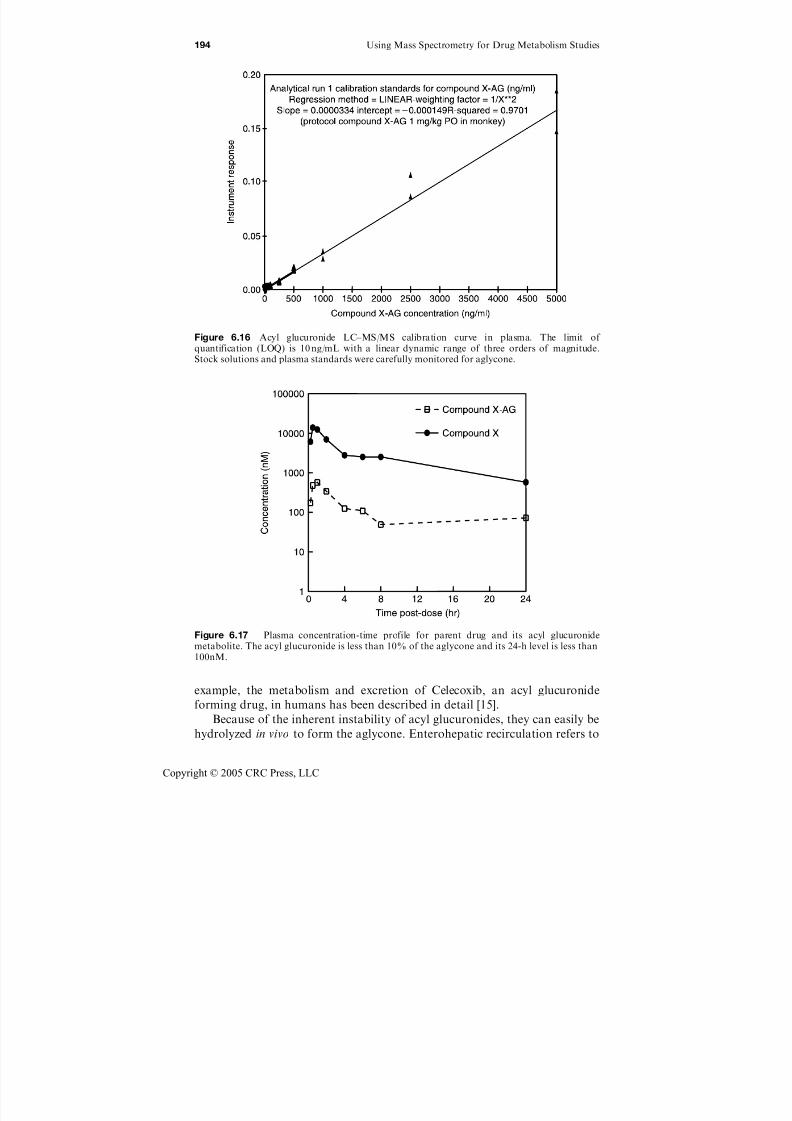
7/21/2019 Using Mass Spectrometry for Drug Metabolism Studies
http://slidepdf.com/reader/full/using-mass-spectrometry-for-drug-metabolism-studies 201/362
example, the metabolism and excretion of Celecoxib, an acyl glucuronide
forming drug, in humans has been described in detail [15].
Because of the inherent instability of acyl glucuronides, they can easily be
hydrolyzed in vivo to form the aglycone. Enterohepatic recirculation refers to
Figure 6.16 Acyl glucuronide LC–MS/MS calibration curve in plasma. The limit of quantification (LOQ) is 10 ng/mL with a linear dynamic range of three orders of magnitude.Stock solutions and plasma standards were carefully monitored for aglycone.
Figure 6.17 Plasma concentration-time profile for parent drug and its acyl glucuronidemetabolite. The acyl glucuronide is less than 10% of the aglycone and its 24-h level is less than100nM.
194 Using Mass Spectrometry for Drug Metabolism Studies
Copyright © 2005 CRC Press, LLC
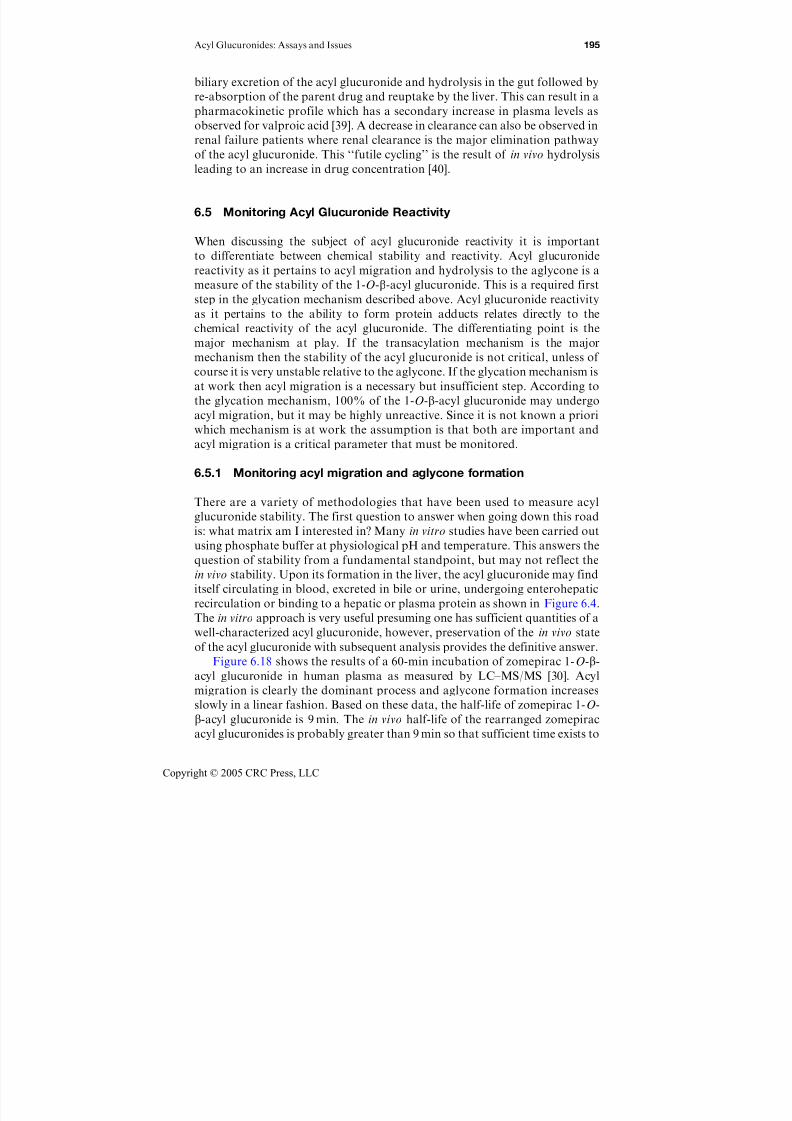
7/21/2019 Using Mass Spectrometry for Drug Metabolism Studies
http://slidepdf.com/reader/full/using-mass-spectrometry-for-drug-metabolism-studies 202/362
biliary excretion of the acyl glucuronide and hydrolysis in the gut followed by
re-absorption of the parent drug and reuptake by the liver. This can result in a
pharmacokinetic profile which has a secondary increase in plasma levels as
observed for valproic acid [39]. A decrease in clearance can also be observed inrenal failure patients where renal clearance is the major elimination pathway
of the acyl glucuronide. This ‘‘futile cycling’’ is the result of in vivo hydrolysis
leading to an increase in drug concentration [40].
6.5 Monitoring Acyl Glucuronide Reactivity
When discussing the subject of acyl glucuronide reactivity it is important
to differentiate between chemical stability and reactivity. Acyl glucuronidereactivity as it pertains to acyl migration and hydrolysis to the aglycone is a
measure of the stability of the 1-O-b-acyl glucuronide. This is a required first
step in the glycation mechanism described above. Acyl glucuronide reactivity
as it pertains to the ability to form protein adducts relates directly to the
chemical reactivity of the acyl glucuronide. The differentiating point is the
major mechanism at play. If the transacylation mechanism is the major
mechanism then the stability of the acyl glucuronide is not critical, unless of
course it is very unstable relative to the aglycone. If the glycation mechanism is
at work then acyl migration is a necessary but insufficient step. According tothe glycation mechanism, 100% of the 1-O-b-acyl glucuronide may undergo
acyl migration, but it may be highly unreactive. Since it is not known a priori
which mechanism is at work the assumption is that both are important and
acyl migration is a critical parameter that must be monitored.
6.5.1 Monitoring acyl migration and aglycone formation
There are a variety of methodologies that have been used to measure acyl
glucuronide stability. The first question to answer when going down this road
is: what matrix am I interested in? Many in vitro studies have been carried out
using phosphate buffer at physiological pH and temperature. This answers the
question of stability from a fundamental standpoint, but may not reflect the
in vivo stability. Upon its formation in the liver, the acyl glucuronide may find
itself circulating in blood, excreted in bile or urine, undergoing enterohepatic
recirculation or binding to a hepatic or plasma protein as shown in Figure 6.4.
The in vitro approach is very useful presuming one has sufficient quantities of a
well-characterized acyl glucuronide, however, preservation of the in vivo state
of the acyl glucuronide with subsequent analysis provides the definitive answer.
Figure 6.18 shows the results of a 60-min incubation of zomepirac 1-O-b-
acyl glucuronide in human plasma as measured by LC–MS/MS [30]. Acyl
migration is clearly the dominant process and aglycone formation increases
slowly in a linear fashion. Based on these data, the half-life of zomepirac 1-O-
b-acyl glucuronide is 9 min. The in vivo half-life of the rearranged zomepirac
acyl glucuronides is probably greater than 9 min so that sufficient time exists to
Acyl Glucuronides: Assays and Issues 195
Copyright © 2005 CRC Press, LLC
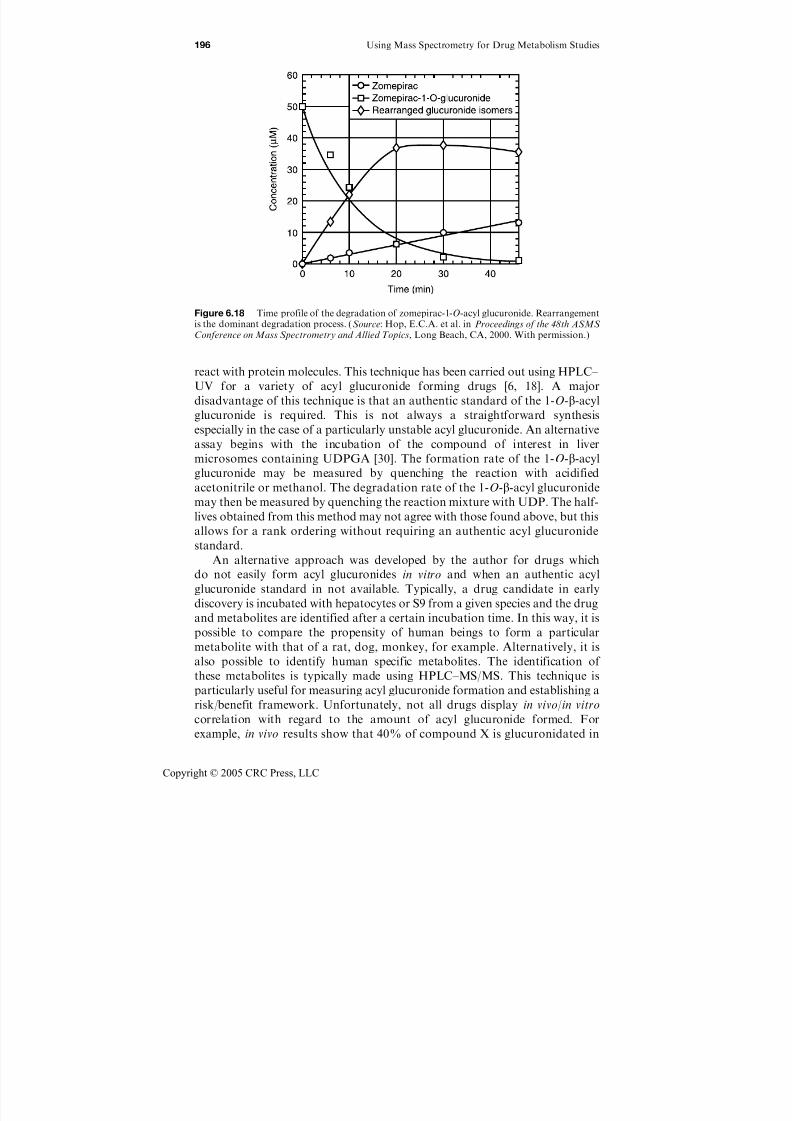
7/21/2019 Using Mass Spectrometry for Drug Metabolism Studies
http://slidepdf.com/reader/full/using-mass-spectrometry-for-drug-metabolism-studies 203/362
react with protein molecules. This technique has been carried out using HPLC–
UV for a variety of acyl glucuronide forming drugs [6, 18]. A majordisadvantage of this technique is that an authentic standard of the 1-O-b-acyl
glucuronide is required. This is not always a straightforward synthesis
especially in the case of a particularly unstable acyl glucuronide. An alternative
assay begins with the incubation of the compound of interest in liver
microsomes containing UDPGA [30]. The formation rate of the 1-O-b-acyl
glucuronide may be measured by quenching the reaction with acidified
acetonitrile or methanol. The degradation rate of the 1-O-b-acyl glucuronide
may then be measured by quenching the reaction mixture with UDP. The half-
lives obtained from this method may not agree with those found above, but this
allows for a rank ordering without requiring an authentic acyl glucuronide
standard.
An alternative approach was developed by the author for drugs which
do not easily form acyl glucuronides in vitro and when an authentic acyl
glucuronide standard in not available. Typically, a drug candidate in early
discovery is incubated with hepatocytes or S9 from a given species and the drug
and metabolites are identified after a certain incubation time. In this way, it is
possible to compare the propensity of human beings to form a particular
metabolite with that of a rat, dog, monkey, for example. Alternatively, it is
also possible to identify human specific metabolites. The identification of
these metabolites is typically made using HPLC–MS/MS. This technique is
particularly useful for measuring acyl glucuronide formation and establishing a
risk/benefit framework. Unfortunately, not all drugs display in vivo/in vitro
correlation with regard to the amount of acyl glucuronide formed. For
example, in vivo results show that 40% of compound X is glucuronidated in
Figure 6.18 Time profile of the degradation of zomepirac-1-O-acyl glucuronide. Rearrangementis the dominant degradation process. (Source: Hop, E.C.A. et al. in Proceedings of the 48th ASMS Conference on Mass Spectrometry and Allied Topics, Long Beach, CA, 2000. With permission.)
196 Using Mass Spectrometry for Drug Metabolism Studies
Copyright © 2005 CRC Press, LLC
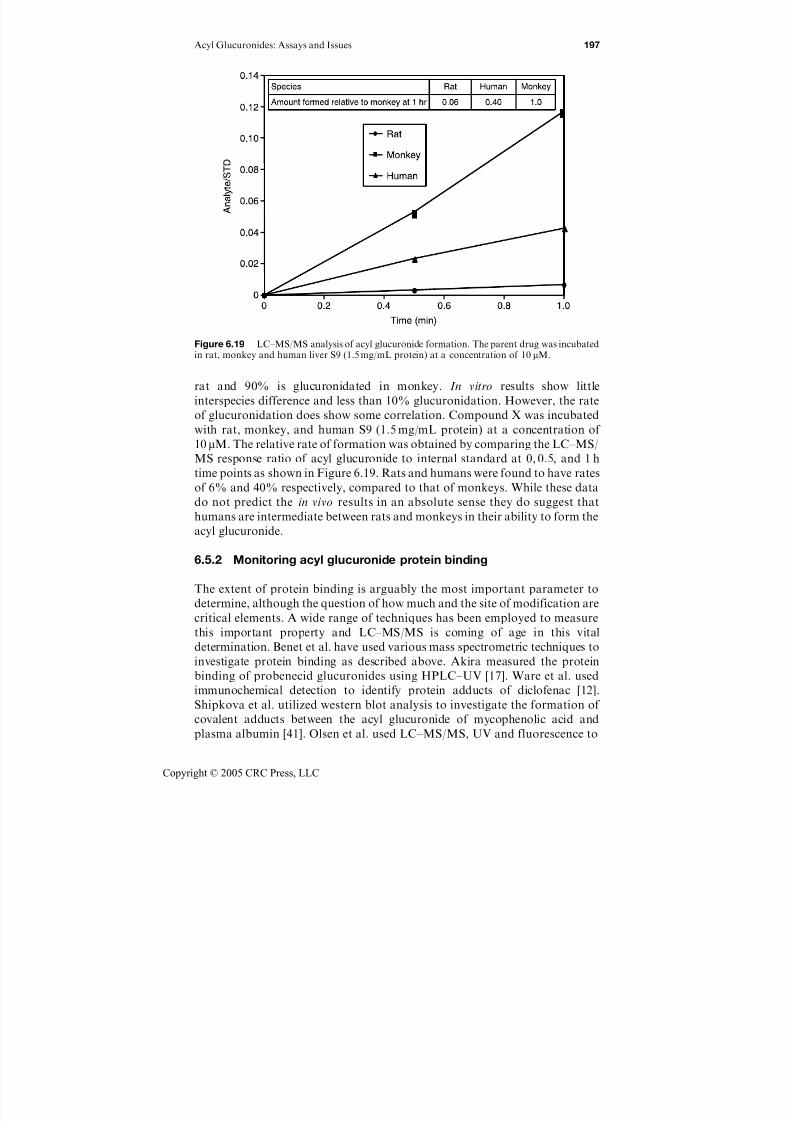
7/21/2019 Using Mass Spectrometry for Drug Metabolism Studies
http://slidepdf.com/reader/full/using-mass-spectrometry-for-drug-metabolism-studies 204/362
rat and 90% is glucuronidated in monkey. In vitro results show littleinterspecies difference and less than 10% glucuronidation. However, the rate
of glucuronidation does show some correlation. Compound X was incubated
with rat, monkey, and human S9 (1.5 mg/mL protein) at a concentration of
10 mM. The relative rate of formation was obtained by comparing the LC–MS/
MS response ratio of acyl glucuronide to internal standard at 0, 0.5, and 1 h
time points as shown in Figure 6.19. Rats and humans were found to have rates
of 6% and 40% respectively, compared to that of monkeys. While these data
do not predict the in vivo results in an absolute sense they do suggest that
humans are intermediate between rats and monkeys in their ability to form the
acyl glucuronide.
6.5.2 Monitoring acyl glucuronide protein binding
The extent of protein binding is arguably the most important parameter to
determine, although the question of how much and the site of modification are
critical elements. A wide range of techniques has been employed to measure
this important property and LC–MS/MS is coming of age in this vital
determination. Benet et al. have used various mass spectrometric techniques to
investigate protein binding as described above. Akira measured the protein
binding of probenecid glucuronides using HPLC–UV [17]. Ware et al. used
immunochemical detection to identify protein adducts of diclofenac [12].
Shipkova et al. utilized western blot analysis to investigate the formation of
covalent adducts between the acyl glucuronide of mycophenolic acid and
plasma albumin [41]. Olsen et al. used LC–MS/MS, UV and fluorescence to
Figure 6.19 LC–MS/MS analysis of acyl glucuronide formation. The parent drug was incubatedin rat, monkey and human liver S9 (1.5 mg/mL protein) at a concentration of 10mM.
Acyl Glucuronides: Assays and Issues 197
Copyright © 2005 CRC Press, LLC
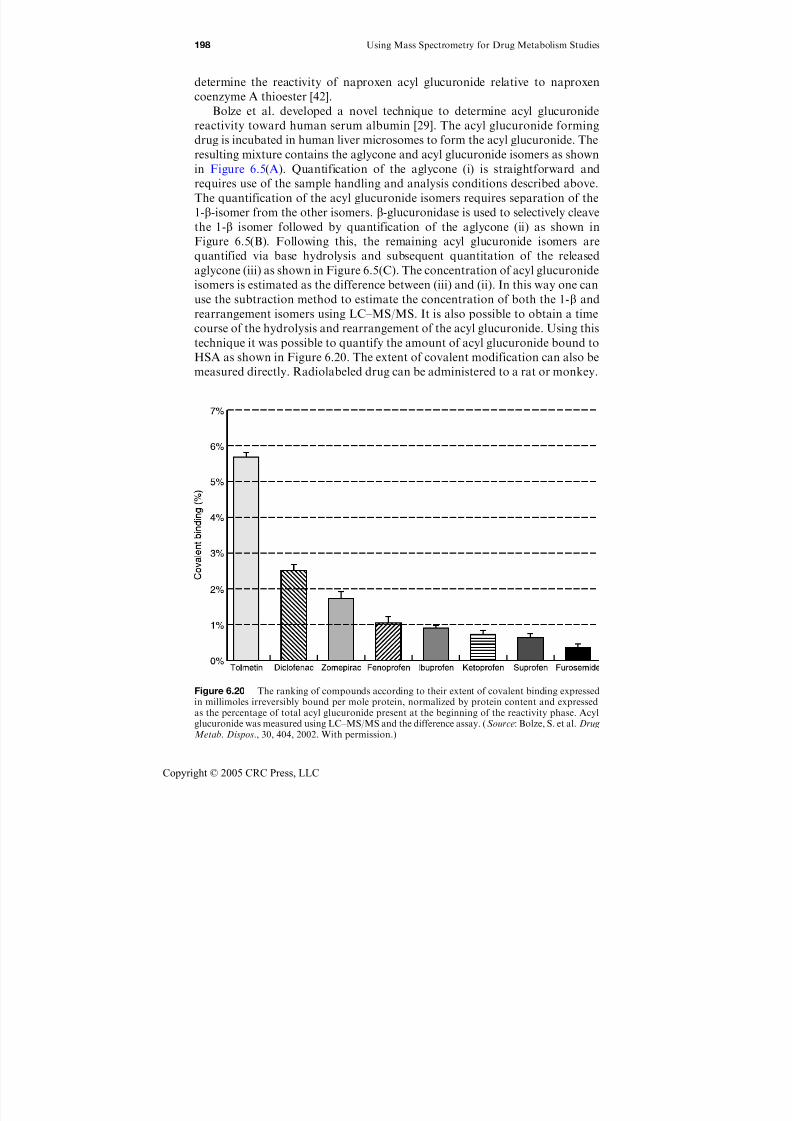
7/21/2019 Using Mass Spectrometry for Drug Metabolism Studies
http://slidepdf.com/reader/full/using-mass-spectrometry-for-drug-metabolism-studies 205/362
determine the reactivity of naproxen acyl glucuronide relative to naproxen
coenzyme A thioester [42].
Bolze et al. developed a novel technique to determine acyl glucuronide
reactivity toward human serum albumin [29]. The acyl glucuronide formingdrug is incubated in human liver microsomes to form the acyl glucuronide. The
resulting mixture contains the aglycone and acyl glucuronide isomers as shown
in Figure 6.5(A). Quantification of the aglycone (i) is straightforward and
requires use of the sample handling and analysis conditions described above.
The quantification of the acyl glucuronide isomers requires separation of the
1-b-isomer from the other isomers. b-glucuronidase is used to selectively cleave
the 1-b isomer followed by quantification of the aglycone (ii) as shown in
Figure 6.5(B). Following this, the remaining acyl glucuronide isomers are
quantified via base hydrolysis and subsequent quantitation of the releasedaglycone (iii) as shown in Figure 6.5(C). The concentration of acyl glucuronide
isomers is estimated as the difference between (iii) and (ii). In this way one can
use the subtraction method to estimate the concentration of both the 1-b and
rearrangement isomers using LC–MS/MS. It is also possible to obtain a time
course of the hydrolysis and rearrangement of the acyl glucuronide. Using this
technique it was possible to quantify the amount of acyl glucuronide bound to
HSA as shown in Figure 6.20. The extent of covalent modification can also be
measured directly. Radiolabeled drug can be administered to a rat or monkey.
Figure 6.20 The ranking of compounds according to their extent of covalent binding expressedin millimoles irreversibly bound per mole protein, normalized by protein content and expressedas the percentage of total acyl glucuronide present at the beginning of the reactivity phase. Acylglucuronide was measured using LC–MS/MS and the difference assay. (Source: Bolze, S. et al. DrugMetab. Dispos., 30, 404, 2002. With permission.)
198 Using Mass Spectrometry for Drug Metabolism Studies
Copyright © 2005 CRC Press, LLC
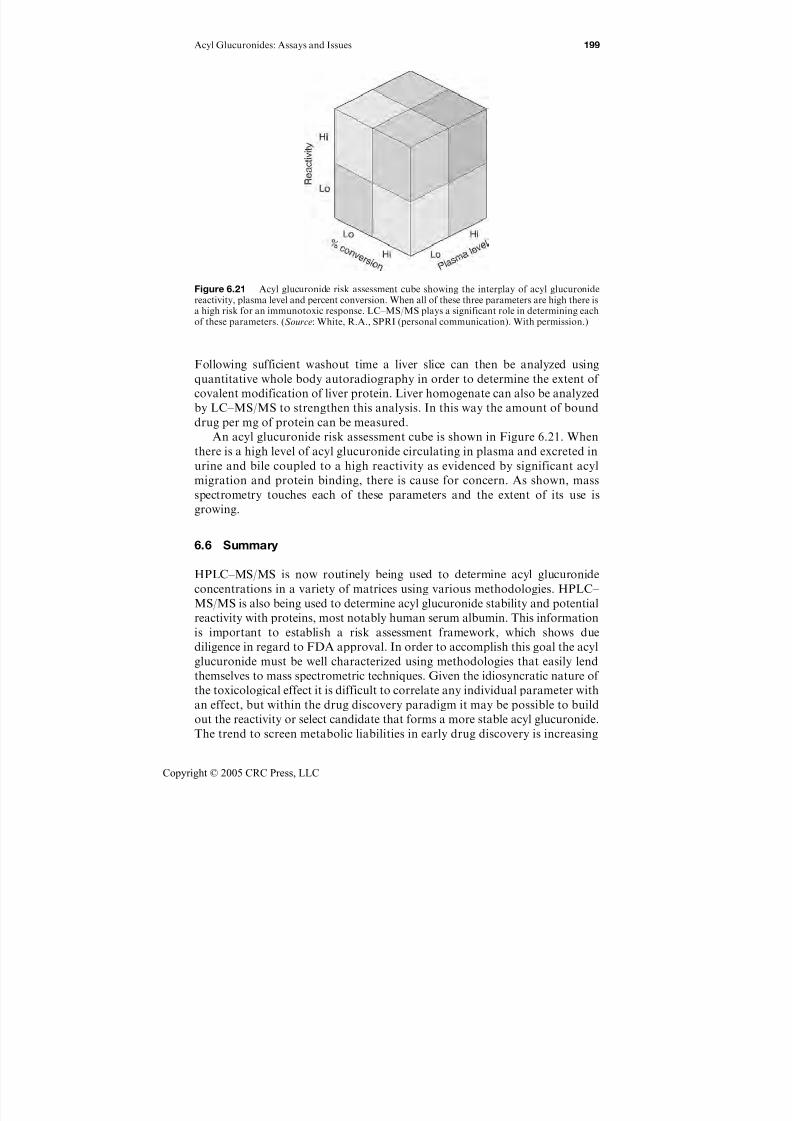
7/21/2019 Using Mass Spectrometry for Drug Metabolism Studies
http://slidepdf.com/reader/full/using-mass-spectrometry-for-drug-metabolism-studies 206/362
Following sufficient washout time a liver slice can then be analyzed using
quantitative whole body autoradiography in order to determine the extent of covalent modification of liver protein. Liver homogenate can also be analyzed
by LC–MS/MS to strengthen this analysis. In this way the amount of bound
drug per mg of protein can be measured.
An acyl glucuronide risk assessment cube is shown in Figure 6.21. When
there is a high level of acyl glucuronide circulating in plasma and excreted in
urine and bile coupled to a high reactivity as evidenced by significant acyl
migration and protein binding, there is cause for concern. As shown, mass
spectrometry touches each of these parameters and the extent of its use is
growing.
6.6 Summary
HPLC–MS/MS is now routinely being used to determine acyl glucuronide
concentrations in a variety of matrices using various methodologies. HPLC–
MS/MS is also being used to determine acyl glucuronide stability and potential
reactivity with proteins, most notably human serum albumin. This information
is important to establish a risk assessment framework, which shows due
diligence in regard to FDA approval. In order to accomplish this goal the acyl
glucuronide must be well characterized using methodologies that easily lend
themselves to mass spectrometric techniques. Given the idiosyncratic nature of
the toxicological effect it is difficult to correlate any individual parameter with
an effect, but within the drug discovery paradigm it may be possible to build
out the reactivity or select candidate that forms a more stable acyl glucuronide.
The trend to screen metabolic liabilities in early drug discovery is increasing
Figure 6.21 Acyl glucuronide risk assessment cube showing the interplay of acyl glucuronidereactivity, plasma level and percent conversion. When all of these three parameters are high there isa high risk for an immunotoxic response. LC–MS/MS plays a significant role in determining eachof these parameters. (Source: White, R.A., SPRI (personal communication). With permission.)
Acyl Glucuronides: Assays and Issues 199
Copyright © 2005 CRC Press, LLC
7/21/2019 Using Mass Spectrometry for Drug Metabolism Studies
http://slidepdf.com/reader/full/using-mass-spectrometry-for-drug-metabolism-studies 207/362
and LC–MS/MS is a major player [43]. More research is required to recognize
altered enzyme function, release of cytokines and track antibody levels
mediated by acyl glucuronide action. A significant portion of this research may
benefit from the tools of mass spectrometry.
6.7 Acknowledgement
The author thanks Dr Dan Prelusky, Lisa Broske and Lydia Wang for their
efforts in animal dosing and radioactivity counting. Drs Ronald White, Nigel
Clarke, Diane Rindgen, and Kathleen Cox are gratefully acknowledged for
their invaluable input and many discussions regarding acyl glucuronides.
References
1. Faed, E.M., Properties of acyl glucuronides: implications for studies of the
pharmacokinetics and metabolism of acidic drugs, Drug Metab. Rev., 15, 1213,
1984.
2. Spahn-Langguth, H. and Benet, L.Z., Acyl glucuronides revisited: is the
glucuronidation process a toxification as well as a detoxification mechanism?,
Drug Metab. Rev., 24, 5, 1992.
3. Shipkova, M. et al. Acyl glucuronide drug metabolites: toxicological and analyticalconsiderations, Thera. Drug Mon., 25, 1, 2003.
4. Williams, D.P. and Park, B.K., Idiosyncratic toxicity: the role of toxicophores and
bioactivation, Drug Disc. Today., 8, 1044, 2003.
5. Bailey, M.J. and Dickinson, R.G., Acyl glucuronide reactivity in perspective:
biological consequences, Chem.-Bio. Inter., 145, 117, 2003.
6. Fenselau, C., Acyl glucuronides as chemically reactive intermediates; in Conjuga-
tion – deconjugation reactions in drug metabolism and toxicity, Kauffman, F.C., Ed.,
Springer-Verlag, Berlin, 1994, 367.
7. Spahn, H. et al. Procedures to characterize in vivo and in vitro enantioselective
glucuronidation properly: studies with benoxaprofen glucuronides, Pharm. Res., 6,
125, 1989.
8. Ebner, T. et al. Disposition and chemical stability of telmisartan 1-O-acyl
glucuronide, Drug Metab. Dispos., 27, 1143, 1999.
9. Prueksaritanont, T. et al. Glucuronidation of statins in animal and humans: a novel
mechanism of statin lactonization, Drug Metab. Dispos., 30, 505, 2002.
10. Mutlib, A.E. et al. Disposition of 1-[3-(aminomethyl)phenyl]-N -[3-fluoro-
20-(methylsulfonyl)-[1,10-biphenyl]-4-yl]-3-(trifluoromethyl)-1H -pyrazole-5-carbox-
amide (DPC 423) by novel metabolic pathways. Characterization of unusual
metabolites by liquid chromatography/mass spectrometry and NMR, Chem. Res.Toxicol ., 15, 48, 2002.
11. Corcoran, O. et al. HPLC/1H NMR spectroscopic studies of the reactive a-1-O-acyl
isomer formed during acyl migration of S -naproxen b-1-O-acyl glucuronide, Chem.
Res. Toxicol., 14, 1363, 2001.
12. Ware, J.A. et al. Immunochemical detection and identification of protein adducts of
diclofenac in the small intestine of rats: possible role in allergic reactions, Chem.
Res. Toxicol., 11, 164, 1998.
200 Using Mass Spectrometry for Drug Metabolism Studies
Copyright © 2005 CRC Press, LLC
7/21/2019 Using Mass Spectrometry for Drug Metabolism Studies
http://slidepdf.com/reader/full/using-mass-spectrometry-for-drug-metabolism-studies 208/362
13. Bougie, D. et al. Sensitivity to a metabolite of diclofenac as a cause of acute immune
hemolytic anemia, Blood , 90, 407, 1997.
14. Boelstreli, U.A., Xenobiotic acyl glucuronides and acyl CoA thioesters as protein
reactive metabolites with the potential to cause idiosyncratic drug reactions, Curr.
Drug, Metab., 3, 439, 2002.
15. Paulson, S.K. et al. Metabolism and excretion of [14C]Celecoxib in healthy male
volunteers, Drug Metab. Dispos., 28, 308, 2000.
16. Compernolle, F. et al. Glucuronic acid conjugates of bilirubin-IXalpha in
normal bile compared with post obstructive bile. Transformation of the 1-O-
acyl glucuronide into 2-, 3-, and 4-O-acyl glucuronides, Biochem. J., 171, 185,
1978.
17. Akira, K., Uchijima, T., and Hashimoto, T. Rapid internal acyl migration and
protein binding of synthetic probenecid glucuronides, Chem. Res. Toxicol ., 15, 765,
2002.18. Ebner, T. et al. Disposition and chemical stability of telmisartan 1-O-acyl
glucuronide, Drug Metab. Dispos., 27, 1143, 1999.
19. van Breemen, R.B. et al. Reaction of bilirubin glucuronides with serum albumin,
J. Chromatogr., 383, 387, 1986.
20. McDonagh, A.F. et al. Origin of mammalian biliprotein and rearrangement of
bilirubin glucuronides in vivo in the rat, J. Clin. Invest., 74, 763, 1984.
21. van Breemen, R.B. and Fenselau, C., Acylation of albumin by 1-O-acyl
glucuronides, Drug Metab. Dispos., 13, 318, 1985.
22. Wells, D.S., Janssen, F.W., and Ruelius, H.W., Interactions between oxaprozin
glucuronide and human serum albumin, Xenobiotica, 17, 1437, 1987.23. Ding, A. et al. Evidence for covalent binding of acyl glucuronides to serum albumin
via an imine mechanism as revealed by tandem mass spectrometry, Proc. Natl.
Acad. Sci., 90, 3797, 1993.
24. Qiu, Y., Burlingame, A.L., and Benet, L.Z., Mechanisms for covalent binding of
benoxaprofen glucuronide to human serum albumin: studies by tandem mass
spectrometry, Drug Metab. Dispos., 26, 246, 1998.
25. Ding, A. et al. Reactivity of tolmetin glucuronide with human serum albumin:
identification of binding sites and mechanisms of reaction by tandem mass
spectrometry, Drug Metab. Dispos., 23, 369, 1995.26. Grubb, N., Weil, A., and Caldwell, J., Studies on the in vitro reactivity of clofibryl
and fenofibryl glucuronides. Evidence for protein binding via a Schiff’s base
mechanism, Biochem. Pharmacol., 46, 357, 1993.
27. Smith, P.C., Benet, L.Z., and McDonagh, A.F., Covalent binding of zomepirac
glucuronide to proteins: evidence for a Schiff base mechanism, Drug Metab.
Dispos., 18, 639, 1990.
28. Khan, S., Teitz, D.S., and Jemal, M., Kinetic analysis by HPLC–electrospray
mass spectrometry of the pH-dependent acyl migration and solvolysis as the
decomposition pathways of ifetroban 1-O-acyl glucuronide, Anal. Chem., 70, 1622,
1998.29. Bolze, S. et al. Development of an in vitro screening model for the biosynthesis of
acyl glucuronide metabolites and the assessment of their reactivity toward human
serum albumin, Drug Metab. Dispos., 30, 404, 2002.
30. Hop, C.E.C.A. et al. Formation and reactivity of acyl glucuronides assessed by
LC/MS/MS, in Proceedings of the 48th ASMS Conference on Mass Spectrometry
and Allied Topics, Long Beach, CA, 2000.
31. Hayball, P.J., Formation and reactivity of acyl glucuronides, Chirality, 7, 1, 1995.
Acyl Glucuronides: Assays and Issues 201
Copyright © 2005 CRC Press, LLC
7/21/2019 Using Mass Spectrometry for Drug Metabolism Studies
http://slidepdf.com/reader/full/using-mass-spectrometry-for-drug-metabolism-studies 209/362
32. Prakash, C. and Soliman, V., Metabolism and excretion of a novel antianxiety drug
candidate, CP-93,393, in Long Evans rats: differentiation of regioisomeric
glucuronides by LC–MS/MS, Drug Metab. Dispos., 25, 1288, 1997.
33. Zhao, Y. et al. Simultaneous determination of SU5416 and its phase I and phase II
metabolites in rat and dog plasma by LC–MS/MS, J. Pharm. Biomed. Anal ., 25,
821, 2001.
34. Shirley, M.A. et al. Oxidative metabolism of a rexinoid and rapid phase II
metabolite identification by mass spectrometry, Drug Metab. Dispos., 25, 1144,
1997.
35. Benet, L.Z., Effect of pH on acyl migration and hydrolysis of tolmetin glucuronide,
Drug Metab. Dispos., 16, 322, 1988.
36. Rindgen, D. et al. The application of HPLC/tandem mass spectrometry for the
assessment of acyl glucuronide metabolite formation in in vitro and in vivo systems
in a drug discovery environment, Am. Pharm. Rev., 4, 52, 2001.37. Wainhaus, S.B. et al. Semi-quantitation of acyl glucuronides in early drug discovery
by LC–MS/MS, Am. Pharm. Rev., 5, 86, 2002.
38. Kamimori, et al. Synthesis of acyl glucuronides of drugs using immobilized
dog liver microsomes octadecylsilica particles coated with phospholipids, Anal.
Bichem., 317, 99, 2003.
39. Dickinson, R.G., et al. Disposition of valproic acid in the rat: dose dependent
metabolism, distribution, enterohepatic recirculation and choleretic effect,
J. Pharmacol . Exp. Ther., 211, 583, 1979.
40. Verbeek, R.K., Glucuronidation and disposition of drug glucuronides in patients
with renal failure, Drug Metab. Dispos., 10, 87, 1982.41. Shipkova, M. et al. Pharmacokinetics and protein adduct formation of the
pharmacologically active acyl glucuronide metabolite of mycophenolic acid in
pediatric renal transplant recipients, Ther. Drug Monit., 24, 390, 2002.
42. Olsen, J. et al. Chemical reactivity of the naproxen acyl glucuronide and the
naproxen coenzyme A thioester towards bionucleophiles, J. Pharm. Biomed. Anal.,
29, 7, 2002.
43. Xue, G., et al. Screening and identification of phase II metabolites using LC–MS/
MS, in Proceedings of the 51st ASMS Conference on Mass Spectrometry and Allied
Topics, Montreal, Quebec, 2003.
202 Using Mass Spectrometry for Drug Metabolism Studies
Copyright © 2005 CRC Press, LLC
7/21/2019 Using Mass Spectrometry for Drug Metabolism Studies
http://slidepdf.com/reader/full/using-mass-spectrometry-for-drug-metabolism-studies 210/362
Chapter 7
Utilizing Higher Mass Resolution inQuantitative Assays
Xiaoying Xu
7.1 Introduction
Increasing sensitivity and selectivity for quantitation in biological matrices is
of special interest in the pharmaceutical industry. Currently, the principal
technique used in quantitative bioanalysis is high-performance liquid chro-
matography coupled with tandem mass spectrometry (HPLC–MS/MS) using
either electrospray ionization (ESI) or atmospheric pressure chemical ioniza-tion (APCI) [1]. The triple quadrupole (QqQ) mass spectrometer (MS), when
operated in the selected reaction monitoring (SRM) mode, offers a unique
combination of sensitivity, specificity, and dynamic range. Consequently,
the QqQ MS has become the instrument of choice for high-throughput
quantification within the pharmaceutical industry. However, even with tandem
mass spectrometry, there is a need for chromatographic separation of the
analyte from endogenous compounds [2–6]. Traditionally, it is important to
achieve maximum chromatographic resolving power within a short chromato-
graphic time; sometimes, the HPLC method development can require a lot of
effort and can be quite time consuming. Another possible approach to improve
the measurement of the analyte is to increase the mass resolving power of the
MS. However, in the past, operation of a quadrupole mass spectrometer at
enhanced mass resolution usually resulted in a significant decrease in both ion
0-8493-1963-3/05/$0.00+$1.50 2005 by CRC Press 203
Copyright © 2005 CRC Press, LLC
7/21/2019 Using Mass Spectrometry for Drug Metabolism Studies
http://slidepdf.com/reader/full/using-mass-spectrometry-for-drug-metabolism-studies 211/362
transmission and signal detection. Therefore, unit mass resolution has been a
limitation of quadrupole MS instruments and that can be a problem when
interference from the matrix or a metabolite cannot readily be eliminated by
other means. In this chapter, new technologies are discussed which can providehigher mass resolution that can be used for quantitative assays. Several
examples are given which show data comparing higher mass resolution versus
unit mass resolution in terms of selectivity, limit of quantitation, accuracy,
precision, and linearity.
7.2 Instrumental Technology
Mass resolution, like sensitivity, is commonly used as a performancespecification for an MS instrument and varies greatly depending on the mass
spectrometer analyzer and the detailed design components of a particular
instrument. The mass resolution of a mass spectrometer is qualitatively defined
as its ability to discriminate between adjacent ions in a spectrum. Mass
resolution is often defined as a function of mass and is given by the following
equation: M /M , where M is the mass of the ion and M is the smallest
increment of mass that can be distinguished by the analyzer. The unit for mass
is daltons (Da) and M is often determined using the full width at half
maximum definition (FWHM) of the mass peaks [7].
7.2.1 Triple quadrupole (QqQ) mass spectrometer
The linear quadrupole mass analyzer is actually a mass filter. It consists of four
hyperbolic or round rods, which are placed parallel to each other in a radial
array. Opposite rods are charged by a positive or negative CD potential U on
which an oscillating radiofrequency voltage, V 0,cos!t, is superimposed. The
latter successively reinforces and overwhelms the DC field. Ions are introduced
into the quadrupole field by means of a low accelerating potential. The ions
start to oscillate in a plane perpendicular to the rod length as they traverse
through the quadrupole filter. The trajectories of the ions of one particular
m/z are stable. These ions are transmitted towards the detector. Ions with other
m/z have unstable trajectories and do not pass the mass filter, because the
amplitude of their oscillations becomes infinite. The quadrupole analyzer acts
as a band pass filter, the resolution of which depends on the ratio of DC and
AC potentials [8].
Generally, the resolution is set to unit mass, indicating that, for instance,
m/z¼ 200 and m/z¼ 201 can be distinguished; all ions with m/z values between
199.5 and 200.49 are attributed to m/z¼ 200 [9]. When M 1, not all the
m/z 200 ions traverse the analyzer at the same instant. Instead, because a small
range of m/z values is allowed through the analyzer at any given time under
these conditions, a few m/z 200 ions will begin to leak through the analyzer
when the value of the applied voltage (or other variable) corresponds to about
m/z 199.5. The number of ions will increase as the value of this variable
204 Using Mass Spectrometry for Drug Metabolism Studies
Copyright © 2005 CRC Press, LLC
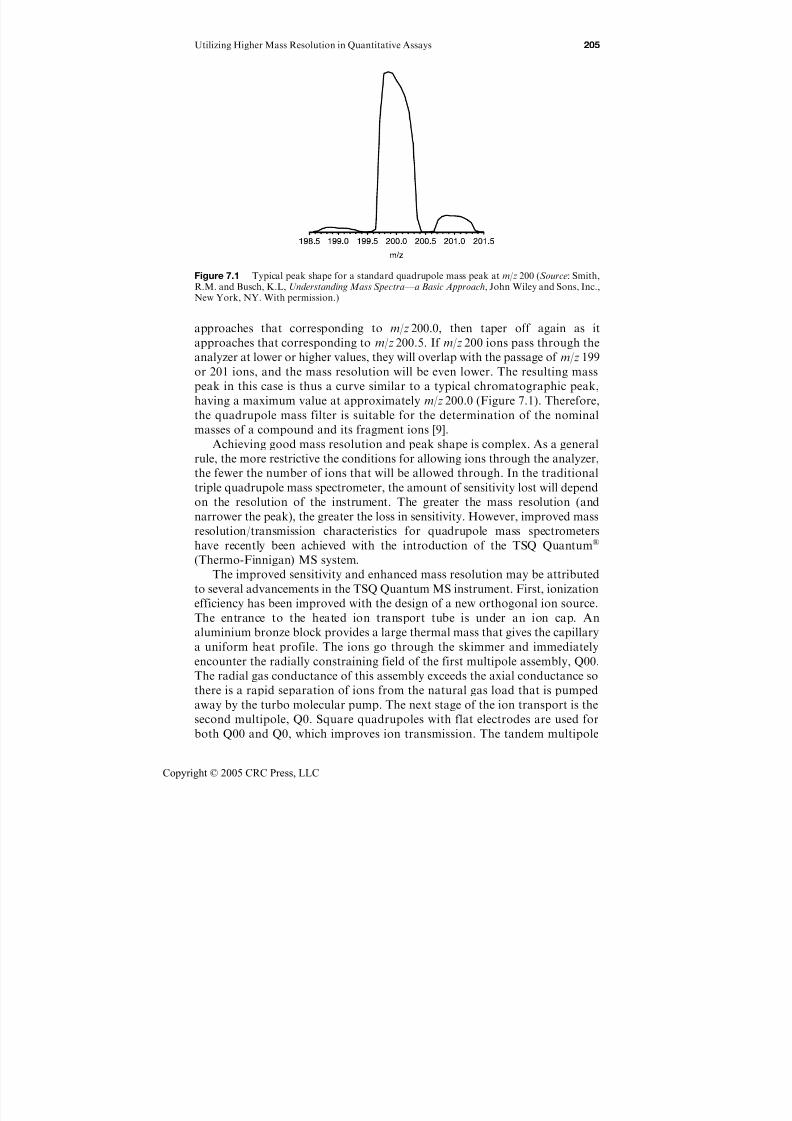
7/21/2019 Using Mass Spectrometry for Drug Metabolism Studies
http://slidepdf.com/reader/full/using-mass-spectrometry-for-drug-metabolism-studies 212/362
approaches that corresponding to m/z 200.0, then taper off again as it
approaches that corresponding to m/z 200.5. If m/z 200 ions pass through the
analyzer at lower or higher values, they will overlap with the passage of m/z 199
or 201 ions, and the mass resolution will be even lower. The resulting mass
peak in this case is thus a curve similar to a typical chromatographic peak,having a maximum value at approximately m/z 200.0 (Figure 7.1). Therefore,
the quadrupole mass filter is suitable for the determination of the nominal
masses of a compound and its fragment ions [9].
Achieving good mass resolution and peak shape is complex. As a general
rule, the more restrictive the conditions for allowing ions through the analyzer,
the fewer the number of ions that will be allowed through. In the traditional
triple quadrupole mass spectrometer, the amount of sensitivity lost will depend
on the resolution of the instrument. The greater the mass resolution (and
narrower the peak), the greater the loss in sensitivity. However, improved mass
resolution/transmission characteristics for quadrupole mass spectrometers
have recently been achieved with the introduction of the TSQ Quantum
(Thermo-Finnigan) MS system.
The improved sensitivity and enhanced mass resolution may be attributed
to several advancements in the TSQ Quantum MS instrument. First, ionization
efficiency has been improved with the design of a new orthogonal ion source.
The entrance to the heated ion transport tube is under an ion cap. An
aluminium bronze block provides a large thermal mass that gives the capillary
a uniform heat profile. The ions go through the skimmer and immediately
encounter the radially constraining field of the first multipole assembly, Q00.
The radial gas conductance of this assembly exceeds the axial conductance so
there is a rapid separation of ions from the natural gas load that is pumped
away by the turbo molecular pump. The next stage of the ion transport is the
second multipole, Q0. Square quadrupoles with flat electrodes are used for
both Q00 and Q0, which improves ion transmission. The tandem multipole
Figure 7.1 Typical peak shape for a standard quadrupole mass peak at m/z 200 (Source: Smith,R.M. and Busch, K.L, Understanding Mass Spectra — a Basic Approach, John Wiley and Sons, Inc.,New York, NY. With permission.)
Utilizing Higher Mass Resolution in Quantitative Assays 205
Copyright © 2005 CRC Press, LLC
7/21/2019 Using Mass Spectrometry for Drug Metabolism Studies
http://slidepdf.com/reader/full/using-mass-spectrometry-for-drug-metabolism-studies 213/362
arrangement also reduces the pressure in Q0, allowing for very efficient adduct
fragmentation without the reformation of adducts via ion–molecule reactions.
Second, the new instrument has four stages of pumping from a single hybrid
turbo molecular pump and single mechanical backing pump. This additionalstage of pumping allows the system to have larger orifice diameters between
the various stages, thereby increasing ion transmission from the source to the
mass analyzer. The ion source transfer optics and the collision cell with square
quadrupoles also increases ion transmission. Finally, the hyperbolic quadru-
pole rods and the accompanying radiofrequency (RF) circuitry have been
redesigned. In this instrument, new hyperbolic quadrupole mass filters with
larger 6-mm internal field radius and 250-mm length have been developed. It
has been shown that the QqQ performance and ion transmission are better
when hyperbolic electrodes are used rather than the circular ones, which areused in most traditional QqQ instruments [10]. The mass resolution of a
quadrupole mass filter is proportional to the number of RF cycles an ion
experiences while traversing the quadrupole rods, which, in turn, is related
to the RF frequency and the length of the quadrupole rods. For the TSQ
Quantum MS, the m/z range was reduced to 1500 so that the RF frequency
could be kept as high as possible at the maximum RF voltage thereby
increasing the resolving power. The RF generator circuit was redesigned so
that the RF voltage could be increased while minimizing heat production
within the RF generator. The overall changes of larger r0 (6 mm), increasedRF voltage (10 kV peak to peak) and increased RF frequency (1.123 MHz)
contribute to the improved ion transmission at enhanced mass resolution [11].
Figure 7.2(A) shows a test compound’s partial mass spectrum (Q1 scan) under
‘‘unit mass resolution’’ (Q1 at 0.7 Da FWHM) and enhanced mass resolu-
tion (Q1 at 0.2 Da FWHM). Figure 7.2(B) shows a ThermoFinnigan test
compound’s partial mass spectrum (Q1 scan) under different mass resolution
settings (Q1 at 0.7, 0.45, 0.2, 0.1, and 0.07 Da FWHM). The relative abundance
of the ion decreased when the mass resolution increased. At a peak width of
0.2 Da FWHM, the relative abundance of the ion (10.2 E5) was only reduced
by about 33% relative to the abundance (15.3 E5) at the unit mass resolution
setting, 0.7 Da FWHM. At a peak width of 0.1 Da FWHM, the relative
abundance of the ion (6.3 E5) is about 40% of the one at 0.7 Da FWHM
(15.3 E5). In this example, the mass resolution was also set to 0.07 Da FWHM
and the relative abundance of the ion (2.2 E5) decreased significantly (now only
about 14% of the original 0.7 Da FWHM ion intensity). In this example, it can
be seen that significant increases in mass resolution were obtained (0.2 Da
FWHM) before the signal intensity dropped below 50% of the unit mass
resolution setting. In other QqQ MS systems, a mass resolution setting of
0.2 Da FWHM would result in an unacceptable loss of signal.
7.2.2 Quadrupole time-of-flight (Q-TOF) mass spectrometer
Mass analysis with a time-of-flight mass analyzer is based on the simple
principle that ions that are given the same kinetic energy will have velocities
206 Using Mass Spectrometry for Drug Metabolism Studies
Copyright © 2005 CRC Press, LLC

7/21/2019 Using Mass Spectrometry for Drug Metabolism Studies
http://slidepdf.com/reader/full/using-mass-spectrometry-for-drug-metabolism-studies 214/362
Figure 7.2 (A) Mass spectra of a candidate compound (Q1 scan). (a) Unit mass resolution (Q1 at0.7 Da FWHM) and (b) enhanced mass resolution (Q1 at 0.2 Da FWHM). (B) Mass spectra of acandidate compound (Q1 scan) showing the change in peak shape and peak height as the massresolution was increased. It can be seen that as the mass resolution changed from 0.7 Da FWHM(unit mass resolution) to 0.2 Da FWHM, the mass peaks are sharper, but the signal intensity (peakheight) changed only from 15.3 E5 to 10.2 E5. Even going to a mass resolution that gave a 0.07 DaFWHM, the signal intensity was still 2.2 E5. (Figure provided by and used with the permission of Thermo-Finnigan.)
Utilizing Higher Mass Resolution in Quantitative Assays 207
Copyright © 2005 CRC Press, LLC
7/21/2019 Using Mass Spectrometry for Drug Metabolism Studies
http://slidepdf.com/reader/full/using-mass-spectrometry-for-drug-metabolism-studies 215/362
proportional to their masses. The potential energy given to each ion, then, is
eV , where e is the number of charges on the ion. The output of the detector is
plotted as a function of time, and this time is converted to mass-to-charge
values by the data system [9]. Unlike quadrupole instruments, which workby eliminating all ions except those of the mass being detected, the TOF
instrument detects all of the ions in a draw-out pulse, thus producing a full
mass spectrum with each pulse.
A hybrid quadrupole orthogonal acceleration time-of-flight (Q-TOF)
instrument can be used to acquire data in both the MS and MS/MS modes
of operation. For normal mass spectra, the quadrupole is used in the RF-only
mode as a wide-bandpass filter to transmit a wide mass range of ions, the
collision cell is not pressurized, and ions are transmitted to the TOF for mass
analysis. In the MS/MS mode, the quadrupole operates in the normal resolvingmode and is able to select precursor ions up to m/z 4000 for collisionally
activated dissociation (CAD). Following CAD, the product ions are trans-
mitted to the TOF for mass analysis. In contrast to the QqQ, it is the ratio
(m/z)max/(m/z)min that is important, not the difference in these value. The
acquisition is made through a time-to-digital converter (TDC). The orthogonal
geometry and parallel rather than sequential detection of ions leads to a
significant improvement in sensitivity over scanning instruments (e.g., the
QqQ) when used to acquire full-scan spectra [12]. To obtain optimum signal-
to-noise (S/N) ratios, a quadrupole analyzer must allow a limited numberof selected ions to pass. Most ions are filtered out, along with much of
their qualitative information content. Conversely, time-of-flight instruments
inherently conserve, separate, and detect a significantly greater percentage
(5–50%) of the ions that have been sampled into the high-vacuum region [13].
The enhanced ion throughput allows time-of-flight instruments to obtain
full-scan spectra with better signal-to-noise (S/N) characteristics than
comparable spectra obtained with a scanning quadrupole MS. In addition,
the increased specificity provided by the higher mass resolution Q-TOF
may provide a S/N benefit in some analytical situations [14]. While time-
of-flight data appear to be 1 order of magnitude more sensitive than data
obtained from single-quadrupole instruments, they cannot yet match the
S/N ratios obtained from QqQ systems using selected reaction monitoring
(SRM) [15].
7.3 Review of Recent Literature
7.3.1 Triple quadrupole (QqQ) mass spectrometers
Triple quadrupole mass spectrometers usually provide excellent sensitivity and
selectivity for quantitative analysis. An advantage of the triple quadrupole over
many other technologies is the sensitivity of the selected reaction monitoring
(SRM) and selected ion monitoring (SIM) modes of operation. Occasionally,
interference from the matrix or a metabolite cannot be eliminated using unit
208 Using Mass Spectrometry for Drug Metabolism Studies
Copyright © 2005 CRC Press, LLC
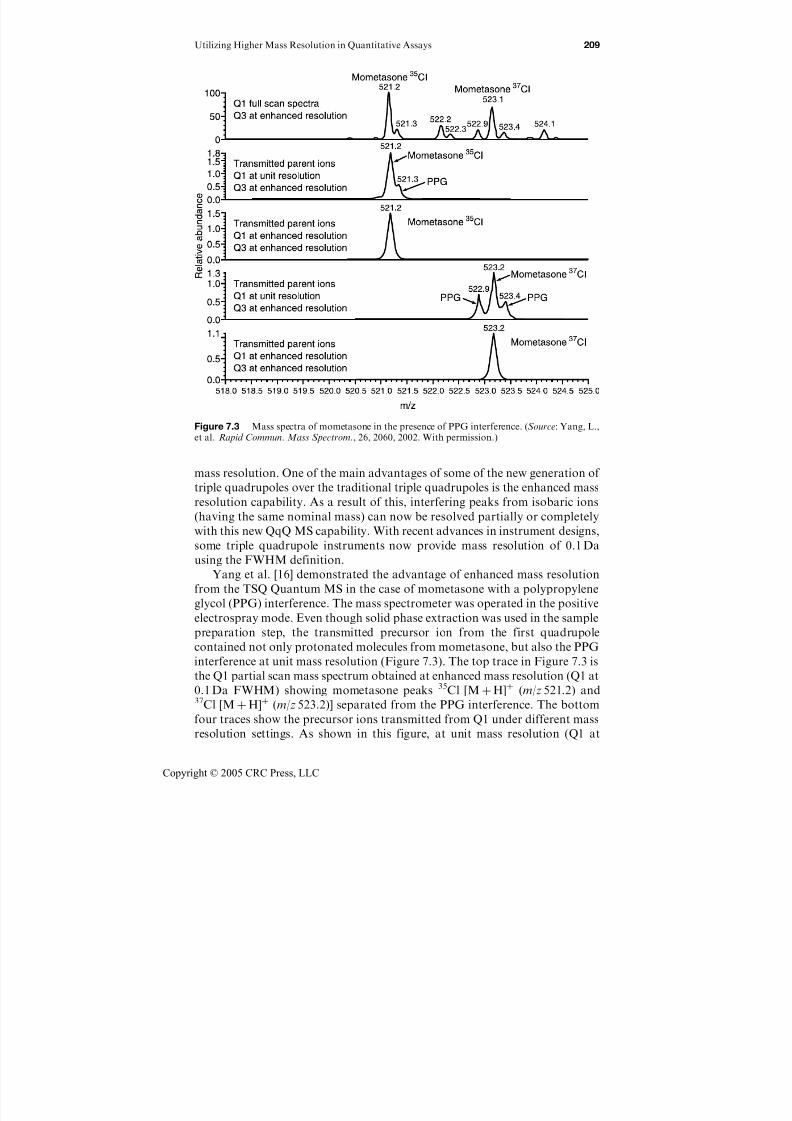
7/21/2019 Using Mass Spectrometry for Drug Metabolism Studies
http://slidepdf.com/reader/full/using-mass-spectrometry-for-drug-metabolism-studies 216/362
mass resolution. One of the main advantages of some of the new generation of
triple quadrupoles over the traditional triple quadrupoles is the enhanced mass
resolution capability. As a result of this, interfering peaks from isobaric ions
(having the same nominal mass) can now be resolved partially or completely
with this new QqQ MS capability. With recent advances in instrument designs,
some triple quadrupole instruments now provide mass resolution of 0.1 Da
using the FWHM definition.
Yang et al. [16] demonstrated the advantage of enhanced mass resolution
from the TSQ Quantum MS in the case of mometasone with a polypropylene
glycol (PPG) interference. The mass spectrometer was operated in the positive
electrospray mode. Even though solid phase extraction was used in the sample
preparation step, the transmitted precursor ion from the first quadrupole
contained not only protonated molecules from mometasone, but also the PPG
interference at unit mass resolution (Figure 7.3). The top trace in Figure 7.3 is
the Q1 partial scan mass spectrum obtained at enhanced mass resolution (Q1 at
0.1 Da FWHM) showing mometasone peaks 35Cl [MþH]þ (m/z 521.2) and37Cl [MþH]þ (m/z 523.2)] separated from the PPG interference. The bottom
four traces show the precursor ions transmitted from Q1 under different mass
resolution settings. As shown in this figure, at unit mass resolution (Q1 at
Figure 7.3 Mass spectra of mometasone in the presence of PPG interference. (Source: Yang, L.,et al. Rapid Commun. Mass Spectrom., 26, 2060, 2002. With permission.)
Utilizing Higher Mass Resolution in Quantitative Assays 209
Copyright © 2005 CRC Press, LLC
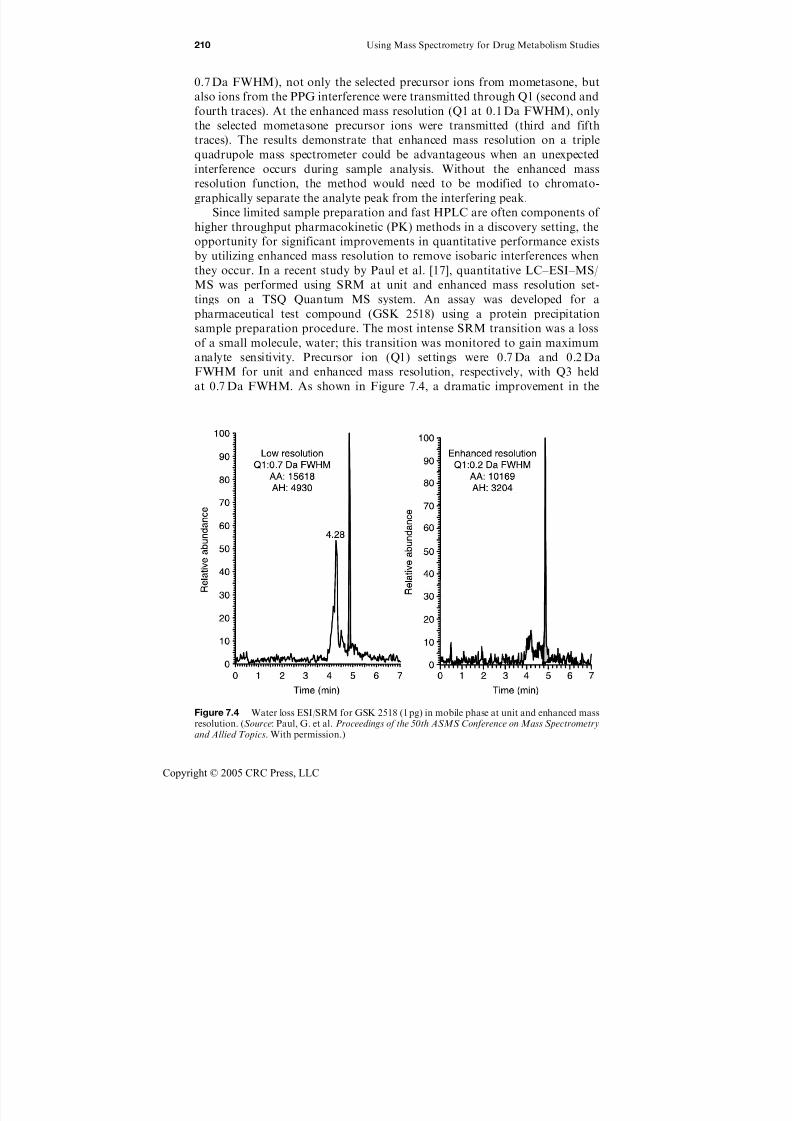
7/21/2019 Using Mass Spectrometry for Drug Metabolism Studies
http://slidepdf.com/reader/full/using-mass-spectrometry-for-drug-metabolism-studies 217/362
0.7 Da FWHM), not only the selected precursor ions from mometasone, but
also ions from the PPG interference were transmitted through Q1 (second and
fourth traces). At the enhanced mass resolution (Q1 at 0.1 Da FWHM), only
the selected mometasone precursor ions were transmitted (third and fifthtraces). The results demonstrate that enhanced mass resolution on a triple
quadrupole mass spectrometer could be advantageous when an unexpected
interference occurs during sample analysis. Without the enhanced mass
resolution function, the method would need to be modified to chromato-
graphically separate the analyte peak from the interfering peak.
Since limited sample preparation and fast HPLC are often components of
higher throughput pharmacokinetic (PK) methods in a discovery setting, the
opportunity for significant improvements in quantitative performance exists
by utilizing enhanced mass resolution to remove isobaric interferences whenthey occur. In a recent study by Paul et al. [17], quantitative LC–ESI–MS/
MS was performed using SRM at unit and enhanced mass resolution set-
tings on a TSQ Quantum MS system. An assay was developed for a
pharmaceutical test compound (GSK 2518) using a protein precipitation
sample preparation procedure. The most intense SRM transition was a loss
of a small molecule, water; this transition was monitored to gain maximum
analyte sensitivity. Precursor ion (Q1) settings were 0.7 Da and 0.2 Da
FWHM for unit and enhanced mass resolution, respectively, with Q3 held
at 0.7 Da FWHM. As shown in Figure 7.4, a dramatic improvement in the
Figure 7.4 Water loss ESI/SRM for GSK 2518 (1 pg) in mobile phase at unit and enhanced massresolution. (Source: Paul, G. et al. Proceedings of the 50th ASMS Conference on Mass Spectrometryand Allied Topics. With permission.)
210 Using Mass Spectrometry for Drug Metabolism Studies
Copyright © 2005 CRC Press, LLC
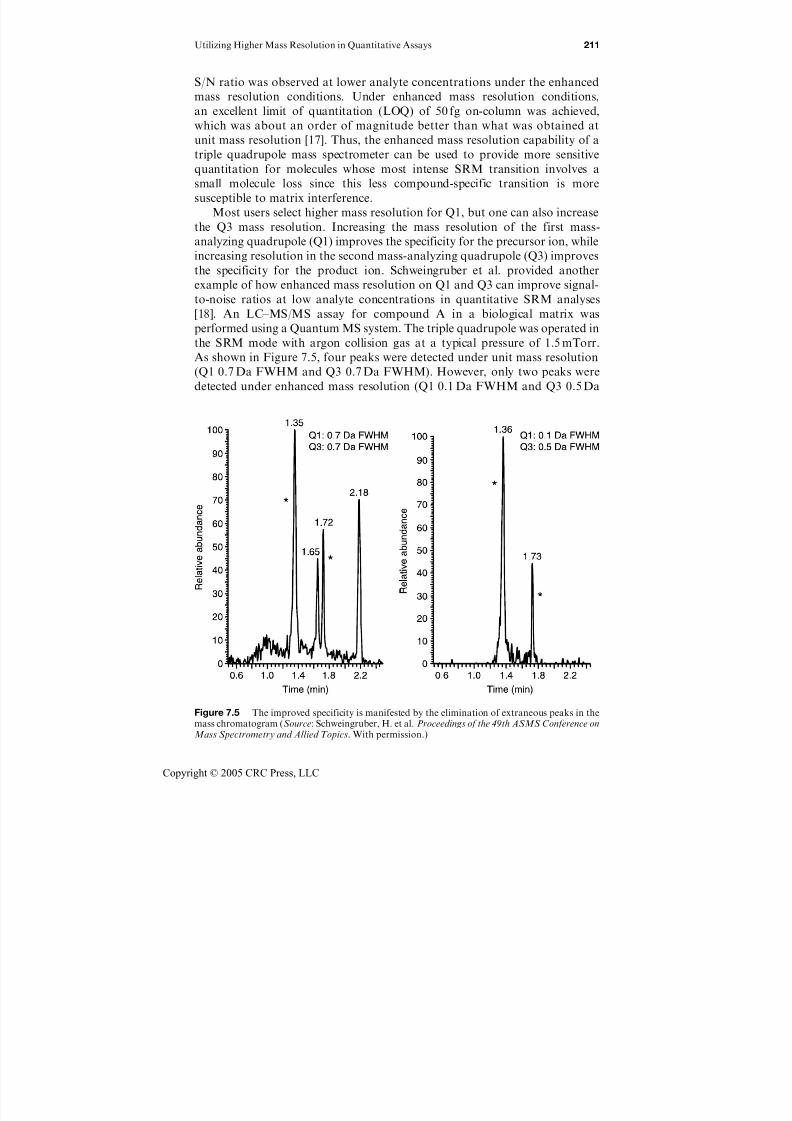
7/21/2019 Using Mass Spectrometry for Drug Metabolism Studies
http://slidepdf.com/reader/full/using-mass-spectrometry-for-drug-metabolism-studies 218/362
S/N ratio was observed at lower analyte concentrations under the enhanced
mass resolution conditions. Under enhanced mass resolution conditions,
an excellent limit of quantitation (LOQ) of 50 fg on-column was achieved,
which was about an order of magnitude better than what was obtained atunit mass resolution [17]. Thus, the enhanced mass resolution capability of a
triple quadrupole mass spectrometer can be used to provide more sensitive
quantitation for molecules whose most intense SRM transition involves a
small molecule loss since this less compound-specific transition is more
susceptible to matrix interference.
Most users select higher mass resolution for Q1, but one can also increase
the Q3 mass resolution. Increasing the mass resolution of the first mass-
analyzing quadrupole (Q1) improves the specificity for the precursor ion, while
increasing resolution in the second mass-analyzing quadrupole (Q3) improvesthe specificity for the product ion. Schweingruber et al. provided another
example of how enhanced mass resolution on Q1 and Q3 can improve signal-
to-noise ratios at low analyte concentrations in quantitative SRM analyses
[18]. An LC–MS/MS assay for compound A in a biological matrix was
performed using a Quantum MS system. The triple quadrupole was operated in
the SRM mode with argon collision gas at a typical pressure of 1.5 mTorr.
As shown in Figure 7.5, four peaks were detected under unit mass resolution
(Q1 0.7 Da FWHM and Q3 0.7 Da FWHM). However, only two peaks were
detected under enhanced mass resolution (Q1 0.1 Da FWHM and Q3 0.5 Da
Figure 7.5 The improved specificity is manifested by the elimination of extraneous peaks in themass chromatogram (Source: Schweingruber, H. et al. Proceedings of the 49th ASMS Conference onMass Spectrometry and Allied Topics. With permission.)
Utilizing Higher Mass Resolution in Quantitative Assays 211
Copyright © 2005 CRC Press, LLC

7/21/2019 Using Mass Spectrometry for Drug Metabolism Studies
http://slidepdf.com/reader/full/using-mass-spectrometry-for-drug-metabolism-studies 219/362
FWHM). The improved specificity is evident by the elimination of extraneous
peaks in the mass chromatogram. The anti-depressant drug alprazolam
(m/z 309.09) and polypropylene glycol (PPG, m/z 309.23) have only a 0.14 Da
mass difference; these two components could not be distinguished based ontheir mass at unit mass resolution. Indeed, if a component of interest of
unknown structure had the same nominal mass as a co-eluting unknown
background impurity, structural elucidation of the unknown by product ion
scanning on a typical unit mass resolution triple quadrupole instrument would
be confusing. In order to test the high resolving power of the new triple
quadrupole instrument, Amad et al. [19] performed the following test on a
Quantum MS system operated in the ESI mode. In this experiment, 10 pg of
alprazolam was injected on the column while 10 ng/mL PPG solution was
infused post-column to provide a steady background of chemical interference.The higher mass resolving power of the quadrupole mass filters (Q1 0.06 Da
FWHM and Q3 0.5 Da FWHM) was used. Figure 7.6(A) shows the mass
chromatograms and Figure 7.6(B) shows the corresponding mass spectra that
Figure 7.6 (A) Separation of alprazolam from interfering PPG by enhanced mass resolution (Q1:0.06 Da FWHM, Q3: 0.5 Da FWHM) in LC/ESI (Source: Amad, M. et al. Proceeding of the 49thASMS Conference on Mass Spectrometry and Allied Topics. With permission.)
212 Using Mass Spectrometry for Drug Metabolism Studies
Copyright © 2005 CRC Press, LLC
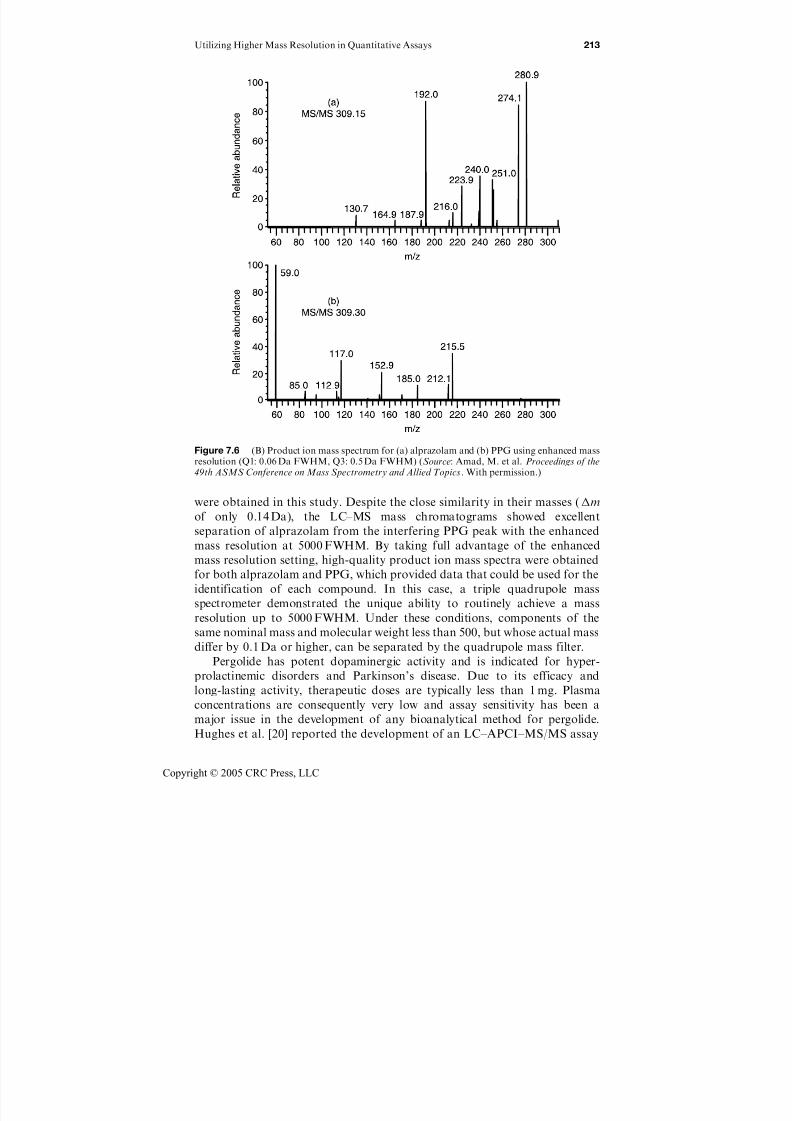
7/21/2019 Using Mass Spectrometry for Drug Metabolism Studies
http://slidepdf.com/reader/full/using-mass-spectrometry-for-drug-metabolism-studies 220/362
were obtained in this study. Despite the close similarity in their masses (m
of only 0.14 Da), the LC–MS mass chromatograms showed excellent
separation of alprazolam from the interfering PPG peak with the enhanced
mass resolution at 5000 FWHM. By taking full advantage of the enhanced
mass resolution setting, high-quality product ion mass spectra were obtained
for both alprazolam and PPG, which provided data that could be used for the
identification of each compound. In this case, a triple quadrupole mass
spectrometer demonstrated the unique ability to routinely achieve a mass
resolution up to 5000 FWHM. Under these conditions, components of the
same nominal mass and molecular weight less than 500, but whose actual mass
differ by 0.1 Da or higher, can be separated by the quadrupole mass filter.
Pergolide has potent dopaminergic activity and is indicated for hyper-
prolactinemic disorders and Parkinson’s disease. Due to its efficacy and
long-lasting activity, therapeutic doses are typically less than 1 mg. Plasma
concentrations are consequently very low and assay sensitivity has been a
major issue in the development of any bioanalytical method for pergolide.
Hughes et al. [20] reported the development of an LC–APCI–MS/MS assay
Figure 7.6 (B) Product ion mass spectrum for (a) alprazolam and (b) PPG using enhanced massresolution (Q1: 0.06 Da FWHM, Q3: 0.5 Da FWHM) (Source: Amad, M. et al. Proceedings of the49th ASMS Conference on Mass Spectrometry and Allied Topics. With permission.)
Utilizing Higher Mass Resolution in Quantitative Assays 213
Copyright © 2005 CRC Press, LLC
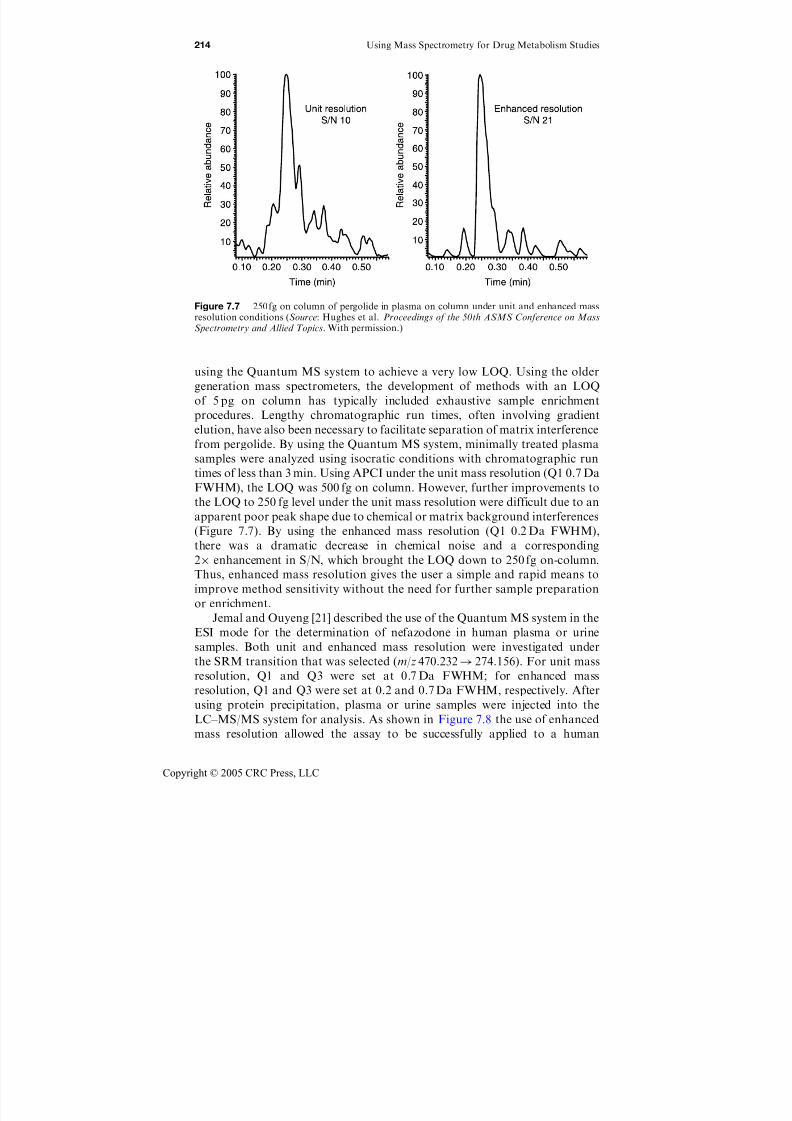
7/21/2019 Using Mass Spectrometry for Drug Metabolism Studies
http://slidepdf.com/reader/full/using-mass-spectrometry-for-drug-metabolism-studies 221/362
using the Quantum MS system to achieve a very low LOQ. Using the older
generation mass spectrometers, the development of methods with an LOQof 5 pg on column has typically included exhaustive sample enrichment
procedures. Lengthy chromatographic run times, often involving gradient
elution, have also been necessary to facilitate separation of matrix interference
from pergolide. By using the Quantum MS system, minimally treated plasma
samples were analyzed using isocratic conditions with chromatographic run
times of less than 3 min. Using APCI under the unit mass resolution (Q1 0.7 Da
FWHM), the LOQ was 500 fg on column. However, further improvements to
the LOQ to 250 fg level under the unit mass resolution were difficult due to an
apparent poor peak shape due to chemical or matrix background interferences
(Figure 7.7). By using the enhanced mass resolution (Q1 0.2 Da FWHM),
there was a dramatic decrease in chemical noise and a corresponding
2 enhancement in S/N, which brought the LOQ down to 250 fg on-column.
Thus, enhanced mass resolution gives the user a simple and rapid means to
improve method sensitivity without the need for further sample preparation
or enrichment.
Jemal and Ouyeng [21] described the use of the Quantum MS system in the
ESI mode for the determination of nefazodone in human plasma or urine
samples. Both unit and enhanced mass resolution were investigated under
the SRM transition that was selected (m/z 470.232! 274.156). For unit mass
resolution, Q1 and Q3 were set at 0.7 Da FWHM; for enhanced mass
resolution, Q1 and Q3 were set at 0.2 and 0.7 Da FWHM, respectively. After
using protein precipitation, plasma or urine samples were injected into the
LC–MS/MS system for analysis. As shown in Figure 7.8 the use of enhanced
mass resolution allowed the assay to be successfully applied to a human
Figure 7.7 250 fg on column of pergolide in plasma on column under unit and enhanced massresolution conditions (Source: Hughes et al. Proceedings of the 50th ASMS Conference on MassSpectrometry and Allied Topics. With permission.)
214 Using Mass Spectrometry for Drug Metabolism Studies
Copyright © 2005 CRC Press, LLC
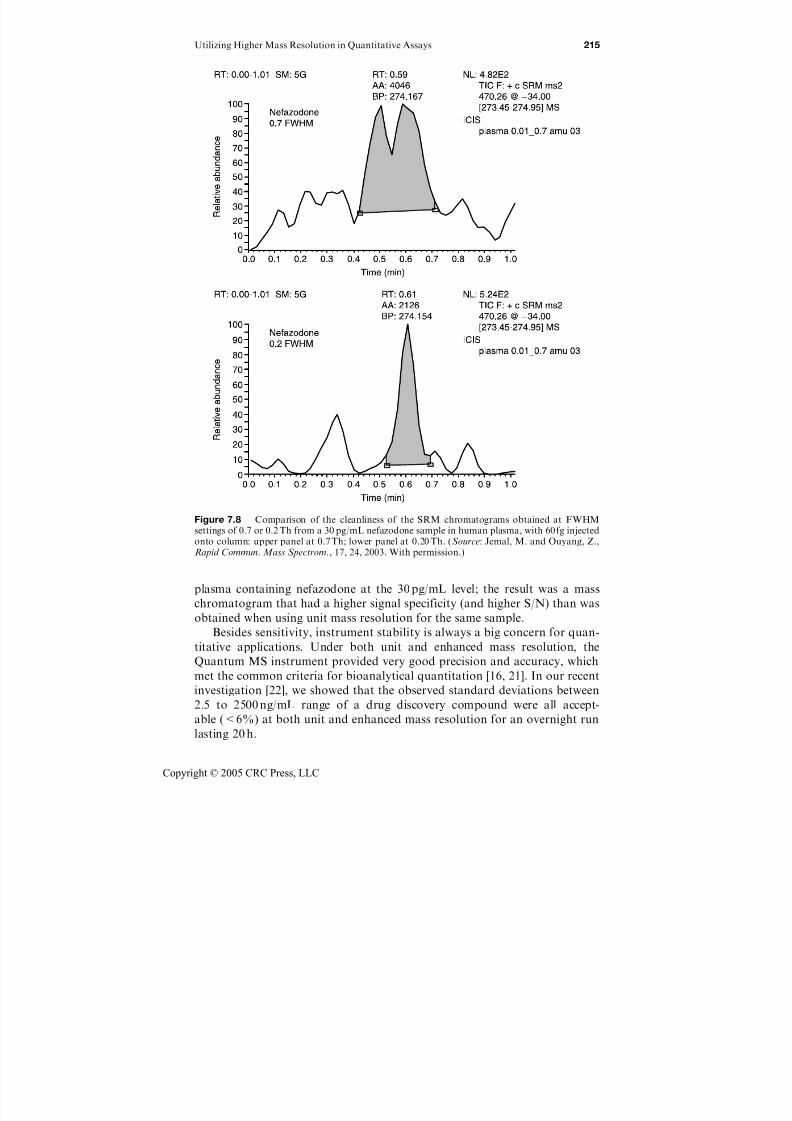
7/21/2019 Using Mass Spectrometry for Drug Metabolism Studies
http://slidepdf.com/reader/full/using-mass-spectrometry-for-drug-metabolism-studies 222/362
plasma containing nefazodone at the 30 pg/mL level; the result was a mass
chromatogram that had a higher signal specificity (and higher S/N) than was
obtained when using unit mass resolution for the same sample.
Besides sensitivity, instrument stability is always a big concern for quan-
titative applications. Under both unit and enhanced mass resolution, the
Quantum MS instrument provided very good precision and accuracy, which
met the common criteria for bioanalytical quantitation [16, 21]. In our recent
investigation [22], we showed that the observed standard deviations between
2.5 to 2500 ng/mL range of a drug discovery compound were all accept-
able (<6%) at both unit and enhanced mass resolution for an overnight run
lasting 20 h.
Figure 7.8 Comparison of the cleanliness of the SRM chromatograms obtained at FWHMsettings of 0.7 or 0.2 Th from a 30 pg/mL nefazodone sample in human plasma, with 60 fg injectedonto column: upper panel at 0.7 Th; lower panel at 0.20 Th. (Source: Jemal, M. and Ouyang, Z.,Rapid Commun. Mass Spectrom., 17, 24, 2003. With permission.)
Utilizing Higher Mass Resolution in Quantitative Assays 215
Copyright © 2005 CRC Press, LLC
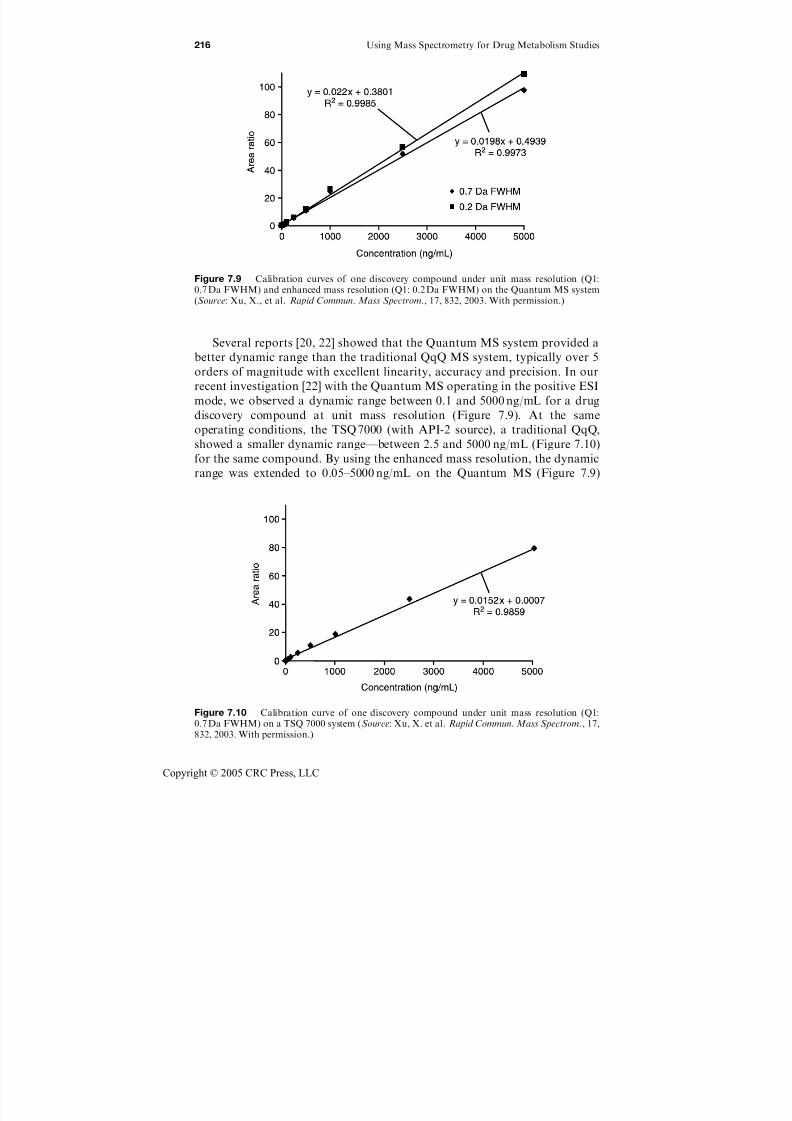
7/21/2019 Using Mass Spectrometry for Drug Metabolism Studies
http://slidepdf.com/reader/full/using-mass-spectrometry-for-drug-metabolism-studies 223/362
Several reports [20, 22] showed that the Quantum MS system provided a
better dynamic range than the traditional QqQ MS system, typically over 5
orders of magnitude with excellent linearity, accuracy and precision. In our
recent investigation [22] with the Quantum MS operating in the positive ESImode, we observed a dynamic range between 0.1 and 5000 ng/mL for a drug
discovery compound at unit mass resolution (Figure 7.9). At the same
operating conditions, the TSQ 7000 (with API-2 source), a traditional QqQ,
showed a smaller dynamic range—between 2.5 and 5000 ng/mL (Figure 7.10)
for the same compound. By using the enhanced mass resolution, the dynamic
range was extended to 0.05–5000 ng/mL on the Quantum MS (Figure 7.9)
Figure 7.9 Calibration curves of one discovery compound under unit mass resolution (Q1:0.7 Da FWHM) and enhanced mass resolution (Q1: 0.2 Da FWHM) on the Quantum MS system(Source: Xu, X., et al. Rapid Commun. Mass Spectrom., 17, 832, 2003. With permission.)
Figure 7.10 Calibration curve of one discovery compound under unit mass resolution (Q1:0.7 Da FWHM) on a TSQ 7000 system (Source: Xu, X. et al. Rapid Commun. Mass Spectrom., 17,832, 2003. With permission.)
216 Using Mass Spectrometry for Drug Metabolism Studies
Copyright © 2005 CRC Press, LLC
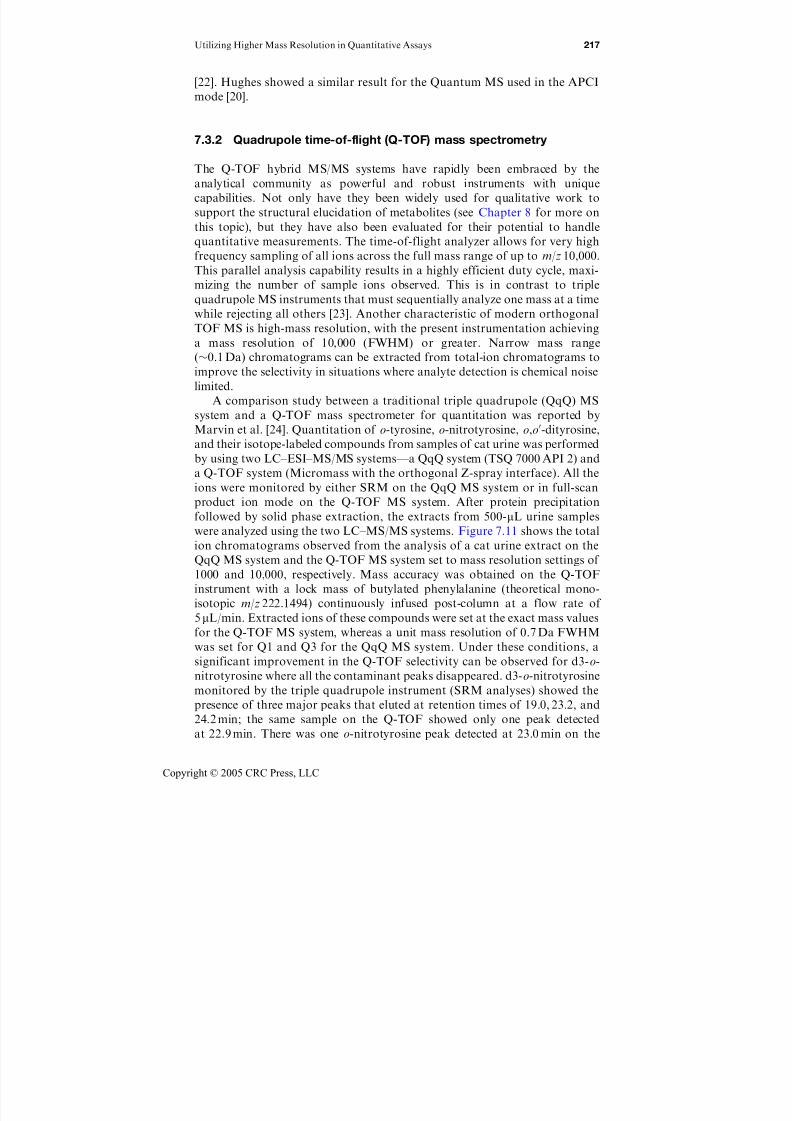
7/21/2019 Using Mass Spectrometry for Drug Metabolism Studies
http://slidepdf.com/reader/full/using-mass-spectrometry-for-drug-metabolism-studies 224/362
[22]. Hughes showed a similar result for the Quantum MS used in the APCI
mode [20].
7.3.2 Quadrupole time-of-flight (Q-TOF) mass spectrometry
The Q-TOF hybrid MS/MS systems have rapidly been embraced by the
analytical community as powerful and robust instruments with unique
capabilities. Not only have they been widely used for qualitative work to
support the structural elucidation of metabolites (see Chapter 8 for more on
this topic), but they have also been evaluated for their potential to handle
quantitative measurements. The time-of-flight analyzer allows for very high
frequency sampling of all ions across the full mass range of up to m/z 10,000.This parallel analysis capability results in a highly efficient duty cycle, maxi-
mizing the number of sample ions observed. This is in contrast to triple
quadrupole MS instruments that must sequentially analyze one mass at a time
while rejecting all others [23]. Another characteristic of modern orthogonal
TOF MS is high-mass resolution, with the present instrumentation achieving
a mass resolution of 10,000 (FWHM) or greater. Narrow mass range
(0.1 Da) chromatograms can be extracted from total-ion chromatograms to
improve the selectivity in situations where analyte detection is chemical noise
limited.A comparison study between a traditional triple quadrupole (QqQ) MS
system and a Q-TOF mass spectrometer for quantitation was reported by
Marvin et al. [24]. Quantitation of o-tyrosine, o-nitrotyrosine, o,o0-dityrosine,
and their isotope-labeled compounds from samples of cat urine was performed
by using two LC–ESI–MS/MS systems—a QqQ system (TSQ 7000 API 2) and
a Q-TOF system (Micromass with the orthogonal Z-spray interface). All the
ions were monitored by either SRM on the QqQ MS system or in full-scan
product ion mode on the Q-TOF MS system. After protein precipitation
followed by solid phase extraction, the extracts from 500-mL urine samples
were analyzed using the two LC–MS/MS systems. Figure 7.11 shows the total
ion chromatograms observed from the analysis of a cat urine extract on the
QqQ MS system and the Q-TOF MS system set to mass resolution settings of
1000 and 10,000, respectively. Mass accuracy was obtained on the Q-TOF
instrument with a lock mass of butylated phenylalanine (theoretical mono-
isotopic m/z 222.1494) continuously infused post-column at a flow rate of
5mL/min. Extracted ions of these compounds were set at the exact mass values
for the Q-TOF MS system, whereas a unit mass resolution of 0.7 Da FWHM
was set for Q1 and Q3 for the QqQ MS system. Under these conditions, a
significant improvement in the Q-TOF selectivity can be observed for d3-o-
nitrotyrosine where all the contaminant peaks disappeared. d3-o-nitrotyrosine
monitored by the triple quadrupole instrument (SRM analyses) showed the
presence of three major peaks that eluted at retention times of 19.0, 23.2, and
24.2 min; the same sample on the Q-TOF showed only one peak detected
at 22.9 min. There was one o-nitrotyrosine peak detected at 23.0 min on the
Utilizing Higher Mass Resolution in Quantitative Assays 217
Copyright © 2005 CRC Press, LLC
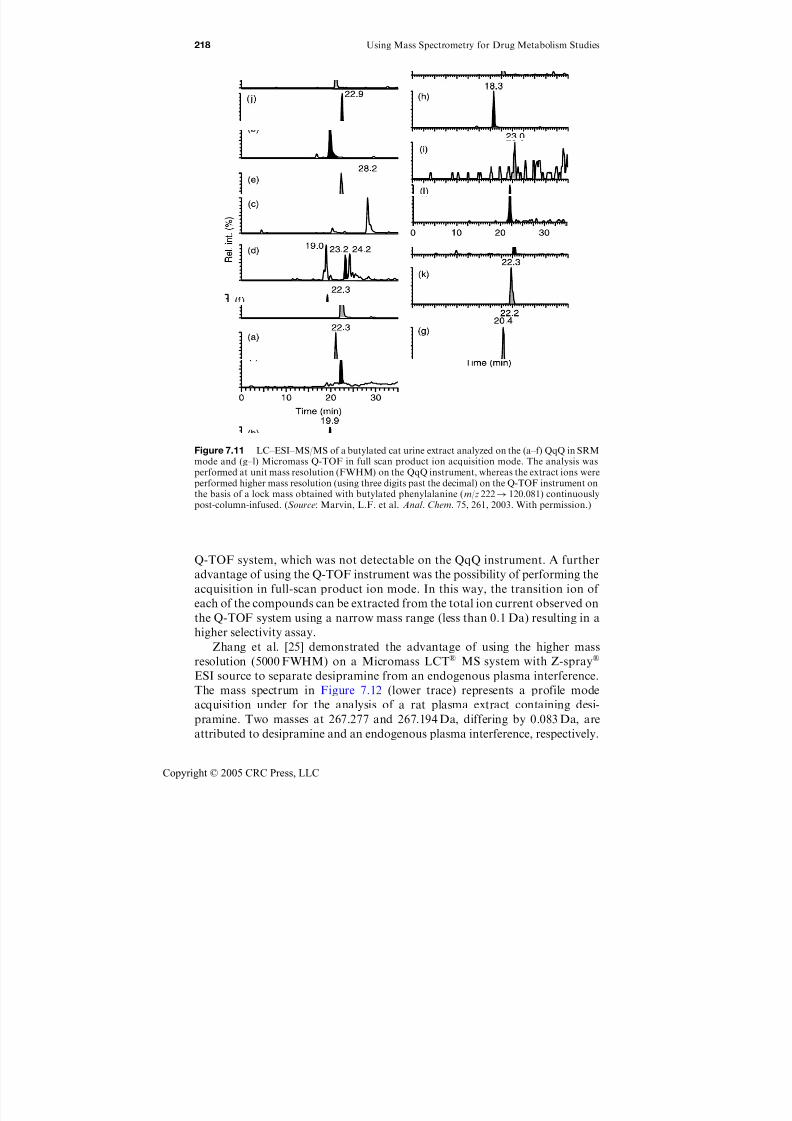
7/21/2019 Using Mass Spectrometry for Drug Metabolism Studies
http://slidepdf.com/reader/full/using-mass-spectrometry-for-drug-metabolism-studies 225/362
Q-TOF system, which was not detectable on the QqQ instrument. A further
advantage of using the Q-TOF instrument was the possibility of performing the
acquisition in full-scan product ion mode. In this way, the transition ion of
each of the compounds can be extracted from the total ion current observed on
the Q-TOF system using a narrow mass range (less than 0.1 Da) resulting in a
higher selectivity assay.
Zhang et al. [25] demonstrated the advantage of using the higher mass
resolution (5000 FWHM) on a Micromass LCT MS system with Z-spray
ESI source to separate desipramine from an endogenous plasma interference.
The mass spectrum in Figure 7.12 (lower trace) represents a profile mode
acquisition under for the analysis of a rat plasma extract containing desi-
pramine. Two masses at 267.277 and 267.194 Da, differing by 0.083 Da, are
attributed to desipramine and an endogenous plasma interference, respectively.
Figure 7.11 LC–ESI–MS/MS of a butylated cat urine extract analyzed on the (a–f) QqQ in SRMmode and (g–l) Micromass Q-TOF in full scan product ion acquisition mode. The analysis wasperformed at unit mass resolution (FWHM) on the QqQ instrument, whereas the extract ions wereperformed higher mass resolution (using three digits past the decimal) on the Q-TOF instrument onthe basis of a lock mass obtained with butylated phenylalanine (m/z 222! 120.081) continuouslypost-column-infused. (Source: Marvin, L.F. et al. Anal. Chem. 75, 261, 2003. With permission.)
218 Using Mass Spectrometry for Drug Metabolism Studies
Copyright © 2005 CRC Press, LLC
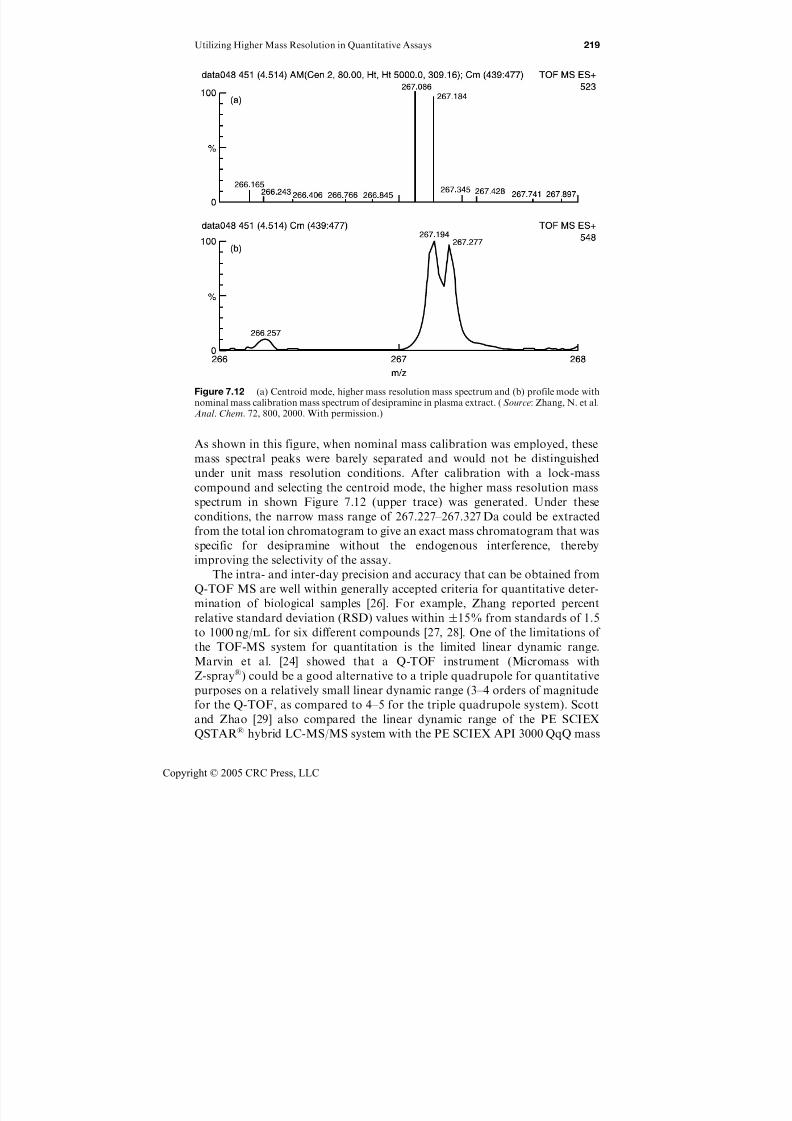
7/21/2019 Using Mass Spectrometry for Drug Metabolism Studies
http://slidepdf.com/reader/full/using-mass-spectrometry-for-drug-metabolism-studies 226/362
As shown in this figure, when nominal mass calibration was employed, these
mass spectral peaks were barely separated and would not be distinguished
under unit mass resolution conditions. After calibration with a lock-mass
compound and selecting the centroid mode, the higher mass resolution mass
spectrum in shown Figure 7.12 (upper trace) was generated. Under these
conditions, the narrow mass range of 267.227–267.327 Da could be extracted
from the total ion chromatogram to give an exact mass chromatogram that was
specific for desipramine without the endogenous interference, thereby
improving the selectivity of the assay.
The intra- and inter-day precision and accuracy that can be obtained from
Q-TOF MS are well within generally accepted criteria for quantitative deter-
mination of biological samples [26]. For example, Zhang reported percent
relative standard deviation (RSD) values within 15% from standards of 1.5
to 1000 ng/mL for six different compounds [27, 28]. One of the limitations of
the TOF-MS system for quantitation is the limited linear dynamic range.
Marvin et al. [24] showed that a Q-TOF instrument (Micromass with
Z-spray) could be a good alternative to a triple quadrupole for quantitative
purposes on a relatively small linear dynamic range (3–4 orders of magnitude
for the Q-TOF, as compared to 4–5 for the triple quadrupole system). Scott
and Zhao [29] also compared the linear dynamic range of the PE SCIEX
QSTAR hybrid LC-MS/MS system with the PE SCIEX API 3000 QqQ mass
Figure 7.12 (a) Centroid mode, higher mass resolution mass spectrum and (b) profile mode withnominal mass calibration mass spectrum of desipramine in plasma extract. ( Source: Zhang, N. et al.Anal. Chem. 72, 800, 2000. With permission.)
Utilizing Higher Mass Resolution in Quantitative Assays 219
Copyright © 2005 CRC Press, LLC
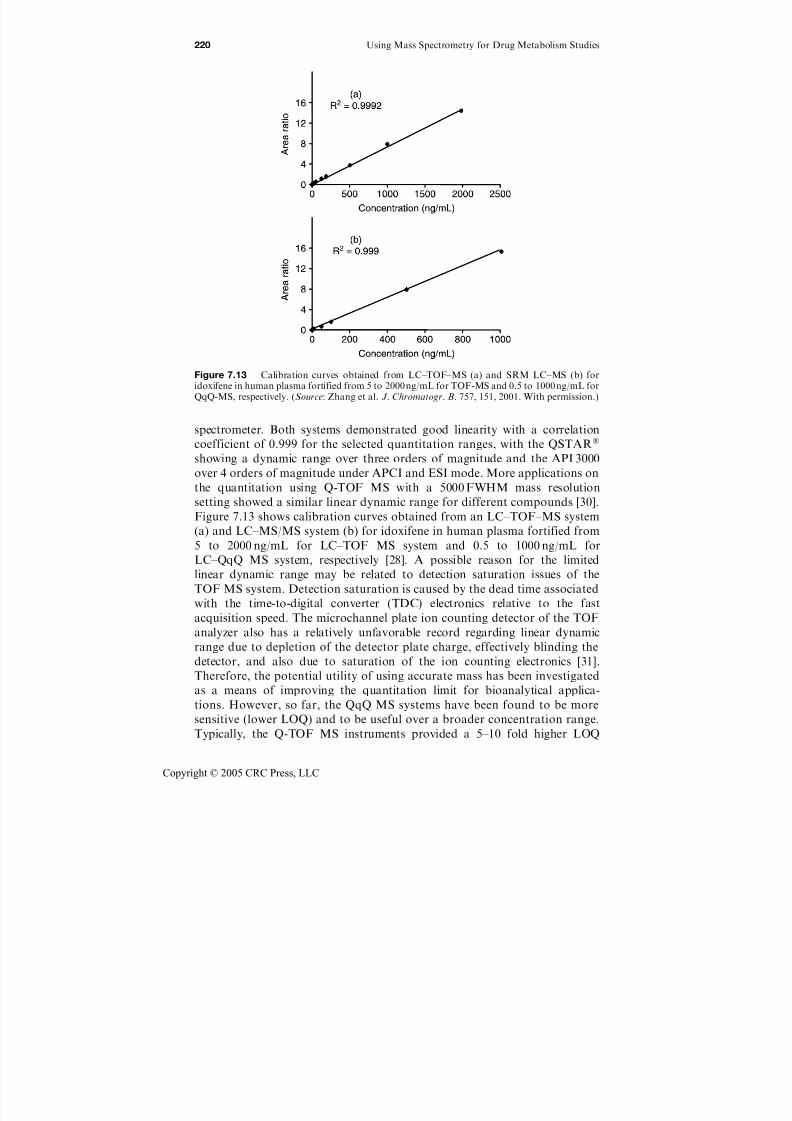
7/21/2019 Using Mass Spectrometry for Drug Metabolism Studies
http://slidepdf.com/reader/full/using-mass-spectrometry-for-drug-metabolism-studies 227/362
spectrometer. Both systems demonstrated good linearity with a correlation
coefficient of 0.999 for the selected quantitation ranges, with the QSTAR
showing a dynamic range over three orders of magnitude and the API 3000
over 4 orders of magnitude under APCI and ESI mode. More applications on
the quantitation using Q-TOF MS with a 5000 FWHM mass resolution
setting showed a similar linear dynamic range for different compounds [30].
Figure 7.13 shows calibration curves obtained from an LC–TOF–MS system
(a) and LC–MS/MS system (b) for idoxifene in human plasma fortified from
5 to 2000 ng/mL for LC–TOF MS system and 0.5 to 1000 ng/mL for
LC–QqQ MS system, respectively [28]. A possible reason for the limited
linear dynamic range may be related to detection saturation issues of the
TOF MS system. Detection saturation is caused by the dead time associated
with the time-to-digital converter (TDC) electronics relative to the fast
acquisition speed. The microchannel plate ion counting detector of the TOF
analyzer also has a relatively unfavorable record regarding linear dynamic
range due to depletion of the detector plate charge, effectively blinding the
detector, and also due to saturation of the ion counting electronics [31].
Therefore, the potential utility of using accurate mass has been investigated
as a means of improving the quantitation limit for bioanalytical applica-
tions. However, so far, the QqQ MS systems have been found to be more
sensitive (lower LOQ) and to be useful over a broader concentration range.
Typically, the Q-TOF MS instruments provided a 5–10 fold higher LOQ
Figure 7.13 Calibration curves obtained from LC–TOF–MS (a) and SRM LC–MS (b) for
idoxifene in human plasma fortified from 5 to 2000 ng/mL for TOF-MS and 0.5 to 1000 ng/mL forQqQ-MS, respectively. (Source: Zhang et al. J. Chromatogr. B. 757, 151, 2001. With permission.)
220 Using Mass Spectrometry for Drug Metabolism Studies
Copyright © 2005 CRC Press, LLC
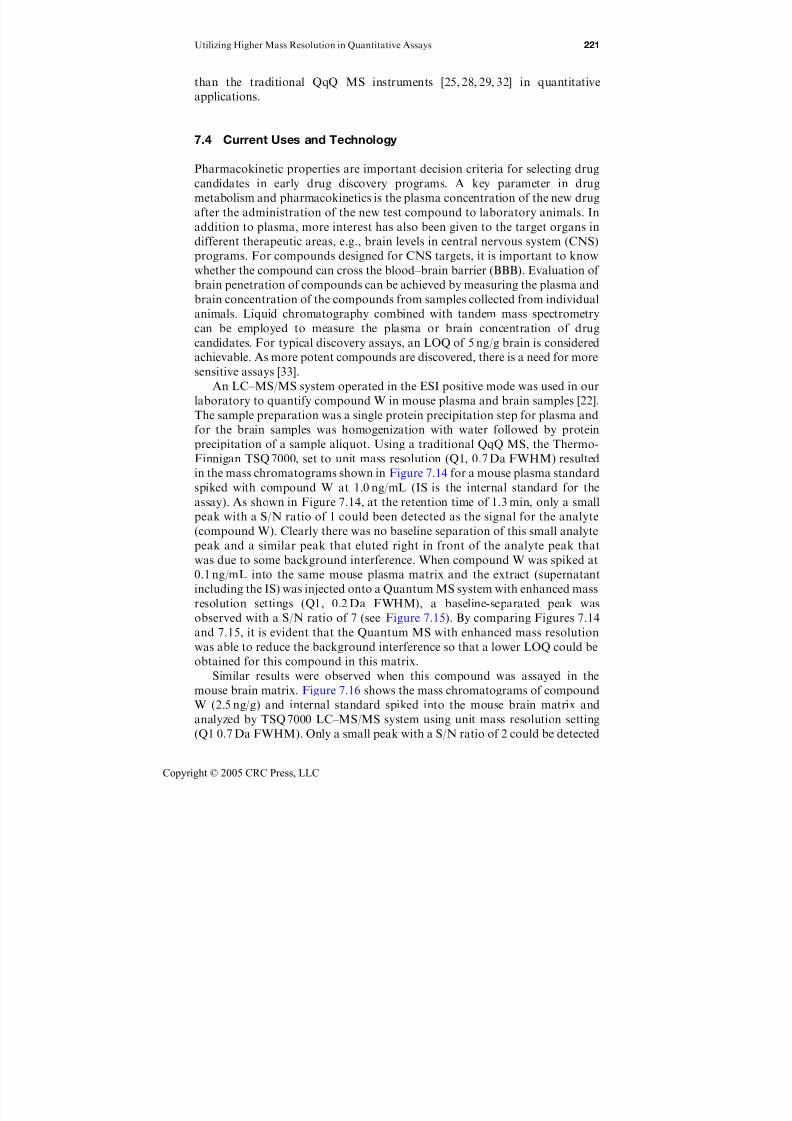
7/21/2019 Using Mass Spectrometry for Drug Metabolism Studies
http://slidepdf.com/reader/full/using-mass-spectrometry-for-drug-metabolism-studies 228/362
than the traditional QqQ MS instruments [25, 28, 29, 32] in quantitative
applications.
7.4 Current Uses and Technology
Pharmacokinetic properties are important decision criteria for selecting drug
candidates in early drug discovery programs. A key parameter in drug
metabolism and pharmacokinetics is the plasma concentration of the new drug
after the administration of the new test compound to laboratory animals. In
addition to plasma, more interest has also been given to the target organs in
different therapeutic areas, e.g., brain levels in central nervous system (CNS)
programs. For compounds designed for CNS targets, it is important to knowwhether the compound can cross the blood–brain barrier (BBB). Evaluation of
brain penetration of compounds can be achieved by measuring the plasma and
brain concentration of the compounds from samples collected from individual
animals. Liquid chromatography combined with tandem mass spectrometry
can be employed to measure the plasma or brain concentration of drug
candidates. For typical discovery assays, an LOQ of 5 ng/g brain is considered
achievable. As more potent compounds are discovered, there is a need for more
sensitive assays [33].
An LC–MS/MS system operated in the ESI positive mode was used in ourlaboratory to quantify compound W in mouse plasma and brain samples [22].
The sample preparation was a single protein precipitation step for plasma and
for the brain samples was homogenization with water followed by protein
precipitation of a sample aliquot. Using a traditional QqQ MS, the Thermo-
Finnigan TSQ 7000, set to unit mass resolution (Q1, 0.7 Da FWHM) resulted
in the mass chromatograms shown in Figure 7.14 for a mouse plasma standard
spiked with compound W at 1.0 ng/mL (IS is the internal standard for the
assay). As shown in Figure 7.14, at the retention time of 1.3 min, only a small
peak with a S/N ratio of 1 could been detected as the signal for the analyte
(compound W). Clearly there was no baseline separation of this small analyte
peak and a similar peak that eluted right in front of the analyte peak that
was due to some background interference. When compound W was spiked at
0.1 ng/mL into the same mouse plasma matrix and the extract (supernatant
including the IS) was injected onto a Quantum MS system with enhanced mass
resolution settings (Q1, 0.2 Da FWHM), a baseline-separated peak was
observed with a S/N ratio of 7 (see Figure 7.15). By comparing Figures 7.14
and 7.15, it is evident that the Quantum MS with enhanced mass resolution
was able to reduce the background interference so that a lower LOQ could be
obtained for this compound in this matrix.
Similar results were observed when this compound was assayed in the
mouse brain matrix. Figure 7.16 shows the mass chromatograms of compound
W (2.5 ng/g) and internal standard spiked into the mouse brain matrix and
analyzed by TSQ 7000 LC–MS/MS system using unit mass resolution setting
(Q1 0.7 Da FWHM). Only a small peak with a S/N ratio of 2 could be detected
Utilizing Higher Mass Resolution in Quantitative Assays 221
Copyright © 2005 CRC Press, LLC

7/21/2019 Using Mass Spectrometry for Drug Metabolism Studies
http://slidepdf.com/reader/full/using-mass-spectrometry-for-drug-metabolism-studies 229/362
Figure 7.15 Mass chromatograms of compound W (0.1 ng/mL) and internal standard spikedinto the plasma matrix, obtained using the Quantum LC–MS/MS system with positive ESI modeunder enhanced mass resolution (Q1 0.2 Da FWHM). (Source: Xu, X. et al. Rapid Commun. MassSpectrom., 17, 832, 2003. With permission.)
Figure 7.14 Mass chromatograms of compound W (1.0 ng/mL) and internal standard spikedinto the plasma matrix, obtained using the TSQ 7000 LC/MS/MS system with positive ESI modeunder unit mass resolution (Q1 0.7 Da FWHM). (Source: Xu, X. et al. Rapid Commun. MassSpectrom., 17, 832, 2003. With permission.)
222 Using Mass Spectrometry for Drug Metabolism Studies
Copyright © 2005 CRC Press, LLC

7/21/2019 Using Mass Spectrometry for Drug Metabolism Studies
http://slidepdf.com/reader/full/using-mass-spectrometry-for-drug-metabolism-studies 230/362
at the expected retention time. There was no baseline separation and high
level of background noise can be seen near the analyte. When compound
W was spiked at 0.25 ng/g into the same mouse brain matrix and the extract
(supernatant including the IS) was injected onto a Quantum MS system with
enhanced mass resolution settings (Q1, 0.2 Da FWHM), a sharp peak was
observed with a S/N ratio of 14 and essentially all the background interference
was eliminated (see Figure 7.17). From these experiments, it can be seen that
the LOQ of compound W was improved at least 10-fold in both plasma and
brain matrices by using the enhanced mass resolution capability of the
Quantum MS when the same assay is compared to the results that were
obtained using a traditional QqQ (TSQ 7000) MS system with unit mass
resolution capability.
All the results that we have obtained from different experiments have
indicated that background interferences from different biological matrices
could often be eliminated simply by using the enhanced mass resolution
capability of the new Quantum MS system; also, the LOQ was often
dramatically improved in these assays. However, it is important to remember
Figure 7.16 Mass chromatograms of compound W (2.5 ng/g) and internal standard spiked intothe brain matrix, obtained using the TSQ 7000 LC/MS/MS system with positive ESI mode underunit mass resolution (Q1 0.7 Da FWHM). (Source: Xu, X. et al. Rapid Commun. Mass Spectrom.,17, 832, 2003. With permission.)
Utilizing Higher Mass Resolution in Quantitative Assays 223
Copyright © 2005 CRC Press, LLC
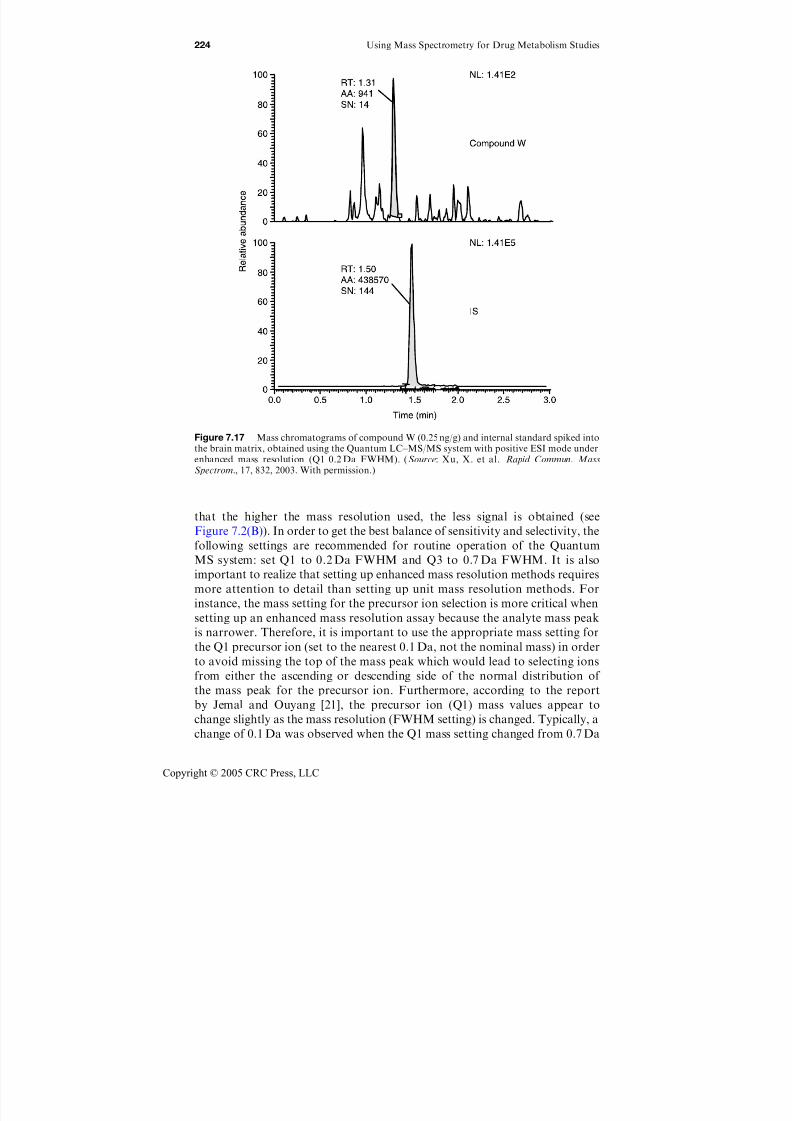
7/21/2019 Using Mass Spectrometry for Drug Metabolism Studies
http://slidepdf.com/reader/full/using-mass-spectrometry-for-drug-metabolism-studies 231/362
that the higher the mass resolution used, the less signal is obtained (see
Figure 7.2(B)). In order to get the best balance of sensitivity and selectivity, the
following settings are recommended for routine operation of the Quantum
MS system: set Q1 to 0.2 Da FWHM and Q3 to 0.7 Da FWHM. It is also
important to realize that setting up enhanced mass resolution methods requires
more attention to detail than setting up unit mass resolution methods. For
instance, the mass setting for the precursor ion selection is more critical when
setting up an enhanced mass resolution assay because the analyte mass peak
is narrower. Therefore, it is important to use the appropriate mass setting for
the Q1 precursor ion (set to the nearest 0.1 Da, not the nominal mass) in order
to avoid missing the top of the mass peak which would lead to selecting ions
from either the ascending or descending side of the normal distribution of
the mass peak for the precursor ion. Furthermore, according to the report
by Jemal and Ouyang [21], the precursor ion (Q1) mass values appear to
change slightly as the mass resolution (FWHM setting) is changed. Typically, a
change of 0.1 Da was observed when the Q1 mass setting changed from 0.7 Da
Figure 7.17 Mass chromatograms of compound W (0.25 ng/g) and internal standard spiked intothe brain matrix, obtained using the Quantum LC–MS/MS system with positive ESI mode underenhanced mass resolution (Q1 0.2 Da FWHM). (Source: Xu, X. et al. Rapid Commun. MassSpectrom., 17, 832, 2003. With permission.)
224 Using Mass Spectrometry for Drug Metabolism Studies
Copyright © 2005 CRC Press, LLC

7/21/2019 Using Mass Spectrometry for Drug Metabolism Studies
http://slidepdf.com/reader/full/using-mass-spectrometry-for-drug-metabolism-studies 232/362
FWHM to 0.2 Da FWHM. Therefore, for a routine use of an enhanced mass
resolution, SRM-based quantitative bioanalytical method, a precursor ion
scanning result obtained immediately before the start of the analysis is
recommended in order to update the exact precursor ion mass in the SRMtable of the bioanalytical method. It is normally not as important to recheck
the product ion (Q3) mass setting since the mass resolution (FWHM) for the
product ions in the SRM method is typically set at 0.7 Da.
Stabilizing the laboratory temperature has also been reported to be very
important in terms of operating the MS system under the enhanced mass
resolution settings [21]. Jemal and Ouyang [21] reported that the changes in the
SRM response correlated very well with the room temperature changes (3–4C)
when an enhanced mass resolution method was used. Jemal concluded that in
order to use the enhanced mass resolution properly, the Q1 mass setting in theSRM method should be carefully chosen only when a stable room temperature
is available for the MS system. It is likely that the vendor will continue to
improve the Quantum MS system so that this problem is diminished; in our
laboratory, we have been able to use the enhanced mass resolution feature
successfully for overnight assays with no clear evidence that the mass was
shifting. We also tested the reproducibility of the Quantum MS system in the
enhanced MS SRM mode by 300 repeated injections of the same sample over
20 h; as we reported recently [22], there was no evidence of a mass drift and the
reproducibility was very good (standard deviation was 0.5%).Another interesting observation from Jemal and Ouyang [21] showed that
in the Quantum MS system, the SRM response (centroid) changes with
different scan width parameters selected for the product ion. The response
increased with an increase in scan width until the scan width was equal to
about twice the FWHM value used for Q3, after which there was no
significant change [21]. According to the instrument manufacturer, this result
is due to the centroid algorithm used. During the conversion from profile
to centroid mode, the centroid algorithm reports the integrated peak area of
the profile peak as the intensity of the mass. Therefore, the smaller inten-
sity values from narrower scan ranges are as good as the larger values from
larger scan ranges in the same scan time. It is more selective to only scan the
top of the profile peak with a small scan width. However, in order to avoid
the possibility of falling off the top of the mass peak due to a mass axis
shift, particular care is required when selecting the exact mass and using
a narrow scan range in combination with the enhanced mass resolution.
Therefore, extra care needs to be taken when setting up an enhanced mass
resolution SRM assay, but if done properly, the results will be worth the
extra effort!
7.5 Conclusions
It is important to increase the specificity of bioanalytical methods; this can
be done by enhancing either the chromatographic resolution or the mass
Utilizing Higher Mass Resolution in Quantitative Assays 225
Copyright © 2005 CRC Press, LLC

7/21/2019 Using Mass Spectrometry for Drug Metabolism Studies
http://slidepdf.com/reader/full/using-mass-spectrometry-for-drug-metabolism-studies 233/362
resolving power. However, with the new technology, mass resolving power is
easy and fast to implement. The higher mass resolution is also important
simply because it minimizes the possibility of overlap of an analyte and
other mass peaks.The enhanced sensitivity of the Q-TOF MS system allows the acquisition of
informative full-scan MS or MS/MS spectra from trace components at levels
that would be impossible using a conventional triple quadrupole MS. The
improved Q-TOF mass resolution also results in outstanding selectivity, which
can be utilized for both qualitative and quantitative applications. A Q-TOF
instrument (e.g., Micromass Q-TOF with Z-spray) can be a good alternative
to a triple quadrupole mass spectrometer for quantitative purposes for assays
with a relatively small linear dynamic range (3–4 orders of magnitude for the
Q-TOF MS, as compared to 4–5 for the triple quadrupole MS).The ability of the enhanced mass resolution capability of the TSQ Quantum
MS to improve analyte sensitivity through increased mass specificity is
demonstrated in this chapter. The mass resolution necessary to separate an
analyte from co-eluting compounds in the biological matrix depends on the
difference in elemental composition between them. The greater the difference,
the more likely that operating one or both mass-analyzing quadrupoles
at higher mass resolution will yield improved assay specificity. The best
improvement would be expected when mass-deficient atoms such as halogens
are incorporated in the analyte, creating a large mass difference from othercompounds in the sample matrix. These new quadrupole mass analyzers
maintain very high transmission even as mass resolution is increased.
Chromatographic peak areas typically decrease by only a factor of 2–3 when
mass resolution is increased from 0.7 to 0.1 Da FWHM. However, the
elimination of interferences (noise) can improve the S/N ratio, which provides
better assay precision and a lower LOQ. In some cases, the LOQ for a drug
discovery compound can be lowered by as much as an order of magnitude
when using enhanced mass resolution on the Q1 quadrupole mass analyzer.
The attainment of enhanced mass resolution on the TSQ Quantum MS is
very straight-forward; therefore, this feature provides a practical means for
improving the analyte sensitivity in complex biological matrices.
References
1. Jemal, M., High-throughput quantitative bioanalysis by LC/MS/MS, Biomed.
Chromatogr., 14, 422, 2000.2. Ramanathan, R. et al. Liquid chromatography/mass spectrometry methods
for distinguishing N -oxides from hydroxylated compounds, Anal. Chem., 72, 1352,
2000.
3. Jemal, M. and Xia Y.Q., The need for adequate chromatographic separation in the
quantitative determination of drugs in biological samples by high performance liquid
chromatography with tandem mass spectrometry, Rapid Commun. Mass Spectrom.,
13, 97, 1999.
226 Using Mass Spectrometry for Drug Metabolism Studies
Copyright © 2005 CRC Press, LLC

7/21/2019 Using Mass Spectrometry for Drug Metabolism Studies
http://slidepdf.com/reader/full/using-mass-spectrometry-for-drug-metabolism-studies 234/362
4. Weng, N. et al. Development and validation of a sensitive method for
hydromorphone in human plasma by normal phase liquid chromatography–
tandem mass spectrometry, J. Pharm. Biomed. Anal., 23, 697, 2000.
5. Jemal, M. and Ouyang, Z., The need for chromatographic and mass resolution in
liquid chromatography/tandem mass spectrometric methods used for quantitation
of lactones and corresponding hydroxy acids in biological samples, Rapid Commun.
Mass Spectrom., 14, 1757, 2000.
6. Romanyshyn, L., Tiller, P.R., and Hop, C.E.C.A., Bioanalytical applications of
‘fast chromatography’ to high-throughput liquid chromatography/tandem mass
spectrometric quantitation, Rapid Commun. Mass Spectrom., 14, 1662, 2000.
7. Fountain, S.T., A mass spectrometry primer, in Mass Spectrometry in Drug
Discovery, Rossi, D.T. and Sinz, M. W., Eds., Marcel Dekker, New York, 2002,
chap. 3.
8. Niessen, W.M.A., Ed., Liquid-Chromatography–Mass Spectrometry, MarcelDekker, New York, 1999, chap. 3.
9. Smith, R.M. and Busch, K.L., Understanding mass spectra — a basic approach,
Smith, R.M. and Busch, K.L., Eds., John Wiley & Sons, New York, 1999, chaps 1
and 2.
10. Gibson, J.R. and Taylor, S., Prediction of quadrupole mass filter performance for
hyperbolic and circular cross section electrodes, Rapid Commun. Mass Spectrom.,
14, 1669, 2000.
11. Schoen, A.E. et al. Design and applications of a new high resolution triple
quadrupole mass spectrometer, in Proceedings 49th ASMS Conference on Mass
Spectrometry and Allied Topics, Chicago, IL, 2001.12. Morris, H.R. et al. A novel geometry mass spectrometer, the quadrupole
orthogonal acceleration time-of-flight instrument, for low femtomole/attomole
range biopolymer sequencing, in Mass Spectrometry of Biological Materials,
Larsen, B.S. and McEwen, C.N., Eds., Marcel Dekker, New York, 1998, chap. 3.
13. Schultz, S. et al. Comparison of a triple quadrupole using SRM to a TOFMS
for quantitative LC–MS support of drug discovery program, in Proceedings
46th ASMS Conference on Mass Spectrometry and Allied Topics, Orlando, FL,
1998.
14. Chernushevich, I.V., Loboda, A.V., and Thomson, B.A., An introduction toquadrupole-time-of-flight mass spectrmetry, J. Mass Spectrom., 36, 849, 2001.
15. Lindemann, T. and Hintelmann, H., Selenium speciation by HPLC with tandem
mass spectrometric detection, Anal. Bioanal. Chem., 372, 486, 2002.
16. Yang, L. et al. Investigation of an enhanced resolution triple quadrupole mass
spectrometer for high-throughput liquid chromatography/tandem mass spectrom-
etry assays, Rapid Commun. Mass Spectrom., 26, 2060, 2002.
17. Paul, G. et al. Improving LC/ESI/SRM quantitation through high resolution on a
triple quadrupole mass spectrometer, in Proceedings 50th ASMS Conference on
Mass Spectrometry and Allied Topics, Orlando, FL, 2002.
18. Schweingruber, H. et al. Advantages and limitations of increased mass resolutionfor quantitative SRM analysis on a triple stage quadrupole mass spectrometer, in
Proceedings 49th ASMS Conference on Mass Spectrometry and Allied Topics,
Chicago, IL, 2001.
19. Amad, M. et al. Determination of alprazolam in the presence of polypropylene
glycol utilizing the high resolution capability of a triple quadrupole mass
spectrometer, in Proceedings 49th ASMS Conference on Mass Spectrometry and
Allied Topics, Chicago, IL, 2001.
Utilizing Higher Mass Resolution in Quantitative Assays 227
Copyright © 2005 CRC Press, LLC

7/21/2019 Using Mass Spectrometry for Drug Metabolism Studies
http://slidepdf.com/reader/full/using-mass-spectrometry-for-drug-metabolism-studies 235/362
20. Hughes, N. et al. High sensitivity electrospray and APCI application of the high
resolution TSQ quantum in the quantitiation of cabergoline and pergolide in
plasma, in Proceedings 50th ASMS Conference on Mass Spectrometry and Allied
Topics, Orlando, FL, 2002.
21. Jemal, M. and Ouyang, Z., Enahnced resolution triple-quadrupole mass spectrom-
etry for fast quantitative bioanalysis using liquid chromatography/tandem mass
spectrometry: investigations of parameters that affect ruggedness, Rapid Commun.
Mass Spectrom., 17, 24, 2003.
22. Xu, X., Veals, J., and Korfmacher, W.A., Comparison of conventional and
enhanced mass resolution triple-quadrupole mass spectrometers for discovery
bioanalytical applications, Rapid Commun. Mass Spectrom., 17, 832, 2003.
23. Morris, H.R., et al. High sensitivity collisionally-activated decomposition tandem
mass spectrometry on a novel quadrupole/orthogonal-acceleration time-of-flight
mass spectrometer, Rapid Commun. Mass Spectrom., 10, 889, 1996.24. Marvin, L.F. et al. Quantification of o,o0-dityrosine, o-nitrotyrosine, and o-tyrosine
in cat urine samples by LC/electrospray ionization–MS/MS using isotope dilution,
Anal. Chem., 75, 261, 2003.
25. Zhang, N. et al. Quantification and rapid metabolite identification in drug
discovery using API time-of-flight LC/MS, Anal. Chem., 72, 800, 2000.
26. Yang, L., Wu, N., and Rudewicz, P.J., Applications of new liquid chroma-
tography–tandem mass spectrometry technologies for drug development support,
J. Chromatogr. A., 926, 43, 2001.
27. Zhang, H., Heinig, K., and Henion, J., Atmospheric pressure ionization time-of-
flight mass spectrometry coupled with fast liquid chromatography for quantitationand accurate mass measurement of five pharmaceutical drugs in human plasma,
J. Mass Spectrom., 35, 423, 2000.
28. Zhang, H. and Henion, J., Comparison between liquid chromatography–time-of–
flight mass spectrometry and selected reaction monitoring liquid chromatography-
mass spectrometry for quantitative determination of idoxifene in human plasma,
J. Chromatogr. B., 757, 151, 2001.
29. Scott, G.J. and Zhao, J.Y., A comparison of quantitation results obtained from
a quadrupole time of flight and a triple quadrupole mass spectrometers of APCI,
in Proceedings 47th ASMS Conference on Mass Spectrometry and Allied Topics,Dallas, TX, 1999.
30. Clauwaert, K.M. et al. Investigation of the quantitative properties of the
quadrupole orthogonal acceleration time-of-flight mass spectrometer with electro-
spray ionisation using 3,4-methylenedioxymethamphetamine, Rapid Commun. Mass
Spectrom., 13, 1540, 1999.
31. Burlingame, A.L., Boyd, R.K., and Gaskell, S.J., Mass spectrometry, Anal. Chem.,
70, 647R, 1998.
32. Marchese, S. et al. Quadrupole time-of-flight versus triple-quadrupole mass
spectrometry for the determination of non-steroidal antiinflammatory drugs in
surface water by liquid chromatography/tandem mass spectrometry, Rapid Commun. Mass Spectrom., 17, 879, 2003.
33. Xu, X. et al. Quantitation of discovery compounds In mouse plasma and brain
samples at 0.1 ng/mL and 0.254 ng/g levels using the quantum LC–MS/MS system,
in Proceedings 50th ASMS Conference on Mass Spectrometry and Allied Topics,
Orlando, FL, 2002.
228 Using Mass Spectrometry for Drug Metabolism Studies
Copyright © 2005 CRC Press, LLC
7/21/2019 Using Mass Spectrometry for Drug Metabolism Studies
http://slidepdf.com/reader/full/using-mass-spectrometry-for-drug-metabolism-studies 236/362
Chapter 8
Special Requirements forMetabolite Characterization
Kathleen Cox
8.1 Introduction
The cost to bring a new chemical entity (NCE) to market has escalated in the
past two decades to greater than 800 million dollars.1 A breakdown of these
costs indicates that the growth rate for discovery and preclinical development
costs has decreased substantially while clinical costs have grown at a muchmore rapid rate due, in part, to the ever increasing complexity of clinical
studies. Failure of drugs to reach marketing approval also has to be factored
into this process. It is estimated that only one in 10–20,000 NCEs evaluated in
discovery programs will be approved for market. As the cost and time involved
in developing a successful drug continues to rise, the failure of a potential drug
candidate late in the development process results in a tremendous loss of
resources.2 While lack of sufficient efficacy is still the predominant cause for
early termination of NCE’s, this is followed closely by safety issues and poor
pharmacokinetic properties.3,4 Faced with these hurdles, the philosophy of the
pharmaceutical industry is changing to put more emphasis on the evaluation
of compounds within drug discovery and preclinical development. Drug
candidates spend comparatively little time in the discovery phase relative to the
period of time required for development and clinical studies. Therefore, the
0-8493-1963-3/05/$0.00+$1.50 2005 by CRC Press 229
Copyright © 2005 CRC Press, LLC

7/21/2019 Using Mass Spectrometry for Drug Metabolism Studies
http://slidepdf.com/reader/full/using-mass-spectrometry-for-drug-metabolism-studies 237/362
challenge posed to discovery scientists is to find out as much as possible about
NCEs within the discovery time frame in an effort to minimize costly attrition
later in the development process.5 High-throughput analyses have been
incorporated throughout the discovery process in an effort to address theseneeds. High-throughput screening programs have been implemented success-
fully for the generation of large libraries of potential drug candidates.6 In
addition, high-throughput techniques have been successfully implemented to
screen large libraries of compounds to look for activity against a particular
therapeutic receptor.7
In an effort to adequately screen the large numbers of compounds gener-
ated in these high-throughput assays for drug metabolism and pharmaco-
kinetic (DMPK) properties, some of the assays, traditionally reserved for
NCEs in development, are now being utilized earlier in the discovery phase.8–12
The challenge in discovery today is to evaluate NCEs as completely as possible
while obtaining the information in a rapid and efficient manner. In vitro assays
have been developed to predict in vivo parameters such as absorption,13 enzyme
inhibition,14 and induction15 in a rapid and resource-efficient manner. These
assays are easily amenable to automation and analysis can be conducted in
multi-well plate formats. High-throughput in vivo pharmacokinetic techniques
have also been developed to obtain critical pharmacokinetic parameters
using cassette dosing16 or sample pooling prior to analysis17,18 coupled with
multiple analyte detection. However, the complexity of metabolite character-ization studies has prevented their integration into a routine, high-throughput
format.
The application of metabolite identification studies to drug discovery
programs is an active and growing field. The goal of this chapter is to discuss
the challenges involved in incorporating traditionally time-consuming and
complex assays into the fast-paced, high-throughput environment of drug
discovery. The success of metabolite identification in this setting depends upon
not only the implementation of cutting edge technology, but also in devising
strategies based on critical thinking—to answer the questions that are crucial
to a particular program as it progresses compounds from general screening to
the final selection of a discovery recommendation.
8.2 Review of Recent Literature
It is particularly useful to know the metabolic fate of a promising lead
compound early in the discovery phase.19–22 Not only does this lead to the
identification of potentially toxic or active metabolites,23–25 but early
metabolism studies can also identify metabolically labile portions of a molecule
in a particular drug series. Structural analogs of early drug lead candidates can
then be designed to block the portions of the molecules that are particularly
susceptible to metabolism.26
Drug metabolism involves chemical conversion, usually by an enzyme, to
reduce pharmacological activity of an NCE and to facilitate its elimination
230 Using Mass Spectrometry for Drug Metabolism Studies
Copyright © 2005 CRC Press, LLC
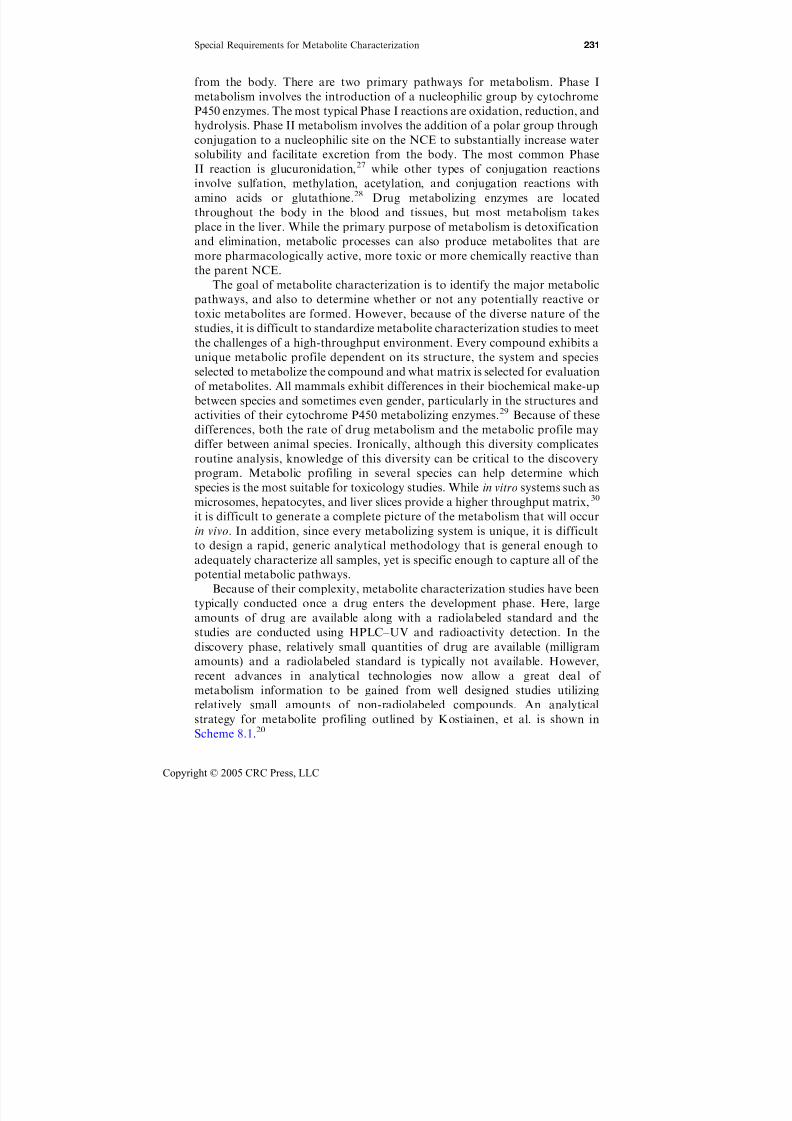
7/21/2019 Using Mass Spectrometry for Drug Metabolism Studies
http://slidepdf.com/reader/full/using-mass-spectrometry-for-drug-metabolism-studies 238/362
from the body. There are two primary pathways for metabolism. Phase I
metabolism involves the introduction of a nucleophilic group by cytochrome
P450 enzymes. The most typical Phase I reactions are oxidation, reduction, and
hydrolysis. Phase II metabolism involves the addition of a polar group throughconjugation to a nucleophilic site on the NCE to substantially increase water
solubility and facilitate excretion from the body. The most common Phase
II reaction is glucuronidation,27 while other types of conjugation reactions
involve sulfation, methylation, acetylation, and conjugation reactions with
amino acids or glutathione.28 Drug metabolizing enzymes are located
throughout the body in the blood and tissues, but most metabolism takes
place in the liver. While the primary purpose of metabolism is detoxification
and elimination, metabolic processes can also produce metabolites that are
more pharmacologically active, more toxic or more chemically reactive thanthe parent NCE.
The goal of metabolite characterization is to identify the major metabolic
pathways, and also to determine whether or not any potentially reactive or
toxic metabolites are formed. However, because of the diverse nature of the
studies, it is difficult to standardize metabolite characterization studies to meet
the challenges of a high-throughput environment. Every compound exhibits a
unique metabolic profile dependent on its structure, the system and species
selected to metabolize the compound and what matrix is selected for evaluation
of metabolites. All mammals exhibit differences in their biochemical make-upbetween species and sometimes even gender, particularly in the structures and
activities of their cytochrome P450 metabolizing enzymes.29 Because of these
differences, both the rate of drug metabolism and the metabolic profile may
differ between animal species. Ironically, although this diversity complicates
routine analysis, knowledge of this diversity can be critical to the discovery
program. Metabolic profiling in several species can help determine which
species is the most suitable for toxicology studies. While in vitro systems such as
microsomes, hepatocytes, and liver slices provide a higher throughput matrix,30
it is difficult to generate a complete picture of the metabolism that will occur
in vivo. In addition, since every metabolizing system is unique, it is difficult
to design a rapid, generic analytical methodology that is general enough to
adequately characterize all samples, yet is specific enough to capture all of the
potential metabolic pathways.
Because of their complexity, metabolite characterization studies have been
typically conducted once a drug enters the development phase. Here, large
amounts of drug are available along with a radiolabeled standard and the
studies are conducted using HPLC–UV and radioactivity detection. In the
discovery phase, relatively small quantities of drug are available (milligram
amounts) and a radiolabeled standard is typically not available. However,
recent advances in analytical technologies now allow a great deal of
metabolism information to be gained from well designed studies utilizing
relatively small amounts of non-radiolabeled compounds. An analytical
strategy for metabolite profiling outlined by Kostiainen, et al. is shown in
Scheme 8.1.20
Special Requirements for Metabolite Characterization 231
Copyright © 2005 CRC Press, LLC
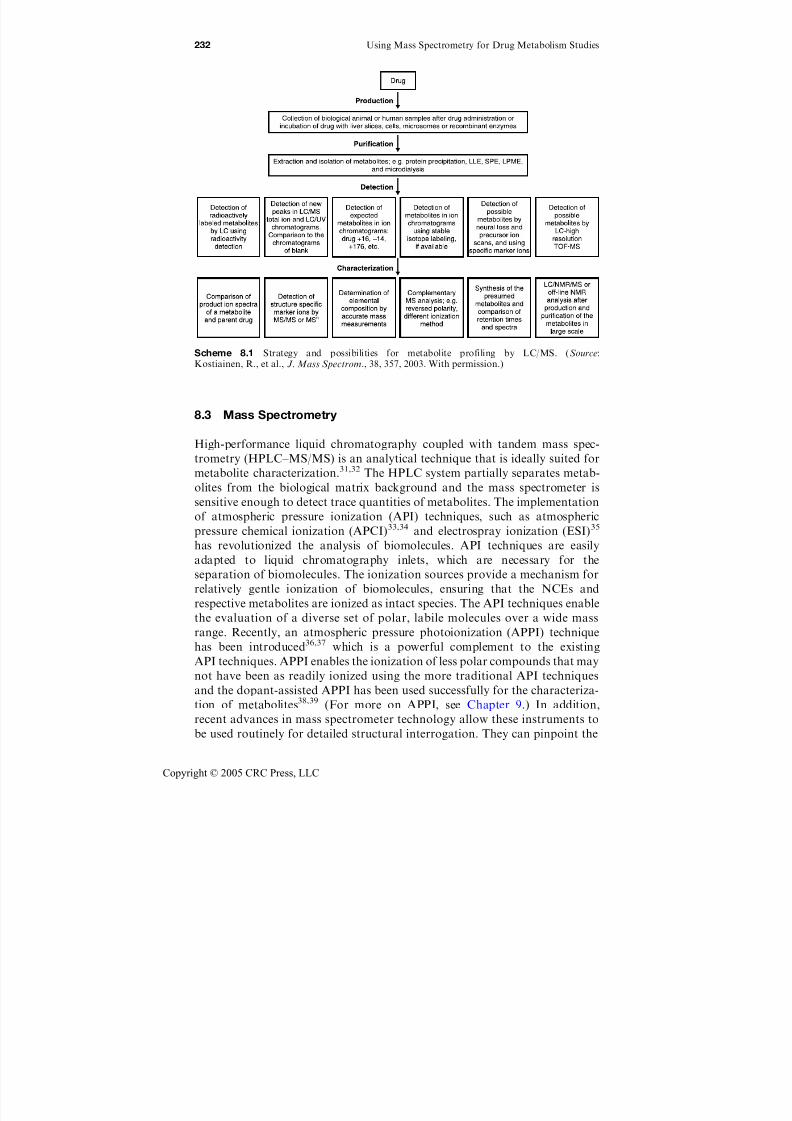
7/21/2019 Using Mass Spectrometry for Drug Metabolism Studies
http://slidepdf.com/reader/full/using-mass-spectrometry-for-drug-metabolism-studies 239/362
8.3 Mass Spectrometry
High-performance liquid chromatography coupled with tandem mass spec-
trometry (HPLC–MS/MS) is an analytical technique that is ideally suited for
metabolite characterization.31,32 The HPLC system partially separates metab-
olites from the biological matrix background and the mass spectrometer is
sensitive enough to detect trace quantities of metabolites. The implementation
of atmospheric pressure ionization (API) techniques, such as atmospheric
pressure chemical ionization (APCI)33,34 and electrospray ionization (ESI)35
has revolutionized the analysis of biomolecules. API techniques are easily
adapted to liquid chromatography inlets, which are necessary for the
separation of biomolecules. The ionization sources provide a mechanism for
relatively gentle ionization of biomolecules, ensuring that the NCEs and
respective metabolites are ionized as intact species. The API techniques enable
the evaluation of a diverse set of polar, labile molecules over a wide mass
range. Recently, an atmospheric pressure photoionization (APPI) technique
has been introduced36,37 which is a powerful complement to the existing
API techniques. APPI enables the ionization of less polar compounds that may
not have been as readily ionized using the more traditional API techniques
and the dopant-assisted APPI has been used successfully for the characteriza-
tion of metabolites38,39 (For more on APPI, see Chapter 9.) In addition,
recent advances in mass spectrometer technology allow these instruments to
be used routinely for detailed structural interrogation. They can pinpoint the
Scheme 8.1 Strategy and possibilities for metabolite profiling by LC/MS. (Source:Kostiainen, R., et al., J. Mass Spectrom., 38, 357, 2003. With permission.)
232 Using Mass Spectrometry for Drug Metabolism Studies
Copyright © 2005 CRC Press, LLC
7/21/2019 Using Mass Spectrometry for Drug Metabolism Studies
http://slidepdf.com/reader/full/using-mass-spectrometry-for-drug-metabolism-studies 240/362
site of structural modification of the metabolite to a small portion of the
molecule, while providing exact mass measurement, distinguishing nominally
isobaric molecules.5 The use of complementary LC–MS/MS instrumentation
provides the best way of completely investigating the metabolic profile of an NCE.
The tandem MS capabilities of a triple quadrupole mass spectrometer are
useful in providing a first look at the metabolic profile of an NCE and offer
the best chance of identifying novel or unexpected metabolites. The triple
quadrupole mass spectrometer has the unique ability of performing precursor
ion and neutral loss scans in the LC time frames required by metabolite
characterization experiments.40 In these tandem MS experiments, the instru-
ment scans to search for any ions that contain a characteristic fragment of the
NCE or potential metabolite. These experiments require no prior knowledge of the metabolites and may only require a minor structural similarity to the NCE.
In this manner, masses of both expected and unexpected metabolites as well
as conjugated metabolites can be pulled out of the mass chromatogram and
highlighted for further analysis.41,42
A list of potential metabolites is generated from the precursor ion and
neutral loss experiments on the triple quadrupole mass spectrometer, and
product ion experiments are utilized for further characterization. In these
experiments, the putative metabolites are isolated and subjected to collision-
induced dissociation, providing a fragmentation pattern. In breaking the largermolecule apart into smaller pieces, it is possible to determine what portion of
the molecule contains the metabolic alteration. A fragment ion that has shifted
in mass from what was seen with the parent NCE indicates that the metabolic
modification exists on that portion of the molecule. Product ion experiments
can be performed on any tandem mass spectrometer. Often, a single MS/MS
experiment is insufficient to narrow down the site of modification. An ion trap
mass spectrometer (ITMS) is unique in that it can perform multiple MS/MS
experiments. A specific fragment ion produced in a single MS/MS experiment
can be isolated and dissociated further. This sequential dissociation experiment
(MSn),43,44 narrows the potential sites of modification and provides a more
complete assessment of the metabolite structure.
Recent advances in quadrupole time-of-flight (Q-TOF) technology45 have
provided rugged high performance accurate mass and high resolution
capabilities that that are useful in the evaluation of metabolites present in
complex matrices. Enhanced mass resolution enables the separation of
metabolites from nominally isobaric background ions, facilitating detection.
The accurate mass measurements of these metabolites can also provide a
limited list of potential empirical formulae for the metabolites of interest,
making identification easier. When the accurate mass capabilities are utilized
on fragment ions generated in an MS/MS experiment, the potential empirical
formulae are even more limited.46,47 It is important to note that an accurate
mass measurement of a particular ion will not provide unequivocal
identification of its structure and cannot distinguish isomers that have
the same exact mass. The true utility of the accurate mass experiments lie in
Special Requirements for Metabolite Characterization 233
Copyright © 2005 CRC Press, LLC

7/21/2019 Using Mass Spectrometry for Drug Metabolism Studies
http://slidepdf.com/reader/full/using-mass-spectrometry-for-drug-metabolism-studies 241/362
the ability to distinguish between two proposed nominally isobaric structures.
The time-of-flight separation of ions combined with the photodiode array
detection capabilities of this instrument result in high spectral acquisition
speeds and, as a result, can provide highly sensitive detection of low levelmetabolites. This is particularly useful in the critical identification of metab-
olites circulating in plasma. Other instruments, such as four sector mass
spectrometers or Fourier transform mass spectrometers48 are capable of
achieving even higher resolution and mass accuracies and have been used in the
characterization of metabolites.49 However, the types of molecules encountered
in metabolite ID experiments for small molecule NCEs are typically comprised
of only organic atoms and are fairly low molecular weight (<1000 Da). In many
cases, the structure of a large portion of the molecule is already known, based
on the structure of the parent NCE. Ultra-high-resolution and mass accuracy isnot necessary for their characterization. Recent reports have demonstrated that
the number of empirical formulae possible for a metabolite can be reduced
even further in accurate mass MS/MS experiments when knowledge of the
exact mass of the parent NCE is applied.50
Each of the instruments described above provides unique capabilities that
are highly useful in evaluating the structures of metabolites. The most effective
and comprehensive metabolite characterization experiments utilize a combi-
nation of these instruments where their unique capabilities can be combined
in a complementary fashion.51 Strategies have been described which utilizeseparate LC–MS/MS systems in which the inlets are setup in an identical
fashion. The LC, column and gradient conditions are the same. Each system is
fitted with a radioflow detector in parallel with the mass spectrometer for
simultaneous detection of radioactive responses when necessary. Samples can
be analyzed on some or all systems depending on the type of experiments that
are required.
8.3.1 Sample preparation
Sample preparation and clean-up are also not routine procedures when dealing
with samples for metabolite characterization in drug discovery. Often, these
samples represent the first evaluation of metabolites for a particular NCE.
Since the metabolic pathways are not known and the samples do not contain
radiolabeled compound, any clean-up or manipulation of the sample could
result in loss of metabolites. However, the matrices that provide the most
utility for metabolite characterization are typically extremely dirty, as in
the case of bile. The most simple form of sample clean-up involves protein
precipitation followed by centrifugation. Liquid–liquid extraction or solid-
phase extraction procedures can be utilized in cases where some a priori
knowledge of the metabolites is available.52 Solid-phase extraction is frequently
utilized,53 as the techniques are well established, easily amenable to automation
and a wide variety of sorbant materials are available. A further integration of
sample cleanup to LC–MS analysis involves the use of in-tube solid-phase
234 Using Mass Spectrometry for Drug Metabolism Studies
Copyright © 2005 CRC Press, LLC
7/21/2019 Using Mass Spectrometry for Drug Metabolism Studies
http://slidepdf.com/reader/full/using-mass-spectrometry-for-drug-metabolism-studies 242/362
microextraction (SPME), in which sample extraction, concentration, and
introduction into an LC can be integrated into a single step.54
8.3.2 Liquid chromatography
The choice of chromatography conditions for metabolite ID studies can be
critical. It is important to separate the metabolites from matrix ions that can
influence the ionization and characterization of the compounds of interest.
Many high-throughput methodologies which utilize liquid chromatography
have adopted small columns and ballistic gradients in order to separate buffer
salts or other contaminants from the compounds of interest. Again, with no
knowledge of the physico-chemical properties of metabolites, this can be a
risky methodology to employ when performing metabolite characterizationexperiments. In addition, bile salts can have similar chemical properties to
conjugated metabolites of small molecules, making them difficult to eliminate.
Traditional metabolite characterization experiments involve slow reverse phase
gradients and relatively long columns (150–250 mm) to ensure adequate
separation of metabolites. However, the selectivity provided by mass spectro-
metric detection can allow the utilization of shorter columns and shorter run
times. Care must be taken to ensure that structurally distinct metabolites do
not give the same MS/MS fragmentation pattern, thus providing misleading
results. Many researchers, such as Hop et al. have utilized fast gradientswithout the loss of chromatographic resolution.55,56 Coupling this fast LC
time with the rapid scanning capabilities of a quadrupole time of flight mass
spectrometer can provide a tremendous amount of metabolism information on
several NCEs in a relatively short period of time. New column technologies
have been developed to answer the need for good chromatographic resolu-
tion in a short run time. Monolithic LC columns offer an advantage over
traditional particle columns by providing a unique method of resolving
components. Large macro pores (2–6 mm diameter) allow high flow rates due
to low resistance and are combined with mesopores (diameters around 120 A ˚ )
to provide a large surface area that facilitates rapid adsorption/desorption
and can lead to high resolution separations57,58 (Figure 8.1). Turbulent flow
chromatography59 has shown promise in allowing high flow rates, enabling
online sample clean-up. However, this technique has shown limited utility in
providing the resolution necessary to separate drugs from metabolites that are
closely related, structurally. An interesting application of this technique has
been described in which on-line extraction was accomplished by turbulent flow
chromatography followed by column switching to a traditional reverse phase
system for the separation of metabolites.60
While all these innovative column and LC strategies provide added benefits
to more rapid analysis of metabolites, their utility, by and large, is in the
analysis of known metabolites, not in the elucidation of a completely unknown
metabolic profile of an NCE. This type of experiment still requires a fairly long
gradient in order to ensure the elution and adequate separation of metabolites.
There have been several examples in which fast chromatography has been
Special Requirements for Metabolite Characterization 235
Copyright © 2005 CRC Press, LLC

7/21/2019 Using Mass Spectrometry for Drug Metabolism Studies
http://slidepdf.com/reader/full/using-mass-spectrometry-for-drug-metabolism-studies 243/362
utilized for metabolite characterization experiments. However, extremely fast
gradient experiments can often be limited by the scanning capabilities of
the mass spectrometer. Often, slower scanning instruments such as ion traps
must be replaced by the faster scanning time-of-flight instruments in order
to provide adequate sampling to keep up with the rapid chromatography.
8.3.3 Software
Various software programs have evolved in the past few years to aid in the
characterization of metabolites. Many programs exist which provide assistance
in nearly all stages of the characterization processes. In silico programs exist
which can propose metabolic pathways based on the structure of the NCE61
and databases are continually being updated to contain searchable metabolic
routes.62 Metabolite ID software programs have been developed by the three
major mass spectrometry vendors to aid in the analytical process. These
programs include the ability to evaluate data acquired by the mass spectrom-
eter and process massive data files to highlight only the information on
potential metabolites. Metabolite ID software can now be utilized to ‘mine’
MS data, numerically evaluating the MS spectra, subtracting a mass
chromatogram containing only matrix ions, looking for expected metabolites
or characteristic isotopic patterns, intelligently providing lists of potential
metabolites and setting up further experiments to confirm the identity of the
metabolites. Many of the software programs offer the ability to interrogate the
Figure 8.1 LC/MS chromatogram (m/z 192) of human liver microsome filtrate following analysison the silica ‘rod’ column, using SIM detection on the triple quadrupole mass spectrometer.(Source: Dear, G., et al., Rapid Commun. Mass Spectrom., 15, 152, 2001. With permission.)
236 Using Mass Spectrometry for Drug Metabolism Studies
Copyright © 2005 CRC Press, LLC
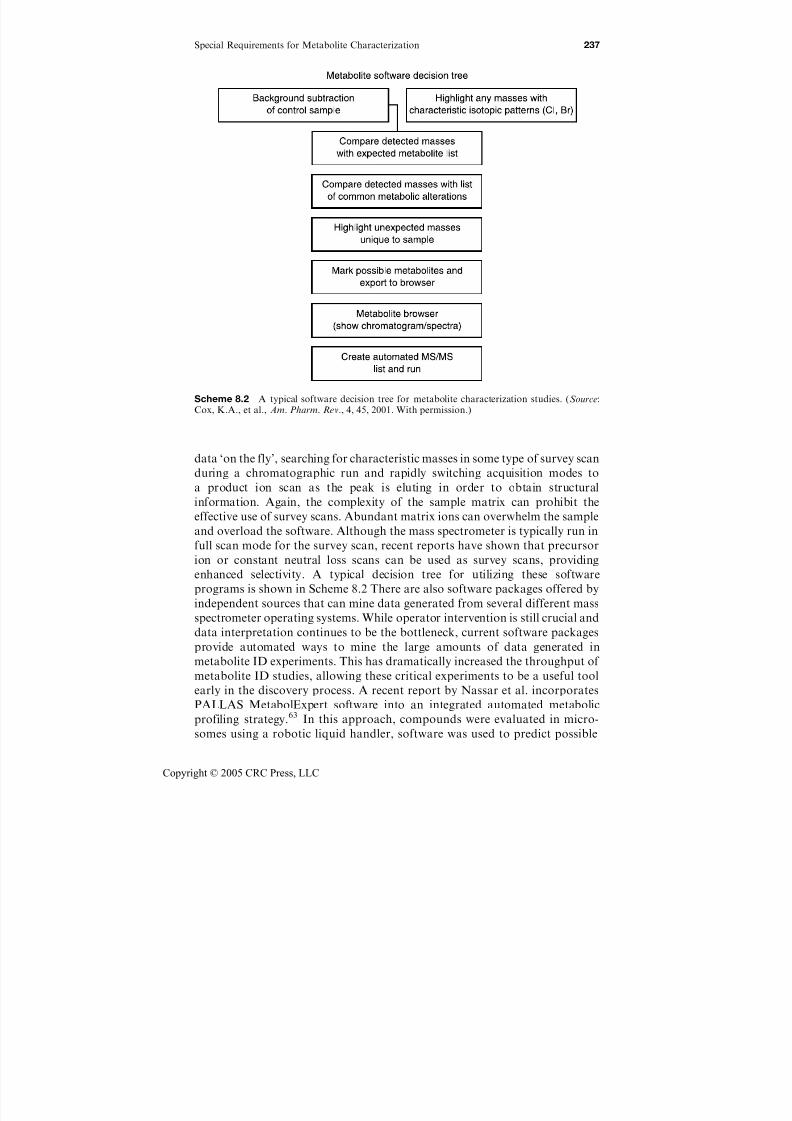
7/21/2019 Using Mass Spectrometry for Drug Metabolism Studies
http://slidepdf.com/reader/full/using-mass-spectrometry-for-drug-metabolism-studies 244/362
data ‘on the fly’, searching for characteristic masses in some type of survey scan
during a chromatographic run and rapidly switching acquisition modes to
a product ion scan as the peak is eluting in order to obtain structural
information. Again, the complexity of the sample matrix can prohibit the
effective use of survey scans. Abundant matrix ions can overwhelm the sample
and overload the software. Although the mass spectrometer is typically run in
full scan mode for the survey scan, recent reports have shown that precursor
ion or constant neutral loss scans can be used as survey scans, providing
enhanced selectivity. A typical decision tree for utilizing these software
programs is shown in Scheme 8.2 There are also software packages offered by
independent sources that can mine data generated from several different mass
spectrometer operating systems. While operator intervention is still crucial and
data interpretation continues to be the bottleneck, current software packages
provide automated ways to mine the large amounts of data generated in
metabolite ID experiments. This has dramatically increased the throughput of
metabolite ID studies, allowing these critical experiments to be a useful tool
early in the discovery process. A recent report by Nassar et al. incorporates
PALLAS MetabolExpert software into an integrated automated metabolic
profiling strategy.63 In this approach, compounds were evaluated in micro-
somes using a robotic liquid handler, software was used to predict possible
Scheme 8.2 A typical software decision tree for metabolite characterization studies. (Source:Cox, K.A., et al., Am. Pharm. Rev., 4, 45, 2001. With permission.)
Special Requirements for Metabolite Characterization 237
Copyright © 2005 CRC Press, LLC

7/21/2019 Using Mass Spectrometry for Drug Metabolism Studies
http://slidepdf.com/reader/full/using-mass-spectrometry-for-drug-metabolism-studies 245/362
metabolites, samples were analyzed using a quadrupole time of flight mass
spectrometer, and MetaboLynx software was used to find and confirm
potential metabolites. Advanced chemistry development/MS (ACD-MS)
software was used to guide derivation of metabolite structures based on theMS/MS fragmentation data.
The key to streamlining the complicated task of metabolic characterization
is to decide what questions need to be answered. For example, definitive
metabolite identification studies require absolute structural identification
of each metabolite produced. This is a labor-intensive process requiring
separation of all metabolites produced in a particular biological matrix
(i.e., bile, urine, plasma), analytical characterization of the structure of the
metabolite and confirmation with a synthetic standard. This methodology
involves the evaluation of one metabolite after another in a serial fashion andoften the definitive structural identification must be supplied by NMR. Often
the structure of a metabolite can be elucidated by mass spectrometry through
the use of exact mass measurements to obtain an empirical formula and/or
obtaining a detailed fragmentation pathway for the metabolite. However,
the most definitive technique for structural elucidation is NMR. This tech-
nique can not only determine the exact site of modification, but also the
stereochemistry of the metabolite structure. The drawback of using NMR is
that it typically requires a large amount of the metabolite in order to provide
definitive structural data (micrograms) while LC–MS/MS typically requiresnanograms or even picograms of material for structural characterization.
Recently, the direct coupling of LC with MS and NMR has been utilized in
the characterization of metabolites.64,65 However, its utility as a routine
methodology in the discovery setting remains to be determined. Excellent
discussions of recent advances in NMR technology and its application to
metabolite characterization studies are included in reviews by Watt et al.66 and
Pochapsky and Pochapsky.67
8.4 Current Uses and Technology
Metabolite characterization is needed early in discovery programs to provide
a quick look at the metabolic fate of NCEs. These NCEs are not likely to be
the final drug candidate, but rather are early structural analogs, designed to
understand the overall behavior of a particular structural series. Early feedback
about metabolically labile sites or potentially toxic metabolites is crucial to the
discovery team in order to direct future synthetic pathways. Many discovery
programs utilize in vitro systems to obtain a general picture of the metabolic
fate of NCEs at this stage. The evaluation of the metabolic stability of
compounds in microsomes68 and hepatocytes69 relies solely on the measure-
ment of the disappearance of parent compound with incubation time and is,
thus, amenable to routine, high-throughput analysis. There have been reports
describing methods to obtain metabolite identification information from these
quantitative metabolic stability samples.70,71 There are also examples in which
238 Using Mass Spectrometry for Drug Metabolism Studies
Copyright © 2005 CRC Press, LLC

7/21/2019 Using Mass Spectrometry for Drug Metabolism Studies
http://slidepdf.com/reader/full/using-mass-spectrometry-for-drug-metabolism-studies 246/362
in vitro protocols have been developed to answer specific questions, such as
whether or not glutathione metabolites are formed for an NCE.72
Through the use of characteristic MS/MS scanning techniques, combined
with the advantages offered by metabolite ID software programs, we have
developed a tiered system designed to answer the most critical questions first,
and provide information about the general metabolic profile for an NCE
rapidly (Scheme 8.3).The ‘first look’ at the metabolic profile, designated as Tier I, is not
comprehensive, but in most cases, provides valuable feedback to the discovery
team in a timely manner. Since the goal is to generate orally administered
drugs, the metabolites formed after oral dosing are the most relevant. One bile-
duct cannulated rat is dosed with an NCE and bile and urine are collected
for 24 h. The use of a single animal exerts minimal drain on the animal dosing
resources and provides a more comprehensive metabolic profile than is
typically obtained from an in vitro system. Historical evidence indicates that
the majority of the metabolites are excreted in the first 24 h. Once the samples
are generated, they are injected directly onto an HPLC–ESI triple quadrupole
system. The use of electrospray ionization minimizes the risk of in-source
fragmentation of labile conjugated metabolites. Since this is the first evaluation
of metabolites for the NCE, the routes of metabolism are not yet known, so no
sample clean-up is employed to avoid the risk of losing metabolites. Standard
LC conditions are utilized.
Analytically, glucuronide, glutathione, and sulfate conjugates can be
detected by characteristic constant neutral losses where the mass that is lost
is dependent on the conjugate, not the drug (Figure 8.2). Samples in Tier I are
subjected to constant neutral loss (CNL) scans that are characteristic for
the presence of glucuronide (176 Da), glutathione (129 Da) and sulfate (80 Da)
conjugated metabolites. Therefore, conjugated metabolites can be detected
without any prior knowledge of the parent drug or previous metabolic
pathways. In addition, since these scans are only specific for the conjugate, this
approach also can provide indirect evidence of Phase I (P450) metabolism.
Scheme 8.3 A tiered approach to metabolite characterization.
Special Requirements for Metabolite Characterization 239
Copyright © 2005 CRC Press, LLC

7/21/2019 Using Mass Spectrometry for Drug Metabolism Studies
http://slidepdf.com/reader/full/using-mass-spectrometry-for-drug-metabolism-studies 247/362
More than 95% of the drugs in the market are metabolized by P450s, uridine
diphosphate glucuronosyltranferases (UDPGTs) and sulfotransferases and
these metabolites are typically excreted in the bile, so evaluation of conjugated
metabolites in bile and urine often can provide a fairly comprehensive view of
the metabolic fate of an NCE.
Glucuronidation is quantitatively the most important conjugation reaction
of xenobiotics mediated by UDPGT.73 It is a low affinity, high capacity
reaction. Although glucuronidation is typically a detoxification pathway, if
the glucuronide is conjugated through an acyl moiety to the corresponding
carboxylic acid aglycone, the resulting acyl-glucuronide can undergo acyl
migration to form reactive intermediates, capable of covalently binding to
proteins. (See Chapter 6 for more on acyl-glucuronides.) This intermediate can
interfere with the normal protein function or introduce an immunogenic effect.
Again, the characteristic CNL scan for loss of 176 Da will detect and help
characterize these potentially toxic metabolites.
Glutathione conjugates can be detected by a CNL 129 scan. Glutathione is
present in the body and acts as a detoxification mechanism for the elimination
of electrophilic entities. Glutathione S -transferase (GST) protects cells from
oxidative stress and chemical-induced toxicity by catalyzing the glutathione
conjugation reaction with electrophilic, and potentially toxic, xenobiotics.74
Thus, detection of a glutathione metabolite, although not toxic itself,
is indicative of a potentially reactive precursor and can have serious
Figure 8.2 Characteristic constant neutral loss (CNL) scans for conjugated metabolites.(Adapted from Cox, K.A., et al., Adv. Mass Spectrum., 16, 204, 2004. With permission.)
240 Using Mass Spectrometry for Drug Metabolism Studies
Copyright © 2005 CRC Press, LLC
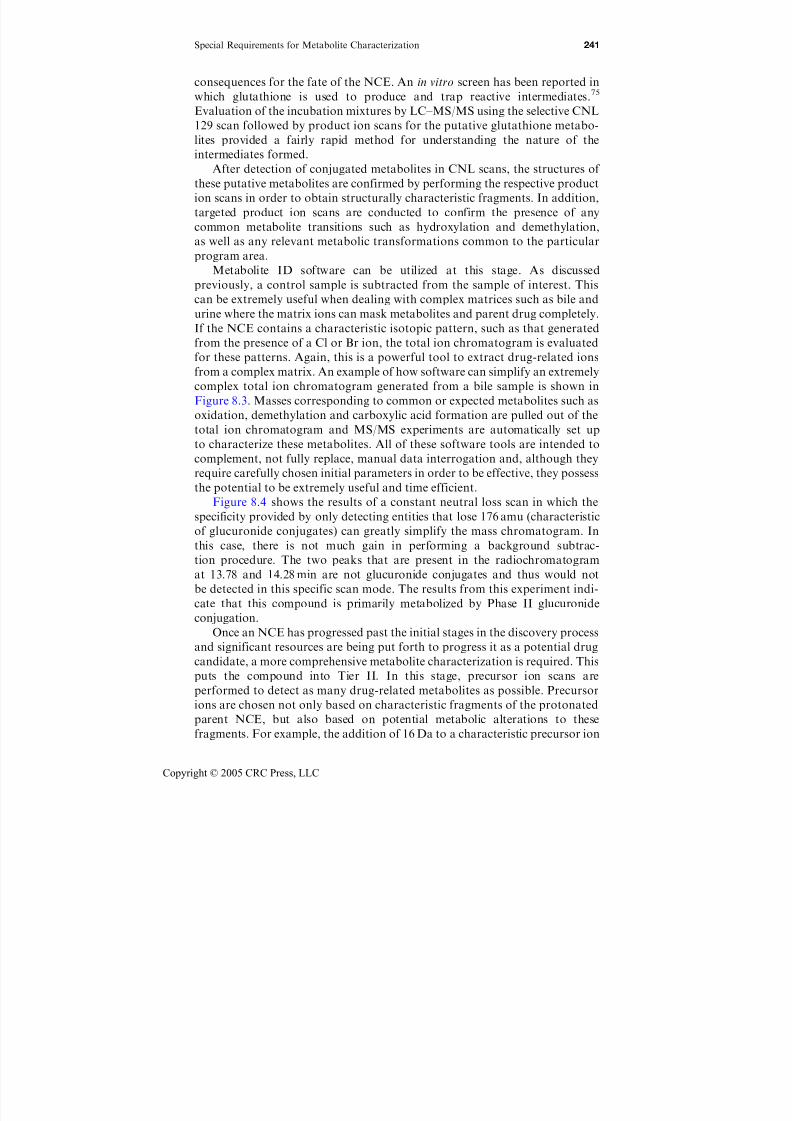
7/21/2019 Using Mass Spectrometry for Drug Metabolism Studies
http://slidepdf.com/reader/full/using-mass-spectrometry-for-drug-metabolism-studies 248/362
consequences for the fate of the NCE. An in vitro screen has been reported in
which glutathione is used to produce and trap reactive intermediates.75
Evaluation of the incubation mixtures by LC–MS/MS using the selective CNL
129 scan followed by product ion scans for the putative glutathione metabo-lites provided a fairly rapid method for understanding the nature of the
intermediates formed.
After detection of conjugated metabolites in CNL scans, the structures of
these putative metabolites are confirmed by performing the respective product
ion scans in order to obtain structurally characteristic fragments. In addition,
targeted product ion scans are conducted to confirm the presence of any
common metabolite transitions such as hydroxylation and demethylation,
as well as any relevant metabolic transformations common to the particular
program area.Metabolite ID software can be utilized at this stage. As discussed
previously, a control sample is subtracted from the sample of interest. This
can be extremely useful when dealing with complex matrices such as bile and
urine where the matrix ions can mask metabolites and parent drug completely.
If the NCE contains a characteristic isotopic pattern, such as that generated
from the presence of a Cl or Br ion, the total ion chromatogram is evaluated
for these patterns. Again, this is a powerful tool to extract drug-related ions
from a complex matrix. An example of how software can simplify an extremely
complex total ion chromatogram generated from a bile sample is shown inFigure 8.3. Masses corresponding to common or expected metabolites such as
oxidation, demethylation and carboxylic acid formation are pulled out of the
total ion chromatogram and MS/MS experiments are automatically set up
to characterize these metabolites. All of these software tools are intended to
complement, not fully replace, manual data interrogation and, although they
require carefully chosen initial parameters in order to be effective, they possess
the potential to be extremely useful and time efficient.
Figure 8.4 shows the results of a constant neutral loss scan in which the
specificity provided by only detecting entities that lose 176 amu (characteristic
of glucuronide conjugates) can greatly simplify the mass chromatogram. In
this case, there is not much gain in performing a background subtrac-
tion procedure. The two peaks that are present in the radiochromatogram
at 13.78 and 14.28 min are not glucuronide conjugates and thus would not
be detected in this specific scan mode. The results from this experiment indi-
cate that this compound is primarily metabolized by Phase II glucuronide
conjugation.
Once an NCE has progressed past the initial stages in the discovery process
and significant resources are being put forth to progress it as a potential drug
candidate, a more comprehensive metabolite characterization is required. This
puts the compound into Tier II. In this stage, precursor ion scans are
performed to detect as many drug-related metabolites as possible. Precursor
ions are chosen not only based on characteristic fragments of the protonated
parent NCE, but also based on potential metabolic alterations to these
fragments. For example, the addition of 16 Da to a characteristic precursor ion
Special Requirements for Metabolite Characterization 241
Copyright © 2005 CRC Press, LLC
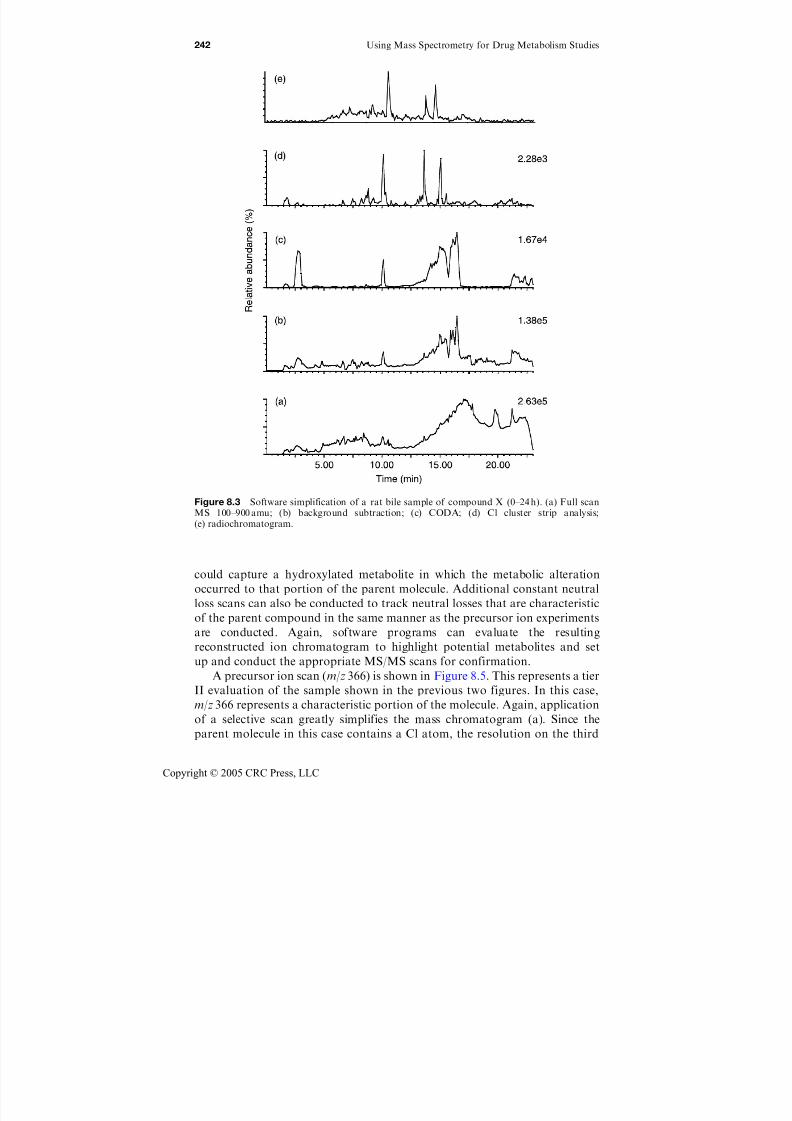
7/21/2019 Using Mass Spectrometry for Drug Metabolism Studies
http://slidepdf.com/reader/full/using-mass-spectrometry-for-drug-metabolism-studies 249/362
could capture a hydroxylated metabolite in which the metabolic alteration
occurred to that portion of the parent molecule. Additional constant neutral
loss scans can also be conducted to track neutral losses that are characteristic
of the parent compound in the same manner as the precursor ion experiments
are conducted. Again, software programs can evaluate the resulting
reconstructed ion chromatogram to highlight potential metabolites and set
up and conduct the appropriate MS/MS scans for confirmation.
A precursor ion scan (m/z 366) is shown in Figure 8.5. This represents a tier
II evaluation of the sample shown in the previous two figures. In this case,
m/z 366 represents a characteristic portion of the molecule. Again, application
of a selective scan greatly simplifies the mass chromatogram (a). Since the
parent molecule in this case contains a Cl atom, the resolution on the third
Figure 8.3 Software simplification of a rat bile sample of compound X (0–24 h). (a) Full scan
MS 100–900 amu; (b) background subtraction; (c) CODA; (d) Cl cluster strip analysis;(e) radiochromatogram.
242 Using Mass Spectrometry for Drug Metabolism Studies
Copyright © 2005 CRC Press, LLC

7/21/2019 Using Mass Spectrometry for Drug Metabolism Studies
http://slidepdf.com/reader/full/using-mass-spectrometry-for-drug-metabolism-studies 250/362
Figure 8.5 Data dependent precursor ion scan (pre 366) with open Q3 resolution. (a) masschromatogram; (b) precursor ion mass spectrum; (c) data dependent MS/MS spectrum of m/z 582.
Figure 8.4 Selective detection of glucuronide metabolites in rat bile. (a) radiochromatogram;(b) background subtraction; (c) constant neutral loss 176.
Special Requirements for Metabolite Characterization 243
Copyright © 2005 CRC Press, LLC

7/21/2019 Using Mass Spectrometry for Drug Metabolism Studies
http://slidepdf.com/reader/full/using-mass-spectrometry-for-drug-metabolism-studies 251/362
quadrupole was adjusted to allow both the 35Cl and the 37Cl isotopes to pass
through. This results in the appearance of the characteristic chlorine cluster
pattern to emerge for any precursor ions that are detected, providing an even
greater level of selectivity (b). In the case of an extremely dirty sample, it ispossible to detect spurious matrix ions that are not related to the NCE but also
have a characteristic fragment of m/z 366. However, none of the matrix ions
should contain a chlorine atom. As mentioned previously, most of the software
programs available for mass spectrometers have the ability to acquire product
ion spectra ‘on the fly’, changing modes from either full scan or from a selective
MS/MS scan such as precursor ion or constant neutral loss, when an ion of
interest is detected. In this case, the instrument switched to product ion mode
when it detected the peak at 14.49 min and acquired a characteristic product
ion spectrum that allowed structural characterization of this metabolitewithout requiring a second injection of the sample.
As more discovery resources are put toward progressing the NCE, it will be
dosed in at least one additional nonrodent species for drug metabolism and
pharmacokinetic evaluation. The metabolic profile of an NCE is evaluated
in additional species in Tier II. Typically, the NCE will be radiolabeled at this
stage (most commonly with 3H), allowing for a quantitative evaluation of
metabolites based on radioactivity detection. There is a desire to determine
relative amounts of metabolites in addition to their identities, so LC conditions
are optimized at this stage to separate co-eluting metabolites. The radiotracewill also reveal whether any metabolites containing the radiolabel have been
missed in any of the previous characterization experiments. These metabolites
typically involve cleavage or some other major alteration of the parent drug.
Software programs can again be utilized here to help identify these metabolites.
The metabolic profile of an NCE across species, including human, is
determined when the compound enters the Tier II phase, utilizing hepatocyte
incubations. The metabolic stability of an NCE is determined much earlier
when compounds are evaluated for intrinsic clearance in a screening mode.
This screen simply monitors the disappearance of parent compound with
incubation time and is amenable to a high throughput, automated format. As
mentioned previously, these samples are available for evaluation of metabo-
lites, but this type of high-throughput evaluation is only effective if specific
routes of metabolism are targeted. For example, if a program knows that a
particular structural series is susceptible to acyl-glucuronide formation, this
pathway can be monitored in a screening mode. However, a Tier II evaluation
of the metabolic profile of an NCE ensures a comprehensive interrogation of
metabolic pathways which will answer the critical question of whether human
specific metabolites are formed. In addition, since some in vivo metabolism
data exists at this stage, it provides a benchmark to assess whether the in vitro
system is predictive. Also, the generation of a radiolabeled form the NCE
allows the relative routes of metabolism across species to be assessed.
Once an NCE is chosen as the lead drug candidate, more specific metabolite
characterization is necessary. This stage is designated as Tier III. At this stage,
the NCE is subjected to the most comprehensive metabolite characterization
244 Using Mass Spectrometry for Drug Metabolism Studies
Copyright © 2005 CRC Press, LLC
7/21/2019 Using Mass Spectrometry for Drug Metabolism Studies
http://slidepdf.com/reader/full/using-mass-spectrometry-for-drug-metabolism-studies 252/362
possible. MSn experiments along with accurate mass MS and MS/MS
experiments are performed to localize the site of metabolic alteration as
much as possible. An MS5 experiment on an O-glucuronide metabolite is
shown in Figure 8.6. MSn experiments can be problematic, particularly when
dealing with low level metabolites or when the most abundant fragment ions
do not contain the metabolic alteration. Often, a metabolite of particular
interest is isolated from the biological matrix and subjected to NMR for
definitive structural elucidation.
The metabolic profile of the NCE is determined in plasma at this stage.
Identification of circulating metabolites is often critical to explain the
pharmacokinetic or the pharmacodynamic profile. An NCE may show efficacy
that is inconsistent with what is predicted based upon the known concentration
of the parent drug. These inconsistencies could be due to the presence of an
active metabolite. Knowledge of these metabolites will also dictate how the
analysis of samples will be conducted in development and clinical studies. If
significant metabolites are present, they must be monitored throughout the
development of the drug.
8.5 Future Directions
The field of metabolite ID and its impact for drug discovery is dynamic and
advances in technology and strategies are constantly evolving. There are
Figure 8.6 MS5 experiment on the Mþ 16þ gluc metabolite of compound X in rat bile.
Special Requirements for Metabolite Characterization 245
Copyright © 2005 CRC Press, LLC
7/21/2019 Using Mass Spectrometry for Drug Metabolism Studies
http://slidepdf.com/reader/full/using-mass-spectrometry-for-drug-metabolism-studies 253/362
significant challenges still to be faced and exciting technologies on the horizon.
One of the largest challenges is to develop ways to intelligently and rapidly
evaluate very large data sets. Software programs are continually evolving to
address this need. Databases are growing to incorporate unique as well asexpected metabolic alterations to chemical substructures. The caution with the
software programs today is that they are far from being ‘black box’ programs.
Computers can only evaluate the data sets that are provided by the analytical
methodology and if this methodology lacks the selectivity to effectively filter
out some of the contaminants, the computer programs can generate mean-
ingless data sets. Because of this, user intervention and interrogation remains
critical. Analytical technology is also evolving to address the need to provide
more selective data sets.
The accurate mass capabilities and fast scanning ability of the time-of-flight mass spectrometers have the ability to perform specific MS/MS scans
and distinguish xenobiotic masses from excipient matrix masses. Sample
clean-up methods as well as advances in chromatography will also contribute
to the simplification of the data that is ultimately generated by the mass
spectrometer by either eliminating the interfering matrix ions altogether or at
least moving them away from the peaks of interest. There is also a demand
for a universal detector that will allow quantification of metabolites without
requiring synthetic standards. Ultraviolet detectors cannot quantify metabo-
lites out of complex matrices and even have problems detecting themetabolites that are generated at very low concentrations in vivo. Several
other universal detectors are available, but their broad-based utility for
metabolite evaluation in a discovery setting remains to be seen. Chemilumi-
nescent–nitrogen detectors offer the ability to quantify compounds based
upon the number of nitrogen atoms contained in the molecules.76 This
technique still requires the chromatographic separation of xenobiotics from
other nitrogen containing compounds in the sample, so the utility of this
technique for extremely complex biological mixtures remains to be seen.
Online coupling of LC with inductively coupled plasma (ICP) mass
spectrometry also offers a method of quantifying metabolites that is
independent of chemical structure.77,78 ICP atomizes and ionizes compounds,
so the response is dependent upon the number of characteristic atoms in the
molecule, not the chemical properties and coupling with mass spectrometry
provides mass as well as some structural information. Multiple elements can
be measured and while ICP is traditionally used for the detection of metals, it
can also measure atoms commonly found in drugs such as halogens,79
sulfur,80 and phosphorus.
While the contribution of mass spectrometry to the field of metabolite
identification has been significant, in many cases, the MS/MS data can only
provide a Markush-type structure of a metabolite, identifying the type of
modification, but not the exact location of the metabolic alteration. Full
structural characterization is, more often than not, dependent upon NMR
analysis. As discussed, NMR is not routinely used for studying the structural
identification of metabolites at the discovery stage because the metabolites are
246 Using Mass Spectrometry for Drug Metabolism Studies
Copyright © 2005 CRC Press, LLC
7/21/2019 Using Mass Spectrometry for Drug Metabolism Studies
http://slidepdf.com/reader/full/using-mass-spectrometry-for-drug-metabolism-studies 254/362
typically not generated in sufficient quantities or sufficient levels of purity.
Developments are on-going to increase the selectivity and sensitivity of NMR
to evaluate samples without requiring extensive off-line HPLC purification and
concentration.
8.6 Conclusions
There is no doubt that metabolite characterization studies can have a
tremendous impact on discovery programs. Early knowledge of the metabolic
fate of an NCE can redefine the focus of the chemistry, and efforts can, in
the end, result in the advancement of a superior drug product. These studies
can provide insight into potential metabolic issues that would not otherwisehave been brought to light until the NCE was well advanced into the clinical
program. A great deal of structural information of metabolites can be
obtained using the state-of-the-art LC–MS strategies available today. How-
ever, detailed structural characterization of metabolites is not a process that
is easily amenable to the high-throughput environment of drug discovery.
Each characterization study is unique and the amount of information
generated can be prohibitive. The greatest success in utilizing metabolite
characterization to support discovery programs has come from structuring
studies to answer specific questions, such as whether or not an NCE has thepotential to form a toxic metabolite. Some sort of prioritization strategy for
metabolite characterization studies is necessary in order to get information
back to the discovery team in a timely manner, whether it is similar to the
tiered system discussed here or some other strategy. The amount of time
spent characterizing a particular NCE should be dependent upon the needs of
that particular discovery program and how far the compound has advanced
in the discovery process. In this manner, the questions that are most critical
to the program can be answered first and all programs can receive some level
of support.
While advances in analytical technologies continue to improve the quality
of the metabolite ID experiments, the critical parameters now appear to center
around generating timely and relevant data in support of discovery programs.
There are many powerful techniques—both hardware and software—available
for conducting structural elucidation of metabolites given enough time
and resources. However, the complex nature of the samples generated for
metabolite profiling can potentially provide mountains of irrelevant data,
requiring significant time for an analyst to decipher. Both in vitro and in vivo
samples contain large amounts of endogenous material that can mask
metabolites. Experiments designed to increase the amounts of metabolites
generated, either by the use of high dose levels or incubation concentrations,
can often produce uncharacteristic metabolites by saturating metabolic
pathways. The key to successful implementation of metabolite characterization
studies in drug discovery is to tailor the studies to the program needs. If a
program is interested in broad, general information on common metabolic
Special Requirements for Metabolite Characterization 247
Copyright © 2005 CRC Press, LLC
7/21/2019 Using Mass Spectrometry for Drug Metabolism Studies
http://slidepdf.com/reader/full/using-mass-spectrometry-for-drug-metabolism-studies 255/362
pathways, large numbers of compounds can be evaluated fairly rapidly from
in vitro systems, with the caveat that not all metabolic pathways may be
accessed and unusual metabolites will be missed. If the discovery program is
interested in toxic metabolic pathways, screening methodologies can beemployed to detect metabolite conjugates that are characteristic of reactive
intermediates. If the discovery program is nearing the recommendation of an
NCE for development, time and resources must be spent to obtain as complete
of a picture as possible of the metabolite profile of the NCE.
8.7 Acknowledgements
The author would like to acknowledge D. Grotz, D. Rindgen, D. Weston, andN. Clarke for their contributions to this manuscript.
References
1. DeMasi, J.A., Risks in new drug development: approval success rates for
investigational drugs, Clin. Pharmacol. Ther., 69, 297, 2001.
2. Caldwell, J., The role of drug metabolism in drug discovery and development:
opportunities to enhance time- and cost-efficiency, Pharm. Sci., 2, 117, 1996.
3. Sinco, P.J., Drug selection in early drug development: screening for acceptable
pharmacokinetic properties using combined in vitro and computational approaches,
Curr. Opin. Drug Discov. Dev., 2, 42, 1999.
4. Prentis, R.A., Lis, Y., and Walker, S.R., Pharmaceutical innovation by seven UK-
owned pharmaceutical companies (1964–1985), Br. J. Clin. Pharmacol , 25, 387,
1987.
5. Rodrigues, A.D., Rational high-throughput screening in preclinical drug metabo-
lism, Med. Chem. Res., 8 (1998) 422.
6. Czarnik, A. and Keene, J.D., Combinatorial chemistry, Curr. Biol., 8, R705, 1998.7. Fernandez, P.B., Technological advances in high throughput screening, Curr. Opin.
Chem. Biol., 2 (1998) 597.
8. Lee, M.S. and Kerns, E.H., LC/MS applications in drug development, Mass
Spectrom. Rev., 18, 187, 1999.
9. Watt, A.P., Morrison, D., and Evans, D.C., Approaches to higher-throughput
pharmacokinetics (HTPK) in drug discovery, Drug Discov. Today, 5, 17, 2000.
10. Eddershaw, P.J., Beresford, A.P., and Bayliss, M.K., ADME/PK as part of a
rational approach to drug discovery, Drug Discov. Today, 5, 409, 2000.
11. White, R.E., High-throughput screening in drug metabolism and pharmacokinetic
support of drug discovery, Annu. Rev. Pharmacol. Toxicol., 40, 133, 2000.12. Korfmacher, W.A., Lead optimization strategies as a part of a drug metabolism
environment, Curr. Opin. Drug Discov. Develop., 6, 481, 2003.
13. Yamashita, S., et al., Analysis of drug permeation across Caco-2 monolayer:
implication for predicting in vivo drug absorption. Pharm. Res. 14, 486, 1997.
14. Crespi, C.L, Miller, V.P., and Penman, B.W., Microtiter plate assays for
inhibition of human drug metabolizing cytochromes P450, Anal. Biochem., 248,
188, 1997.
248 Using Mass Spectrometry for Drug Metabolism Studies
Copyright © 2005 CRC Press, LLC
7/21/2019 Using Mass Spectrometry for Drug Metabolism Studies
http://slidepdf.com/reader/full/using-mass-spectrometry-for-drug-metabolism-studies 256/362
15. Silva, J.M. et al., Refinement of an in vitro cell model for cytochrome P450
induction, Drug Metab. Dispos., 26, 490, 1998.
16. Berman, J., Halm, K., Adkison, K., and Shaffer, J., Simultaneous pharmacokinetic
screening of a mixture of compounds in the dog using API LC/MS/MS analysis for
increased throughput, J. Med. Chem., 40, 827, 1997.
17. Hop, C.E., Wang, Z., Chen, Q., and Kwei, G., Plasma-pooling methods to increase
throughput for in vivo pharmacokinetic screening, J. Pharm. Sci., 3, 901, 1998.
18. Cox, K.A. et al., Novel in-vivo procedure for rapid pharmacokinetic screening of
discovery compounds in rats, Drug Discov. Today, 4, 232, 1999.
19. Fernandez-Metzler, C.L. and King, R.C., The emergence and application of
technological advances in biotransformation studies, Curr. Top. Med. Chem., 2,
67, 2002.
20. Kostiainen, R., Kotiaho, T., Kuuranne, T., and Auriola, S., Liquid chromatog-
raphy/atmospheric pressure ionization–mass spectrometry in drug metabolismstudies, J. Mass Spectrom., 38, 357, 2003.
21. Clarke, N.J., Cox, K.A., Rindgen, D., and Korfmacher, W.A., Systematic LC/MS
metabolite identification in drug discovery, Anal. Chem., 73, 431A, 2001.
22. Korfmacher, W.A. et al., HPLC–API/MS/MS: a powerful tool for integrating drug
metabolism into the drug discovery process, Drug Discov. Today, 2, 532, 1997.
23. Pirmohamed, M., Madden, S., and Park, B.K., Idiosyncratic drug reactions.
Metabolic bioactivation as a pathogenic mechanism, Clin. Pharmacokinet., 31, 215,
1996.
24. Pohl, L.R., Pumford, N.R., and Martin, J.L., Mechanisms, chemical structures and
drug metabolism, Eur. J. Haematol. Suppl., 60, 98, 1996.25. Kreunter, W. et al., Preclinical pharmacology of desloratadine, a selective and
nonsedating histamine H1 receptor antagonist. 2nd communication: lack of central
nervous system and cardiovascular effects, Arzneimittelforschung, 50, 345, 2000.
26. Li, C. et al., Integrated application of capillary HPLC/continuous-flow liquid
secondary ion mass spectrometry to discovery stage metabolism studies, Anal.
Chem., 57, 2931, 1995.
27. Burchell, B., Transformation reactions: glucuronidation, in Handbook of Drug
Metabolism, Woolf, T.F., Ed., Marcel Dekker, Inc, New York, 1999, 153.
28. Daly, A.K., Pharmacogenetics, in Handbook of Drug Metabolism, Woolf, T.F., Ed.,Marcel Dekker Inc, New York, 1999, 175.
29. Lindberg, L.P. and Negishi, M., Alteration of mouse cytochrome p450coh substrate
specificity by mutation of a single amino acid residue, Nature (London), 339, 632,
1989.
30. Elkins, S., et al., Present and future in vitro approaches for drug metabolism,
J. Pharmacol. Toxicol. Methods, 44, 313, 2000.
31. Zhang, N., Fountain, S.T., Honggang, B., and Rossi, D.T., Quantification and
rapid metabolite identification in drug discovery using API time-of-flight LC/MS,
Anal. Chem., 72, 800, 2000.
32. Schultz, G. et al., Comparison of a triple quadrupole using SRM to a TOFMS forquantitative LC-MS support of drug discovery programs, in Proceedings of the 46th
ASMS Conference on Mass Spectrometry and Allied Topics, Orlando, FL, 1998.
33. Shahin, M.M., Ion–molecule interaction in the cathode region of a glow discharge,
J. Chem. Phys., 43, 1798, 1965.
34. Horning, E.C., et al., Liquid chromatograph–mass spectrometer–computer
analytical systems. Continuous flow system based on atmospheric pressure
ionization mass spectrometry, J. Chromatogr., 99, 13, 1974.
Special Requirements for Metabolite Characterization 249
Copyright © 2005 CRC Press, LLC
7/21/2019 Using Mass Spectrometry for Drug Metabolism Studies
http://slidepdf.com/reader/full/using-mass-spectrometry-for-drug-metabolism-studies 257/362
35. Yamashita, M. and Fenn, J.B., Electrospray ion source. Another variation on the
free-jet theme., J. Phys. Chem., 88, 4451, 1984.
36. Robb, D.B., Covey, T.R., and Bruins, A.P., Atmospheric pressure photoionization:
an ionization method for liquid chromatography–mass spectrometry, Anal. Chem.,
72, 3653, 2000.
37. Syage, J.A., and Evans, M.D., Photoionization mass spectrometry as a powerful
new tool for drug discovery, Spectroscopy, 16, 14, 2001.
38. Keski-Hynnila, H. et al., Comparison of electrospray, atmospheric pressure
chemical ionization, and atmospheric pressure photoionization in the identification
of apmorphine, dobutamide, and entacapone phase II metabolites in biological
samples, Anal. Chem., 74, 3449, 2002.
39. Yang, C. and Henion, J., Atmospheric pressure photoionization liquid chromato-
graphic–mass spectrometric determination of idoxifene and its metabolites in
human plasma, J. Chromatogr. A., 970, 155, 2002.40. Busch, K.L., Glish, G.L., and McLuckey, S.A., Mass Spectrometry/Mass
Spectrometry: Techniques and Applications of Tandem Mass Spectrometry, VCH
Publishers Inc, New York, 1988.
41. Perchalski, A.D., Yost, R.A., and Wilder, B.J., Structural elucidation of drug
metabolites by triple-quadrupole mass spectrometry, Anal. Chem., 54, 1466, 1982.
42. Vrbanac, J.J., O’Leary, I.A., and Bacynski, L., Utility of parent-neutral loss scan
screening technique: Partial characterization of urinary metabolites of U-78875 in
monkey urine, Biol. Mass Spectrom., 21, 517, 1992.
43. Stafford, G.C. et al., Recent improvements in analytical applications of ion-trap
technology, Int. J. Mass Spectrom. Ion Proc., 60, 85, 1984.44. Louris, J.N. et al., Instrumentation, applications and energy deposition in
quadrupole ion trap MS/MS spectrometry, Anal. Chem., 59, 1677, 1987.
45. Sin, C.H., Lee, E.D., and Lee, M.L., Atmospheric pressure ionization time-of-flight
mass spectrometry with a supersonic ion beam, Anal. Chem., 63, 2897, 1991.
46. Hop, C.E.C.A. et al., Elucidation of fragmentation mechanisms involving transfer
of three hydrogen atoms using a quadrupole time-of-flight mass spectrometer,
J. Mass Spectrom., 36, 575, 2001.
47. Eckers, C., Haskins, N., and Langridge, J., The use of liquid chromatography
combined with a quadrupole time of flight analyzer for the identification of traceimpurities in drug substance, Rapid Commun. Mass Spectrom., 11, 1916, 1997.
48. Marshall, A.G., Hendrickson, C.L., and Shi, S.D.-H., Scaling MS plateaus with
high-resolution FT-ICRMS, Anal. Chem., 74, 252A, 2002.
49. Aharoni, A. et al., Non-targeted metabolome analysis by use of Fourier transform
ion cyclotron mass spectrometry, OMICS , 6, 217, 2002.
50. Zhang, H., Henion, J., Yang, Y. and Spooner, N., Application of atmospheric
pressure ionization time-of-flight mass spectrometry coupled with liquid chromato-
graphy for the characterization of in vitro drug metabolites, Anal. Chem., 72, 3342,
2000.
51. Cox, K.A., Clarke, N.J., Rindgen, D., and Korfmacher, W.A., Higher throughputmetabolite identification in drug discovery: current capabilities and future trends,
Am. Pharm. Rev., 4, 45, 2001.
52. Bolden, R.D., et al., Semi-automated liquid-liquid back-extraction in a 96-well
format to decrease sample preparation time for the determination of dextromethor-
phan and destrorphan in human plasma, J. Chromatogr. B., 772, 1, 2002.
53. Allanson, J.P., Biddlecombe, R.A., Jones, A.E., and Pleasance, S., The use of
automated solid phase extraction in the ‘96 well’ format for high throughput
250 Using Mass Spectrometry for Drug Metabolism Studies
Copyright © 2005 CRC Press, LLC
7/21/2019 Using Mass Spectrometry for Drug Metabolism Studies
http://slidepdf.com/reader/full/using-mass-spectrometry-for-drug-metabolism-studies 258/362
bioanalysis using liquid chromatography coupled to tandem mass spectrometry,
Rapid Commun. Mass Spectrom., 10, 811, 1998.
54. Ulrich, S., Solid-phase microextraction in biomedical analysis, J. Chromatog. A.,
902, 167, 2000.
55. Hop, C.E.C.A., Tiller, P.R., and Romanyshyn, L., In vitro metabolite identification
using fast gradient high performance liquid chromatography combined with tandem
mass spectrometry, Rapid Commun. Mass Spectrom., 16, 212, 2002.
56. Mallett, D.N., Dear, G.J., and Plumb, R.S., Direct analysis of a polar
pharmaceutical compound in plasma using ultra-high flow rate liquid chroma-
tography/mass spectrometry with a mixed-mode column, Rapid Commun. Mass
Spectrom, 15, 2526, 2001.
57. Hsieh, Y. et al., Simultaneous determination of a drug candidate and its metabolite
in rat plasma samples using ultrafast monolithic column high-performance liquid
chromatography/tandem mass spectrometry, Rapid Commun. Mass Spectrom., 16,944, 2002.
58. Dear, G., Plumb, R., and Mallett, D., Use of monolithic silica columns to increase
analytical throughput for metabolite identification by liquid chromatography/
tandem mass spectrometry, Rapid Commun. Mass Spectrom., 15, 152, 2001.
59. Ayrton, J. et al., The use of turbulent flow chromatography/mass spectrometry for
the rapid, direct analysis of a novel pharmaceutical compound in plasma, Rapid
Commun. Mass Spectrom., 11, 1953, 1997.
60. Lim, H.K., Chan, K.W., Sisenwine, S., and Scatina, J.A., Simultaneous screen for
microsomal stability and metabolite profile by direct injection turbulent-laminar
flow LC–LC and automated tandem mass spectrometry, Anal. Chem., 73, 2140,2001.
61. Wilson, A.G., White, A.C., and Mueller, R.A., Role of predictive metabolism and
toxicity modeling in drug discovery—a summary of some recent advancements,
Curr. Opin. Drug Discov. Devel., 6, 123, 2003.
62. Lewis, D.F., Modelling human cytochromes P450 for evaluation drug metabolism:
an update, Drug Metabol. Drug Interact., 16, 307, 2000.
63. Nassar, A.-E.F. and Adams, P.E., Metabolite characterization in drug discovery,
utilizing robotic liquid-handling, quadrupole time of flight mass spectrometry and
in silico prediction, Curr. Drug Met., 4, 259, 2003.64. Dear, D.J. et al., Mass directed peak selection, an efficient method of drug
metabolite identification using directly coupled liquid chromatography–mass
spectrometry–nuclear magnetic resonance spectroscopy, J. Chromatog. B., 748,
281, 2000.
65. Shockcor, J.P., Unger, S.E., Savina, P., and Nicholson, J.K., Application of directly
coupled LC–NMR–MS to the structural elucidation of metabolites of the HIV-1
reverse-transcriptase inhibitor BW935U83, J. Chromatog. B., 748, 269, 2000.
66. Watt, A.P., Mortishire-Smith, R.J., Gerhard, U., and Thomas, S.R., Metabolite
identification in drug discovery, Curr. Opin. Drug Discov. Devel., 6, 57, 2003.
67. Pochapsky, S.S. and Pochapsky, T.C., Nuclear magnetic resonance as a tool in drugdiscovery, metabolism and disposition, Curr. Top. Med. Chem., 1, 427, 2001.
68. Xu, R. et al., Application of parallel liquid chromatography/mass spectrometry for
high throughput microsomal stability screening of compound libraries, J. Am. Soc.
Mass Spectrom., 13, 155, 2002.
69. Janiszewski, J.S. et al., A high-capacity LC/MS system for the bioanalysis of
samples generated from plate-based metabolic screening, Anal. Chem., 73, 495,
2001.
Special Requirements for Metabolite Characterization 251
Copyright © 2005 CRC Press, LLC
7/21/2019 Using Mass Spectrometry for Drug Metabolism Studies
http://slidepdf.com/reader/full/using-mass-spectrometry-for-drug-metabolism-studies 259/362
70. Korfmacher, W.A. et al., Development of an automated mass spectrometry system
for the quantitative analysis of liver microsomal incubation samples: a tool for
rapid metabolite screening of new compounds for metabolic stability, Rapid
Commun. Mass Spectrom., 13, 901, 1999.
71. Lim, H.K., Chan, K.W., Sisenwine, S., and Scatina, J.A., Simultaneous screen for
microsomal stability and metabolite profile by direct injection turbulent-laminar
flow LC–LC and automated tandem mass spectrometry, Anal. Chem., 73, 2140,
2001.
72. Rindgen, D., Grotz, D.D., Clarke, N.J., and Cox, K.A., The application of HPLC/
tandem mass spectrometry for the assessment of acyl glucuronide formation in
in vitro and in vivo systems in a drug discovery environment, Am. Pharm. Rev., 4, 52,
2001.
73. Clarke D.J. and Burchell, B. The uridine diphosphate glucuronosyltransferase
multigene family: function and regulation, in Conjugation–Deconjugation Reactionsin Drug Metabolism and Toxicity, Kauffman, F.C., Ed., Springer-Verlag, Berlin,
1994.
74. Daly, A.K., Pharmacogenetics, in Handbook of Drug Metabolism, Woolf, T.F., Ed.,
Marcel Dekker, New York, 1999.
75. Bertrand, M., Jackson, P., and Walther, B., Rapid assessment of drug metabolism
in the drug discovery process, Eur. J. Pharm. Sci., 11, S61, 2000.
76. Taylor, E.W., Jia, W., Bush, M., and Dollinger, G.D., Accelerating the drug
optimization process: identification, structural elucidation, and quantification of
in vitro metabolites using stable isotopes with LC/MSn and the chemiluminescent
nitrogen detector, Anal. Chem., 74, 3232, 2002.77. Suzuki, K.T., Yoneda, S., Itoh, M., and Ohmichi, M., Enriched stable isotopes
of elements used as tracers: methods of presenting high-performance liquid
chromatographic–inductively coupled argon plasma mass spectrometric data,
J. Chromatogr. B, 63, 670, 1995.
78. Sutton, K.L. and Caruso, J.A., Liquid chromatography–inductively coupled
plasma mass spectrometry, J. Chromatogr. A, 856, 243, 1999.
79. Axelsson, B.-O., Jornten-Karlsson, J., Michelsen, P., and Abou-Shakra, F., The
potential of inductively coupled plasma mass spectrometry detection for high-
performance liquid chromatography combined with accurate mass measurementof organic pharmaceutical compounds, Rapid Commun. Mass Spectrom., 15, 375,
2001.
80. Corcoran, O. et al., Directly coupled liquid chromatography with inductively
coupled plasma mass spectrometry and orthogonal acceleration time-of-flight mass
spectrometry for the identification of drug metabolites in urine: application to
diclofenac using chlorine and sulfur detection, Rapid Commun. Mass Spectrom., 14,
2377, 2000.
252 Using Mass Spectrometry for Drug Metabolism Studies
Copyright © 2005 CRC Press, LLC
7/21/2019 Using Mass Spectrometry for Drug Metabolism Studies
http://slidepdf.com/reader/full/using-mass-spectrometry-for-drug-metabolism-studies 260/362
Chapter 9
APPI: A New Ionization Sourcefor LC–MS/MS Assays
Yunsheng Hsieh
9.1 Introduction
One common mission for most pharmaceutical companies is to bring new
medicines into market through research and development. Bioanalytical
methods for supporting biomedical research are an essential element in the
process of searching for new leads. High-performance liquid chromatography(HPLC) procedures for the determination of drug components in in vivo and
in vitro samples had been the primary analytical tool for several decades prior
to the early 1990s. The ideal detector for HPLC techniques should yield linear
responses for most analytes as well as providing selective, sensitive, and reli-
able analyte signals and, ideally, should also be able to provide structural
information on test compounds and their metabolites. A tandem mass
spectrometer (MS/MS) with molecular weight and fragmentation measurement
for both known analytes and unknown components is an obvious candidate
for being the ideal detector. Therefore, the importance of selecting the right
interface (ionization source) to connect an HPLC to an MS/MS system has
been an area of intense research in the last 20 years. The emergence of
atmospheric pressure ionization (API) techniques in the last 10 years has
allowed HPLC–MS to become the standard analytical technique for many
0-8493-1963-3/05/$0.00+$1.50 2005 by CRC Press 253
Copyright © 2005 CRC Press, LLC

7/21/2019 Using Mass Spectrometry for Drug Metabolism Studies
http://slidepdf.com/reader/full/using-mass-spectrometry-for-drug-metabolism-studies 261/362
pharmaceutical applications. The two most significant atmospheric pressure
ionization (API) techniques which are widely employed for HPLC–API/MS/
MS systems are electrospray ionization (ESI) and atmospheric pressure
chemical ionization (APCI). In this chapter, we focus on a new ionizationsource design, atmospheric pressure photoionization (APPI), for HPLC–MS
and describe how it can be used for pharmaceutical assays.
9.2 Instrumental Technology
9.2.1 Early development of HPLC–MS interfaces
Since the late 1960s, much effort on exploring suitable HPLC–MS interfaceswas devoted to removing the liquid mobile phase and to ionizing the analytes.
A few historical overviews on the coupling of liquid chromatography with mass
spectrometric analysis for small molecule determination have been published
elsewhere [1–8]. For a reversed-phase chromatography mode, a flow rate of
1 mL/min of water or methanol is converted to 1244 or 700 mL/min vapor at
atmospheric pressure, respectively, which can not be handled by the traditional
MS vacuum system. Therefore, the initial attempts were to minimize the amount
of liquid in order to be able to remove the solvent and to leave the ionized
analytes in the gas phase. The use of micro-column chromatography or split-ting the mobile phase flow are examples of techniques that have been employed
to reduce the overall liquid flow into the MS system. Thermospray (TS),
particle beam (PB) and continuous-flow fast atom bombardment (CFFAB)
systems are examples of early HPLC–MS interfaces that showed some promise.
For the TS source developed by Blakley and co-workers [9], the LC effluent
is first introduced to a preheated chamber where the solvent with low
molecular mass is instantaneously vaporized and pumped away under a modest
vacuum. The rapid spray heating of ionic buffers in the liquid phase results in
desorption, evaporation, and ionization of intact ions from the droplets to the
gas phase. The analyte molecular ions and cluster ions with larger molecular
mass than those of the solvent tend to reach the inlet vacuum region of a mass
spectrometer. Three recent examples of using the TS interface for HPLC–MS
are the quantitative determination of ceramides [10], analysis of delmopinol
and its metabolites [11], and a nicotine N -glucuronide assay [12].
The PB interface consists of three units: aerosol formation, desolvation,
and subsequent momentum separation of particles. The LC effluent is mixed
with helium gas for nebulization as a high-speed spray of small droplets to
a hot desolvation chamber. The flow of droplets is directed through a
differentially pumped momentum separator by rotary pumps to remove He
and solvent and to form the particle beam. The particle beam entering the ion
chamber is suitable for ionization through conventional means such as electron
ionization. Three methods of using a combination of liquid chromatography/
particle beam–mass spectrometry (LC/PB–MS) have been reported: (1) for
detecting the metabolism of beta-carotene-d8 in humans [13]; (2) for the
254 Using Mass Spectrometry for Drug Metabolism Studies
Copyright © 2005 CRC Press, LLC
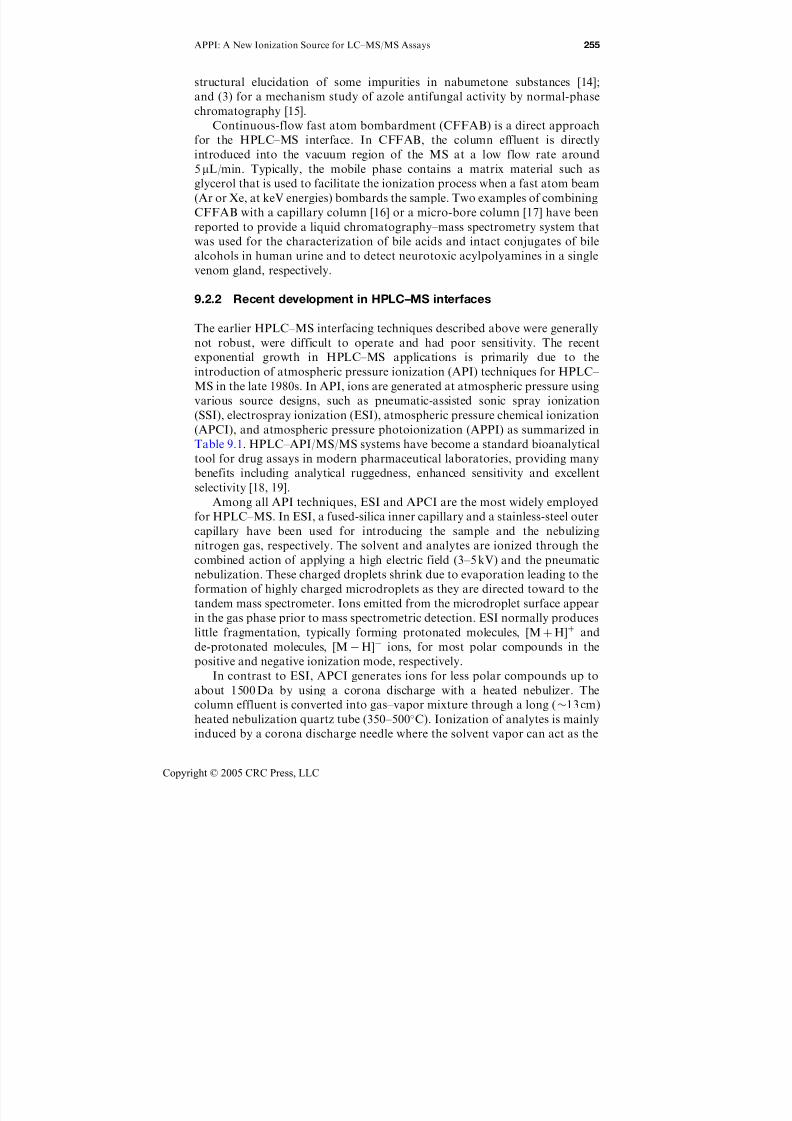
7/21/2019 Using Mass Spectrometry for Drug Metabolism Studies
http://slidepdf.com/reader/full/using-mass-spectrometry-for-drug-metabolism-studies 262/362
structural elucidation of some impurities in nabumetone substances [14];
and (3) for a mechanism study of azole antifungal activity by normal-phase
chromatography [15].
Continuous-flow fast atom bombardment (CFFAB) is a direct approachfor the HPLC–MS interface. In CFFAB, the column effluent is directly
introduced into the vacuum region of the MS at a low flow rate around
5mL/min. Typically, the mobile phase contains a matrix material such as
glycerol that is used to facilitate the ionization process when a fast atom beam
(Ar or Xe, at keV energies) bombards the sample. Two examples of combining
CFFAB with a capillary column [16] or a micro-bore column [17] have been
reported to provide a liquid chromatography–mass spectrometry system that
was used for the characterization of bile acids and intact conjugates of bile
alcohols in human urine and to detect neurotoxic acylpolyamines in a singlevenom gland, respectively.
9.2.2 Recent development in HPLC–MS interfaces
The earlier HPLC–MS interfacing techniques described above were generally
not robust, were difficult to operate and had poor sensitivity. The recent
exponential growth in HPLC–MS applications is primarily due to the
introduction of atmospheric pressure ionization (API) techniques for HPLC–
MS in the late 1980s. In API, ions are generated at atmospheric pressure usingvarious source designs, such as pneumatic-assisted sonic spray ionization
(SSI), electrospray ionization (ESI), atmospheric pressure chemical ionization
(APCI), and atmospheric pressure photoionization (APPI) as summarized in
Table 9.1. HPLC–API/MS/MS systems have become a standard bioanalytical
tool for drug assays in modern pharmaceutical laboratories, providing many
benefits including analytical ruggedness, enhanced sensitivity and excellent
selectivity [18, 19].
Among all API techniques, ESI and APCI are the most widely employed
for HPLC–MS. In ESI, a fused-silica inner capillary and a stainless-steel outer
capillary have been used for introducing the sample and the nebulizing
nitrogen gas, respectively. The solvent and analytes are ionized through the
combined action of applying a high electric field (3–5 kV) and the pneumatic
nebulization. These charged droplets shrink due to evaporation leading to the
formation of highly charged microdroplets as they are directed toward to the
tandem mass spectrometer. Ions emitted from the microdroplet surface appear
in the gas phase prior to mass spectrometric detection. ESI normally produces
little fragmentation, typically forming protonated molecules, [M þ H]þ and
de-protonated molecules, [M H] ions, for most polar compounds in the
positive and negative ionization mode, respectively.
In contrast to ESI, APCI generates ions for less polar compounds up to
about 1500 Da by using a corona discharge with a heated nebulizer. The
column effluent is converted into gas–vapor mixture through a long (13 cm)
heated nebulization quartz tube (350–500C). Ionization of analytes is mainly
induced by a corona discharge needle where the solvent vapor can act as the
APPI: A New Ionization Source for LC–MS/MS Assays 255
Copyright © 2005 CRC Press, LLC
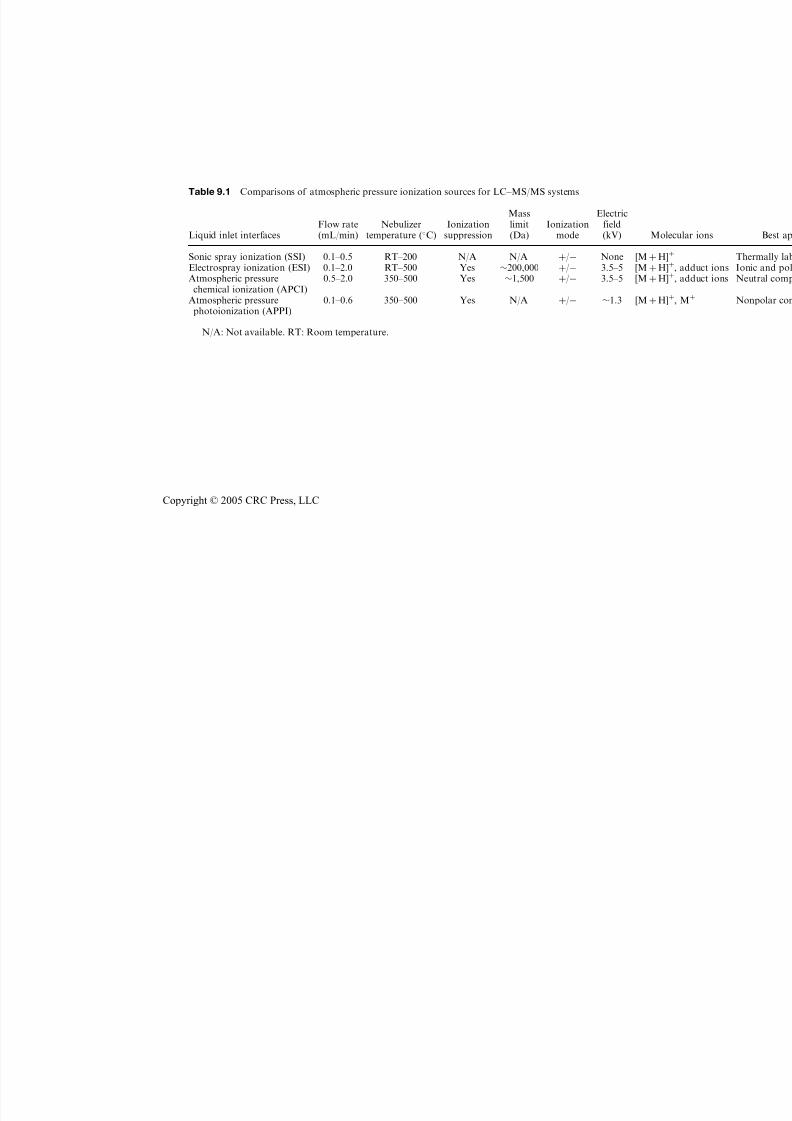
7/21/2019 Using Mass Spectrometry for Drug Metabolism Studies
http://slidepdf.com/reader/full/using-mass-spectrometry-for-drug-metabolism-studies 263/362
Table 9.1 Comparisons of atmospheric pressure ionization sources for LC–MS/MS systems
Liquid inlet interfacesFlow rate(mL/min)
Nebulizertemperature (C)
Ionizationsuppression
Masslimit(Da)
Ionizationmode
Electricfield(kV) M
Sonic spray ionization (SSI) 0.1–0.5 RT–200 N/A N/A þ/ None [M þElectrospray ionization (ESI) 0.1–2.0 RT–500 Yes 200,000 þ/ 3.5–5 [M þAtmospheric pressure
chemical ionization (APCI)0.5–2.0 350–500 Yes 1,500 þ/ 3.5–5 [M þ
Atmospheric pressurephotoionization (APPI)
0.1–0.6 350–500 Yes N/A þ/ 1.3 [M þ
N/A: Not available. RT: Room temperature.
Copyright © 2005 CRC Press, LLC
7/21/2019 Using Mass Spectrometry for Drug Metabolism Studies
http://slidepdf.com/reader/full/using-mass-spectrometry-for-drug-metabolism-studies 264/362
reagent gas providing chemical ionization reactions. APCI may yield in-source
fragmentation for thermally unstable compounds and therefore is less suitable
than ESI for qualitative assays such as metabolite characterization. Both ESI
and APCI are often not suitable for the analysis of nonpolar compounds.Another novel API technique is the sonic spray ionization technique
developed by Hirabayashi and co-workers in the early 1990s [20, 21]. In SSI,
the LC effluent is sprayed from a fused-silica capillary with a very high (sonic)
gas flow (3 L/min) coaxial to the capillary. The amount of charged droplets
and ions produced from the solution are strongly associated with the gas flow
rate. SSI applies neither heat nor an electrical field on the capillary tip and
is therefore particularly suitable for the determination of thermally labile
compounds. A comprehensive comparative study of SSI, ESI, and APCI on the
influence of the eluent composition in terms of ionization efficiency formorphine concluded that APCI proved to be the preferred HPLC–MS
interface for the test compound due to its robust character [22]. In this chapter,
we focus on a relatively new API source, atmospheric pressure photoionization
(APPI), which was introduced by Robb and co-workers in the late 1990s [23].
9.2.2.1 Photoionization mass spectrometric methods
Photoionization is a direct process of ionizing small molecules. Photoioniza-
tion detection (PID) was initially adapted for gas chromatography. Theresearch group of Jorgenson at the University of North Carolina-Chapel Hill
actively explored the coupling of a vapor-phase photoionization detector for
open-tubular liquid chromatography [24]. This investigation led to the further
development of atmospheric pressure photoionization (APPI) source for
HPLC–MS. Current photoionization techniques can be divided into two
categories: sub-atmospheric (lower pressure) photoionization, LPPI, and
atmospheric pressure (or so-called dopant-assisted) photoionization, APPI.
The major LPPI mechanism of a given drug compound, M, is photon
absorption, and electron ejection to yield the molecular ion Mþ which can
then extract a proton from water vapor or various protic solvents to form
protonated molecules ([M þ H]þ ions), whereas nonpolar compounds such
as naphthalene usually form Mþ ions. The LPPI source based on direct
photoionization of analyte molecules was developed by Syage and his
co-workers at Syagen Technology, Tustin, CA [25, 26]. The integrated LPPI/
MS instrument based on a direct syringe injection autosampler claimed to be
able to provide near-universal ionization efficiency, have a linear relationship
between signals and concentration, provide minimal fragmentation for new
chemical entities and allow for the analysis of 2000 combinatory library
samples for drug discovery applications in less than one day.
In this chapter, we focus on the APPI interface for HPLC-MS/MS as an
alternative method of introducing samples with low-polarity analytes into mass
spectrometers. The APPI source was first successfully demonstrated to provide
high sensitivity for LC–MS analyses by Robb and co-workers [23]. The APPI
source attached to a PE/Sciex API 3000 triple-quadrupole mass spectrometer is
APPI: A New Ionization Source for LC–MS/MS Assays 257
Copyright © 2005 CRC Press, LLC
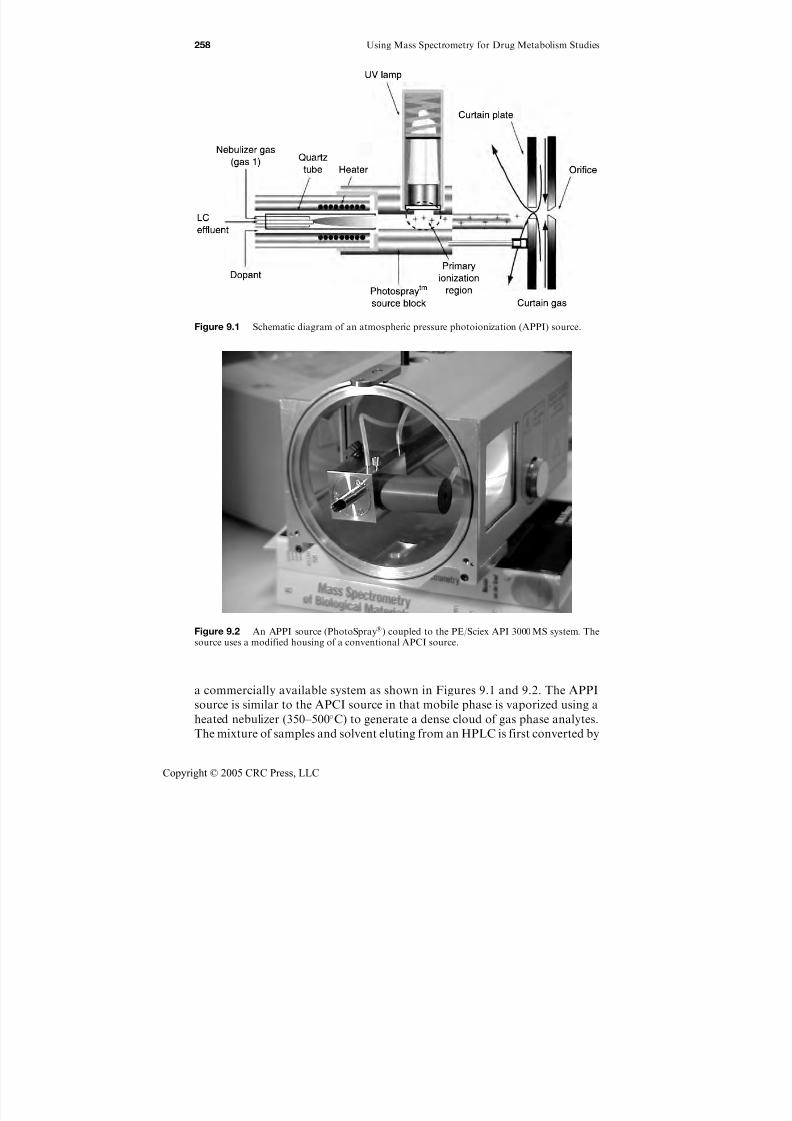
7/21/2019 Using Mass Spectrometry for Drug Metabolism Studies
http://slidepdf.com/reader/full/using-mass-spectrometry-for-drug-metabolism-studies 265/362
a commercially available system as shown in Figures 9.1 and 9.2. The APPI
source is similar to the APCI source in that mobile phase is vaporized using a
heated nebulizer (350–500C) to generate a dense cloud of gas phase analytes.
The mixture of samples and solvent eluting from an HPLC is first converted by
Figure 9.2 An APPI source (PhotoSpray) coupled to the PE/Sciex API 3000 MS system. The
source uses a modified housing of a conventional APCI source.
Figure 9.1 Schematic diagram of an atmospheric pressure photoionization (APPI) source.
258 Using Mass Spectrometry for Drug Metabolism Studies
Copyright © 2005 CRC Press, LLC
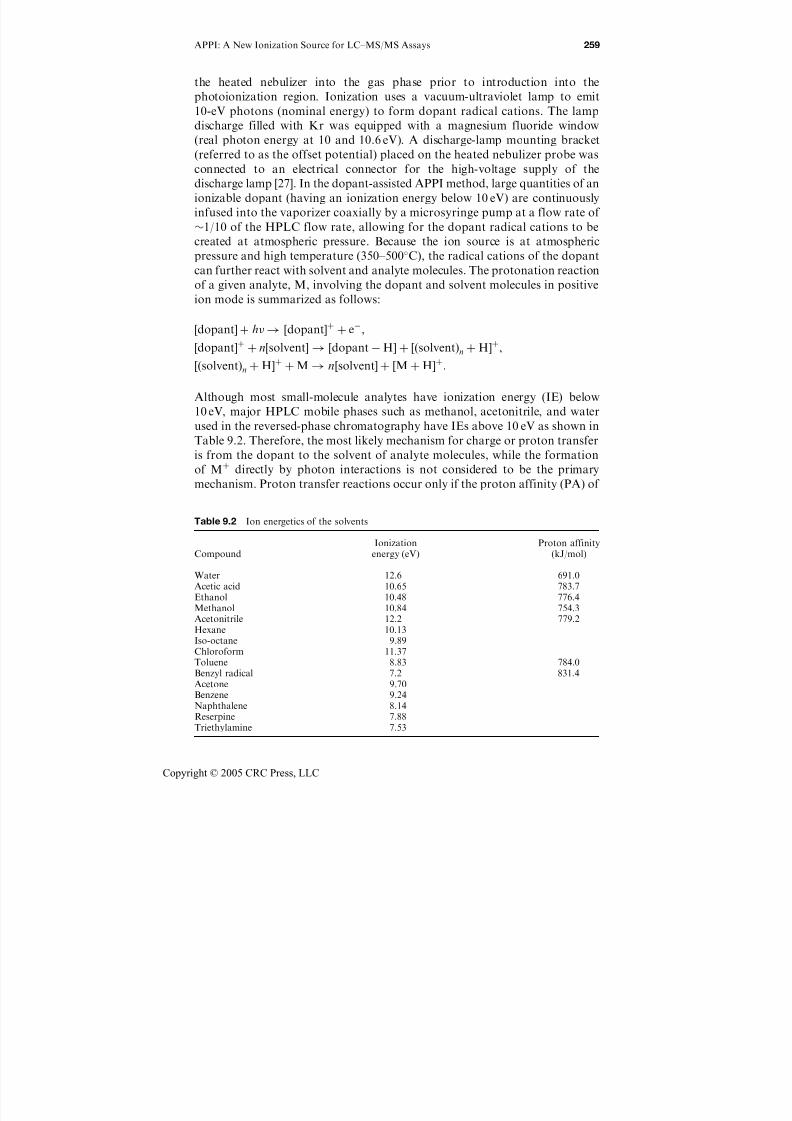
7/21/2019 Using Mass Spectrometry for Drug Metabolism Studies
http://slidepdf.com/reader/full/using-mass-spectrometry-for-drug-metabolism-studies 266/362
the heated nebulizer into the gas phase prior to introduction into the
photoionization region. Ionization uses a vacuum-ultraviolet lamp to emit
10-eV photons (nominal energy) to form dopant radical cations. The lamp
discharge filled with Kr was equipped with a magnesium fluoride window(real photon energy at 10 and 10.6 eV). A discharge-lamp mounting bracket
(referred to as the offset potential) placed on the heated nebulizer probe was
connected to an electrical connector for the high-voltage supply of the
discharge lamp [27]. In the dopant-assisted APPI method, large quantities of an
ionizable dopant (having an ionization energy below 10 eV) are continuously
infused into the vaporizer coaxially by a microsyringe pump at a flow rate of
1/10 of the HPLC flow rate, allowing for the dopant radical cations to be
created at atmospheric pressure. Because the ion source is at atmospheric
pressure and high temperature (350–500C), the radical cations of the dopantcan further react with solvent and analyte molecules. The protonation reaction
of a given analyte, M, involving the dopant and solvent molecules in positive
ion mode is summarized as follows:
½dopant þ h ! ½dopantþ þ e,
½dopantþ þ n½solvent ! ½dopant H þ ½ðsolventÞn þ Hþ,
½ðsolventÞn þ Hþ þ M ! n½solvent þ ½M þ Hþ:
Although most small-molecule analytes have ionization energy (IE) below
10 eV, major HPLC mobile phases such as methanol, acetonitrile, and water
used in the reversed-phase chromatography have IEs above 10 eV as shown in
Table 9.2. Therefore, the most likely mechanism for charge or proton transfer
is from the dopant to the solvent of analyte molecules, while the formation
of Mþ directly by photon interactions is not considered to be the primary
mechanism. Proton transfer reactions occur only if the proton affinity (PA) of
Table 9.2 Ion energetics of the solvents
CompoundIonization
energy (eV)Proton affinity
(kJ/mol)
Water 12.6 691.0Acetic acid 10.65 783.7Ethanol 10.48 776.4Methanol 10.84 754.3Acetonitrile 12.2 779.2Hexane 10.13
Iso-octane 9.89Chloroform 11.37Toluene 8.83 784.0Benzyl radical 7.2 831.4Acetone 9.70Benzene 9.24Naphthalene 8.14Reserpine 7.88Triethylamine 7.53
APPI: A New Ionization Source for LC–MS/MS Assays 259
Copyright © 2005 CRC Press, LLC

7/21/2019 Using Mass Spectrometry for Drug Metabolism Studies
http://slidepdf.com/reader/full/using-mass-spectrometry-for-drug-metabolism-studies 267/362
the solvent is greater than that of dopant and the PA of analyte is greater thanthat of the solvent. Toluene (IE ¼ 8.83 eV) is frequently chosen as the preferred
dopant due to its relative safety. The APPI chromatograms shown in Figure 9.3
illustrates that acetone (IE ¼ 9.7 eV) is another effective dopant for compounds
having a higher proton affinity, such as carbamazepine and acridine, while it
does not promote molecular ion formation of naphthalene or diphenyl sulfide,
which have a low proton affinity. Therefore, the choice of dopant plays an
important role in ionization efficiency of APPI.
Kauppila et al. [28] explored the ionization mechanisms of dopant-assisted
APPI and the effect of solvent on the ionization efficiency using seven naph-
thalene derivatives, such as 1-naphthalene methylamine, 2-acetonaphthone,
2-naphthol, 2-ethylnaphthalene, 2-naphthalene ethanol, 2-naphthylacetic acid,
and 1,4-naphthoquinone as analytes and 13 different solvent systems. The
main reactions for ionization in APPI either in the positive or negative mode
were proposed by the authors [28]. It was suggested that in the positive ion
mode, the analytes are ionized through either charge exchange or proton
transfer as depicted in Figure 9.4. The charge exchange process is favorable for
low proton affinity solvents (water, hexane, and chloroform), whereas the
addition of methanol or acetonitrile to the solvent can initiate a proton transfer
step. The APPI–MS spectra of the solvent systems studied showed that the
radical cation of toluene (C7H8þ, m/z 92) remained in the system containing
low PA solvents (water, hexane, and others), but was not observed in solvent
systems containing methanol or acetonitrile where protonated solvent
molecules or their dimers, trimers, or solvent–water clusters were observed,
indicating proton transfer from C7H8þ to the solvent clusters [28]. Although
Figure 9.3 APPI with a dopant. Sensitivity is enhanced about two order magnitudes relatively tono dopant case. Toluene enhances the sensitivity towards all four compounds. Acetone onlyeffectively enhances the sensitivity for carbamazepine and acridine.
260 Using Mass Spectrometry for Drug Metabolism Studies
Copyright © 2005 CRC Press, LLC
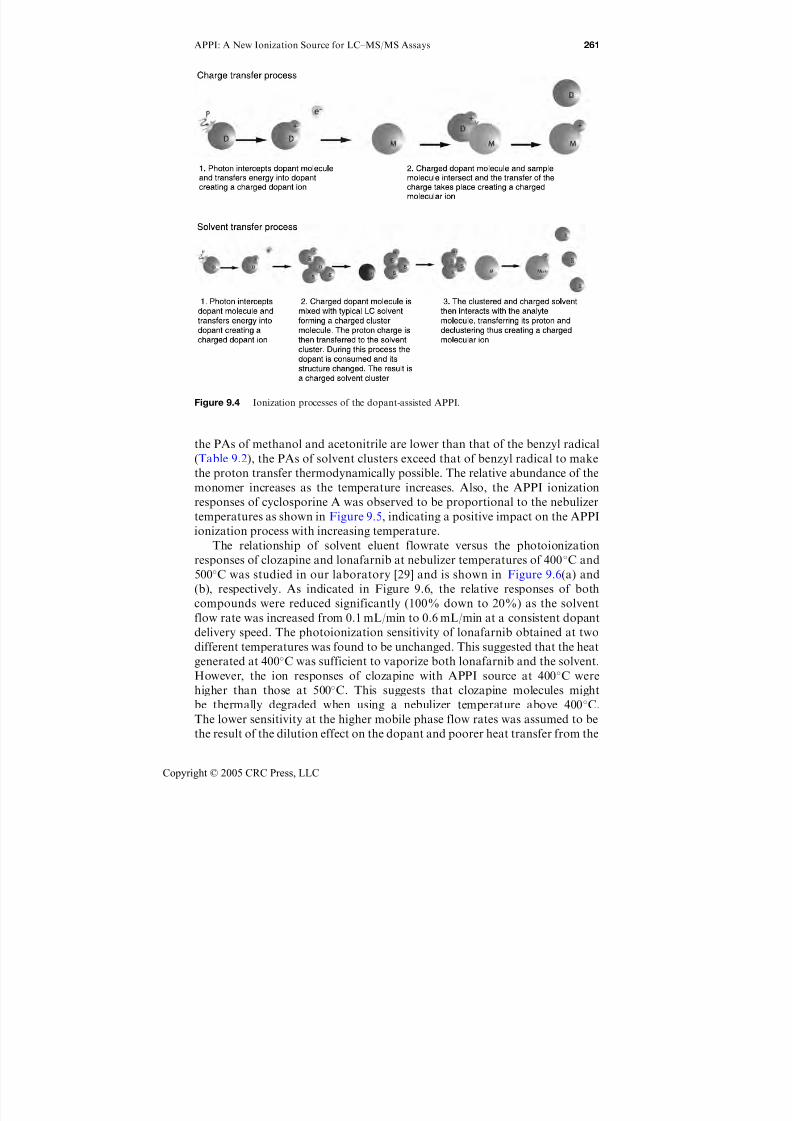
7/21/2019 Using Mass Spectrometry for Drug Metabolism Studies
http://slidepdf.com/reader/full/using-mass-spectrometry-for-drug-metabolism-studies 268/362
the PAs of methanol and acetonitrile are lower than that of the benzyl radical
(Table 9.2), the PAs of solvent clusters exceed that of benzyl radical to make
the proton transfer thermodynamically possible. The relative abundance of the
monomer increases as the temperature increases. Also, the APPI ionization
responses of cyclosporine A was observed to be proportional to the nebulizer
temperatures as shown in Figure 9.5, indicating a positive impact on the APPI
ionization process with increasing temperature.
The relationship of solvent eluent flowrate versus the photoionization
responses of clozapine and lonafarnib at nebulizer temperatures of 400C and
500C was studied in our laboratory [29] and is shown in Figure 9.6(a) and
(b), respectively. As indicated in Figure 9.6, the relative responses of both
compounds were reduced significantly (100% down to 20%) as the solvent
flow rate was increased from 0.1 mL/min to 0.6 mL/min at a consistent dopant
delivery speed. The photoionization sensitivity of lonafarnib obtained at two
different temperatures was found to be unchanged. This suggested that the heat
generated at 400C was sufficient to vaporize both lonafarnib and the solvent.
However, the ion responses of clozapine with APPI source at 400C were
higher than those at 500C. This suggests that clozapine molecules might
be thermally degraded when using a nebulizer temperature above 400C.
The lower sensitivity at the higher mobile phase flow rates was assumed to be
the result of the dilution effect on the dopant and poorer heat transfer from the
Figure 9.4 Ionization processes of the dopant-assisted APPI.
APPI: A New Ionization Source for LC–MS/MS Assays 261
Copyright © 2005 CRC Press, LLC
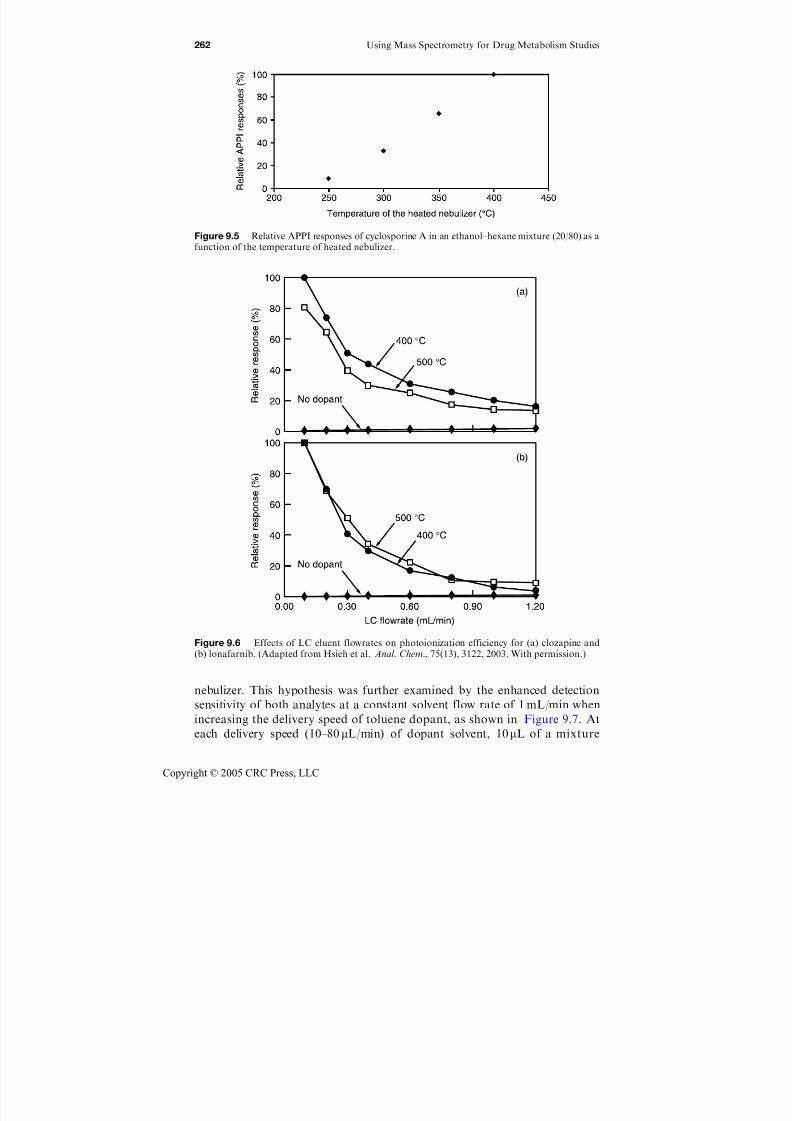
7/21/2019 Using Mass Spectrometry for Drug Metabolism Studies
http://slidepdf.com/reader/full/using-mass-spectrometry-for-drug-metabolism-studies 269/362
nebulizer. This hypothesis was further examined by the enhanced detection
sensitivity of both analytes at a constant solvent flow rate of 1 mL/min when
increasing the delivery speed of toluene dopant, as shown in Figure 9.7. At
each delivery speed (10–80mL/min) of dopant solvent, 10mL of a mixture
Figure 9.6 Effects of LC eluent flowrates on photoionization efficiency for (a) clozapine and(b) lonafarnib. (Adapted from Hsieh et al. Anal. Chem., 75(13), 3122, 2003. With permission.)
Figure 9.5 Relative APPI responses of cyclosporine A in an ethanol–hexane mixture (20/80) as afunction of the temperature of heated nebulizer.
262 Using Mass Spectrometry for Drug Metabolism Studies
Copyright © 2005 CRC Press, LLC
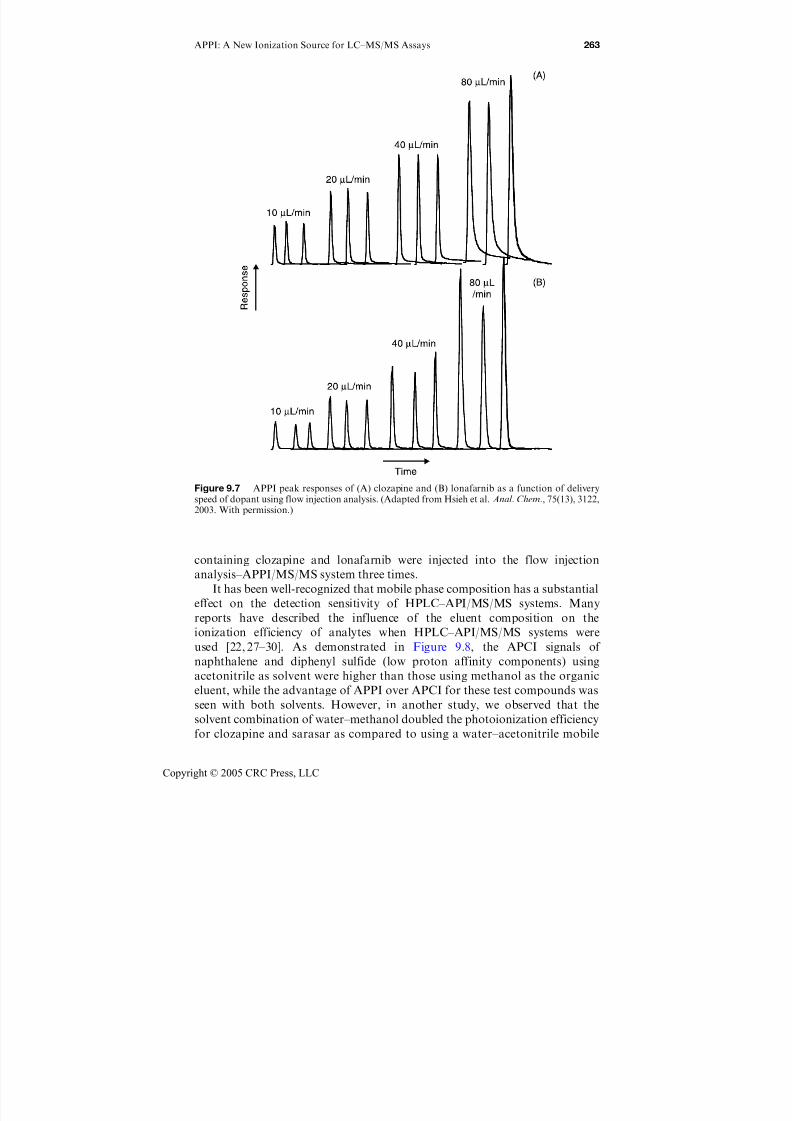
7/21/2019 Using Mass Spectrometry for Drug Metabolism Studies
http://slidepdf.com/reader/full/using-mass-spectrometry-for-drug-metabolism-studies 270/362
containing clozapine and lonafarnib were injected into the flow injection
analysis–APPI/MS/MS system three times.
It has been well-recognized that mobile phase composition has a substantial
effect on the detection sensitivity of HPLC–API/MS/MS systems. Many
reports have described the influence of the eluent composition on the
ionization efficiency of analytes when HPLC–API/MS/MS systems were
used [22, 27–30]. As demonstrated in Figure 9.8, the APCI signals of
naphthalene and diphenyl sulfide (low proton affinity components) using
acetonitrile as solvent were higher than those using methanol as the organic
eluent, while the advantage of APPI over APCI for these test compounds was
seen with both solvents. However, in another study, we observed that the
solvent combination of water–methanol doubled the photoionization efficiency
for clozapine and sarasar as compared to using a water–acetonitrile mobile
Figure 9.7 APPI peak responses of (A) clozapine and (B) lonafarnib as a function of deliveryspeed of dopant using flow injection analysis. (Adapted from Hsieh et al. Anal. Chem., 75(13), 3122,
2003. With permission.)
APPI: A New Ionization Source for LC–MS/MS Assays 263
Copyright © 2005 CRC Press, LLC
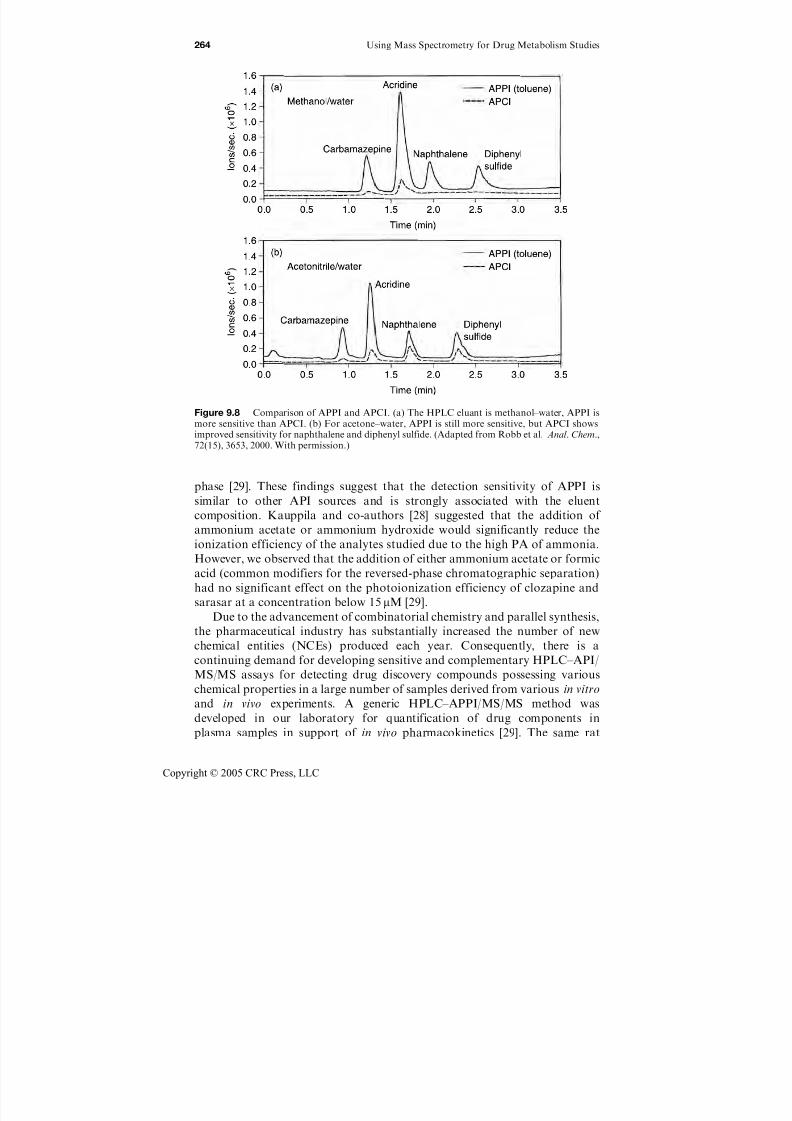
7/21/2019 Using Mass Spectrometry for Drug Metabolism Studies
http://slidepdf.com/reader/full/using-mass-spectrometry-for-drug-metabolism-studies 271/362
phase [29]. These findings suggest that the detection sensitivity of APPI is
similar to other API sources and is strongly associated with the eluent
composition. Kauppila and co-authors [28] suggested that the addition of ammonium acetate or ammonium hydroxide would significantly reduce the
ionization efficiency of the analytes studied due to the high PA of ammonia.
However, we observed that the addition of either ammonium acetate or formic
acid (common modifiers for the reversed-phase chromatographic separation)
had no significant effect on the photoionization efficiency of clozapine and
sarasar at a concentration below 15 mM [29].
Due to the advancement of combinatorial chemistry and parallel synthesis,
the pharmaceutical industry has substantially increased the number of new
chemical entities (NCEs) produced each year. Consequently, there is a
continuing demand for developing sensitive and complementary HPLC–API/
MS/MS assays for detecting drug discovery compounds possessing various
chemical properties in a large number of samples derived from various in vitro
and in vivo experiments. A generic HPLC–APPI/MS/MS method was
developed in our laboratory for quantification of drug components in
plasma samples in support of in vivo pharmacokinetics [29]. The same rat
Figure 9.8 Comparison of APPI and APCI. (a) The HPLC eluant is methanol–water, APPI ismore sensitive than APCI. (b) For acetone–water, APPI is still more sensitive, but APCI showsimproved sensitivity for naphthalene and diphenyl sulfide. (Adapted from Robb et al. Anal. Chem.,72(15), 3653, 2000. With permission.)
264 Using Mass Spectrometry for Drug Metabolism Studies
Copyright © 2005 CRC Press, LLC
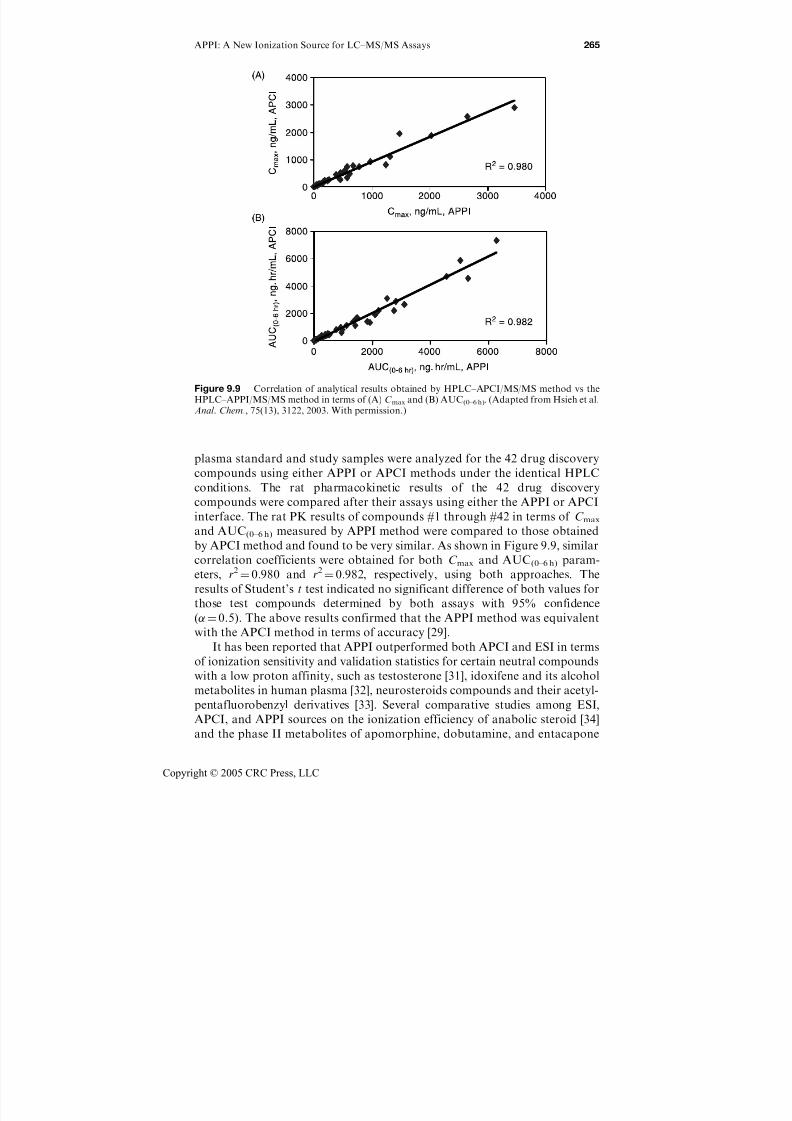
7/21/2019 Using Mass Spectrometry for Drug Metabolism Studies
http://slidepdf.com/reader/full/using-mass-spectrometry-for-drug-metabolism-studies 272/362
plasma standard and study samples were analyzed for the 42 drug discovery
compounds using either APPI or APCI methods under the identical HPLC
conditions. The rat pharmacokinetic results of the 42 drug discovery
compounds were compared after their assays using either the APPI or APCI
interface. The rat PK results of compounds #1 through #42 in terms of C max
and AUC(0–6 h) measured by APPI method were compared to those obtained
by APCI method and found to be very similar. As shown in Figure 9.9, similar
correlation coefficients were obtained for both C max and AUC(0–6 h) param-
eters, r2 ¼ 0.980 and r2 ¼ 0.982, respectively, using both approaches. The
results of Student’s t test indicated no significant difference of both values for
those test compounds determined by both assays with 95% confidence
( ¼ 0.5). The above results confirmed that the APPI method was equivalent
with the APCI method in terms of accuracy [29].
It has been reported that APPI outperformed both APCI and ESI in terms
of ionization sensitivity and validation statistics for certain neutral compounds
with a low proton affinity, such as testosterone [31], idoxifene and its alcohol
metabolites in human plasma [32], neurosteroids compounds and their acetyl-
pentafluorobenzyl derivatives [33]. Several comparative studies among ESI,
APCI, and APPI sources on the ionization efficiency of anabolic steroid [34]
and the phase II metabolites of apomorphine, dobutamine, and entacapone
Figure 9.9 Correlation of analytical results obtained by HPLC–APCI/MS/MS method vs theHPLC–APPI/MS/MS method in terms of (A) C max and (B) AUC(0–6h). (Adapted from Hsieh et al.Anal. Chem., 75(13), 3122, 2003. With permission.)
APPI: A New Ionization Source for LC–MS/MS Assays 265
Copyright © 2005 CRC Press, LLC

7/21/2019 Using Mass Spectrometry for Drug Metabolism Studies
http://slidepdf.com/reader/full/using-mass-spectrometry-for-drug-metabolism-studies 273/362
[35] were also investigated. To date, HPLC–APPI/MS/MS has been success-
fully employed for the determination of vitamins [36], antioxidants [37],
polycyclic aromatic hydrocarbons [38], perfluorooctane sulfonate in river
water [39], patulin in apple juice [40], chloramphenicol residues in fish [41], andvarious pharmaceuticals [42–44].
9.2.2.2 Matrix ionization suppression effect
A general concern about assay reliability of any new HPLC–MS/MS methods
is the ionization suppression caused by the co-eluting endogenous materials in
biological samples [45–49]; this problem is commonly referred to as matrix ion
suppression or simply matrix effects (see Chapter 4 for more information on
this topic). The accuracy and reproducibility of the analytical results is oftenaffected by the varying degree of the matrix effects due to different sample
preparation methods and ionization interfaces. The post-column infusion
technique inserted into HPLC–MS systems is an easy and effective way to
evaluate the matrix ionization suppression issue [50]. In general, ESI is more
vulnerable than APCI to ionization suppression from biological matrices
resulting in inconsistent analytical outcomes. Although the LPPI process
should be independent of the surrounding molecules, thereby less sensitive to
ion suppression effects, this remains to be demonstrated in multiple examples.
The schematic diagram of the post-column infusion system used in ourlaboratory for the matrix effect studies on APPI source is shown in Figure 9.10.
Clozapine and sarasar were continuously infused into Peek tubing in between
the analytical column and the mass spectrometer through a tee using a Harvard
Apparatus Model 2400 (South Natick, MA, USA) syringe pump. Either a
protein precipitation extract of blank rat plasma or mobile phase B (10 mL) was
injected into the HPLC column for comparison of ionization responses.
Effluent from the HPLC column mixed with the infused compounds and
entered the API interface. The infusion HPLC–APPI/MS/MS chromatograms
of clozapine and sarasar after either a 10-mL injection of mobile phase or rat
plasma extract are shown in Figure 9.11. The differences in the infusion
chromatograms between the mobile phase injection and the rat plasma extract
Figure 9.10 Schematic diagram of post-column infusion technique with an atmospheric pressurephotoionization source.
266 Using Mass Spectrometry for Drug Metabolism Studies
Copyright © 2005 CRC Press, LLC

7/21/2019 Using Mass Spectrometry for Drug Metabolism Studies
http://slidepdf.com/reader/full/using-mass-spectrometry-for-drug-metabolism-studies 274/362
injection are considered to be caused by the matrix ion suppression effects due
to plasma sample extract constituents eluting from the column. Figure 9.11
shows that the degree of loss of APPI response and the length of time required
for the APPI response to return to its pre-sample injection sensitivity were
consistent for both clozapine and sarasar in this study. Therefore, the APPI
responses of clozapine and sarasar in the rat plasma protein precipitation
extract were not significantly affected by matrix ion suppression in this assay.
More severe matrix effects at the same chromatographic region were observed
when the dopant was not in use. Increasing the delivery speed of dopant
(40 mL/min vs 20 mL/min) enhanced the APPI signals of the analyte but had
a marginal effect in reducing ionization suppression, as demonstrated in
Figure 9.12. For reliable quantitative determination, it is suggested that the
retention times of all analytes be in the region of little or no matrix ion
suppression as demonstrated in Figure 9.11
9.3 Other HPLC–APPI–MS/MS applications
9.3.1 Zirconia-based HPLC–APPI/MS/MS assay
The zirconia-based packing materials for HPLC columns are capable of
providing excellent physical and chemical stability over a wide range of solvent,
Figure 9.11 (Top) The reconstructed infusion HPLC–APPI/MS/MS ion chromatograms of lonafarnib following mobile phase (solid line) and blank plasma precipitation extract injections(dotted line). The region showing lower responses indicated the area of matrix ionizationsuppression. (Bottom) Representative reconstructed HPLC–APPI/MS/MS chromatogram of
lonafarnib from standard rat plasma. (Adapted from Hsieh et al. Anal. Chem., 75(13), 3122,2003. With permission.)
APPI: A New Ionization Source for LC–MS/MS Assays 267
Copyright © 2005 CRC Press, LLC
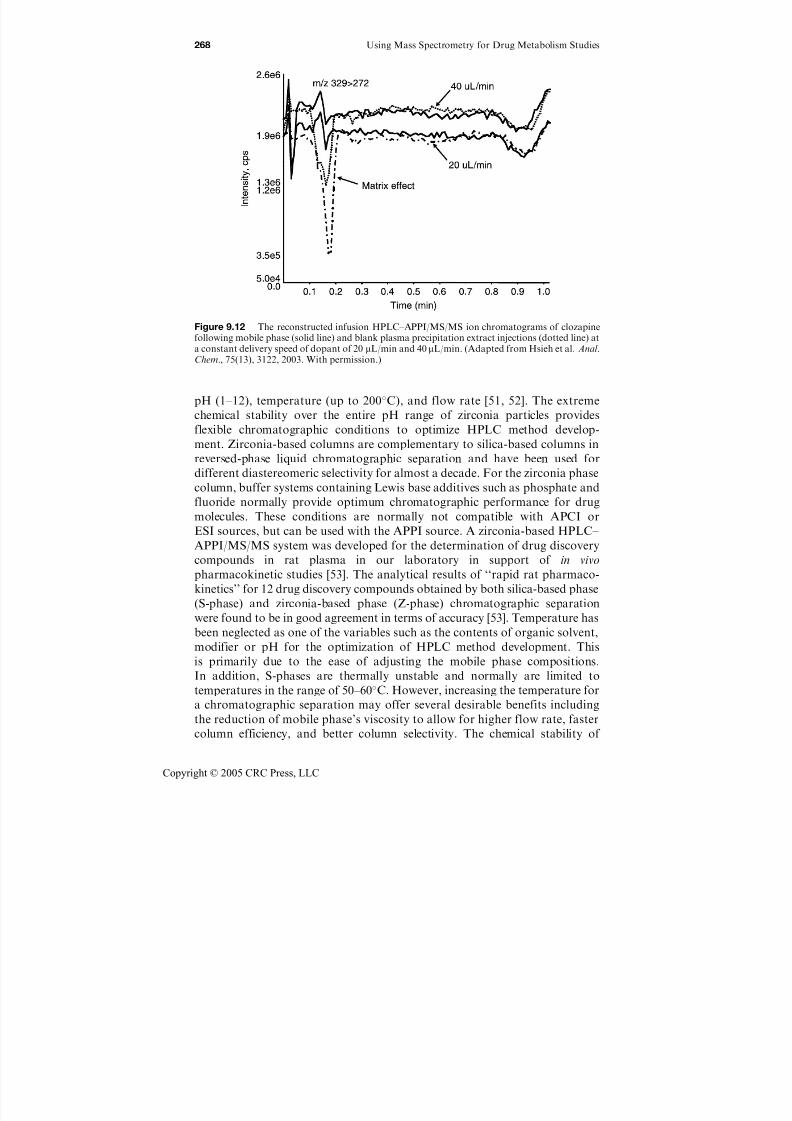
7/21/2019 Using Mass Spectrometry for Drug Metabolism Studies
http://slidepdf.com/reader/full/using-mass-spectrometry-for-drug-metabolism-studies 275/362
pH (1–12), temperature (up to 200C), and flow rate [51, 52]. The extreme
chemical stability over the entire pH range of zirconia particles provides
flexible chromatographic conditions to optimize HPLC method develop-
ment. Zirconia-based columns are complementary to silica-based columns in
reversed-phase liquid chromatographic separation and have been used for
different diastereomeric selectivity for almost a decade. For the zirconia phase
column, buffer systems containing Lewis base additives such as phosphate and
fluoride normally provide optimum chromatographic performance for drug
molecules. These conditions are normally not compatible with APCI or
ESI sources, but can be used with the APPI source. A zirconia-based HPLC–
APPI/MS/MS system was developed for the determination of drug discovery
compounds in rat plasma in our laboratory in support of in vivo
pharmacokinetic studies [53]. The analytical results of ‘‘rapid rat pharmaco-
kinetics’’ for 12 drug discovery compounds obtained by both silica-based phase
(S-phase) and zirconia-based phase (Z-phase) chromatographic separation
were found to be in good agreement in terms of accuracy [53]. Temperature has
been neglected as one of the variables such as the contents of organic solvent,
modifier or pH for the optimization of HPLC method development. This
is primarily due to the ease of adjusting the mobile phase compositions.
In addition, S-phases are thermally unstable and normally are limited to
temperatures in the range of 50–60C. However, increasing the temperature for
a chromatographic separation may offer several desirable benefits including
the reduction of mobile phase’s viscosity to allow for higher flow rate, faster
column efficiency, and better column selectivity. The chemical stability of
Figure 9.12 The reconstructed infusion HPLC–APPI/MS/MS ion chromatograms of clozapinefollowing mobile phase (solid line) and blank plasma precipitation extract injections (dotted line) ata constant delivery speed of dopant of 20 mL/min and 40mL/min. (Adapted from Hsieh et al. Anal.Chem., 75(13), 3122, 2003. With permission.)
268 Using Mass Spectrometry for Drug Metabolism Studies
Copyright © 2005 CRC Press, LLC
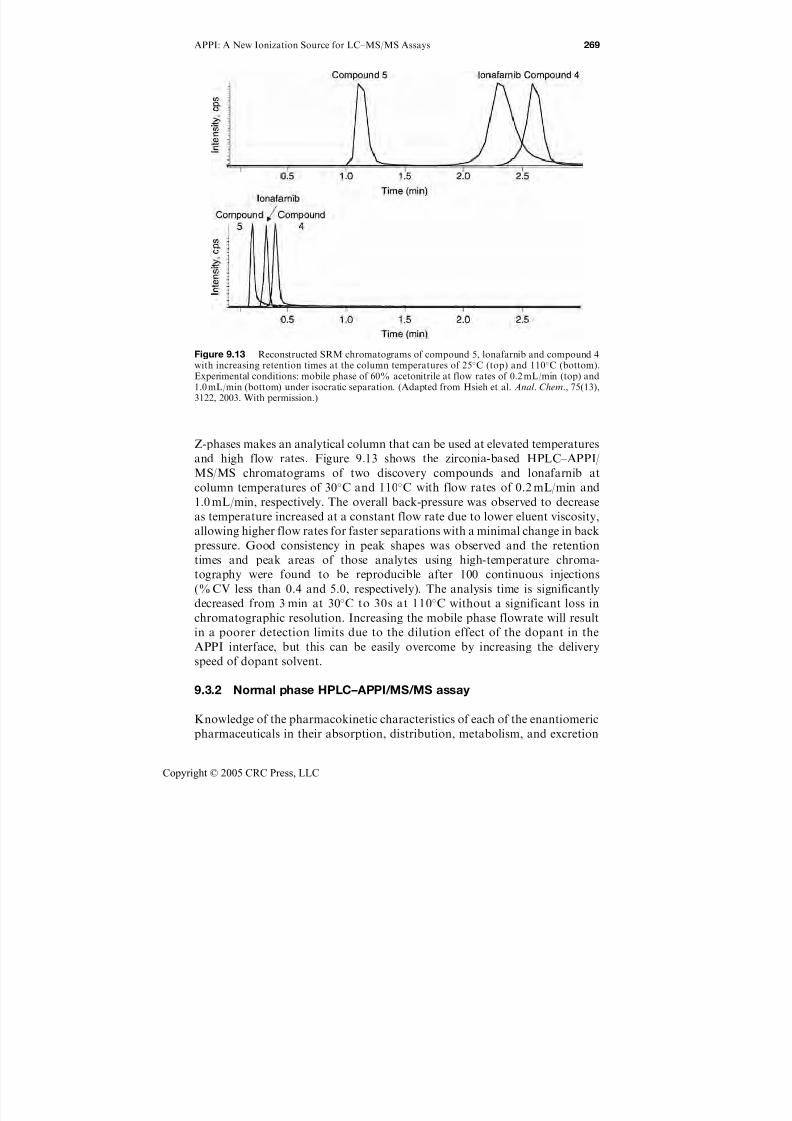
7/21/2019 Using Mass Spectrometry for Drug Metabolism Studies
http://slidepdf.com/reader/full/using-mass-spectrometry-for-drug-metabolism-studies 276/362
Z-phases makes an analytical column that can be used at elevated temperatures
and high flow rates. Figure 9.13 shows the zirconia-based HPLC–APPI/
MS/MS chromatograms of two discovery compounds and lonafarnib at
column temperatures of 30C and 110C with flow rates of 0.2 mL/min and
1.0 mL/min, respectively. The overall back-pressure was observed to decrease
as temperature increased at a constant flow rate due to lower eluent viscosity,
allowing higher flow rates for faster separations with a minimal change in back
pressure. Good consistency in peak shapes was observed and the retention
times and peak areas of those analytes using high-temperature chroma-
tography were found to be reproducible after 100 continuous injections
(% CV less than 0.4 and 5.0, respectively). The analysis time is significantly
decreased from 3 min at 30C to 30s at 110C without a significant loss in
chromatographic resolution. Increasing the mobile phase flowrate will result
in a poorer detection limits due to the dilution effect of the dopant in the
APPI interface, but this can be easily overcome by increasing the delivery
speed of dopant solvent.
9.3.2 Normal phase HPLC–APPI/MS/MS assay
Knowledge of the pharmacokinetic characteristics of each of the enantiomeric
pharmaceuticals in their absorption, distribution, metabolism, and excretion
Figure 9.13 Reconstructed SRM chromatograms of compound 5, lonafarnib and compound 4with increasing retention times at the column temperatures of 25C (top) and 110C (bottom).Experimental conditions: mobile phase of 60% acetonitrile at flow rates of 0.2 mL/min (top) and
1.0 mL/min (bottom) under isocratic separation. (Adapted from Hsieh et al. Anal. Chem., 75(13),3122, 2003. With permission.)
APPI: A New Ionization Source for LC–MS/MS Assays 269
Copyright © 2005 CRC Press, LLC

7/21/2019 Using Mass Spectrometry for Drug Metabolism Studies
http://slidepdf.com/reader/full/using-mass-spectrometry-for-drug-metabolism-studies 277/362
(ADME) is essential for drug development. It is also important to understand
the biological responses of new chemical entities with respect to stereo-
chemistry as part of lead characterization. To evaluate the pharmacokinetics
of a single enantiomeror mixture of enantiomers, manufacturers are requestedby the FDA to develop quantitative assays for individual enantiomers in
in vivo samples early in drug development. Therefore, chiral chromato-
graphic separation is important in developing HPLC–API/MS/MS meth-
ods for enantiomers, as they are generally not distinguishable by mass
spectrometry.
Normally, it is challenging when using methodology based on conventional
reversed-phase chromatography to separate enantiomers and regioisomers.
Based on our experience, normal-phase chromatography using chiral station-
ary columns provides better performance in the resolution of enantiomersand regioisomers than reversed-phase chromatography. However, the direct
introduction of hexane (a common solvent for normal-phase chromatography)
into an APCI source may pose safety concerns [54]. In addition, the post-
column addition of ammonium acetate buffer in ethanol–water (to allow for
the detection of ammonium adducts) was frequently needed for chiral normal-
phase chromatographic separation because of the incompatibility of electro-
spray with n-hexane [55]. The APPI source is compatible with normal-phase
chromatographic conditions and should therefore be the ideal candidate for
normal-phase chiral HPLC–MS/MS systems needed for the enantiometricdetermination of some drugs. The potential of using APPI as an interface
for chiral HPLC–MS/MS is shown in Figure 9.14, which shows the chiral
HPLC–APPI/MS/MS chromatograms under isocratic separation with a
hexane–ethanol (80:20) mobile phase and a Chiralcel OD-H column contain-
ing cellulose tris(3,5 dimethylphenyl carbamate) as a chiral selector for the
determination of propanolol mixtures. The chiral HPLC system based on
Figure 9.14 The reconstructed HPLC–APPI/MS/MS chromatogram of standard (R)- and(S )-propranolol hydrochloride isomers. Conditions: Chiralcel OD-H column, mobile phase of hexane:ethanol (80:20, v/v), flow rate 0.7 mL/min, room temperature.
270 Using Mass Spectrometry for Drug Metabolism Studies
Copyright © 2005 CRC Press, LLC
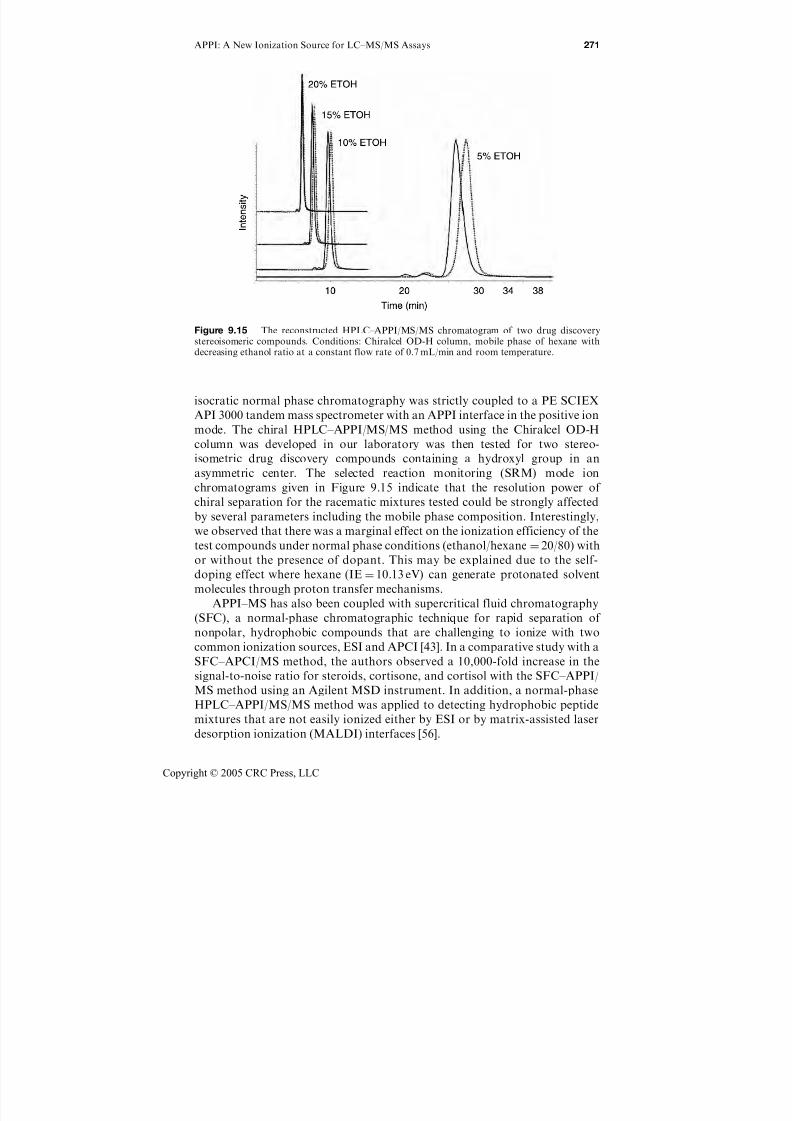
7/21/2019 Using Mass Spectrometry for Drug Metabolism Studies
http://slidepdf.com/reader/full/using-mass-spectrometry-for-drug-metabolism-studies 278/362
isocratic normal phase chromatography was strictly coupled to a PE SCIEX
API 3000 tandem mass spectrometer with an APPI interface in the positive ion
mode. The chiral HPLC–APPI/MS/MS method using the Chiralcel OD-H
column was developed in our laboratory was then tested for two stereo-
isometric drug discovery compounds containing a hydroxyl group in an
asymmetric center. The selected reaction monitoring (SRM) mode ion
chromatograms given in Figure 9.15 indicate that the resolution power of
chiral separation for the racematic mixtures tested could be strongly affected
by several parameters including the mobile phase composition. Interestingly,
we observed that there was a marginal effect on the ionization efficiency of the
test compounds under normal phase conditions (ethanol/hexane ¼ 20/80) with
or without the presence of dopant. This may be explained due to the self-
doping effect where hexane (IE ¼ 10.13 eV) can generate protonated solvent
molecules through proton transfer mechanisms.
APPI–MS has also been coupled with supercritical fluid chromatography
(SFC), a normal-phase chromatographic technique for rapid separation of
nonpolar, hydrophobic compounds that are challenging to ionize with two
common ionization sources, ESI and APCI [43]. In a comparative study with a
SFC–APCI/MS method, the authors observed a 10,000-fold increase in the
signal-to-noise ratio for steroids, cortisone, and cortisol with the SFC–APPI/
MS method using an Agilent MSD instrument. In addition, a normal-phase
HPLC–APPI/MS/MS method was applied to detecting hydrophobic peptide
mixtures that are not easily ionized either by ESI or by matrix-assisted laser
desorption ionization (MALDI) interfaces [56].
Figure 9.15 The reconstructed HPLC–APPI/MS/MS chromatogram of two drug discoverystereoisomeric compounds. Conditions: Chiralcel OD-H column, mobile phase of hexane withdecreasing ethanol ratio at a constant flow rate of 0.7 mL/min and room temperature.
APPI: A New Ionization Source for LC–MS/MS Assays 271
Copyright © 2005 CRC Press, LLC
7/21/2019 Using Mass Spectrometry for Drug Metabolism Studies
http://slidepdf.com/reader/full/using-mass-spectrometry-for-drug-metabolism-studies 279/362
9.4 Conclusions and Future Perspectives
By the combination of liquid-based chromatographic separations with atmo-
spheric pressure ionization techniques coupled to a tandem mass spectrometerit is possible to analyze several hundreds of compounds within a single day.
HPLC–API/MS/MS technology offers straightforward method development
for the characterization of drug compounds in biological samples and
undoubtedly will continue to be important for the analysis of pharmaceuticals.
APPI, a complementary ionization technique for LC–MS, may outperform
other ionization modes such as ESI and APCI for bioanalysis of less polar,
more hydrophobic components which are difficult to ionize with either APCI
or ESI [27]. The use of an appropriate dopant substantially offers a means of
enhancing the photoionization efficiency for reversed-phase HPLC–MS butprovides a marginal effect on the sensitivity under normal phase conditions.
The APPI sensitivity is dependent on ion–molecule reactions in the gas phase
that are largely governed by the proton affinity of the analytes. The major
processes leading to ionization in APPI are proton transfer and charge
exchange in the positive ion mode. The APPI technique is in its infancy and
there is still much interesting science left to do in terms of understanding how
to utilize it in the best way. It is believed that a better understanding of the
fundamental processes of APPI will continue to improve its performance. In
addition, future instruments will be equipped with combined ionizationsources, including at least two of the following: ESI, APCI, and APPI. Finally,
miniaturation of ionization devices will be seen as well as smaller
chromatography systems and mass spectrometers.
References
1. Oka, H. et al. Mass spectrometric analysis of tetracycline antibiotics in foods,J. Chromatogr. A, 812(1–2), 309, 1998.
2. Maurer, H.H., Liquid chromatography–mass spectrometry in forensic and clinical
toxicology, J. Chromatogr. B, Biomed. Sci. Appl., 713(1), 3, 1998.
3. Pico, Y. et al. Pesticide residue determination in fruit and vegetables by liquid
chromatography–mass spectrometry, J. Chromatogr. A, 882(1–2), 153, 2000.
4. Willoughby, R., Sheehan, E., and Mitrovich, S., A Global View of LC/MS . Global
View Publishing, Phildelphia, PA, 2002.
5. Niessen, W.M., Advances in instrumentation in liquid chromatography–mass
spectrometry and related liquid-introduction techniques, J. Chromatogr. A,
794(1–2), 407, 1998.6. Niessen, W.M., Progress in liquid chromatography–mass spectrometry instrumenta-
tion and its impact on high-throughput screening, J. Chromatogr. A, 1000(1–2), 413,
2003.
7. Hayen, H. and Karst, U., Strategies for the liquid chromatographic–mass spec-
trometric analysis of non-polar compounds, J. Chromatogr. A, 1000(1–2), 549, 2003.
8. Gelpi, E., Interfaces for coupled liquid-phase separation/mass spectrometry
techniques. An update on recent developments, J. Mass Spectrom., 37(3), 241, 2002.
272 Using Mass Spectrometry for Drug Metabolism Studies
Copyright © 2005 CRC Press, LLC
7/21/2019 Using Mass Spectrometry for Drug Metabolism Studies
http://slidepdf.com/reader/full/using-mass-spectrometry-for-drug-metabolism-studies 280/362
9. Blakley, C.R., McAdams, M.J., and Vestal, M.L., Crossed-beam liquid chromato-
graph–mass spectrometer combination, J. Chromatogr., 158, 261, 1978.
10. Yamane, M., Simultaneous quantitative determination method for ceramide species
from crude cellular extracts by high-performance liquid chromatography–thermo-
spray mass spectrometry, J. Chromatogr. B, Anal. Technol. Biomed. Life Sci.,
783(1), 181, 2003.
11. Eriksson, B. et al. Metabolic fate of delmopinol in man after mouth rinsing and
after oral administration, Xenobiotica, 30(2), 179, 2000.
12. Byrd, G.D. et al. Determination of nicotine N -1-glucuronide, a quaternary
N -glucuronide conjugate, in human biological samples, Drug Metabol. Drug
Interact., 16(4), 281, 2000.
13. Pawlosky, R.J., Flanagan, V.P., and Novotny, J.A., A sensitive procedure for the
study of beta-carotene-d8 metabolism in humans using high performance liquid
chromatography–mass spectrometry, J. Lipid Res., 41(6), 1027, 2000.14. Wolff, J.C. et al. The use of particle beam mass spectrometry for the measurement
of impurities in a nabumetone drug substance, not easily amenable to atmospheric
pressure ionisation techniques, Rapid Commun. Mass Spectrom., 15(4), 265, 2001.
15. Heimark, L. et al. Mechanism of azole antifungal activity as determined by liquid
chromatographic/mass spectrometric monitoring of ergosterol biosynthesis, J. Mass
Spectrom., 37(3), 265, 2002.
16. Yang, Y. et al. Analysis of bile acids and bile alcohols in urine by capillary column
liquid chromatography–mass spectrometry using fast atom bombardment or
electrospray ionization and collision-induced dissociation, Biomed. Chromatogr.,
11(4), 240, 1997.17. Itagaki, Y. et al. Detection of new spider toxins from a Nephilengys borbonica
venom gland using on-line mu-column HPLC continuous flow (FRIT) FAB LC/
MS and MS/MS, Nat. Toxins, 5(1), 1, 1997.
18. Huang, E.C. et al. Atmospheric pressure ionization mass spectrometry, Anal.
Chem., 62, 713A, 1990.
19. Cox, K.A., White, R.E., and Korfmacher, W.A., Rapid determination of
pharmacokinetic properties of new chemical entities: in vivo approaches, Comb.
Chem. High Throughput Screen., 5(1), 29, 2002.
20. Hirabayashi, A., Sakairi, M., and Koizumi, H., Sonic spray ionization methodfor atmospheric pressure ionization mass spectrometry, Anal. Chem., 66, 4557,
1994.
21. Hirabayashi, A., Sakairi, M., and Koizumi, H., Sonic spray mass spectrometry,
Anal. Chem., 67(17), 2878, 1995.
22. Dams, R. et al. Influence of the eluent composition on the ionization efficiency
for morphine of pneumatically assisted electrospray, atmospheric-pressure
chemical ionization and sonic spray, Rapid Commun. Mass Spectrom., 16(11),
1072, 2002.
23. Robb, D.B., Covey, T.R., and Bruins, A.P., Atmospheric pressure photoionization:
an ionization method for liquid chromatography–mass spectrometry, Anal. Chem.,72(15), 3653, 2000.
24. de Wit, J.S.M. and Jorgenson, J.W., Photoionization detector for open-tubular
liquid chromatography, J. Chromatogr. A, 411, 201, 1987.
25. Evans, M.D. and Hanold, K.A., Photoionization mass spectrometry, Am.
Laboratory, 32, 24, 2000.
26. Syage, J.A. and Evans, M.D., Photoionization mass spectrometry, Spectroscopy,
16, 14, 2001.
APPI: A New Ionization Source for LC–MS/MS Assays 273
Copyright © 2005 CRC Press, LLC
7/21/2019 Using Mass Spectrometry for Drug Metabolism Studies
http://slidepdf.com/reader/full/using-mass-spectrometry-for-drug-metabolism-studies 281/362
27. Raffaelli, A. and Saba, A., Atmospheric pressure photoionization mass spectro-
metry, Mass Spectrom. Rev., 22(5), 318, 2003.
28. Kauppila, T.J. et al. Atmospheric pressure photoionization mass spectrometry.
Ionization mechanism and the effect of solvent on the ionization of naphthalenes,
Anal. Chem., 74(21), 5470, 2002.
29. Hsieh, Y. et al. High-performance liquid chromatography–atmospheric pressure
photoionization/tandem mass spectrometric analysis for small molecules in plasma,
Anal. Chem., 75(13), 3122, 2003.
30. Rauha, J.P., Vuorela, H., and Kostiainen, R., Effect of eluent on the ionization
efficiency of flavonoids by ion spray, atmospheric pressure chemical ionization, and
atmospheric pressure photoionization mass spectrometry, J. Mass Spectrom.,
36(12), 1269, 2001.
31. Alary, J.F., Comparative study: LC–MS/MS analysis of four steroid compounds
using a new photoionization source and a conventional APCI source. In 49thASMS Conference on Mass Spectrometrty and Allied Topics, Chicago, IL, 2001.
ASMS.
32. Yang, C. and Henion, J., Atmospheric pressure photoionization liquid chromato-
graphic–mass spectrometric determination of idoxifene and its metabolites in
human plasma, J. Chromatogr. A, 970(1–2), 155, 2002.
33. Alary, J.F. et al. Comparative LC–MS/MS analysis of four neurosteroid
compoundsand their acetyl-pentafluorobenzyl derivatives using a photoionization
ion source and a conventional atmospheric-pressure chemical ionization source.
In 50th ASMS Conference on Mass Spectrometry and Allied Topics , Orlando, FL,
2002. ASMS.34. Leinonen, A., Kuuranne, T., and Kostiainen, R., Liquid chromatography/mass
spectrometry in anabolic steroid analysis—optimization and comparison of three
ionization techniques: electrospray ionization, atmospheric pressure chemical
ionization and atmospheric pressure photoionization, J. Mass Spectrom., 37(7),
693, 2002.
35. Keski-Hynnila, H. et al. Comparison of electrospray, atmospheric pressure
chemical ionization, and atmospheric pressure photoionization in the identification
of apomorphine, dobutamine, and entacapone phase II metabolites in biological
samples, Anal. Chem., 74(14), 3449, 2002.36. Miller, C.A., Cormia, P.H., and Fischer, S.M., Atmospheric pressure photoioniza-
tion ion trap analysis of fat-soluble vitamins. In 49th ASMS Conference on Mass
Spectrometry and Allied Topics, Chicago, IL, 2001. ASMS.
37. Lytle, C.A., van Berkel, G.J., and White, D.C., Comparison of atmospheric
pressure photoionization and atmospheric pressure chemical ionization for the
analysis of ubiquinones and menaquinones. In 49th ASMS Conference on Mass
Spectrometry and Allied Topics, Chicago, IL, 2001. ASMS.
38. Impey, G., Kieser, B., and Alary, J.F., The analysis of polycyclic aromatic
hydrocarbons (PAHs) by LC/MS/MS using a new atmospheric pressure photo-
ionization source. In 49th ASMS Conference on Mass Spectrometry and Allied Topics, Chicago, IL, 2001. ASMS.
39. Takino, M., Daishima, S., and Nakahara, T., Determination of perfluorooctane
sulfonate in river water by liquid chromatography/atmospheric pressure
photoionization mass spectrometry by automated on-line extraction using
turbulent flow chromatography, Rapid Commun. Mass Spectrom., 17(5), 383,
2003.
274 Using Mass Spectrometry for Drug Metabolism Studies
Copyright © 2005 CRC Press, LLC
7/21/2019 Using Mass Spectrometry for Drug Metabolism Studies
http://slidepdf.com/reader/full/using-mass-spectrometry-for-drug-metabolism-studies 282/362
40. Takino, M., Daishima, S., and Nakahara, T., Liquid chromatography/mass
spectrometric determination of patulin in apple juice using atmospheric pressure
photoionization, Rapid Commun. Mass Spectrom., 17(17), 1965, 2003.
41. Takino, M., Daishima, S., and Nakahara, T., Determination of chloramphenicol
residues in fish meats by liquid chromatography–atmospheric pressure photo-
ionization mass spectrometry, J. Chromatogr. A, 1011(1–2), 67, 2003.
42. Helias, N. and Cepa, S., Charaterization and optimization of an atmospheric
pressure photoionization (APPI) interface for routine use in drug discovery and
development. In 51st ASMS Conference on Mass Spectrometry and Allied Topics,
Montreal, Canada, 2003. ASMS.
43. Quenzer, T.L. et al. Atmospheric pressure photoionization mass spectrometry: high
throughput applications. In 51st ASMS Conference on Mass Spectrometry and
Allied Topics, Montreal, Canada, 2003. ASMS.
44. McKenzie, D.E. and McDermott, L.L., LC–MS investigation of atmosphericpressure photoionization versus electrospray ionization and atmospheric pressure
chemical ionization using eleven test compounds. In 51st ASMS Conference on
Mass Spectrometry and Allied Topics, Montreal, Canada, 2003. ASMS.
45. Mei, H. et al. Investigation of matrix effects in bioanalytical high-performance
liquid chromatography/tandem mass spectrometric assays: application to drug
discovery, Rapid Commun. Mass Spectrom., 17(1), 97, 2003.
46. Matuszewski, B.K., Constanzer, M.L., and Chavez-Eng, C.M., Matrix effect in
quantitative LC/MS/MS analyses of biological fluids: a method for determination
of finasteride in human plasma at picogram per milliliter concentrations, Anal.
Chem., 70(5), 882, 1998.47. Hsieh, Y. et al. Quantitative screening and matrix effect studies of drug
discovery compounds in monkey plasma using fast-gradient liquid chromatog-
raphy/tandem mass spectrometry, Rapid Commun. Mass Spectrom., 15(24), 2481,
2001.
48. Hsieh, Y. et al. Simultaneous fast HPLC–MS/MS analysis of drug candidates and
hydroxyl metabolites in plasma, J. Pharm. Biomed. Anal., 33(2), 251, 2003.
49. Hsieh, Y. et al. Simultaneous determination of a drug candidate and its metabolite
in rat plasma samples using ultrafast monolithic column high-performance liquid
chromatography/tandem mass spectrometry, Rapid Commun. Mass Spectrom.,16(10), 944, 2002.
50. King, R. et al. Mechanistic investigation of ionization suppression in electrospray
ionization, J. Am. Soc. Mass Spectrom., 11(11), 942, 2000.
51. Dunlap, C.J. et al. Zirconia stationary phases for extreme separations, Anal. Chem.,
73(21), 598A, 2001.
52. Thompson, J.D. and Carr, P.W., High-speed liquid chromatography by simulta-
neous optimization of temperature and eluent composition, Anal. Chem., 74(16),
4150, 2002.
53. Hsieh, Y., Merkle, K., and Wang, G., Zirconia-based column high performance
liquid chromatography/atmospheric pressure photoionization tandem mass spec-trometric analyses of drug molecules in rat plasma, Rapid Commun. Mass
Spectrom., 17, 1775, 2003.
54. Ceccato, A. et al. Enantiomeric determination of tramadol and its main
metabolite O-desmethyltramadol in human plasma by liquid chromatography–
tandem mass spectrometry, J. Chromatogr. B, Biomed. Sci. Appl., 748(1), 65,
2000.
APPI: A New Ionization Source for LC–MS/MS Assays 275
Copyright © 2005 CRC Press, LLC
7/21/2019 Using Mass Spectrometry for Drug Metabolism Studies
http://slidepdf.com/reader/full/using-mass-spectrometry-for-drug-metabolism-studies 283/362
55. Zavitsanos, A.P. and Alebic-Kolbah, T., Enantioselective determination of
terazosin in human plasma by normal phase high-performance liquid
chromatography–electrospray mass spectrometry, J. Chromatogr. A, 794(1–2),
45, 1998.
56. Delobel, A. et al. Characterization of hydrophobic peptides by photoionization–
mass spectrometry and tandem mass spectrometry. In 51st ASMS Conference on
Mass Spectrometry and Allied Topics, Montreal, Canada, 2003. ASMS.
276 Using Mass Spectrometry for Drug Metabolism Studies
Copyright © 2005 CRC Press, LLC
7/21/2019 Using Mass Spectrometry for Drug Metabolism Studies
http://slidepdf.com/reader/full/using-mass-spectrometry-for-drug-metabolism-studies 284/362
Chapter 10
Q Trap MS: A New Tool for MetaboliteIdentification
Ge ´ rard Hopfgartner and Manfred Zell
10.1 Introduction
Liquid chromatography coupled with tandem mass spectrometry (LC–MS/
MS) has emerged as a sensitive, rapid, robust, and highly automated technique
for the quantification1 and characterization2 of pharmaceutical compounds
and their metabolites. The screening and identification of drug metabolites in
biological matrices is an important aspect in the discovery phase and in earlydrug development in order to elucidate the biotransformation products of a
drug after it is dosed into laboratory animals. This knowledge helps to avoid
the development of a drug where its metabolites may exert adverse toxi-
cological effects or exhibit unwanted pharmacodynamic or pharmacokinetic
properties.
Metabolism is generally classified as an oxidative, reductive or hydrolytic
process (phase I) and also has a conjugation phase involving glucuronidation,
sulfatation, and glutathione formation (phase II). Preliminary metabolism
information can be obtained in vitro by incubation of microsomes or
hepatocytes or in an isolated perfused liver experiment. However, incubations
are static systems and the in vitro findings need to be confirmed by in vivo
studies. The key task is to find and identify metabolites in complex biological
matrices using nonradiolabeled drugs. LC–MS/MS is the most widely used
0-8493-1963-3/05/$0.00+$1.50 2005 by CRC Press 277
Copyright © 2005 CRC Press, LLC

7/21/2019 Using Mass Spectrometry for Drug Metabolism Studies
http://slidepdf.com/reader/full/using-mass-spectrometry-for-drug-metabolism-studies 285/362
technique for drug metabolite identification providing molecular weight and
structural information mediated by collision induced dissociation experiments.
Another important aspect is sample throughput. In vitro samples can be
generated very rapidly and large numbers of samples have to be analyzed in ashort time. Ideally, the metabolic findings should be generated in such a way
that they might have some impact on the chemical synthesis program for
optimizing the biological properties of a drug.
Metabolite screening and identification in the drug discovery phase and
the early phase of drug development requires mass spectrometric detection
with the following features: high sensitivity, high selectivity, MS/MS and
MSn capabilities, and accurate mass measurements (for more on metabolite
identification, see Chapter 8). Currently, there is no single mass spectrom-
eter that provides all these capabilities. Therefore, it is essential to usecomplementary analytical systems. Commonly used mass analyzers are triple
quadrupole (QqQ), ion trap (IT), and hybrid quadrupole time-of-flight
(QqTOF) mass spectrometers.3
Conventional ion trap mass spectrometers operate with a three-dimensional
quadrupole field. High sensitivity can be obtained in full scan mode due to the
ability of ion accumulation before mass analysis. Due to the small volume, 3-D
ion traps have a limited capacity for ion storage. Overfilling of the ion storage
device results in a deterioration of the mass spectrum and the dynamic response
range. The number of ions introduced in the trap can be controlled in differentways to avoid space charging. In a linear 2-D trap, there is no quadrupole field
along the z-axis. In contrast to the 3-D trap where ions are focused in a small
spherical volume (<2 mL), ions in a 2-D trap are focused in a cylindrical volume
alongside the center line (z-axis) of the quadrupole which allows the system to
store more ions before observing space charge.
Linear ion traps have been successfully coupled to time-of-flight mass
spectrometer (LIT-TOF-MS) systems4 and Fourier transform ion cyclotron
(FTICR) mass spectrometer systems.5 The intention of such hybrid instru-
ments is to combine both ion accumulation and MSn features with the superior
mass analysis (accuracy and resolution) and high sensitivity of TOF-MS or
FTICR–MS. The ions stored in the trap are axially ejected to the mass analyzer
in a non-mass dependent fashion.
Very recently linear ion traps have emerged as a mass analyzer either as
a hybrid device combined with a triple quadrupole (QqLIT) mass analyzer6
(Figure 10.1) or as a standalone single quadrupole ion trap (LIT)7 (Figure 10.2).
Mass analysis with the standalone LIT is performed by ejecting the ions
radially through slits of the rods using the mass instability mode. The QqLIT
operates Q3 either as a conventional RF/DC quadrupole mass filter or a linear
ion trap with axial mass ejection. The LIT differs from the classical 3-D ion
trap (IT) by having enhanced sensitivity, resolution and dynamic range;
the QqLIT combines these features with the additional ability to perform
completely new scan combinations while still providing the classical features
of both types of mass analyzers (i.e., a triple quadrupole MS and an ion
trap MS system). This chapter will exclusively focus on the application of
278 Using Mass Spectrometry for Drug Metabolism Studies
Copyright © 2005 CRC Press, LLC

7/21/2019 Using Mass Spectrometry for Drug Metabolism Studies
http://slidepdf.com/reader/full/using-mass-spectrometry-for-drug-metabolism-studies 286/362
Figure 10.1 Schematic of the Q trap.
Figure 10.2 Schematic of the Finnigan LIT. (Source: Schwartz, J.C., J. Am. Soc. MassSpectrom., 13, 659, 2002. With permission.)
Q Trap MS: a New Tool for Metabolite Identification 279
Copyright © 2005 CRC Press, LLC
7/21/2019 Using Mass Spectrometry for Drug Metabolism Studies
http://slidepdf.com/reader/full/using-mass-spectrometry-for-drug-metabolism-studies 287/362
the QqLIT. Its use for drug metabolism will be demonstrated based on
published literature and studies with two pharmaceutical compounds,
tolcapone and compound A. The metabolism of tolcapone has been extensively
investigated using classical LC–MS approaches while compound A is adiscovery compound were the QqLIT was used to support clinical candidate
selection.
10.2 Review of Recent Literature
The QqLIT is based either on an API 2000 or an API 4000 triple quadrupole
platform (Q TRAP, AB/MDS Sciex) (Figure 10.1). All specific scan functions
of the triple quadrupole such as constant neutral loss (CNL), precursor ionscan (PC) or selected reaction monitoring (SRM) mode are maintained along
with the trap scan modes (Figure 10.1). In the Q3 trap mode (enhanced single
MS or EMS) the ions generated at atmospheric pressure are pulsed out from
q0, pass through Q1 and the pressurized q2 quadrupole, and are trapped in Q3
by the RF voltage in the radial direction and by the DC biased aperture plates.
In Q3 the trapped ions are cooled, typically in 10–30 ms. The energy in q2 is set
in such a way that no fragmentation occurs during the passage of the ions.
Trap fill times are in the range of 1 to 500 ms. Fringe fields caused by the lenses
at the end of the quadrupole, which are considered as detrimental in the LIT,are exploited to eject mass-selectively the trapped ions in an axial fashion.
Therefore, the same mass spectrometer can be used in the QqQ or QqLIT
mode or can be switched from one mode to the other in milliseconds (ms). The
QqLIT is calibrated for three scan rates: 250, 1000, and 4000 Th/s (where Th
is Thompson) and the mass resolution is dependent on the scan speed. Typical
mass resolution values are: 0.1–0.2 Th (FWHM) at 250 Th/s, 0.3–0.5 Th at
1000 Th/s and 0.5–0.7 Th at 4000 Th/s. The mass range is 50–1700 Th and
80–2800 Th for the Q Trap 2000 and the Q Trap 4000, respectively. The Q Trap
2000 and the Q Trap 4000 have completely different ion source designs and the
second one is able to sample much more ions. The major difference between the
two instruments is the better sensitivity for the Q Trap 4000 compared for the
Q Trap 2000 in SRM, PC, and CNL scan modes. For the Q Trap 4000 no
significant difference in signal-to-noise ratio (S/N) is observed between the
standard Q3 mode and the EMS mode except the faster scan and the enhanced
resolution.
The big difference between the QqLIT and a standalone IT device is the
MS/MS mode. With the QqLIT, MS/MS (enhanced product ion or EPI) is
performed as follows: (1) isolation of the precursor ion is performed in Q1
utilizing RF/DC at any resolution; (2) collision-induced dissociation (CID)
occurs in the collision cell (q2) that is filled with nitrogen; and (3) fragment
ions are trapped in Q3. RF/DC isolation8 has a significant advantage over
an isolation waveform (used in the IT) where for isolation of fragile ions,
elimination of the precursor ion can be observed.9 In a quadrupole collision
cell, the ions undergo multiple collisions producing fragment ions. As soon as
280 Using Mass Spectrometry for Drug Metabolism Studies
Copyright © 2005 CRC Press, LLC

7/21/2019 Using Mass Spectrometry for Drug Metabolism Studies
http://slidepdf.com/reader/full/using-mass-spectrometry-for-drug-metabolism-studies 288/362
the fragment ions are formed they become reactivated and can undergo further
fragmentation. On the other hand, fragmentation with an IT occurs solely by
excitation of the precursor ion. In most cases, product ions are too cool to
fragment further, and therefore, require specific excitation, which is done usingthe MS3 and MS4 modes. Typically ITs have a low mass cut-off in MSn mode
which corresponds, as a rule of thumb, to about one third of the mass of the
precursor ion. With the QqLIT the precursor ion is fragmented in the
quadrupole collision cell q2. Therefore a product ion spectrum can be obtained
without the low mass cut-off issue. However, to obtain a full scan mass
spectrum over the complete mass range starting at m/z 50 Th, the trapping
of the fragments ions and sequential mass analyzing has to be performed in
time segments which affects duty cycle. The time limiting factor is the trap
filling time.The QqLIT has also MS3 capability which is performed in the following
manner: (1) the first stage of fragmentation is accomplished by accelerating the
precursor ions chosen by Q1 into the pressurized collision cell, q2; (2) the
resulting fragment ions and residual precursor ions are transmitted into the Q3
linear ion trap quadrupole and are cooled for approximately 10 ms; (3) the next
generation precursor ion is isolated within the linear ion trap by application of
resolving DC near the apex of the stability diagram at q 0.706; (4) the RF
voltage of the linear ion trap is adjusted such that the isolated ions are at a
q-value of 0.238 where they are excited by a single frequency of 85 kHzauxiliary signal and fragmented to produce the MS3 ions. This auxiliary signal
is user controllable up to 200 mVp-p for a duration of up to 200 ms.
Figure 10.3(A) shows the quadrupole product ion spectrum in the trap
mode (EPI) for trocade where many fragment ions are observed down to
m/z 86. Therefore, no low mass cut-off is observed with the QqLIT system as
compared to LIT system. An ion trap like (MS2) spectrum can also be
generated with QqLIT where the collision energy of q2 is set such that no
fragmentation occurs in q2. In this case a low mass cut-off (about 1/3 of the
mass of the precursor ion) would be observed. The fragmentation of trocade
has been investigated and is presented in detail elsewhere.10 Figure 10.3(B to
E) shows the MS, MS2, MS3, and MS4 spectra of trocade, respectively. As
expected, the fragmentation pathway can be elegantly followed, but sensitivity
is lost at each step. The QqLIT does not have MS4 features. Actually, this is
not implicitly necessary because quadrupole CID spectra are very informative.
On the other hand the fragmentation pathway can also be established when
combining quadrupole CID with MS3 spectra. The QqLIT also has two new
unique scan functions, which are the enhanced multi-charged scan (EMC) and
the time delayed fragmentation (TDF).11 EMC allows the removal of singly
charged ions from the LIT; this scan function is mainly designed for
proteomics applications. TDF is particularly interesting for small molecules
because it allows the reduction of sequential fragmentation leading to more
simple spectra.11 It is a three-step process including ion activation, ion
relaxation, and fragment collection. In contrast to classical triple quadrupole
ion activation, in this case, ion activation occurs via q2-to-Q3 acceleration
Q Trap MS: a New Tool for Metabolite Identification 281
Copyright © 2005 CRC Press, LLC
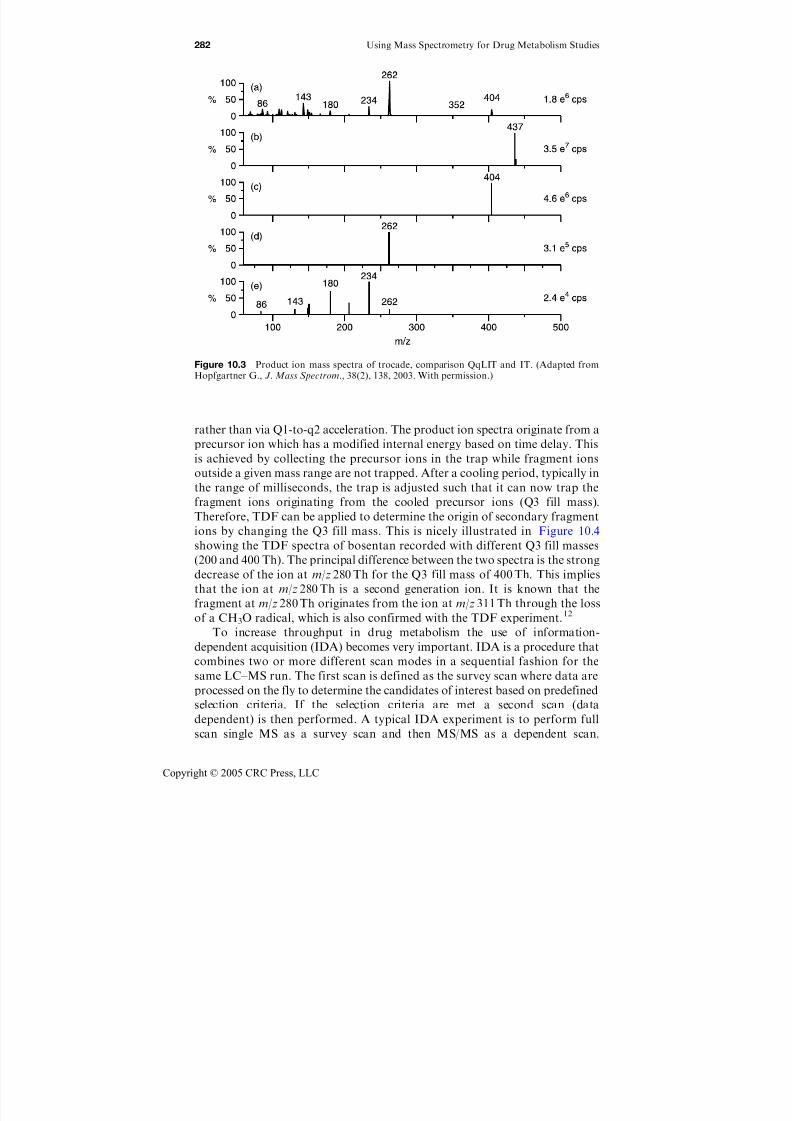
7/21/2019 Using Mass Spectrometry for Drug Metabolism Studies
http://slidepdf.com/reader/full/using-mass-spectrometry-for-drug-metabolism-studies 289/362
rather than via Q1-to-q2 acceleration. The product ion spectra originate from a
precursor ion which has a modified internal energy based on time delay. This
is achieved by collecting the precursor ions in the trap while fragment ions
outside a given mass range are not trapped. After a cooling period, typically in
the range of milliseconds, the trap is adjusted such that it can now trap the
fragment ions originating from the cooled precursor ions (Q3 fill mass).
Therefore, TDF can be applied to determine the origin of secondary fragment
ions by changing the Q3 fill mass. This is nicely illustrated in Figure 10.4
showing the TDF spectra of bosentan recorded with different Q3 fill masses
(200 and 400 Th). The principal difference between the two spectra is the strong
decrease of the ion at m/z 280 Th for the Q3 fill mass of 400 Th. This implies
that the ion at m/z 280 Th is a second generation ion. It is known that the
fragment at m/z 280 Th originates from the ion at m/z 311 Th through the loss
of a CH3O radical, which is also confirmed with the TDF experiment.12
To increase throughput in drug metabolism the use of information-
dependent acquisition (IDA) becomes very important. IDA is a procedure that
combines two or more different scan modes in a sequential fashion for the
same LC–MS run. The first scan is defined as the survey scan where data are
processed on the fly to determine the candidates of interest based on predefined
selection criteria. If the selection criteria are met a second scan (data
dependent) is then performed. A typical IDA experiment is to perform full
scan single MS as a survey scan and then MS/MS as a dependent scan.
Figure 10.3 Product ion mass spectra of trocade, comparison QqLIT and IT. (Adapted fromHopfgartner G., J. Mass Spectrom., 38(2), 138, 2003. With permission.)
282 Using Mass Spectrometry for Drug Metabolism Studies
Copyright © 2005 CRC Press, LLC
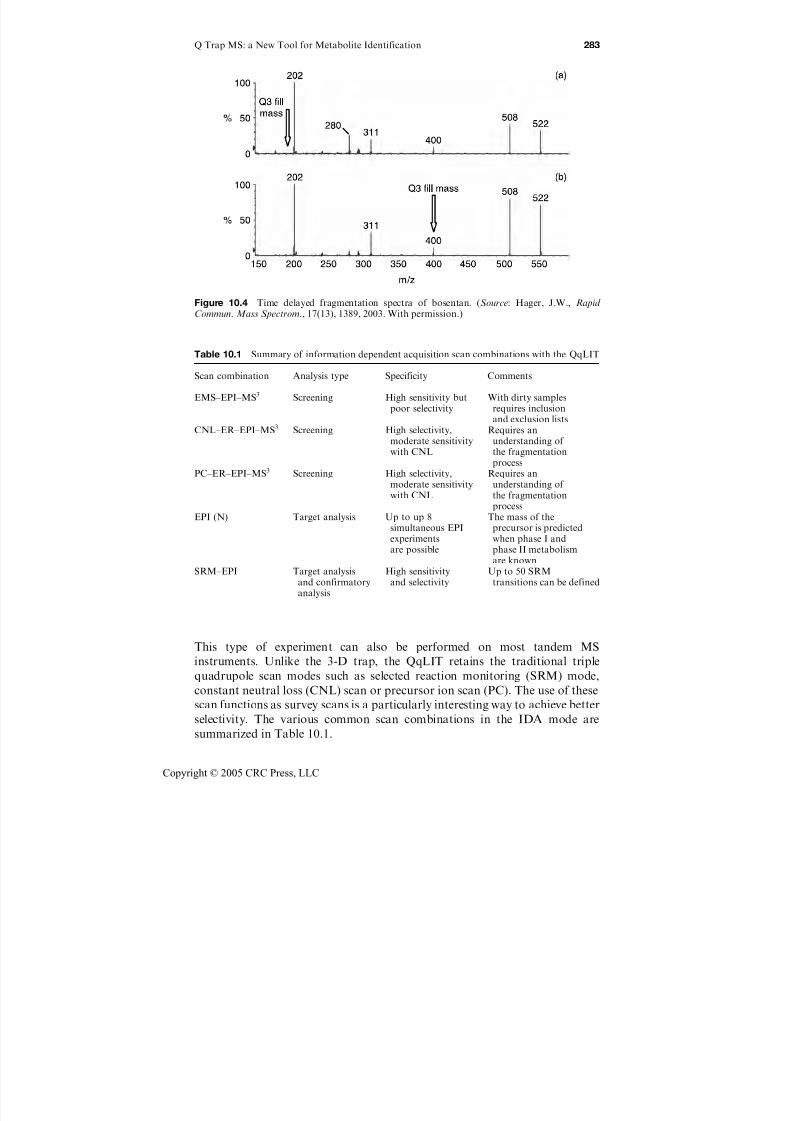
7/21/2019 Using Mass Spectrometry for Drug Metabolism Studies
http://slidepdf.com/reader/full/using-mass-spectrometry-for-drug-metabolism-studies 290/362
This type of experiment can also be performed on most tandem MS
instruments. Unlike the 3-D trap, the QqLIT retains the traditional triple
quadrupole scan modes such as selected reaction monitoring (SRM) mode,
constant neutral loss (CNL) scan or precursor ion scan (PC). The use of these
scan functions as survey scans is a particularly interesting way to achieve better
selectivity. The various common scan combinations in the IDA mode are
summarized in Table 10.1.
Table 10.1 Summary of information dependent acquisition scan combinations with the QqLIT
Scan combination Analysis type Specificity Comments
EMS–EPI–MS3 Screening High sensitivity butpoor selectivity
With dirty samplesrequires inclusionand exclusion lists
CNL–ER–EPI–MS3 Screening High selectivity,moderate sensitivitywith CNL
Requires anunderstanding of the fragmentationprocess
PC–ER–EPI–MS3 Screening High selectivity,moderate sensitivitywith CNL
Requires anunderstanding of the fragmentationprocess
EPI (N) Target analysis Up to up 8simultaneous EPIexperimentsare possible
The mass of theprecursor is predictedwhen phase I andphase II metabolismare known
SRM–EPI Target analysisand confirmatoryanalysis
High sensitivityand selectivity
Up to 50 SRMtransitions can be defined
Figure 10.4 Time delayed fragmentation spectra of bosentan. (Source: Hager, J.W., Rapid Commun. Mass Spectrom., 17(13), 1389, 2003. With permission.)
Q Trap MS: a New Tool for Metabolite Identification 283
Copyright © 2005 CRC Press, LLC
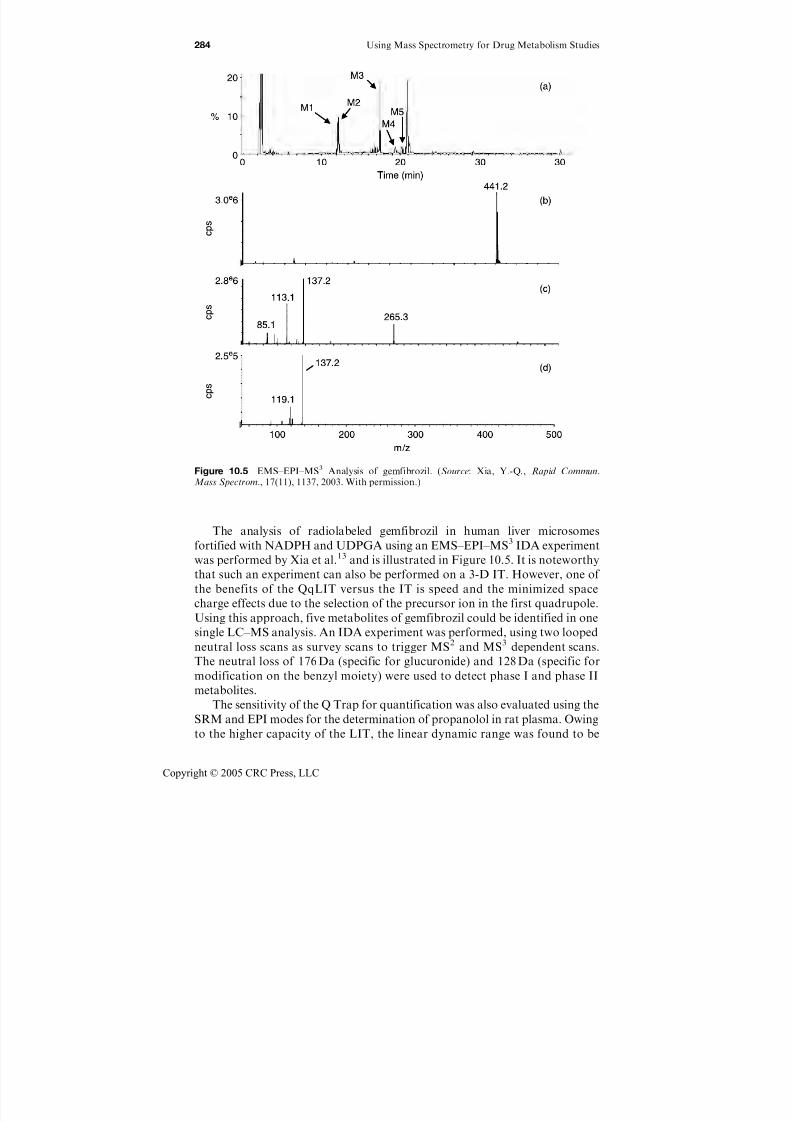
7/21/2019 Using Mass Spectrometry for Drug Metabolism Studies
http://slidepdf.com/reader/full/using-mass-spectrometry-for-drug-metabolism-studies 291/362
The analysis of radiolabeled gemfibrozil in human liver microsomes
fortified with NADPH and UDPGA using an EMS–EPI–MS3 IDA experiment
was performed by Xia et al.13 and is illustrated in Figure 10.5. It is noteworthy
that such an experiment can also be performed on a 3-D IT. However, one of
the benefits of the QqLIT versus the IT is speed and the minimized space
charge effects due to the selection of the precursor ion in the first quadrupole.
Using this approach, five metabolites of gemfibrozil could be identified in one
single LC–MS analysis. An IDA experiment was performed, using two looped
neutral loss scans as survey scans to trigger MS2 and MS3 dependent scans.
The neutral loss of 176 Da (specific for glucuronide) and 128 Da (specific for
modification on the benzyl moiety) were used to detect phase I and phase II
metabolites.
The sensitivity of the Q Trap for quantification was also evaluated using the
SRM and EPI modes for the determination of propanolol in rat plasma. Owing
to the higher capacity of the LIT, the linear dynamic range was found to be
Figure 10.5 EMS–EPI–MS3 Analysis of gemfibrozil. (Source: Xia, Y.-Q., Rapid Commun.Mass Spectrom., 17(11), 1137, 2003. With permission.)
284 Using Mass Spectrometry for Drug Metabolism Studies
Copyright © 2005 CRC Press, LLC
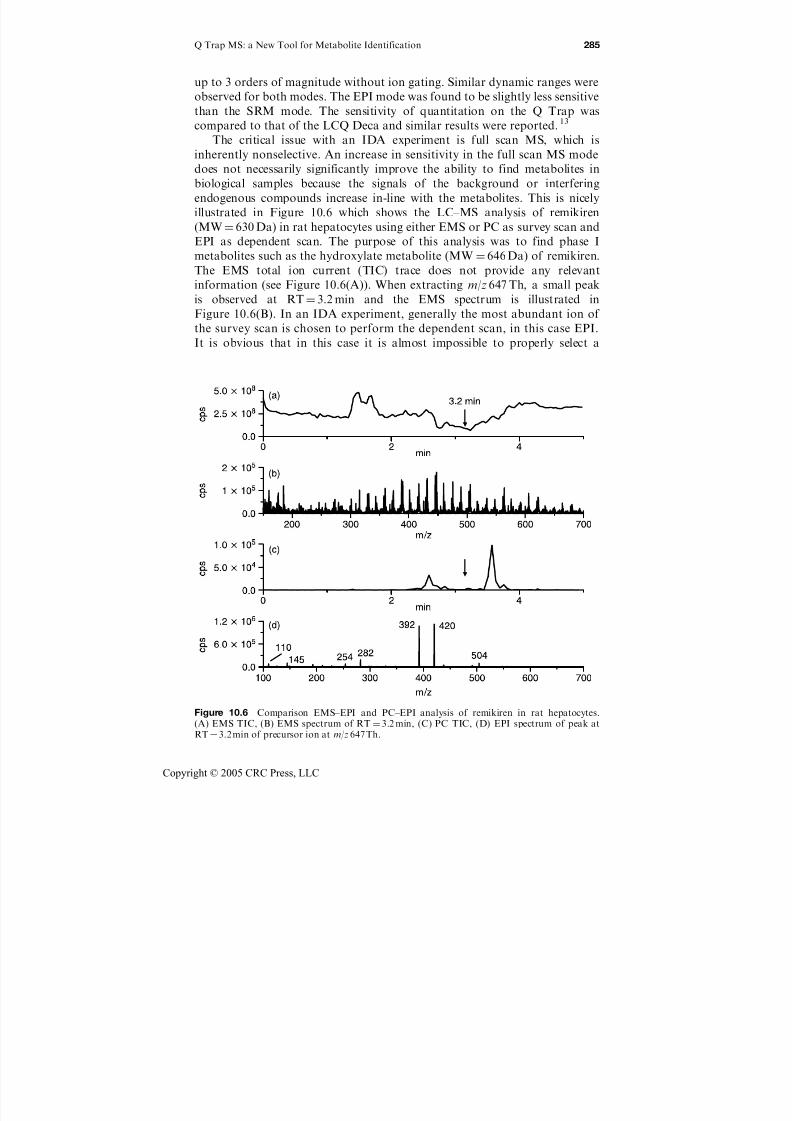
7/21/2019 Using Mass Spectrometry for Drug Metabolism Studies
http://slidepdf.com/reader/full/using-mass-spectrometry-for-drug-metabolism-studies 292/362
up to 3 orders of magnitude without ion gating. Similar dynamic ranges were
observed for both modes. The EPI mode was found to be slightly less sensitive
than the SRM mode. The sensitivity of quantitation on the Q Trap was
compared to that of the LCQ Deca and similar results were reported.13
The critical issue with an IDA experiment is full scan MS, which is
inherently nonselective. An increase in sensitivity in the full scan MS mode
does not necessarily significantly improve the ability to find metabolites in
biological samples because the signals of the background or interfering
endogenous compounds increase in-line with the metabolites. This is nicely
illustrated in Figure 10.6 which shows the LC–MS analysis of remikiren
(MW¼ 630 Da) in rat hepatocytes using either EMS or PC as survey scan and
EPI as dependent scan. The purpose of this analysis was to find phase I
metabolites such as the hydroxylate metabolite (MW¼ 646 Da) of remikiren.The EMS total ion current (TIC) trace does not provide any relevant
information (see Figure 10.6(A)). When extracting m/z 647 Th, a small peak
is observed at RT¼ 3.2 min and the EMS spectrum is illustrated in
Figure 10.6(B). In an IDA experiment, generally the most abundant ion of
the survey scan is chosen to perform the dependent scan, in this case EPI.
It is obvious that in this case it is almost impossible to properly select a
Figure 10.6 Comparison EMS–EPI and PC–EPI analysis of remikiren in rat hepatocytes.(A) EMS TIC, (B) EMS spectrum of RT¼ 3.2 min, (C) PC TIC, (D) EPI spectrum of peak atRT¼3.2 min of precursor ion at m/z 647 Th.
Q Trap MS: a New Tool for Metabolite Identification 285
Copyright © 2005 CRC Press, LLC
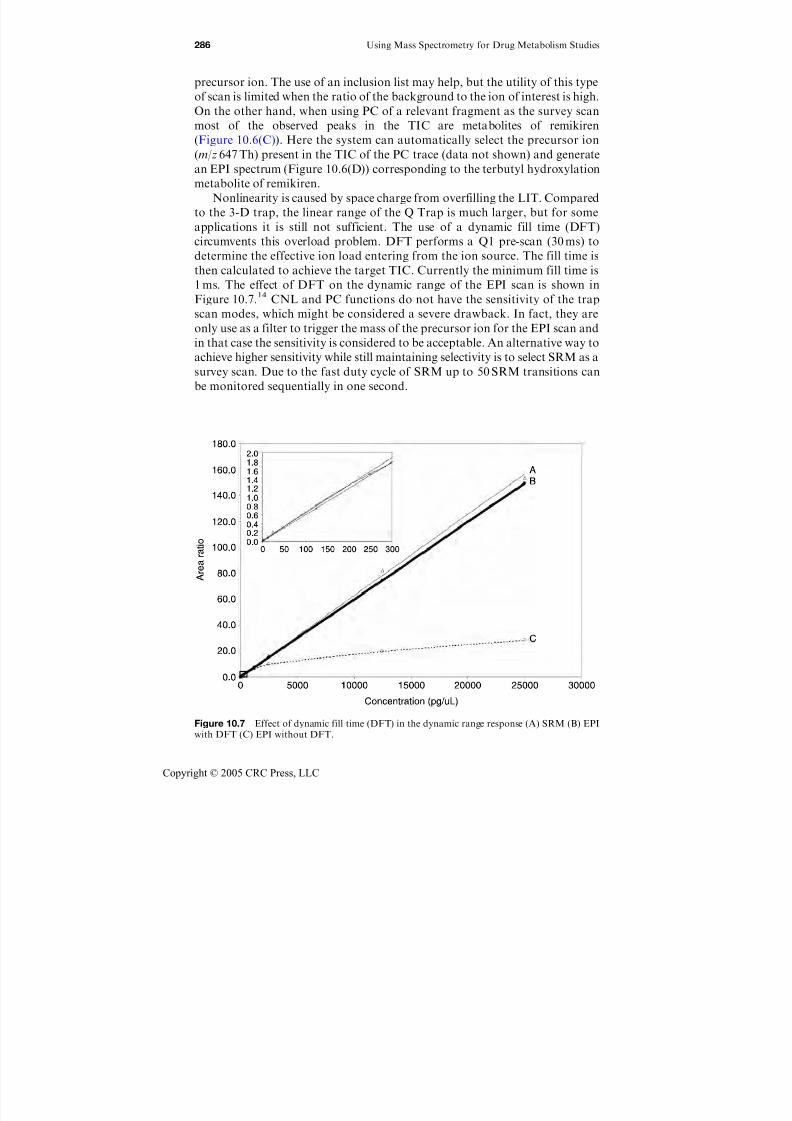
7/21/2019 Using Mass Spectrometry for Drug Metabolism Studies
http://slidepdf.com/reader/full/using-mass-spectrometry-for-drug-metabolism-studies 293/362
precursor ion. The use of an inclusion list may help, but the utility of this type
of scan is limited when the ratio of the background to the ion of interest is high.
On the other hand, when using PC of a relevant fragment as the survey scan
most of the observed peaks in the TIC are metabolites of remikiren(Figure 10.6(C)). Here the system can automatically select the precursor ion
(m/z 647 Th) present in the TIC of the PC trace (data not shown) and generate
an EPI spectrum (Figure 10.6(D)) corresponding to the terbutyl hydroxylation
metabolite of remikiren.
Nonlinearity is caused by space charge from overfilling the LIT. Compared
to the 3-D trap, the linear range of the Q Trap is much larger, but for some
applications it is still not sufficient. The use of a dynamic fill time (DFT)
circumvents this overload problem. DFT performs a Q1 pre-scan (30 ms) to
determine the effective ion load entering from the ion source. The fill time isthen calculated to achieve the target TIC. Currently the minimum fill time is
1 ms. The effect of DFT on the dynamic range of the EPI scan is shown in
Figure 10.7.14 CNL and PC functions do not have the sensitivity of the trap
scan modes, which might be considered a severe drawback. In fact, they are
only use as a filter to trigger the mass of the precursor ion for the EPI scan and
in that case the sensitivity is considered to be acceptable. An alternative way to
achieve higher sensitivity while still maintaining selectivity is to select SRM as a
survey scan. Due to the fast duty cycle of SRM up to 50 SRM transitions can
be monitored sequentially in one second.
Figure 10.7 Effect of dynamic fill time (DFT) in the dynamic range response (A) SRM (B) EPIwith DFT (C) EPI without DFT.
286 Using Mass Spectrometry for Drug Metabolism Studies
Copyright © 2005 CRC Press, LLC

7/21/2019 Using Mass Spectrometry for Drug Metabolism Studies
http://slidepdf.com/reader/full/using-mass-spectrometry-for-drug-metabolism-studies 294/362
10.3 Current Use of the Technology
10.3.1 Screening of metabolites of tolcapone
Tolcapone (3,4-dihydro-40-methyl-5-nitrobenzophenone) is a reversible orally
active inhibitor of catechol-O-methyltransferase. The compound was devel-
oped for therapy in Parkinson’s disease. The metabolism of tolcapone has been
described by Jorga et al.15 Tolcapone undergoes various phase I and phase II
metabolism pathways as shown in Figure 10.8. Tolcapone shows moderate ion
spray response in the negative ion mode and poor response in the positive ion
mode. Chromatography was performed with various analytical columns such
as Inertsil ODS-3 and Kromasil C18. The gradient consisted of aqueous 1%
formic acid/methanol. The enhanced product ion mass spectra in positive andnegative mode are illustrated in Figure 10.9(A and B), respectively. The
fragmentation pathway of tolcapone in the positive ion mode is straightfor-
ward (Figure 10.10). In a first step, fragmentation occurs at the protonated
molecule generating two fragment ions at m/z 182 Th and m/z 119 Th. The ion
at m/z 182 Th undergoes further fragmentation to the ion at m/z 136 Th by the
loss of a nitro radical. The further loss of carbon monoxide generates the
Figure 10.8 Metabolism of tolcapone in humans.
Q Trap MS: a New Tool for Metabolite Identification 287
Copyright © 2005 CRC Press, LLC
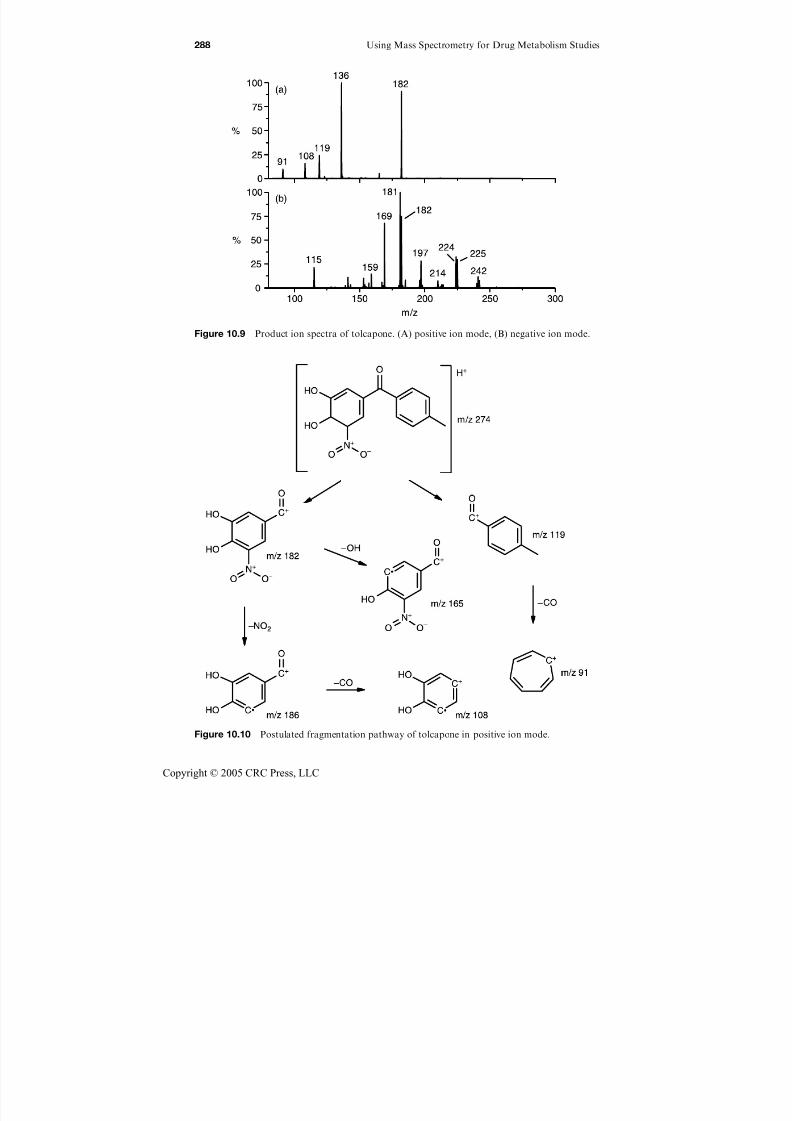
7/21/2019 Using Mass Spectrometry for Drug Metabolism Studies
http://slidepdf.com/reader/full/using-mass-spectrometry-for-drug-metabolism-studies 295/362
Figure 10.10 Postulated fragmentation pathway of tolcapone in positive ion mode.
Figure 10.9 Product ion spectra of tolcapone. (A) positive ion mode, (B) negative ion mode.
288 Using Mass Spectrometry for Drug Metabolism Studies
Copyright © 2005 CRC Press, LLC

7/21/2019 Using Mass Spectrometry for Drug Metabolism Studies
http://slidepdf.com/reader/full/using-mass-spectrometry-for-drug-metabolism-studies 296/362
fragment ion at m/z 108, corresponding to a radical cation. On the other side,
the loss of a CO from the fragment ion at m/z 119 Th produces the tropylium
ion at m/z 91 Th. The elemental formulae of the proposed fragments were
confirmed by accurate mass measurements on a QqTOF II (Micromass)
system. Like with 3-D trap the MS3 function of the QqLIT allows the user to
follow the fragmentation cascade. The TDF spectra of tolcapone in the
positive ion mode are shown in Figure 10.11. In Figure 10.11(A) the Q3 fill
mass was m/z 260 Th showing only two fragments at m/z 119 and 182 Th,
illustrating that these two ions were generated directly from the protonated
molecule at m/z 274 Th. In Figure 10.11(B) the Q3 fill mass was set at
m/z 160 Th and ions above this mass can undergo further fragmentation and
are stored into the trap. By comparing the spectra from Figure 10.11(A and B)
it can be concluded that the ions observed at m/z 136 Th and m/z 165 Th
originated from the fragment ion at m/z 182 Th. These finding are also
confirmed by MS3 experiments. TDF is certainly complementary to MS3
because fragmentation processes can be monitored more precisely; in addition,
more experience needs to be gained in order to learn how to make the best
use of this scan function. It appears that it may be difficult to use TDF
in conjunction with HPLC, because the Q3 fill mass is strongly analyte
dependent.
In the negative ion mode, the spectral interpretation appears to be much
more complex. Starting from the [MH] ion at m/z 272 Th, a loss of the
hydroxy radical (17 Th) or a nitroso radical (30 Th) is observed. Accurate mass
Figure 10.11 TDF of tolcapone in positive ion mode, TDF CE 20 eV, Q3 cool time 1 ms. (A) Q3fill mass 250 Th, (B) Q3 fill mass 160 Th.
Q Trap MS: a New Tool for Metabolite Identification 289
Copyright © 2005 CRC Press, LLC

7/21/2019 Using Mass Spectrometry for Drug Metabolism Studies
http://slidepdf.com/reader/full/using-mass-spectrometry-for-drug-metabolism-studies 297/362
measurements on a QqTOF along with MS/MS of structural analogs and MS3
were used to propose the fragmentation scheme depicted in Figure 10.12. The
MS3 experiment of the fragment ion at m/z 255 Th generated the fragment ion
at m/z 182 Th, while this was not observed with the precursor at m/z 225 Th
(data not shown). Accurate mass data were also not satisfactory for this
fragment suggesting an overlapping of isobaric fragments ions that caused
some confusion. In biological fluids such as urine or plasma the EMS–EPI
approach (single MS dependent mode) failed to find most of the known
metabolites even when using inclusion lists. This was mainly due to poor
electrospray response in the positive ion mode and moderate response in the
negative ion mode for tolcapone and most of its metabolites. This observation
was found to be quite general when the analyte of interest was hidden in the
Figure 10.12 Postulated fragmentation pathway of tolcapone in negative ion mode.
290 Using Mass Spectrometry for Drug Metabolism Studies
Copyright © 2005 CRC Press, LLC

7/21/2019 Using Mass Spectrometry for Drug Metabolism Studies
http://slidepdf.com/reader/full/using-mass-spectrometry-for-drug-metabolism-studies 298/362
background of the total ion current trace due to low concentration or poor MS
response of the analyte. In this case, most systems were not capable of properly
selecting the precursor ion. Nitro catechol compounds are slightly acidic and
thus require an acidic mobile phase to obtain a satisfactory chromatographicpeak shape. To achieve this requirement, the mobile phase consisted of 1%
aqueous formic acid/methanol allowing for detection in the positive ion mode
and most surprisingly also in the negative ion mode. Notably, the signal
observed in negative ion mode was similar to that from solutions at pH > 7.
Another approach to finding metabolites is to perform simultaneous MS/
MS analysis of various postulated metabolites (targeted analysis). Targeted
product ion analysis relies on the prediction of metabolic alterations on the
basis of related drugs and knowledge of their metabolites. The molecular mass
of the major phase I and phase II metabolites can be predicted; for example,the addition of 16 Th corresponds to an oxidation metabolite or the addition of
80 and 176 Th corresponds to a sulfate and a glucuronide conjugate,
respectively. On a typical QqQ instrument, the duty cycle for a product ion
spectrum is in the range of 1 s (500 Th/s) which allows, at best, the successive
performance of about three product ion experiments in 3 s. Usually, to obtain a
sufficiently complete picture, at least 30 predicted metabolites or metabolic
alterations have to be looked for using targeted product ion analysis. Thus,
many injections of the sample need to be performed and this may lead to rapid
consumption of the sample. Ion traps are capable of scanning much faster thanbeam-type mass spectrometers. In the case of the QqLIT the fastest scan rate is
4000 Th/s. As discussed above, in contrast to a 3-D trap, MS/MS fragmenta-
tion is not performed in the trap, but in the collision cell, q2. This difference
has an important impact on the duty cycle. With an injection time of 50 ms, a
complete cycle lasts about 400 ms for a mass range from m/z 70 to m/z 600 Th.
This allows the user to run six to eight EPI experiments during the time scale of
a chromatographic peak with much better sensitivity (>50 times) than on a
QqQ system while maintaining good chromatographic resolution due to
sufficient data points per chromatographic peak. Targeted product ion analysis
is illustrated in Figure 10.13(A and B) for the analysis of tolcapone and several
of its metabolites in both the positive and negative ion modes. One of the key
advantages of targeted product ion analysis over single MS dependent analysis
is that minor metabolites can be selectively ‘‘fished out’’ from the whole bulk of
endogenous compounds even when co-eluting with a major metabolite. Most
MS instruments can perform LC–MS analysis in the positive and negative
modes in the same run. In the case of the QqLIT, this can also be done,
but it requires 700 ms additional cycle time. The targeted product ion anal-
ysis in the positive ion mode (Figure 10.14(A)) and negative ion mode
(Figure 10.14(B)) was found to be a more successful approach to screen for
metabolites of tolcapone in human urine as compared to the EMS–EPI
approach. Figure 10.15(A) illustrates the EPI mass spectrum of the acid
metabolite of tolcapone. The nitro function of tolcapone can undergo
reduction to the corresponding amine followed by further acetylation. The
product ion mass spectrum of this metabolite is depicted in Figure 10.15(B).
Q Trap MS: a New Tool for Metabolite Identification 291
Copyright © 2005 CRC Press, LLC

7/21/2019 Using Mass Spectrometry for Drug Metabolism Studies
http://slidepdf.com/reader/full/using-mass-spectrometry-for-drug-metabolism-studies 299/362
In many projects it is of interest to perform sample analysis either in the
positive or negative ion mode for sensitivity reasons. On the other hand, when
a metabolite can be detected in both the positive and negative ion modes, the
EPI spectra are generally complementary.
Figure 10.13 Targeted analysis of tolcapone and several metabolites (5 ng on-column).(A) negative ion mode, (B) positive ion mode.
Figure 10.14 Targeted analysis of a human urine (0–72 h) sample after administration of
tolcapone. (A) negative ion mode, (B) positive ion mode.
292 Using Mass Spectrometry for Drug Metabolism Studies
Copyright © 2005 CRC Press, LLC

7/21/2019 Using Mass Spectrometry for Drug Metabolism Studies
http://slidepdf.com/reader/full/using-mass-spectrometry-for-drug-metabolism-studies 300/362
Phase II conjugates such as glucuronides and sulfates might be fragmentedunintentionally to their aglycone by up-front CID. Therefore, special attention
should be given to this issue. For example, the peak at 6.2 min (Figure 10.14(B))
gave a product ion spectrum of the amine tolcapone derivative (MW¼
243 Da). However, the synthetic reference showed that this metabolite eluted
normally at about 3.8 min. Further investigation revealed that this metabolite
was the sulfate conjugate of the amine tolcapone metabolite. Therefore, in
targeted analysis consideration should always be given to phase II transitions
of metabolites that require additional experiments and thus more injections
of sample. There are two approaches to solve this issue. The first is to perform
an IDA experiment where SRM is used as survey scan while EPI is the
dependent scan. Due to the very short dwell time of SRM many transitions
could be monitored in a single LC–MS/MS analysis. Regarding sample
consumption and analysis time, this is a very efficient way for screening for
metabolites, but unexpected metabolites may be missed. The second more
general approach is to perform an IDA experiment where CNL is used as a
survey scan and EPI as a dependent scan. Glucuronide, sulfate or glutathione
metabolites generate very specific neutral losses (80 Th for sulfate, 176 Th
for glucuronide and 129 Th for glutathione). The CNL TIC of glucuronide
metabolites, either in the negative or positive ion mode, is illustrated in
Figure 10.16(A and B). For the screening of phase II metabolites, two collision
energies were used in the EPI mode (30 and 50 eV). Despite the selectivity
provided by neutral loss, the CNL trace is overloaded with peaks. In the
positive ion mode, the fragment at m/z 119 Th can be used as a marker, as
shown in Figure 10.16(C). Five glucuronide metabolites could be easily
Figure 10.15 Enhanced product ion spectra: (A) peak 5 of Figure 10.14 corresponding to acidmetabolite; (B) peak 7 of Figure 10.14 corresponding to the acetyl amine metabolite.
Q Trap MS: a New Tool for Metabolite Identification 293
Copyright © 2005 CRC Press, LLC
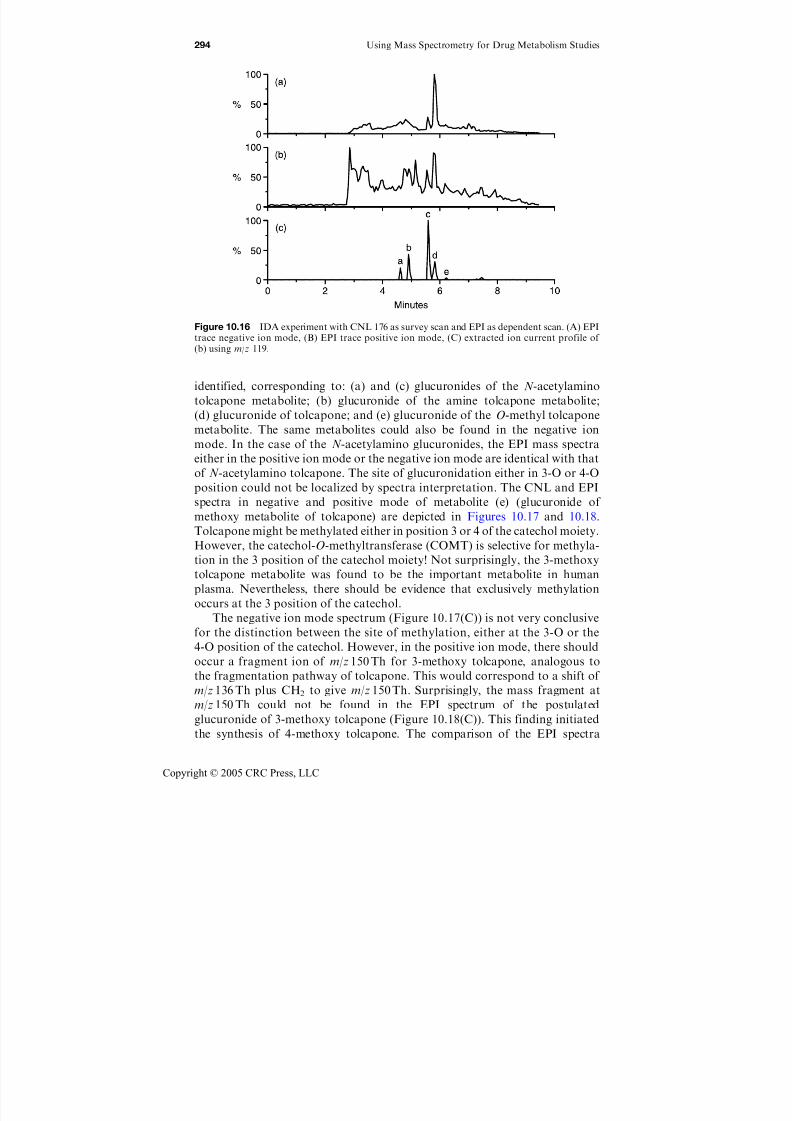
7/21/2019 Using Mass Spectrometry for Drug Metabolism Studies
http://slidepdf.com/reader/full/using-mass-spectrometry-for-drug-metabolism-studies 301/362
identified, corresponding to: (a) and (c) glucuronides of the N -acetylaminotolcapone metabolite; (b) glucuronide of the amine tolcapone metabolite;
(d) glucuronide of tolcapone; and (e) glucuronide of the O-methyl tolcapone
metabolite. The same metabolites could also be found in the negative ion
mode. In the case of the N -acetylamino glucuronides, the EPI mass spectra
either in the positive ion mode or the negative ion mode are identical with that
of N -acetylamino tolcapone. The site of glucuronidation either in 3-O or 4-O
position could not be localized by spectra interpretation. The CNL and EPI
spectra in negative and positive mode of metabolite (e) (glucuronide of
methoxy metabolite of tolcapone) are depicted in Figures 10.17 and 10.18.
Tolcapone might be methylated either in position 3 or 4 of the catechol moiety.
However, the catechol-O-methyltransferase (COMT) is selective for methyla-
tion in the 3 position of the catechol moiety! Not surprisingly, the 3-methoxy
tolcapone metabolite was found to be the important metabolite in human
plasma. Nevertheless, there should be evidence that exclusively methylation
occurs at the 3 position of the catechol.
The negative ion mode spectrum (Figure 10.17(C)) is not very conclusive
for the distinction between the site of methylation, either at the 3-O or the
4-O position of the catechol. However, in the positive ion mode, there should
occur a fragment ion of m/z 150 Th for 3-methoxy tolcapone, analogous to
the fragmentation pathway of tolcapone. This would correspond to a shift of
m/z 136 Th plus CH2 to give m/z 150 Th. Surprisingly, the mass fragment at
m/z 150 Th could not be found in the EPI spectrum of the postulated
glucuronide of 3-methoxy tolcapone (Figure 10.18(C)). This finding initiated
the synthesis of 4-methoxy tolcapone. The comparison of the EPI spectra
Figure 10.16 IDA experiment with CNL 176 as survey scan and EPI as dependent scan. (A) EPItrace negative ion mode, (B) EPI trace positive ion mode, (C) extracted ion current profile of (b) using m/z 119.
294 Using Mass Spectrometry for Drug Metabolism Studies
Copyright © 2005 CRC Press, LLC
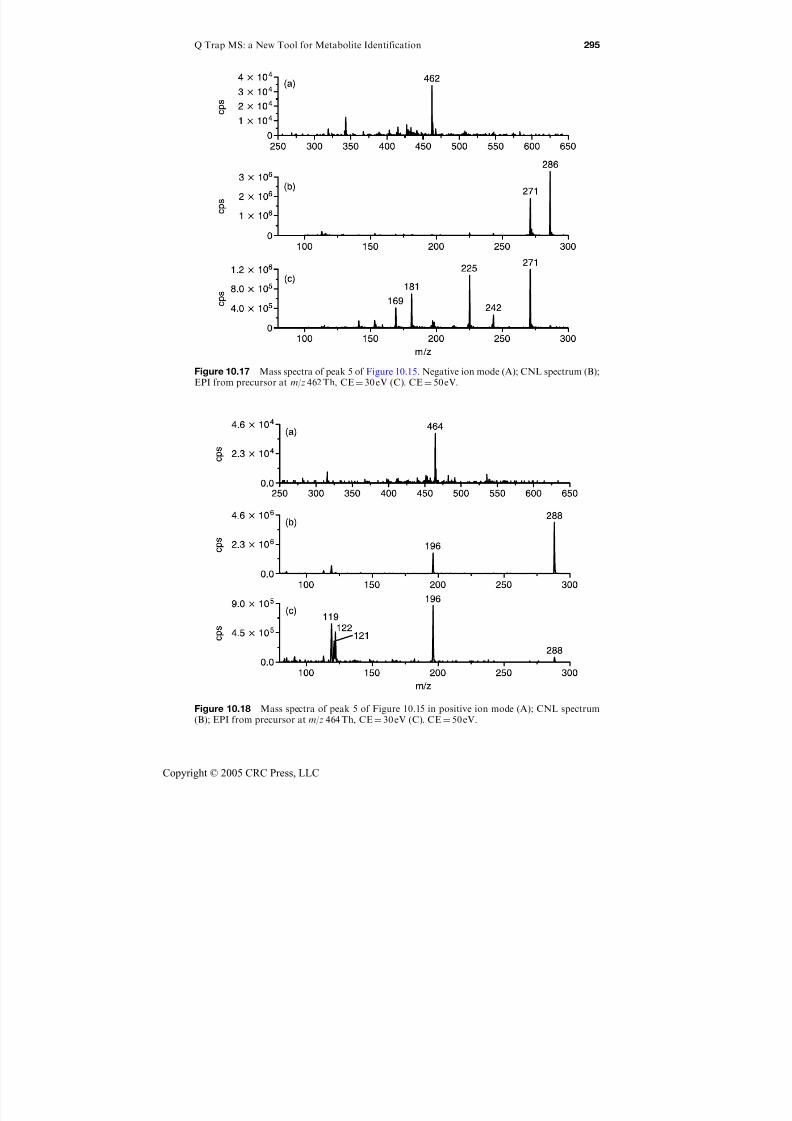
7/21/2019 Using Mass Spectrometry for Drug Metabolism Studies
http://slidepdf.com/reader/full/using-mass-spectrometry-for-drug-metabolism-studies 302/362
Figure 10.17 Mass spectra of peak 5 of Figure 10.15. Negative ion mode (A); CNL spectrum (B);
EPI from precursor at m/z 462 Th, CE¼ 30 eV (C). CE¼ 50 eV.
Figure 10.18 Mass spectra of peak 5 of Figure 10.15 in positive ion mode (A); CNL spectrum(B); EPI from precursor at m/z 464 Th, CE¼30 eV (C). CE¼ 50 eV.
Q Trap MS: a New Tool for Metabolite Identification 295
Copyright © 2005 CRC Press, LLC

7/21/2019 Using Mass Spectrometry for Drug Metabolism Studies
http://slidepdf.com/reader/full/using-mass-spectrometry-for-drug-metabolism-studies 303/362
of 4-methoxy tolcapone and 3-methoxy tolcapone are depicted in Figure
10.19(A and B), respectively. While for 3-methoxy tolcapone the fragment atm/z 150 Th is highly abundant, the same fragment is very minor for 4-methoxy
tolcapone. Since the fragment ion at m/z 150 Th was missing in the EPI
spectrum of Figure 10.18(C), evidence accumulated that the glucuronide of
peak (e) corresponded to that of 4-methoxy tolcapone. Actually, this finding
was in contrast to the notion that COMT is specific for the methylation of the
catechol in the 3-position. However, since peak (e) (Figure 10.17(C)) was found
to be a very minor metabolite there was no strong contradiction. It has to be
mentioned that 3-glucuronidation is also preferred to 4-glucuronidation. Once
the 3-position is blocked by a glucuronide, methylation becomes only possible
at the cathecol on position 4. As a consequence of this finding, methylation
mediated by COMT was found to be not specific, but highly selective. This was
a favorable case for showing that one can sometimes distinguish between
structural isomers by comparison of their EPI spectra.
Rapid scanning in CNL or precursor ion mode (PC) (>500 Th/s) results in
a significant shift of mass accuracy. In such a situation the selection of the
precursor ion mass for the EPI experiment may be off by up to 0.5 Th.
However, reducing the CNL or PC scan rate would result in much a longer
duty cycle. An alternative to this is to add an enhanced resolution scan in
between the CNL/PC and EPI scan for more accurate mass measurement and
correct selection of the respective precursor ion. One of the well-characterized
roles of glutathione (GSH) is the detoxification of xenobiotics. GSH adducts
are often formed at very low concentrations and require extensive efforts to be
detected by LC–MS. GSH adducts mostly undergo a very specific neutral loss
(NL) of 129 Th in CID.16 The analysis of a tolcapone sample obtained from
Figure 10.19 EPI spectra of the 4- (A) and the 3- (B) O-Me metabolite in the positive ion mode.
296 Using Mass Spectrometry for Drug Metabolism Studies
Copyright © 2005 CRC Press, LLC
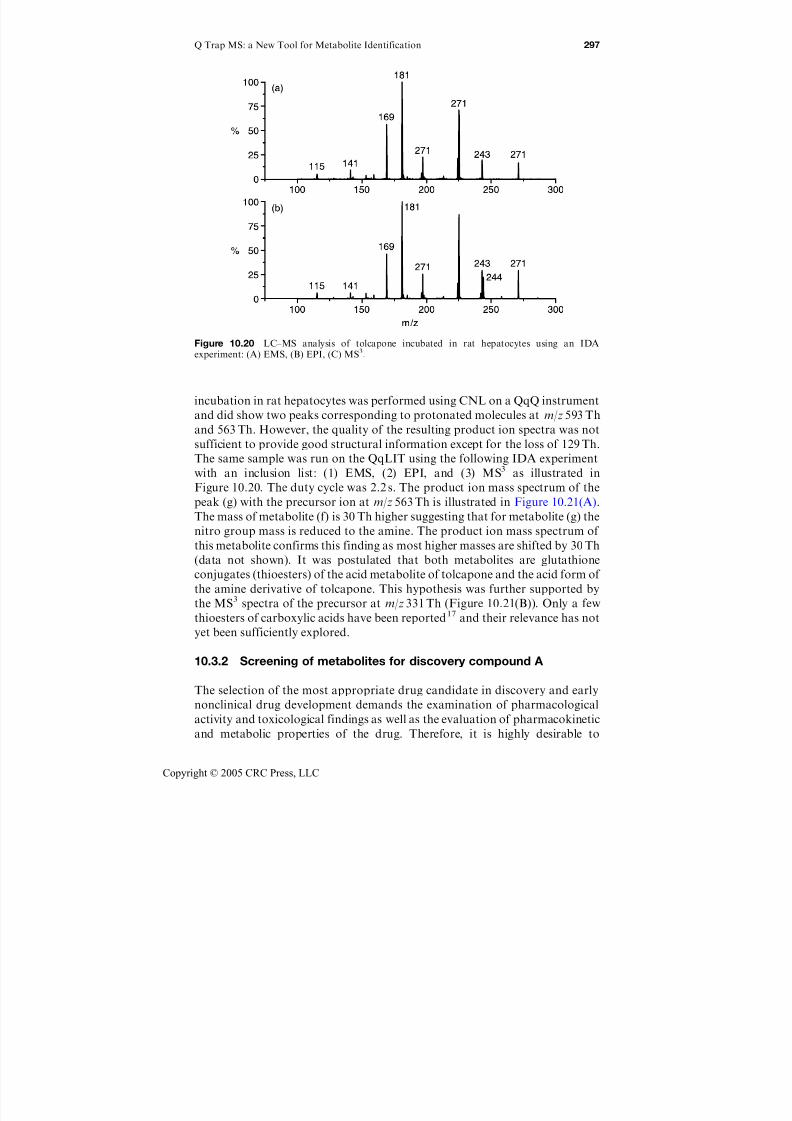
7/21/2019 Using Mass Spectrometry for Drug Metabolism Studies
http://slidepdf.com/reader/full/using-mass-spectrometry-for-drug-metabolism-studies 304/362
incubation in rat hepatocytes was performed using CNL on a QqQ instrument
and did show two peaks corresponding to protonated molecules at m/z 593 Th
and 563 Th. However, the quality of the resulting product ion spectra was not
sufficient to provide good structural information except for the loss of 129 Th.
The same sample was run on the QqLIT using the following IDA experiment
with an inclusion list: (1) EMS, (2) EPI, and (3) MS3 as illustrated in
Figure 10.20. The duty cycle was 2.2 s. The product ion mass spectrum of the
peak (g) with the precursor ion at m/z 563 Th is illustrated in Figure 10.21(A).
The mass of metabolite (f) is 30 Th higher suggesting that for metabolite (g) the
nitro group mass is reduced to the amine. The product ion mass spectrum of
this metabolite confirms this finding as most higher masses are shifted by 30 Th
(data not shown). It was postulated that both metabolites are glutathione
conjugates (thioesters) of the acid metabolite of tolcapone and the acid form of
the amine derivative of tolcapone. This hypothesis was further supported by
the MS3 spectra of the precursor at m/z 331 Th (Figure 10.21(B)). Only a few
thioesters of carboxylic acids have been reported17 and their relevance has not
yet been sufficiently explored.
10.3.2 Screening of metabolites for discovery compound A
The selection of the most appropriate drug candidate in discovery and early
nonclinical drug development demands the examination of pharmacological
activity and toxicological findings as well as the evaluation of pharmacokinetic
and metabolic properties of the drug. Therefore, it is highly desirable to
Figure 10.20 LC–MS analysis of tolcapone incubated in rat hepatocytes using an IDAexperiment: (A) EMS, (B) EPI, (C) MS3.
Q Trap MS: a New Tool for Metabolite Identification 297
Copyright © 2005 CRC Press, LLC

7/21/2019 Using Mass Spectrometry for Drug Metabolism Studies
http://slidepdf.com/reader/full/using-mass-spectrometry-for-drug-metabolism-studies 305/362
elucidate the metabolic fate of the drug in in vitro experiments as well as
in laboratory animals. Correlation of animal data with human microsomes,
hepatocytes, and CYP 450 isoenzyme incubations should also be considered as
early as possible in the development process. The analytical challenge is the
identification of metabolites at the picogram level in samples from in vivo
experiments mainly due to the limited volume of bioanalytical fluid available
from small animals. Compound A (see Figure 10.22) was found to be one
of a series of drug candidates identified in drug discovery for which its
pharmacokinetic properties and metabolic pathway were selection criteria
for further development. Owing to the early stage of drug development
only plasma samples from low-dose pharmacokinetic trials in various
animals were available for metabolic investigation. For this reason, even
the major metabolites were expected to occur in plasma at the lower ng/mL
concentration level.
In drug metabolism it is of utmost importance to optimize sample
treatment to avoid any loss of relevant metabolites. Losses of metabolites
are caused primarily by an inappropriate clean-up procedure with respect to
recovery or degradation of labile metabolites. Direct plasma injection (see
Chapter 5 for more details on this subject) might ensure the complete transfer
of metabolites onto an HPLC column, but the whole bulk of endogenous
components of the sample could cause significant ion suppression (see
Chapter 4 for more details on this subject) and thus poor sensitivity at least
for some of the metabolites. The most straightforward, but nevertheless
effective, clean-up procedure was found to be protein precipitation. To a
Figure 10.21 (A) Product ion mass spectrum of precursor ion at m/z 563 Th (peak g of Figure10.20). (B) MS3 spectrum of precursor ion at m/z 331 Th.
298 Using Mass Spectrometry for Drug Metabolism Studies
Copyright © 2005 CRC Press, LLC
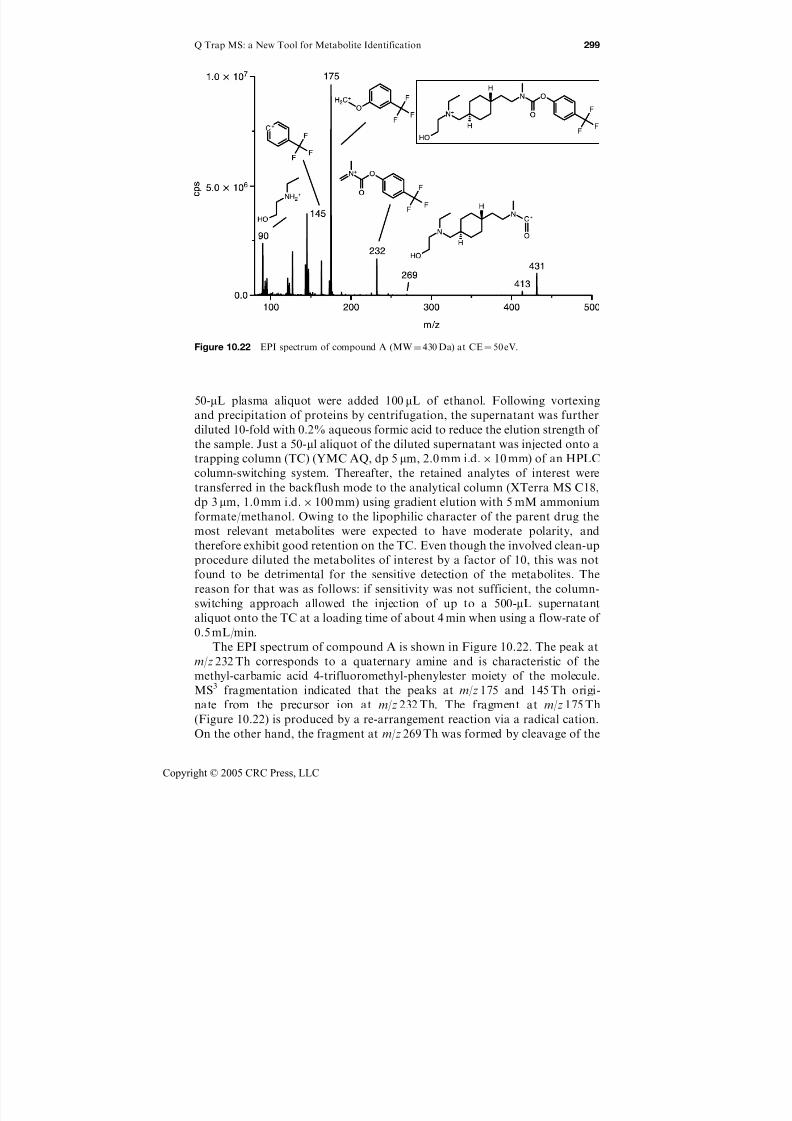
7/21/2019 Using Mass Spectrometry for Drug Metabolism Studies
http://slidepdf.com/reader/full/using-mass-spectrometry-for-drug-metabolism-studies 306/362
50-mL plasma aliquot were added 100 mL of ethanol. Following vortexing
and precipitation of proteins by centrifugation, the supernatant was further
diluted 10-fold with 0.2% aqueous formic acid to reduce the elution strength of
the sample. Just a 50-ml aliquot of the diluted supernatant was injected onto a
trapping column (TC) (YMC AQ, dp 5 mm, 2.0 mm i.d. 10 mm) of an HPLC
column-switching system. Thereafter, the retained analytes of interest were
transferred in the backflush mode to the analytical column (XTerra MS C18,
dp 3 mm, 1.0 mm i.d. 100 mm) using gradient elution with 5 mM ammonium
formate/methanol. Owing to the lipophilic character of the parent drug the
most relevant metabolites were expected to have moderate polarity, and
therefore exhibit good retention on the TC. Even though the involved clean-up
procedure diluted the metabolites of interest by a factor of 10, this was not
found to be detrimental for the sensitive detection of the metabolites. The
reason for that was as follows: if sensitivity was not sufficient, the column-
switching approach allowed the injection of up to a 500-mL supernatant
aliquot onto the TC at a loading time of about 4 min when using a flow-rate of
0.5 mL/min.
The EPI spectrum of compound A is shown in Figure 10.22. The peak at
m/z 232 Th corresponds to a quaternary amine and is characteristic of the
methyl-carbamic acid 4-trifluoromethyl-phenylester moiety of the molecule.
MS3 fragmentation indicated that the peaks at m/z 175 and 145 Th origi-
nate from the precursor ion at m/z 232 Th. The fragment at m/z 175 Th
(Figure 10.22) is produced by a re-arrangement reaction via a radical cation.
On the other hand, the fragment at m/z 269 Th was formed by cleavage of the
Figure 10.22 EPI spectrum of compound A (MW¼430 Da) at CE¼ 50 eV.
Q Trap MS: a New Tool for Metabolite Identification 299
Copyright © 2005 CRC Press, LLC
7/21/2019 Using Mass Spectrometry for Drug Metabolism Studies
http://slidepdf.com/reader/full/using-mass-spectrometry-for-drug-metabolism-studies 307/362
carbamate ester ion, which is partially complementary to the fragment ion at
m/z 232 Th. Assuming that the carbamate-phenylester moiety of the parent
drug was not very prone to metabolic alteration, the fragments at m/z 175 and
m/z 145 Th could be used for precursor ion scanning to find metabolites inbiological fluids. Even metabolic transformation of the trifluoromethyl phenyl
moiety via oxidation would not make this approach useless, provided the m/z
value of the product ions were adjusted accordingly. The only shortcoming was
the very moderate sensitivity of the precursor ion (PC) mode even though
compound A elicited a good response in the positive ion mode with product ion
scanning or SRM.
The first approach used to identify the metabolites in biological fluids was
to perform an IDA experiment with EMS as the survey scan and EPI as the
dependent scan. Due to low concentrations of the metabolites in the sampleand the inherent nonselectivity of EMS, only the parent drug, its glucuronide
conjugate and a metabolite generated by oxidation of the parent drug could be
found by this method. The second approach involved an IDA experiment with
CNL of 176 Th as the survey scan and EPI as the dependent scan for screening
for glucuronides. In this case, only the glucuronide of the parent drug could be
identified. In a third run, targeted analysis with EPI using predicted precursor
ions including oxidation, de-alkylation and glucuronidation was performed.
The result was as follows: 11 metabolites could be identified at picogram
amounts (on-column) with two chromatographic LC–MS/MS runs; threefurther glucuronide conjugates of metabolites could be unambiguously
identified which had not been detected using the unique constant neutral loss
scanning of a beam-type mass spectrometer, due to its moderate sensitivity in
this mode. Chromatographic resolution remains very important for separating
not only closely related metabolites, such as isobaric ones, but also metabolite
conjugates from their respective metabolites. Metabolite conjugates always
have the potential to degrade in the ion spray source due to their thermal
liability or to the non-optimized orifice or skimmer voltages in the ion source.
Up to six EPI experiments could be conducted concomitantly without
compromising chromatographic resolution by maintaining at least 10 data
points per chromatographic peak. Targeted analysis using EPI was found to be
the most successful approach for the screening of metabolites at low ng/mL
concentrations in biological fluids. However, IDA experiments with EMS–EPI,
CNL–EPI and PC–EPI remain important to ensure that major unexpected
metabolites are not overlooked. Another interesting approach to monitoring
large numbers of metabolites at very low concentrations is to build an IDA
experiment where SRM is selected as the survey scan. In the triple quadrupole
mode, SRM provides very short duty cycles down to 10 to 50 ms without
comprising sensitivity too much. Sensitivity with a short duty cycle in SRM is
only affected by the increase in background signal. Therefore, SRM would be
the ideal survey scan in combination with EPI if it were not for the challenge
of predicting the right transitions of unknown metabolites. In our case, the
product ions at m/z 175 and 145 Th can be regarded as characteristic fragments
of the parent drug (compound A) but also of its metabolites. Therefore, the
300 Using Mass Spectrometry for Drug Metabolism Studies
Copyright © 2005 CRC Press, LLC

7/21/2019 Using Mass Spectrometry for Drug Metabolism Studies
http://slidepdf.com/reader/full/using-mass-spectrometry-for-drug-metabolism-studies 308/362
transitions can be composed of the precursor ion (predicted molecular mass) of
the metabolite and the characteristic fragment ion including a possible shift due
to metabolic alteration. This approach allows the simultaneous monitoring of
up to 50 transitions in one single LC–MS/MS assay. This setup is particularly
effective when comparing metabolite patterns in different species or in various
samples from different studies but from the same species.
Figure 10.23 illustrates an IDA experiment with SRM–EPI scanning for a
dog plasma sample taken 4 h after p.o. administration of the test compound at
a dose of 30 mg/kg. A total of 13 SRM transitions, using a dwell time of 30 ms
each, were used as survey scans (Figure 10.23(A)) while two EPI experiments
with 40 and 50 eV were taken as dependent scans. Figure 10.23(B) shows the
corresponding TIC traces of EPI at a collision energy of 40 eV. The EPI mass
spectra of 10 out of 11 metabolites could be acquired in one LC–MS/MS assay
without using dynamic exclusion. The same approach was successfully applied
to monitor phase I and II metabolites. Figure 10.24(A) shows the represen-
tative EPI mass spectrum of a precursor at m/z 607 Th corresponding to the
glucuronide of compound A while Figure 10.24(B) illustrates the EPI spectrum
of the acid metabolite. As expected, the spectral quality was the same
compared to that obtained by targeted analysis using EPI.
Quadrupole CID spectra are strongly dependent on the collision energy
(CE) and the nature of the analyte. To maximize spectral information two EPI
scans are recorded in general with at least two different collision energies.
In the case of the QqLIT, the trap is placed after the collision cell, and
therefore fragments generated at different collision energies can be trapped
Figure 10.23 LC–MS/MS analysis of dog plasma sample, taken 4 h after multiple p.o.administration of 30 mg/kg in IDA mode (A); 14 SRM transitions (B). TIC of the EPI traces ata CE of 40 eV.
Q Trap MS: a New Tool for Metabolite Identification 301
Copyright © 2005 CRC Press, LLC
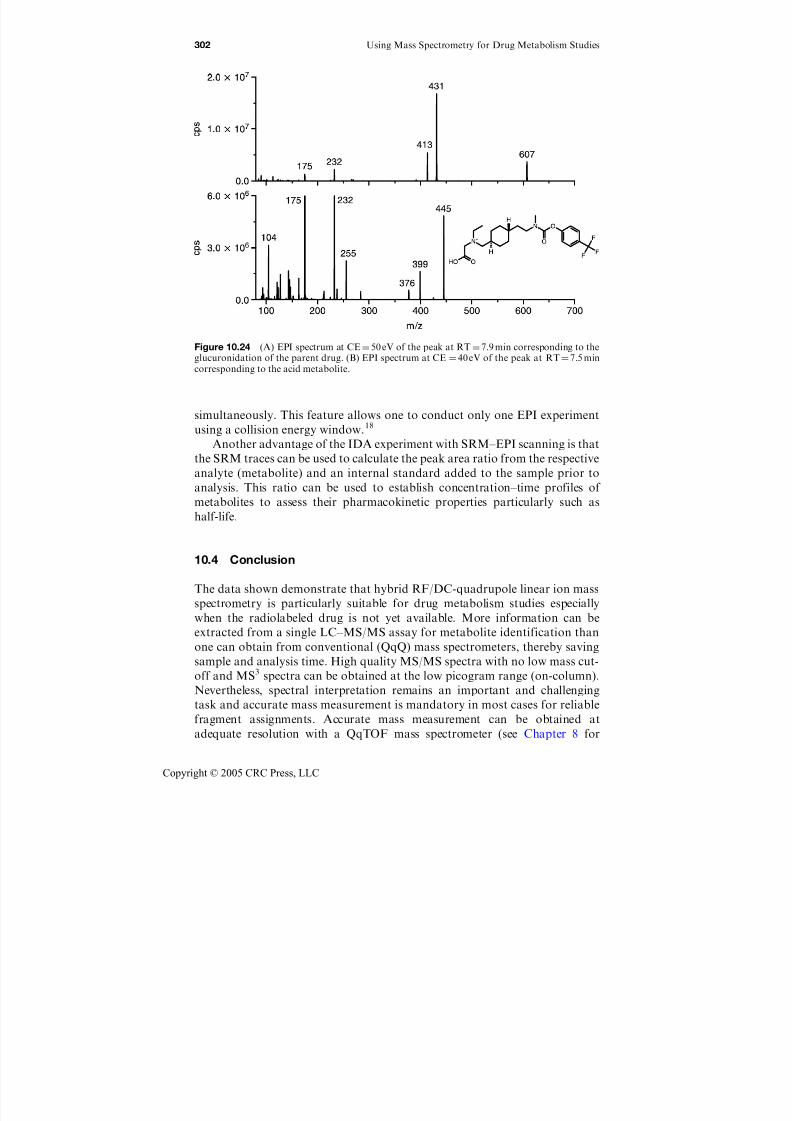
7/21/2019 Using Mass Spectrometry for Drug Metabolism Studies
http://slidepdf.com/reader/full/using-mass-spectrometry-for-drug-metabolism-studies 309/362
simultaneously. This feature allows one to conduct only one EPI experiment
using a collision energy window.18
Another advantage of the IDA experiment with SRM–EPI scanning is that
the SRM traces can be used to calculate the peak area ratio from the respective
analyte (metabolite) and an internal standard added to the sample prior to
analysis. This ratio can be used to establish concentration–time profiles of
metabolites to assess their pharmacokinetic properties particularly such as
half-life.
10.4 Conclusion
The data shown demonstrate that hybrid RF/DC-quadrupole linear ion mass
spectrometry is particularly suitable for drug metabolism studies especially
when the radiolabeled drug is not yet available. More information can be
extracted from a single LC–MS/MS assay for metabolite identification than
one can obtain from conventional (QqQ) mass spectrometers, thereby saving
sample and analysis time. High quality MS/MS spectra with no low mass cut-
off and MS3 spectra can be obtained at the low picogram range (on-column).
Nevertheless, spectral interpretation remains an important and challenging
task and accurate mass measurement is mandatory in most cases for reliable
fragment assignments. Accurate mass measurement can be obtained at
adequate resolution with a QqTOF mass spectrometer (see Chapter 8 for
Figure 10.24 (A) EPI spectrum at CE¼ 50 eV of the peak at RT¼7.9 min corresponding to theglucuronidation of the parent drug. (B) EPI spectrum at CE ¼ 40 eV of the peak at RT¼7.5 mincorresponding to the acid metabolite.
302 Using Mass Spectrometry for Drug Metabolism Studies
Copyright © 2005 CRC Press, LLC
7/21/2019 Using Mass Spectrometry for Drug Metabolism Studies
http://slidepdf.com/reader/full/using-mass-spectrometry-for-drug-metabolism-studies 310/362
more information on this topic), and the QqLIT technology may regarded as
complementary to it.
It is the combination of the triple quadrupole and the LIT features which
makes the QqLIT particularly versatile. Compared to the 3-D trap where MS/MS is performed in time, the QqLIT allows the performance of MS/MS in
space, thereby reducing the duty cycle. The QqLIT also has a much larger ion
volume capacity versus the 3-D trap. However, the capacity of the LIT can also
be controlled by the dynamic fill time option, allowing a linear range in the LIT
mode that is over three orders of magnitude to be obtained.
Various IDA experiments can be defined such as EMS–EPI, CNL–EPI,
PC–EPI, and SRM–EPI. EMS–EPI works best for the characterization
of high level metabolites from in vitro experiments. This combination is
not suited for the screening of low level metabolites in biological samplesfrom in vivo trials even when using an inclusion list, because of the lack of
selectivity of the EMS survey scan. In such a case, targeted analysis using
EPI by prediction of the metabolites was found to be the most efficient
and sensitive approach. Due to the rapid duty cycle up to eight metabolic
alterations or predicted metabolites could be screened in one single LC–MS/
MS assay. High selectivity for ‘‘fishing out’’ metabolites can be obtained
using CNL or PC as survey scan. Compared to the EPI mode, the
sensitivity of CNL and PC remains moderate for the API 2000 Q Trap and
has been improved for the API 4000 Q Trap. CNL–EPI is ideal to screenfor phase II metabolites such as glucuronide, sulfate, and glutathione
conjugates. A key feature of the QqLIT system is that accurate and precise
quantitation can be performed with the same instrument. Therefore, once
the key metabolites have been characterized their pharmacokinetic profiles
can be followed easily without changing the analytical instrument. SRM
and EPI also show similar sensitivity making SRM also attractive in a
nonconventional fashion as a very selective and sensitive survey scan for
metabolites screening.
The QqLIT technology is a significant step forward for improving both the
quality obtained and the speed required for identifying and quantifying
metabolites. However, these versatile and flexible tools require more attention
from the analyst and more sophisticated software to exploit the capability to its
full potential.
References
1. Hopfgartner, G. and Bourgogne, E., Quantitative high-throughput analysis of drugs
in biological matrices by mass spectrometry, Mass Spectrom. Rev., 22(3), 195, 2003.
2. Kostiainen, R., Kotiaho, T., Kuuranne, T., and Auriola, S., Liquid chromatog-
raphy/atmospheric pressure ionization–mass spectrometry in drug metabolism
studies, J. Mass Spectrom., 38(4), 357, 2003.
3. Clarke, N.J., Rindgen, D., Korfmacher, W.A., and Cox, K.A., Systematic LC/MS
metabolite identification in drug discovery, Anal. Chem., 73(15), 430A, 2001.
Q Trap MS: a New Tool for Metabolite Identification 303
Copyright © 2005 CRC Press, LLC

7/21/2019 Using Mass Spectrometry for Drug Metabolism Studies
http://slidepdf.com/reader/full/using-mass-spectrometry-for-drug-metabolism-studies 311/362
4. Collings, B.A., Campbell, J.M., Mao, D., and Douglas, D.J., A combined linear ion
trap time-of-flight system with improved performance and MSn capabilities, Rapid
Commun. Mass Spectrom., 15(19), 1777, 2001.
5. Belov, M.E., Nikolaev, E.N., Alving, K., and Smith, R.D., A new technique for
unbiased external ion accumulation in a quadrupole two-dimensional ion trap for
electrospray ionization Fourier transform ion cyclotron resonance mass spectrom-
etry, Rapid Commun. Mass Spectrom., 15(14), 1172, 2001.
6. Hager, J.W., A new linear ion trap mass spectrometer, Rapid Commun. Mass
Spectrom., 16(6), 512, 2002.
7. Schwartz, J.C., Senko, M.W., and Syka, J.E.P., A two-dimensional quadrupole ion
trap mass spectrometer, J. Am. Soc. Mass Spectrom., 13, 659, 2002.
8. Hager, J.W. and Le Blanc, Y.J.C., Product ion scanning using a Q-q-Q linear ion
trap (Q TRAPTM) mass spectrometer, Rapid Commun. Mass Spectrom., 17, 1056,
2003.9. McClellan, J.E., Murphy, J.P., III, Mulholland, J.J., and Yost, R.A., Effects of
fragile ions on mass resolution and on isolation for tandem mass spectrometry in
the quadrupole ion trap mass spectrometer, Anal. Chem., 74(2), 402, 2002.
10. Hopfgartner, G., Husser, C., and Zell, M., Rapid screening and characterization
of drug metabolites using a new quadrupole-linear ion trap mass spectrometer,
J. Mass Spectrom., 38(2), 138, 2003.
11. Hager, J.W., Product ion spectral simplification using time-delayed fragment ion
capture with tandem linear ion traps, Rapid Commun. Mass Spectrom., 17(13), 1389,
2003.
12. Hopfgartner, G. et al. Exact mass measurement of product ions for the structuralelucidation of drug metabolites with a tandem quadrupole orthogonal-acceleration
time-of-flight mass spectrometer, J. Am. Soc. Mass Spectrom., 10(12), 1305, 1999.
13. Xia, Y.-Q. et al. Use of a quadrupole linear ion trap mass spectrometer in
metabolite identification and bioanalysis, Rapid Commun. Mass Spectrom., 17(11),
1137, 2003.
14. LeBlanc, Y.J.C., unpublished data, 2003.
15. Jorga, K., Fotteler, B., Heizmann, P., and Gasser, R., Metabolism and excretion
of tolcapone, a novel inhibitor of catechol-O-methyltransferase, Br. J. Clin.
Pharmacol., 48(4), 513, 1999.16. Baillie, T.A. and Davis, M.R., Mass spectrometry in the analysis of glutathione
conjugates, Biol. Mass Spectrom., 22(6), 319, 1993.
17. Boelsterli, U.A., Xenobiotic acyl glucuronides and acyl CoA thioesters as protein-
reactive metabolites with the potential to cause idiosyncratic drug reactions, Curr.
Drug Metab., 3(4), 439, 2002.
18. LeBlanc, Y.J.C., In Proceedings of the 19th Montreux LC/MS Symposium,
Montreux, November 4–8, 2002.
304 Using Mass Spectrometry for Drug Metabolism Studies
Copyright © 2005 CRC Press, LLC
7/21/2019 Using Mass Spectrometry for Drug Metabolism Studies
http://slidepdf.com/reader/full/using-mass-spectrometry-for-drug-metabolism-studies 312/362
Chapter 11
MS Imaging: New Technology ProvidesNew Opportunities
Michelle L. Reyzer and Richard M. Caprioli
11.1 Introduction
A wide variety of imaging techniques have been developed because of their
ability to localize molecules within a given tissue. Recently, mass spectrometry
(MS) has emerged as a powerful imaging tool, allowing spatial localization to
be achieved with molecular specificity. Two major MS technologies are usedfor imaging today: SIMS (secondary ion mass spectrometry) and MALDI
(matrix-assisted laser desorption/ionization). Compounds including peptides,
proteins, and drugs have been imaged directly from mammalian tissue sections
using MS. This chapter will describe the use of MALDI mass spectrometric
imaging as a new tool for pharmaceutical analysis of drug compounds and
metabolites in drug discovery and development processes. This technique offers
significant advantages over current technologies, most importantly its ability to
distinguish intact drugs from their metabolites without the addition of an
isotope label. This allows distribution studies of lead compounds to occur
much earlier in the drug discovery process and allows compounds with
unfavorable distribution characteristics to be rapidly discarded. In addition the
reliance on radioactive isotopes will be minimized, which is advantageous from
both an economical and environmental standpoint.
0-8493-1963-3/05/$0.00+$1.50 2005 by CRC Press 305
Copyright © 2005 CRC Press, LLC
7/21/2019 Using Mass Spectrometry for Drug Metabolism Studies
http://slidepdf.com/reader/full/using-mass-spectrometry-for-drug-metabolism-studies 313/362
Distribution studies of drug candidates in animals are crucial in both drug
discovery and development. These studies provide information about where
the drug accumulates in the body, if it accumulates in the target organ, if it
selectively accumulates in other organs or tissues (such as the brain, indicatingpossible neurotoxicity or other unwanted side effects), and how long the drug
remains in the body. Accurate assessment of preclinical ADME (absorption/
distribution/metabolism/excretion) and toxicological parameters of new drug
candidates is essential for future successful clinical trials. Techniques currently
in use for assessing the distribution of drug candidates in tissues will be
discussed, including positron emission tomography (PET), magnetic resonance
imaging (MRI), autoradiography, and secondary ion mass spectrometry
(SIMS). Their strengths and limitations will be addressed, especially with
regard to the spatial analysis of drugs and metabolites in tissues. The techniqueof MALDI mass spectrometry as applied to both high molecular weight
proteins and low molecular weight compounds will be discussed, and examples
of its use will be presented. Finally, the further development of the technique
will be addressed, focusing on improvements and advances necessary to allow
the technology to reach its full potential.
11.2 Current Imaging Techniques
Many analytical techniques exist to image the distribution of compounds in the
body. Generally, they can be divided into two groups: non-invasive in vivo
techniques and ex vivo/in vitro techniques. In vivo techniques, such as PET1–8
and MRI,8–12 allow the distribution of a drug to be evaluated over time in a
living animal. In contrast, the ex vivo/in vitro techniques, such as autoradiog-
raphy,5,6,13–21 require removal of the tissue of interest and thus can only image
the distribution of a drug at a fixed time.
One feature common to all of these techniques is the requirement that
the drug be labeled. Visualization with PET requires that a drug contain
a radioactive positron emitter, such as 11C, 13N, 15O or 18F.8 Similarly, a
radioactive isotope, typically 14C, 3H or 125I, is necessary for a compound to be
visualized with autoradiography.21 While MRI does not require a radioactive
isotope, only isotopes with nuclear spin, such as 1H, 13C, and 19F are visible
with MRI.8,9 Because the sensitivity of MRI depends on the magnetic
properties of the monitored nucleus and its natural abundance, drugs typically
need to contain 19F or be enriched in 13C in order to be effectively monitored
in the body. Contrast agents, which include paramagnetic atoms such as
gadolinium, iron, and manganese, are often used to increase the contrast in
MRI images and are frequently used as models for drugs that cannot be
imaged on their own.9,10
The main limitation with using a label or tracer for imaging, especially in
terms of drug metabolism, is that only the label and not the parent compound
is imaged. Thus, the experimentally determined distribution of a drug in a
tissue may be inaccurate if extensive metabolism has occurred. For example,
306 Using Mass Spectrometry for Drug Metabolism Studies
Copyright © 2005 CRC Press, LLC
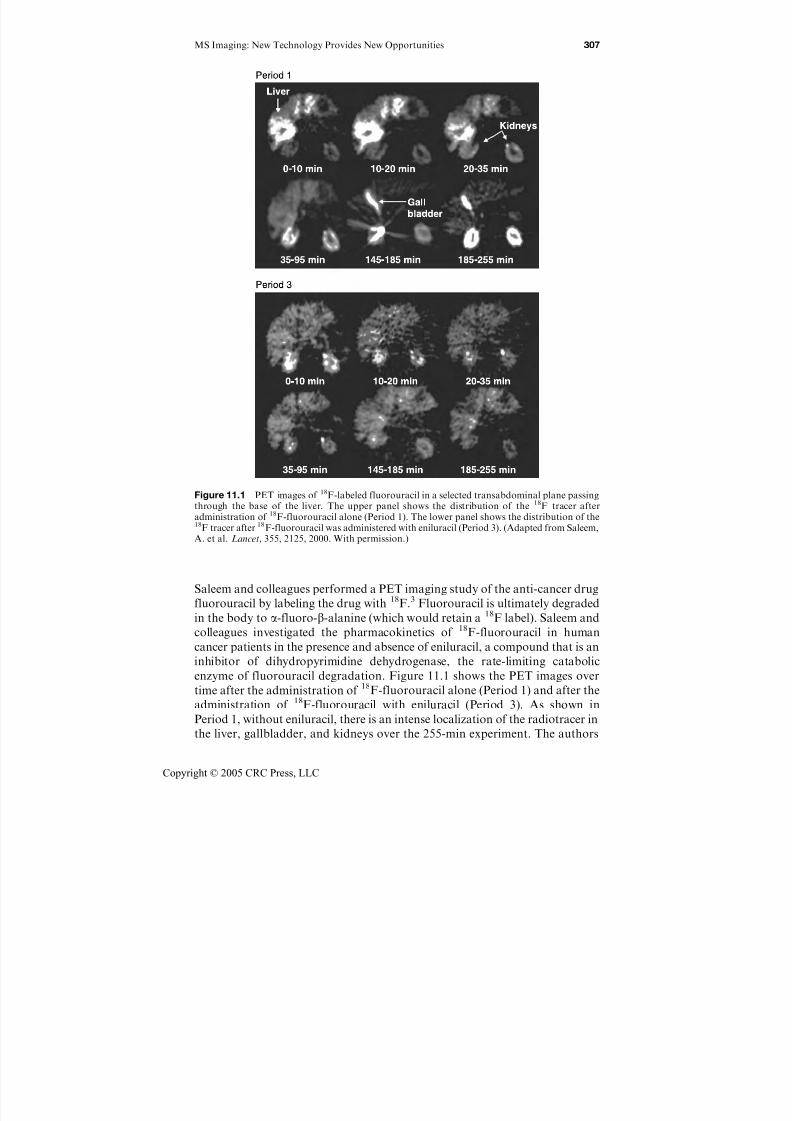
7/21/2019 Using Mass Spectrometry for Drug Metabolism Studies
http://slidepdf.com/reader/full/using-mass-spectrometry-for-drug-metabolism-studies 314/362
Saleem and colleagues performed a PET imaging study of the anti-cancer drug
fluorouracil by labeling the drug with 18F.3 Fluorouracil is ultimately degraded
in the body to a-fluoro-b-alanine (which would retain a 18F label). Saleem and
colleagues investigated the pharmacokinetics of 18F-fluorouracil in human
cancer patients in the presence and absence of eniluracil, a compound that is an
inhibitor of dihydropyrimidine dehydrogenase, the rate-limiting catabolic
enzyme of fluorouracil degradation. Figure 11.1 shows the PET images over
time after the administration of 18F-fluorouracil alone (Period 1) and after the
administration of 18F-fluorouracil with eniluracil (Period 3). As shown in
Period 1, without eniluracil, there is an intense localization of the radiotracer in
the liver, gallbladder, and kidneys over the 255-min experiment. The authors
Figure 11.1 PET images of 18F-labeled fluorouracil in a selected transabdominal plane passingthrough the base of the liver. The upper panel shows the distribution of the 18F tracer afteradministration of 18F-fluorouracil alone (Period 1). The lower panel shows the distribution of the18F tracer after 18F-fluorouracil was administered with eniluracil (Period 3). (Adapted from Saleem,A. et al. Lancet, 355, 2125, 2000. With permission.)
MS Imaging: New Technology Provides New Opportunities 307
Copyright © 2005 CRC Press, LLC
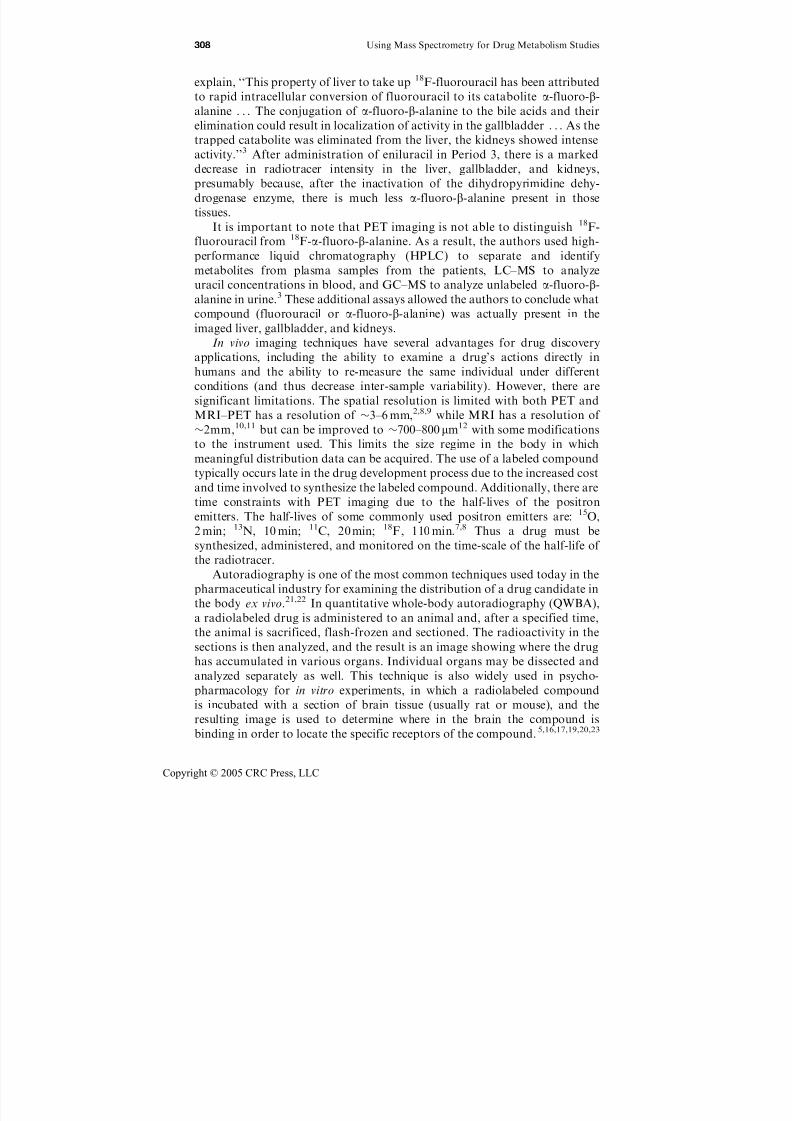
7/21/2019 Using Mass Spectrometry for Drug Metabolism Studies
http://slidepdf.com/reader/full/using-mass-spectrometry-for-drug-metabolism-studies 315/362
explain, ‘‘This property of liver to take up 18F-fluorouracil has been attributed
to rapid intracellular conversion of fluorouracil to its catabolite a-fluoro-b-
alanine . . . The conjugation of a-fluoro-b-alanine to the bile acids and their
elimination could result in localization of activity in the gallbladder . . .
As thetrapped catabolite was eliminated from the liver, the kidneys showed intense
activity.’’3 After administration of eniluracil in Period 3, there is a marked
decrease in radiotracer intensity in the liver, gallbladder, and kidneys,
presumably because, after the inactivation of the dihydropyrimidine dehy-
drogenase enzyme, there is much less a-fluoro-b-alanine present in those
tissues.
It is important to note that PET imaging is not able to distinguish 18F-
fluorouracil from 18F-a-fluoro-b-alanine. As a result, the authors used high-
performance liquid chromatography (HPLC) to separate and identifymetabolites from plasma samples from the patients, LC–MS to analyze
uracil concentrations in blood, and GC–MS to analyze unlabeled a-fluoro-b-
alanine in urine.3 These additional assays allowed the authors to conclude what
compound (fluorouracil or a-fluoro-b-alanine) was actually present in the
imaged liver, gallbladder, and kidneys.
In vivo imaging techniques have several advantages for drug discovery
applications, including the ability to examine a drug’s actions directly in
humans and the ability to re-measure the same individual under different
conditions (and thus decrease inter-sample variability). However, there aresignificant limitations. The spatial resolution is limited with both PET and
MRI–PET has a resolution of 3–6 mm,2,8,9 while MRI has a resolution of
2mm,10,11 but can be improved to 700–800 mm12 with some modifications
to the instrument used. This limits the size regime in the body in which
meaningful distribution data can be acquired. The use of a labeled compound
typically occurs late in the drug development process due to the increased cost
and time involved to synthesize the labeled compound. Additionally, there are
time constraints with PET imaging due to the half-lives of the positron
emitters. The half-lives of some commonly used positron emitters are: 15O,
2 min; 13N, 10 min; 11C, 20 min; 18F, 110 min.7,8 Thus a drug must be
synthesized, administered, and monitored on the time-scale of the half-life of
the radiotracer.
Autoradiography is one of the most common techniques used today in the
pharmaceutical industry for examining the distribution of a drug candidate in
the body ex vivo.21,22 In quantitative whole-body autoradiography (QWBA),
a radiolabeled drug is administered to an animal and, after a specified time,
the animal is sacrificed, flash-frozen and sectioned. The radioactivity in the
sections is then analyzed, and the result is an image showing where the drug
has accumulated in various organs. Individual organs may be dissected and
analyzed separately as well. This technique is also widely used in psycho-
pharmacology for in vitro experiments, in which a radiolabeled compound
is incubated with a section of brain tissue (usually rat or mouse), and the
resulting image is used to determine where in the brain the compound is
binding in order to locate the specific receptors of the compound.5,16,17,19,20,23
308 Using Mass Spectrometry for Drug Metabolism Studies
Copyright © 2005 CRC Press, LLC
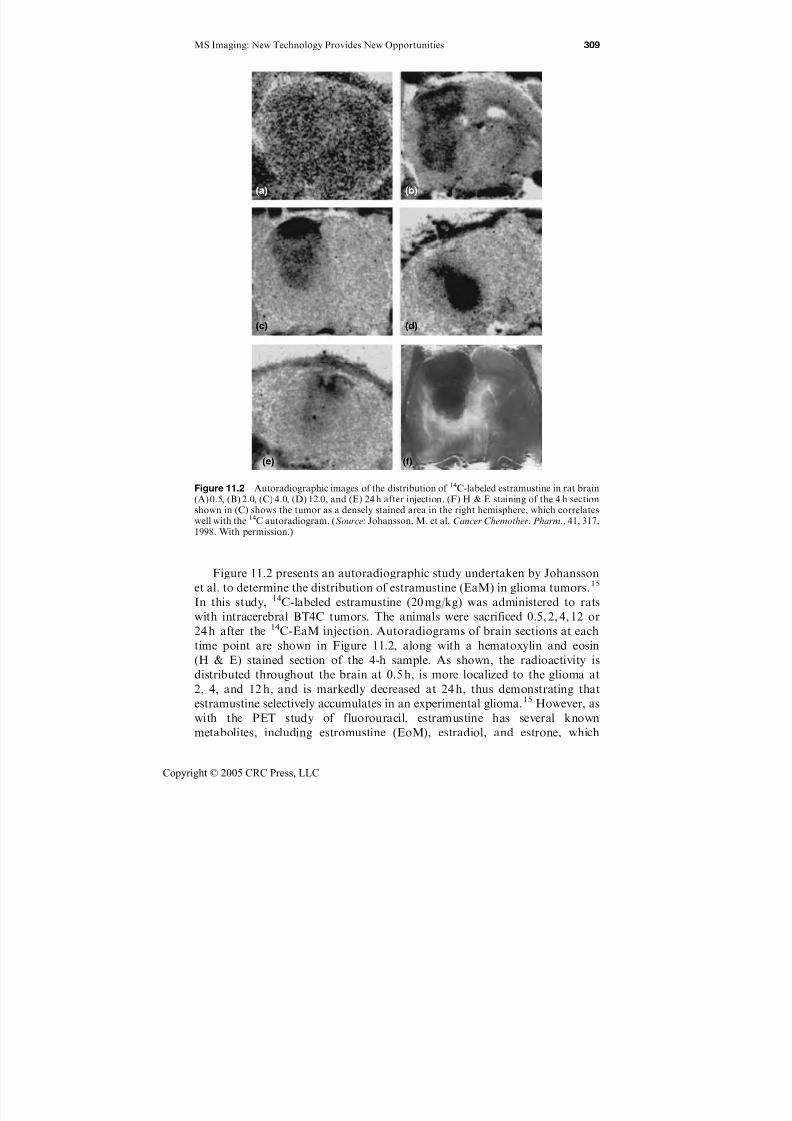
7/21/2019 Using Mass Spectrometry for Drug Metabolism Studies
http://slidepdf.com/reader/full/using-mass-spectrometry-for-drug-metabolism-studies 316/362
Figure 11.2 presents an autoradiographic study undertaken by Johansson
et al. to determine the distribution of estramustine (EaM) in glioma tumors.15
In this study, 14C-labeled estramustine (20 mg/kg) was administered to rats
with intracerebral BT4C tumors. The animals were sacrificed 0.5, 2, 4, 12 or
24 h after the 14C-EaM injection. Autoradiograms of brain sections at each
time point are shown in Figure 11.2, along with a hematoxylin and eosin
(H & E) stained section of the 4-h sample. As shown, the radioactivity is
distributed throughout the brain at 0.5 h, is more localized to the glioma at
2, 4, and 12 h, and is markedly decreased at 24 h, thus demonstrating that
estramustine selectively accumulates in an experimental glioma.15 However, as
with the PET study of fluorouracil, estramustine has several known
metabolites, including estromustine (EoM), estradiol, and estrone, which
Figure 11.2 Autoradiographic images of the distribution of 14C-labeled estramustine in rat brain(A) 0.5, (B) 2.0, (C) 4.0, (D) 12.0, and (E) 24 h after injection. (F) H & E staining of the 4 h section
shown in (C) shows the tumor as a densely stained area in the right hemisphere, which correlateswell with the 14C autoradiogram. (Source: Johansson, M. et al. Cancer Chemother. Pharm., 41, 317,1998. With permission.)
MS Imaging: New Technology Provides New Opportunities 309
Copyright © 2005 CRC Press, LLC
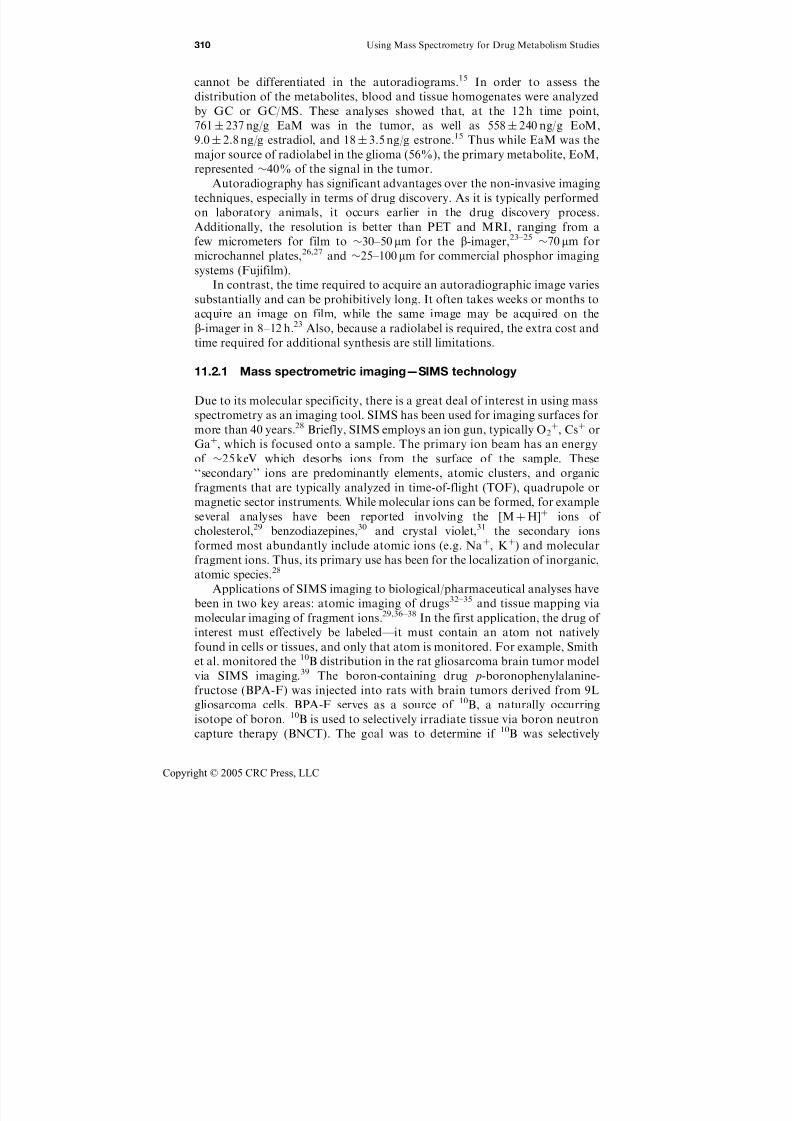
7/21/2019 Using Mass Spectrometry for Drug Metabolism Studies
http://slidepdf.com/reader/full/using-mass-spectrometry-for-drug-metabolism-studies 317/362
cannot be differentiated in the autoradiograms.15 In order to assess the
distribution of the metabolites, blood and tissue homogenates were analyzed
by GC or GC/MS. These analyses showed that, at the 12 h time point,
761 237 ng/g EaM was in the tumor, as well as 558 240 ng/g EoM,9.0 2.8 ng/g estradiol, and 18 3.5 ng/g estrone.15 Thus while EaM was the
major source of radiolabel in the glioma (56%), the primary metabolite, EoM,
represented 40% of the signal in the tumor.
Autoradiography has significant advantages over the non-invasive imaging
techniques, especially in terms of drug discovery. As it is typically performed
on laboratory animals, it occurs earlier in the drug discovery process.
Additionally, the resolution is better than PET and MRI, ranging from a
few micrometers for film to 30–50 mm for the b-imager,23–25 70 mm for
microchannel plates,26,27
and 25–100 mm for commercial phosphor imagingsystems (Fujifilm).
In contrast, the time required to acquire an autoradiographic image varies
substantially and can be prohibitively long. It often takes weeks or months to
acquire an image on film, while the same image may be acquired on the
b-imager in 8–12 h.23 Also, because a radiolabel is required, the extra cost and
time required for additional synthesis are still limitations.
11.2.1 Mass spectrometric imaging—SIMS technology
Due to its molecular specificity, there is a great deal of interest in using mass
spectrometry as an imaging tool. SIMS has been used for imaging surfaces for
more than 40 years.28 Briefly, SIMS employs an ion gun, typically O2þ, Csþ or
Gaþ, which is focused onto a sample. The primary ion beam has an energy
of 25 keV which desorbs ions from the surface of the sample. These
‘‘secondary’’ ions are predominantly elements, atomic clusters, and organic
fragments that are typically analyzed in time-of-flight (TOF), quadrupole or
magnetic sector instruments. While molecular ions can be formed, for example
several analyses have been reported involving the [MþH]þ ions of
cholesterol,29 benzodiazepines,30 and crystal violet,31 the secondary ions
formed most abundantly include atomic ions (e.g. Naþ, Kþ) and molecular
fragment ions. Thus, its primary use has been for the localization of inorganic,
atomic species.28
Applications of SIMS imaging to biological/pharmaceutical analyses have
been in two key areas: atomic imaging of drugs32–35 and tissue mapping via
molecular imaging of fragment ions.29,36–38 In the first application, the drug of
interest must effectively be labeled—it must contain an atom not natively
found in cells or tissues, and only that atom is monitored. For example, Smith
et al. monitored the 10B distribution in the rat gliosarcoma brain tumor model
via SIMS imaging.39 The boron-containing drug p-boronophenylalanine-
fructose (BPA-F) was injected into rats with brain tumors derived from 9L
gliosarcoma cells. BPA-F serves as a source of 10B, a naturally occurring
isotope of boron. 10B is used to selectively irradiate tissue via boron neutron
capture therapy (BNCT). The goal was to determine if 10B was selectively
310 Using Mass Spectrometry for Drug Metabolism Studies
Copyright © 2005 CRC Press, LLC
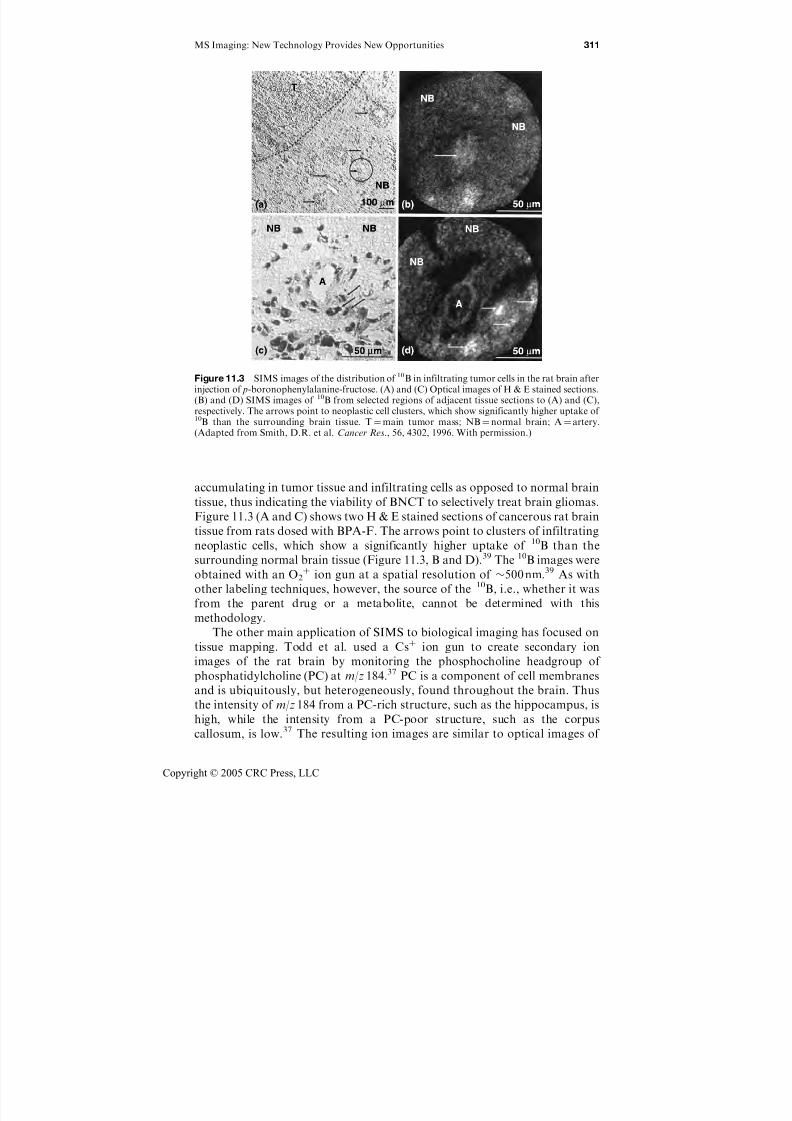
7/21/2019 Using Mass Spectrometry for Drug Metabolism Studies
http://slidepdf.com/reader/full/using-mass-spectrometry-for-drug-metabolism-studies 318/362
accumulating in tumor tissue and infiltrating cells as opposed to normal brain
tissue, thus indicating the viability of BNCT to selectively treat brain gliomas.
Figure 11.3 (A and C) shows two H & E stained sections of cancerous rat brain
tissue from rats dosed with BPA-F. The arrows point to clusters of infiltrating
neoplastic cells, which show a significantly higher uptake of 10B than the
surrounding normal brain tissue (Figure 11.3, B and D).39 The 10B images were
obtained with an O2þ ion gun at a spatial resolution of 500 nm.39 As with
other labeling techniques, however, the source of the 10B, i.e., whether it was
from the parent drug or a metabolite, cannot be determined with this
methodology.
The other main application of SIMS to biological imaging has focused on
tissue mapping. Todd et al. used a Csþ ion gun to create secondary ion
images of the rat brain by monitoring the phosphocholine headgroup of
phosphatidylcholine (PC) at m/z 184.37 PC is a component of cell membranes
and is ubiquitously, but heterogeneously, found throughout the brain. Thus
the intensity of m/z 184 from a PC-rich structure, such as the hippocampus, is
high, while the intensity from a PC-poor structure, such as the corpus
callosum, is low.37 The resulting ion images are similar to optical images of
Figure 11.3 SIMS images of the distribution of 10B in infiltrating tumor cells in the rat brain afterinjection of p-boronophenylalanine-fructose. (A) and (C) Optical images of H & E stained sections.(B) and (D) SIMS images of 10B from selected regions of adjacent tissue sections to (A) and (C),respectively. The arrows point to neoplastic cell clusters, which show significantly higher uptake of 10B than the surrounding brain tissue. T¼main tumor mass; NB¼normal brain; A¼ artery.(Adapted from Smith, D.R. et al. Cancer Res., 56, 4302, 1996. With permission.)
MS Imaging: New Technology Provides New Opportunities 311
Copyright © 2005 CRC Press, LLC
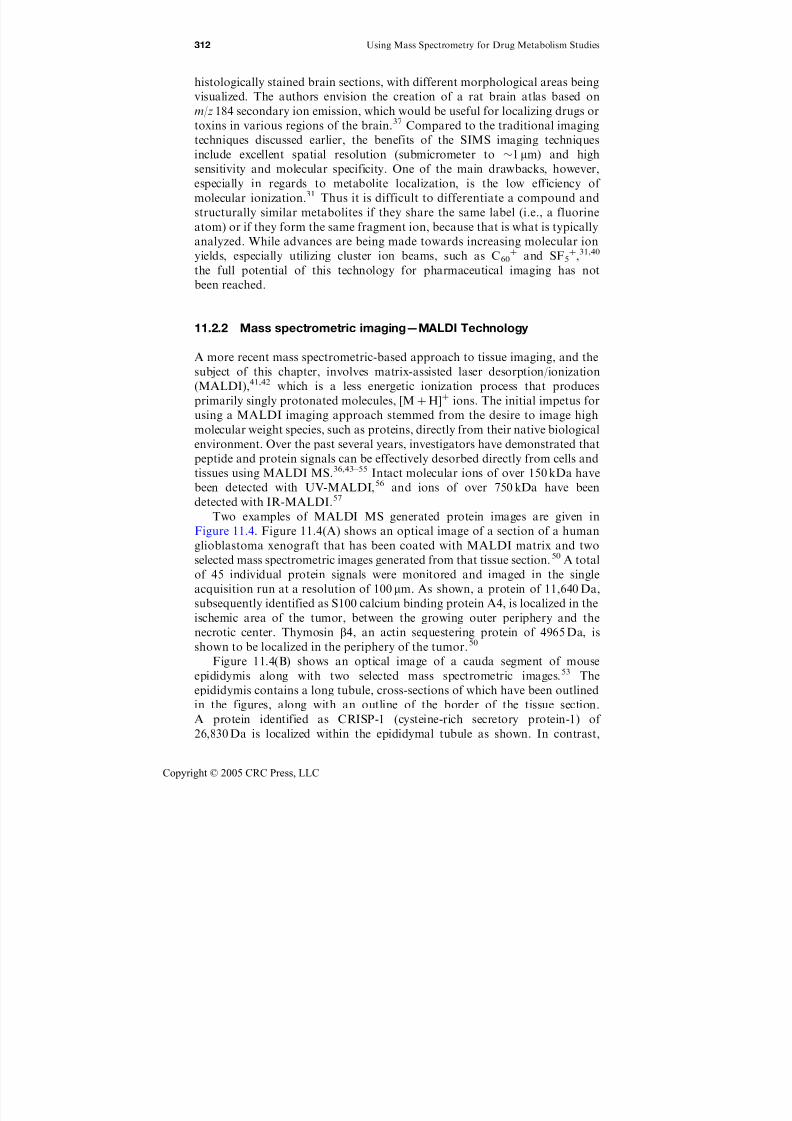
7/21/2019 Using Mass Spectrometry for Drug Metabolism Studies
http://slidepdf.com/reader/full/using-mass-spectrometry-for-drug-metabolism-studies 319/362
histologically stained brain sections, with different morphological areas being
visualized. The authors envision the creation of a rat brain atlas based on
m/z 184 secondary ion emission, which would be useful for localizing drugs or
toxins in various regions of the brain.37
Compared to the traditional imagingtechniques discussed earlier, the benefits of the SIMS imaging techniques
include excellent spatial resolution (submicrometer to 1 mm) and high
sensitivity and molecular specificity. One of the main drawbacks, however,
especially in regards to metabolite localization, is the low efficiency of
molecular ionization.31 Thus it is difficult to differentiate a compound and
structurally similar metabolites if they share the same label (i.e., a fluorine
atom) or if they form the same fragment ion, because that is what is typically
analyzed. While advances are being made towards increasing molecular ion
yields, especially utilizing cluster ion beams, such as C60þ
and SF5þ
,31,40
the full potential of this technology for pharmaceutical imaging has not
been reached.
11.2.2 Mass spectrometric imaging—MALDI Technology
A more recent mass spectrometric-based approach to tissue imaging, and the
subject of this chapter, involves matrix-assisted laser desorption/ionization
(MALDI),41,42 which is a less energetic ionization process that producesprimarily singly protonated molecules, [MþH]þ ions. The initial impetus for
using a MALDI imaging approach stemmed from the desire to image high
molecular weight species, such as proteins, directly from their native biological
environment. Over the past several years, investigators have demonstrated that
peptide and protein signals can be effectively desorbed directly from cells and
tissues using MALDI MS.36,43–55 Intact molecular ions of over 150 kDa have
been detected with UV-MALDI,56 and ions of over 750 kDa have been
detected with IR-MALDI.57
Two examples of MALDI MS generated protein images are given in
Figure 11.4. Figure 11.4(A) shows an optical image of a section of a human
glioblastoma xenograft that has been coated with MALDI matrix and two
selected mass spectrometric images generated from that tissue section.50 A total
of 45 individual protein signals were monitored and imaged in the single
acquisition run at a resolution of 100 mm. As shown, a protein of 11,640 Da,
subsequently identified as S100 calcium binding protein A4, is localized in the
ischemic area of the tumor, between the growing outer periphery and the
necrotic center. Thymosin b4, an actin sequestering protein of 4965 Da, is
shown to be localized in the periphery of the tumor.50
Figure 11.4(B) shows an optical image of a cauda segment of mouse
epididymis along with two selected mass spectrometric images.53 The
epididymis contains a long tubule, cross-sections of which have been outlined
in the figures, along with an outline of the border of the tissue section.
A protein identified as CRISP-1 (cysteine-rich secretory protein-1) of
26,830 Da is localized within the epididymal tubule as shown. In contrast,
312 Using Mass Spectrometry for Drug Metabolism Studies
Copyright © 2005 CRC Press, LLC
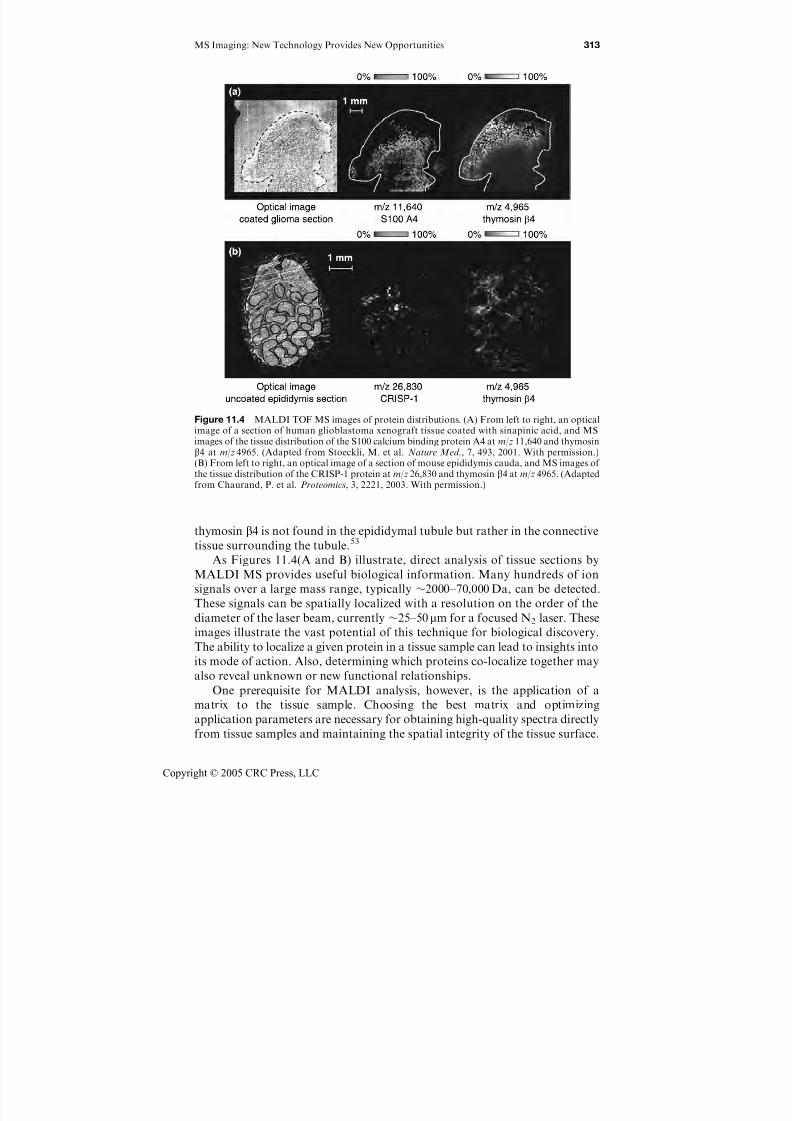
7/21/2019 Using Mass Spectrometry for Drug Metabolism Studies
http://slidepdf.com/reader/full/using-mass-spectrometry-for-drug-metabolism-studies 320/362
thymosin b4 is not found in the epididymal tubule but rather in the connective
tissue surrounding the tubule.53
As Figures 11.4(A and B) illustrate, direct analysis of tissue sections by
MALDI MS provides useful biological information. Many hundreds of ion
signals over a large mass range, typically 2000–70,000 Da, can be detected.
These signals can be spatially localized with a resolution on the order of the
diameter of the laser beam, currently 25–50 mm for a focused N2 laser. These
images illustrate the vast potential of this technique for biological discovery.
The ability to localize a given protein in a tissue sample can lead to insights into
its mode of action. Also, determining which proteins co-localize together may
also reveal unknown or new functional relationships.
One prerequisite for MALDI analysis, however, is the application of a
matrix to the tissue sample. Choosing the best matrix and optimizing
application parameters are necessary for obtaining high-quality spectra directly
from tissue samples and maintaining the spatial integrity of the tissue surface.
Figure 11.4 MALDI TOF MS images of protein distributions. (A) From left to right, an opticalimage of a section of human glioblastoma xenograft tissue coated with sinapinic acid, and MSimages of the tissue distribution of the S100 calcium binding protein A4 at m/z 11,640 and thymosinb4 at m/z 4965. (Adapted from Stoeckli, M. et al. Nature Med ., 7, 493, 2001. With permission.)(B) From left to right, an optical image of a section of mouse epididymis cauda, and MS images of the tissue distribution of the CRISP-1 protein at m/z 26,830 and thymosin b4 at m/z 4965. (Adaptedfrom Chaurand, P. et al. Proteomics, 3, 2221, 2003. With permission.)
MS Imaging: New Technology Provides New Opportunities 313
Copyright © 2005 CRC Press, LLC
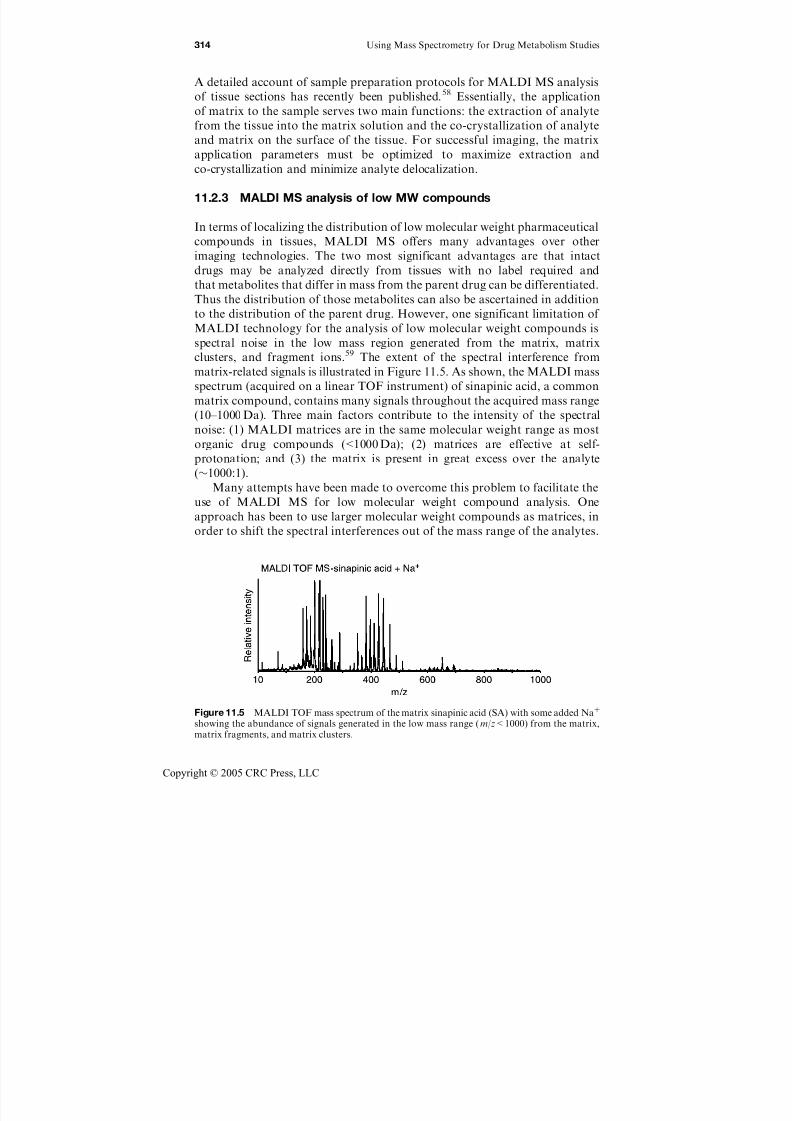
7/21/2019 Using Mass Spectrometry for Drug Metabolism Studies
http://slidepdf.com/reader/full/using-mass-spectrometry-for-drug-metabolism-studies 321/362
A detailed account of sample preparation protocols for MALDI MS analysis
of tissue sections has recently been published.58 Essentially, the application
of matrix to the sample serves two main functions: the extraction of analyte
from the tissue into the matrix solution and the co-crystallization of analyteand matrix on the surface of the tissue. For successful imaging, the matrix
application parameters must be optimized to maximize extraction and
co-crystallization and minimize analyte delocalization.
11.2.3 MALDI MS analysis of low MW compounds
In terms of localizing the distribution of low molecular weight pharmaceutical
compounds in tissues, MALDI MS offers many advantages over other
imaging technologies. The two most significant advantages are that intactdrugs may be analyzed directly from tissues with no label required and
that metabolites that differ in mass from the parent drug can be differentiated.
Thus the distribution of those metabolites can also be ascertained in addition
to the distribution of the parent drug. However, one significant limitation of
MALDI technology for the analysis of low molecular weight compounds is
spectral noise in the low mass region generated from the matrix, matrix
clusters, and fragment ions.59 The extent of the spectral interference from
matrix-related signals is illustrated in Figure 11.5. As shown, the MALDI mass
spectrum (acquired on a linear TOF instrument) of sinapinic acid, a commonmatrix compound, contains many signals throughout the acquired mass range
(10–1000 Da). Three main factors contribute to the intensity of the spectral
noise: (1) MALDI matrices are in the same molecular weight range as most
organic drug compounds (<1000 Da); (2) matrices are effective at self-
protonation; and (3) the matrix is present in great excess over the analyte
(1000:1).
Many attempts have been made to overcome this problem to facilitate the
use of MALDI MS for low molecular weight compound analysis. One
approach has been to use larger molecular weight compounds as matrices, in
order to shift the spectral interferences out of the mass range of the analytes.
Figure 11.5 MALDI TOF mass spectrum of the matrix sinapinic acid (SA) with some added Naþ
showing the abundance of signals generated in the low mass range (m/z<1000) from the matrix,matrix fragments, and matrix clusters.
314 Using Mass Spectrometry for Drug Metabolism Studies
Copyright © 2005 CRC Press, LLC
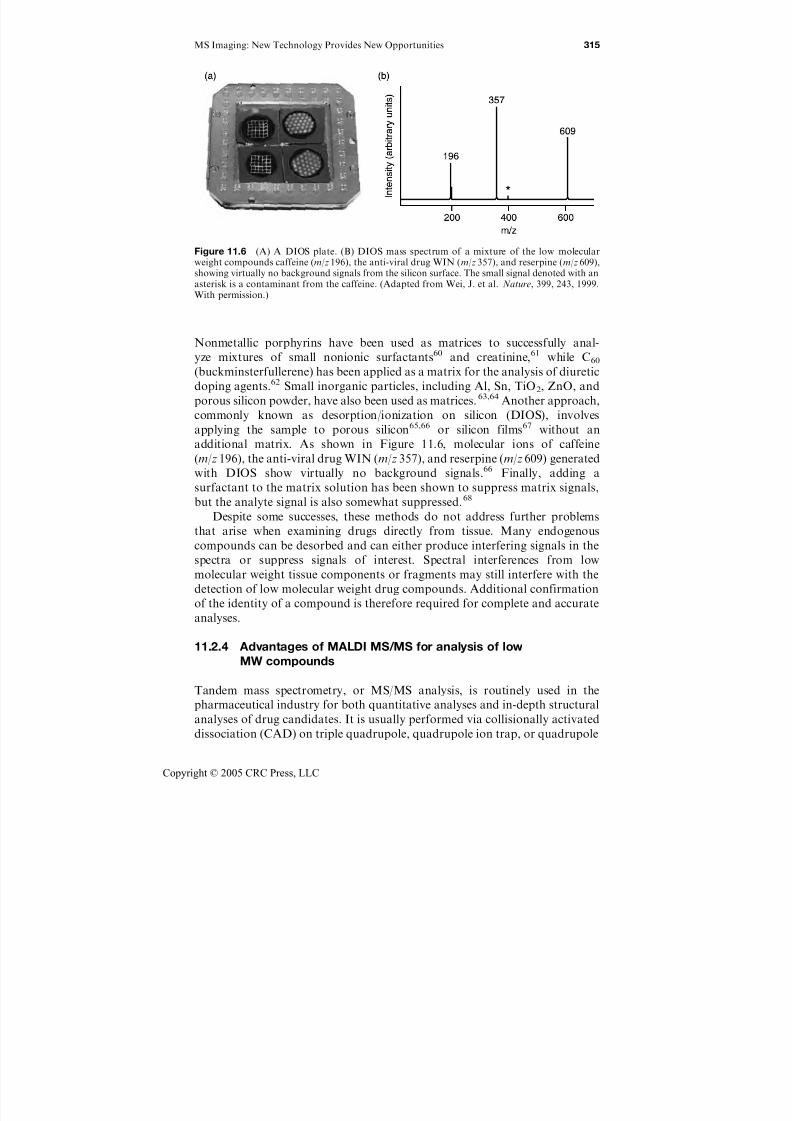
7/21/2019 Using Mass Spectrometry for Drug Metabolism Studies
http://slidepdf.com/reader/full/using-mass-spectrometry-for-drug-metabolism-studies 322/362
Nonmetallic porphyrins have been used as matrices to successfully anal-
yze mixtures of small nonionic surfactants60 and creatinine,61 while C60
(buckminsterfullerene) has been applied as a matrix for the analysis of diuretic
doping agents.62 Small inorganic particles, including Al, Sn, TiO2, ZnO, andporous silicon powder, have also been used as matrices.63,64 Another approach,
commonly known as desorption/ionization on silicon (DIOS), involves
applying the sample to porous silicon65,66 or silicon films67 without an
additional matrix. As shown in Figure 11.6, molecular ions of caffeine
(m/z 196), the anti-viral drug WIN (m/z 357), and reserpine (m/z 609) generated
with DIOS show virtually no background signals.66 Finally, adding a
surfactant to the matrix solution has been shown to suppress matrix signals,
but the analyte signal is also somewhat suppressed.68
Despite some successes, these methods do not address further problems
that arise when examining drugs directly from tissue. Many endogenous
compounds can be desorbed and can either produce interfering signals in the
spectra or suppress signals of interest. Spectral interferences from low
molecular weight tissue components or fragments may still interfere with the
detection of low molecular weight drug compounds. Additional confirmation
of the identity of a compound is therefore required for complete and accurate
analyses.
11.2.4 Advantages of MALDI MS/MS for analysis of low
MW compounds
Tandem mass spectrometry, or MS/MS analysis, is routinely used in the
pharmaceutical industry for both quantitative analyses and in-depth structural
analyses of drug candidates. It is usually performed via collisionally activated
dissociation (CAD) on triple quadrupole, quadrupole ion trap, or quadrupole
Figure 11.6 (A) A DIOS plate. (B) DIOS mass spectrum of a mixture of the low molecularweight compounds caffeine (m/z 196), the anti-viral drug WIN (m/z 357), and reserpine (m/z 609),showing virtually no background signals from the silicon surface. The small signal denoted with anasterisk is a contaminant from the caffeine. (Adapted from Wei, J. et al. Nature, 399, 243, 1999.With permission.)
MS Imaging: New Technology Provides New Opportunities 315
Copyright © 2005 CRC Press, LLC
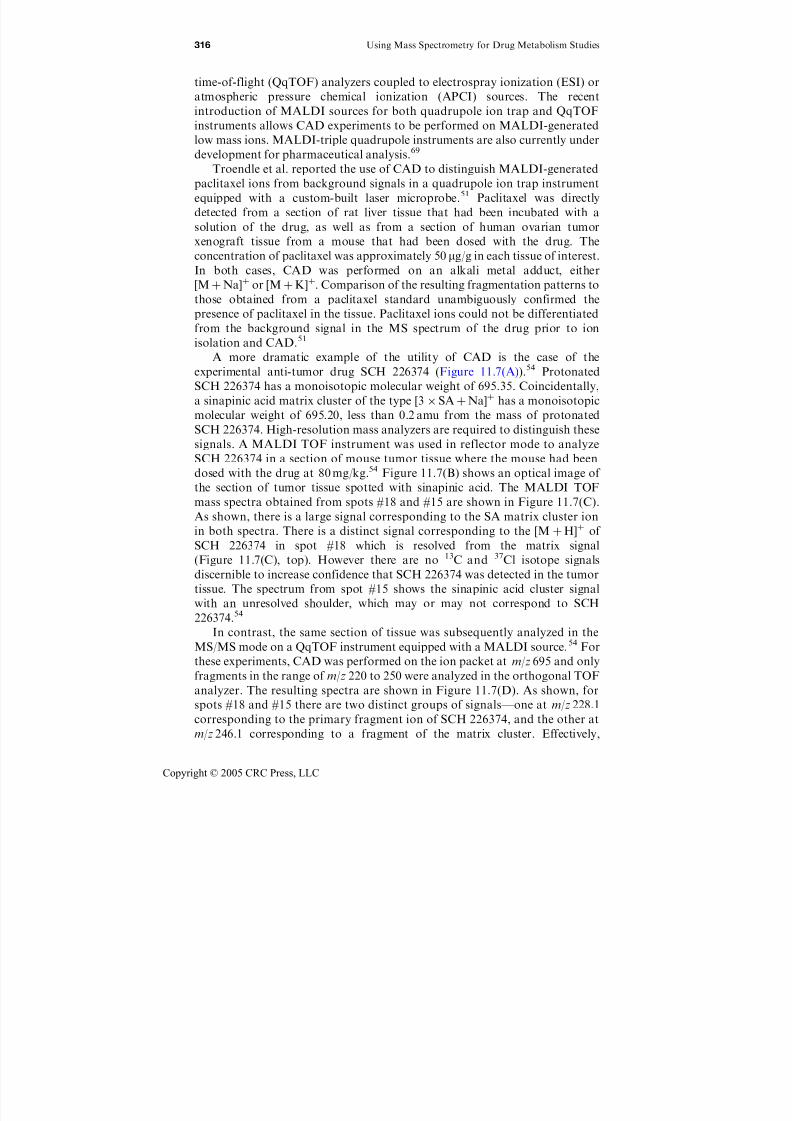
7/21/2019 Using Mass Spectrometry for Drug Metabolism Studies
http://slidepdf.com/reader/full/using-mass-spectrometry-for-drug-metabolism-studies 323/362
time-of-flight (QqTOF) analyzers coupled to electrospray ionization (ESI) or
atmospheric pressure chemical ionization (APCI) sources. The recent
introduction of MALDI sources for both quadrupole ion trap and QqTOF
instruments allows CAD experiments to be performed on MALDI-generatedlow mass ions. MALDI-triple quadrupole instruments are also currently under
development for pharmaceutical analysis.69
Troendle et al. reported the use of CAD to distinguish MALDI-generated
paclitaxel ions from background signals in a quadrupole ion trap instrument
equipped with a custom-built laser microprobe.51 Paclitaxel was directly
detected from a section of rat liver tissue that had been incubated with a
solution of the drug, as well as from a section of human ovarian tumor
xenograft tissue from a mouse that had been dosed with the drug. The
concentration of paclitaxel was approximately 50 mg/g in each tissue of interest.In both cases, CAD was performed on an alkali metal adduct, either
[MþNa]þ or [MþK]þ. Comparison of the resulting fragmentation patterns to
those obtained from a paclitaxel standard unambiguously confirmed the
presence of paclitaxel in the tissue. Paclitaxel ions could not be differentiated
from the background signal in the MS spectrum of the drug prior to ion
isolation and CAD.51
A more dramatic example of the utility of CAD is the case of the
experimental anti-tumor drug SCH 226374 (Figure 11.7(A)).54 Protonated
SCH 226374 has a monoisotopic molecular weight of 695.35. Coincidentally,a sinapinic acid matrix cluster of the type [3SAþNa]þ has a monoisotopic
molecular weight of 695.20, less than 0.2 amu from the mass of protonated
SCH 226374. High-resolution mass analyzers are required to distinguish these
signals. A MALDI TOF instrument was used in reflector mode to analyze
SCH 226374 in a section of mouse tumor tissue where the mouse had been
dosed with the drug at 80 mg/kg.54 Figure 11.7(B) shows an optical image of
the section of tumor tissue spotted with sinapinic acid. The MALDI TOF
mass spectra obtained from spots #18 and #15 are shown in Figure 11.7(C).
As shown, there is a large signal corresponding to the SA matrix cluster ion
in both spectra. There is a distinct signal corresponding to the [MþH]þ of
SCH 226374 in spot #18 which is resolved from the matrix signal
(Figure 11.7(C), top). However there are no 13C and 37Cl isotope signals
discernible to increase confidence that SCH 226374 was detected in the tumor
tissue. The spectrum from spot #15 shows the sinapinic acid cluster signal
with an unresolved shoulder, which may or may not correspond to SCH
226374.54
In contrast, the same section of tissue was subsequently analyzed in the
MS/MS mode on a QqTOF instrument equipped with a MALDI source.54 For
these experiments, CAD was performed on the ion packet at m/z 695 and only
fragments in the range of m/z 220 to 250 were analyzed in the orthogonal TOF
analyzer. The resulting spectra are shown in Figure 11.7(D). As shown, for
spots #18 and #15 there are two distinct groups of signals—one at m/z 228.1
corresponding to the primary fragment ion of SCH 226374, and the other at
m/z 246.1 corresponding to a fragment of the matrix cluster. Effectively,
316 Using Mass Spectrometry for Drug Metabolism Studies
Copyright © 2005 CRC Press, LLC
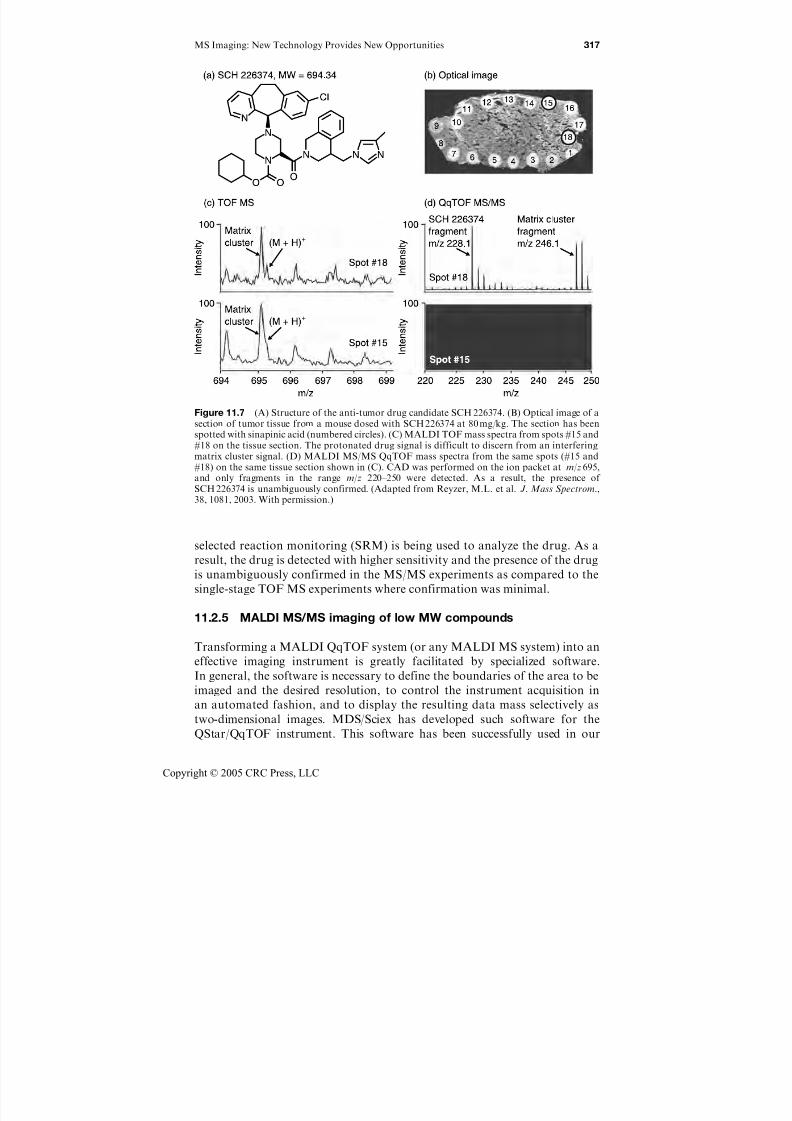
7/21/2019 Using Mass Spectrometry for Drug Metabolism Studies
http://slidepdf.com/reader/full/using-mass-spectrometry-for-drug-metabolism-studies 324/362
selected reaction monitoring (SRM) is being used to analyze the drug. As a
result, the drug is detected with higher sensitivity and the presence of the drug
is unambiguously confirmed in the MS/MS experiments as compared to the
single-stage TOF MS experiments where confirmation was minimal.
11.2.5 MALDI MS/MS imaging of low MW compounds
Transforming a MALDI QqTOF system (or any MALDI MS system) into an
effective imaging instrument is greatly facilitated by specialized software.
In general, the software is necessary to define the boundaries of the area to be
imaged and the desired resolution, to control the instrument acquisition in
an automated fashion, and to display the resulting data mass selectively as
two-dimensional images. MDS/Sciex has developed such software for the
QStar/QqTOF instrument. This software has been successfully used in our
Figure 11.7 (A) Structure of the anti-tumor drug candidate SCH 226374. (B) Optical image of asection of tumor tissue from a mouse dosed with SCH 226374 at 80 mg/kg. The section has beenspotted with sinapinic acid (numbered circles). (C) MALDI TOF mass spectra from spots #15 and#18 on the tissue section. The protonated drug signal is difficult to discern from an interferingmatrix cluster signal. (D) MALDI MS/MS QqTOF mass spectra from the same spots (#15 and#18) on the same tissue section shown in (C). CAD was performed on the ion packet at m/z 695,and only fragments in the range m/z 220–250 were detected. As a result, the presence of SCH 226374 is unambiguously confirmed. (Adapted from Reyzer, M.L. et al. J. Mass Spectrom.,38, 1081, 2003. With permission.)
MS Imaging: New Technology Provides New Opportunities 317
Copyright © 2005 CRC Press, LLC
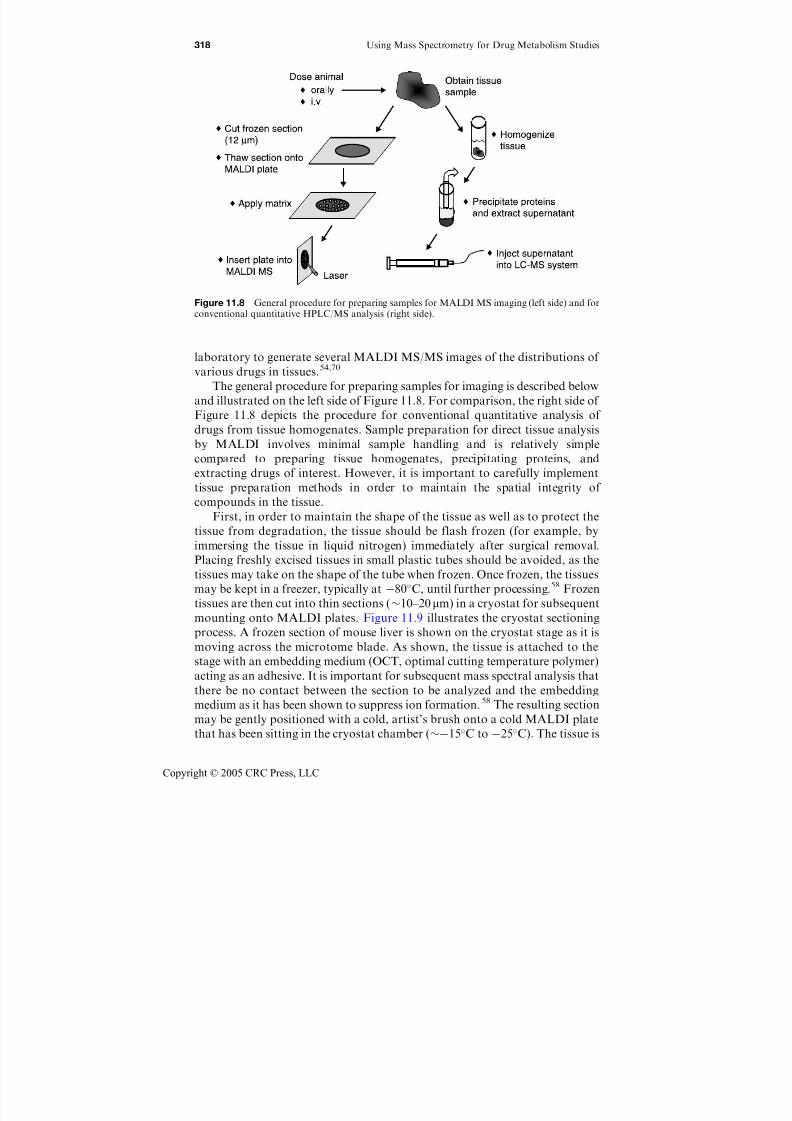
7/21/2019 Using Mass Spectrometry for Drug Metabolism Studies
http://slidepdf.com/reader/full/using-mass-spectrometry-for-drug-metabolism-studies 325/362
laboratory to generate several MALDI MS/MS images of the distributions of
various drugs in tissues.54,70
The general procedure for preparing samples for imaging is described belowand illustrated on the left side of Figure 11.8. For comparison, the right side of
Figure 11.8 depicts the procedure for conventional quantitative analysis of
drugs from tissue homogenates. Sample preparation for direct tissue analysis
by MALDI involves minimal sample handling and is relatively simple
compared to preparing tissue homogenates, precipitating proteins, and
extracting drugs of interest. However, it is important to carefully implement
tissue preparation methods in order to maintain the spatial integrity of
compounds in the tissue.
First, in order to maintain the shape of the tissue as well as to protect the
tissue from degradation, the tissue should be flash frozen (for example, by
immersing the tissue in liquid nitrogen) immediately after surgical removal.
Placing freshly excised tissues in small plastic tubes should be avoided, as the
tissues may take on the shape of the tube when frozen. Once frozen, the tissues
may be kept in a freezer, typically at 80C, until further processing.58 Frozen
tissues are then cut into thin sections (10–20 mm) in a cryostat for subsequent
mounting onto MALDI plates. Figure 11.9 illustrates the cryostat sectioning
process. A frozen section of mouse liver is shown on the cryostat stage as it is
moving across the microtome blade. As shown, the tissue is attached to the
stage with an embedding medium (OCT, optimal cutting temperature polymer)
acting as an adhesive. It is important for subsequent mass spectral analysis that
there be no contact between the section to be analyzed and the embedding
medium as it has been shown to suppress ion formation.58 The resulting section
may be gently positioned with a cold, artist’s brush onto a cold MALDI plate
that has been sitting in the cryostat chamber (15C to 25C). The tissue is
Figure 11.8 General procedure for preparing samples for MALDI MS imaging (left side) and forconventional quantitative HPLC/MS analysis (right side).
318 Using Mass Spectrometry for Drug Metabolism Studies
Copyright © 2005 CRC Press, LLC
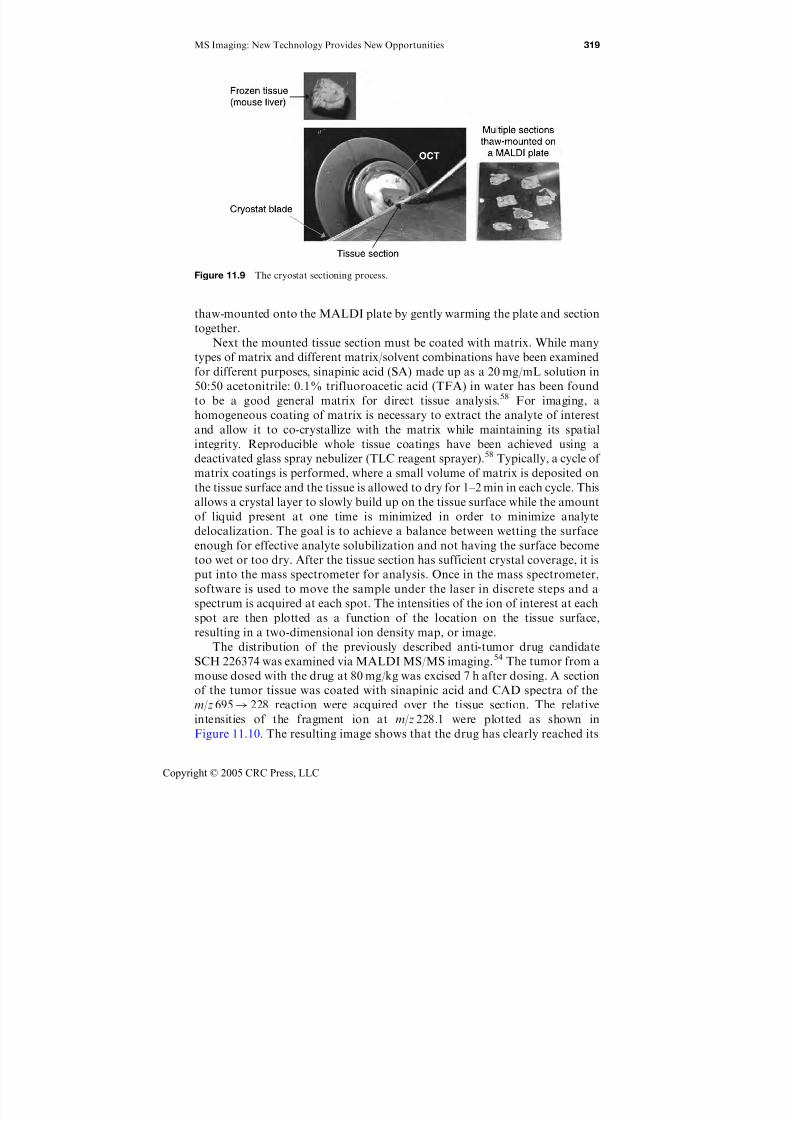
7/21/2019 Using Mass Spectrometry for Drug Metabolism Studies
http://slidepdf.com/reader/full/using-mass-spectrometry-for-drug-metabolism-studies 326/362
thaw-mounted onto the MALDI plate by gently warming the plate and section
together.
Next the mounted tissue section must be coated with matrix. While many
types of matrix and different matrix/solvent combinations have been examined
for different purposes, sinapinic acid (SA) made up as a 20 mg/mL solution in
50:50 acetonitrile: 0.1% trifluoroacetic acid (TFA) in water has been foundto be a good general matrix for direct tissue analysis.58 For imaging, a
homogeneous coating of matrix is necessary to extract the analyte of interest
and allow it to co-crystallize with the matrix while maintaining its spatial
integrity. Reproducible whole tissue coatings have been achieved using a
deactivated glass spray nebulizer (TLC reagent sprayer).58 Typically, a cycle of
matrix coatings is performed, where a small volume of matrix is deposited on
the tissue surface and the tissue is allowed to dry for 1–2 min in each cycle. This
allows a crystal layer to slowly build up on the tissue surface while the amount
of liquid present at one time is minimized in order to minimize analyte
delocalization. The goal is to achieve a balance between wetting the surface
enough for effective analyte solubilization and not having the surface become
too wet or too dry. After the tissue section has sufficient crystal coverage, it is
put into the mass spectrometer for analysis. Once in the mass spectrometer,
software is used to move the sample under the laser in discrete steps and a
spectrum is acquired at each spot. The intensities of the ion of interest at each
spot are then plotted as a function of the location on the tissue surface,
resulting in a two-dimensional ion density map, or image.
The distribution of the previously described anti-tumor drug candidate
SCH 226374 was examined via MALDI MS/MS imaging.54 The tumor from a
mouse dosed with the drug at 80 mg/kg was excised 7 h after dosing. A section
of the tumor tissue was coated with sinapinic acid and CAD spectra of the
m/z 695! 228 reaction were acquired over the tissue section. The relative
intensities of the fragment ion at m/z 228.1 were plotted as shown in
Figure 11.10. The resulting image shows that the drug has clearly reached its
Figure 11.9 The cryostat sectioning process.
MS Imaging: New Technology Provides New Opportunities 319
Copyright © 2005 CRC Press, LLC
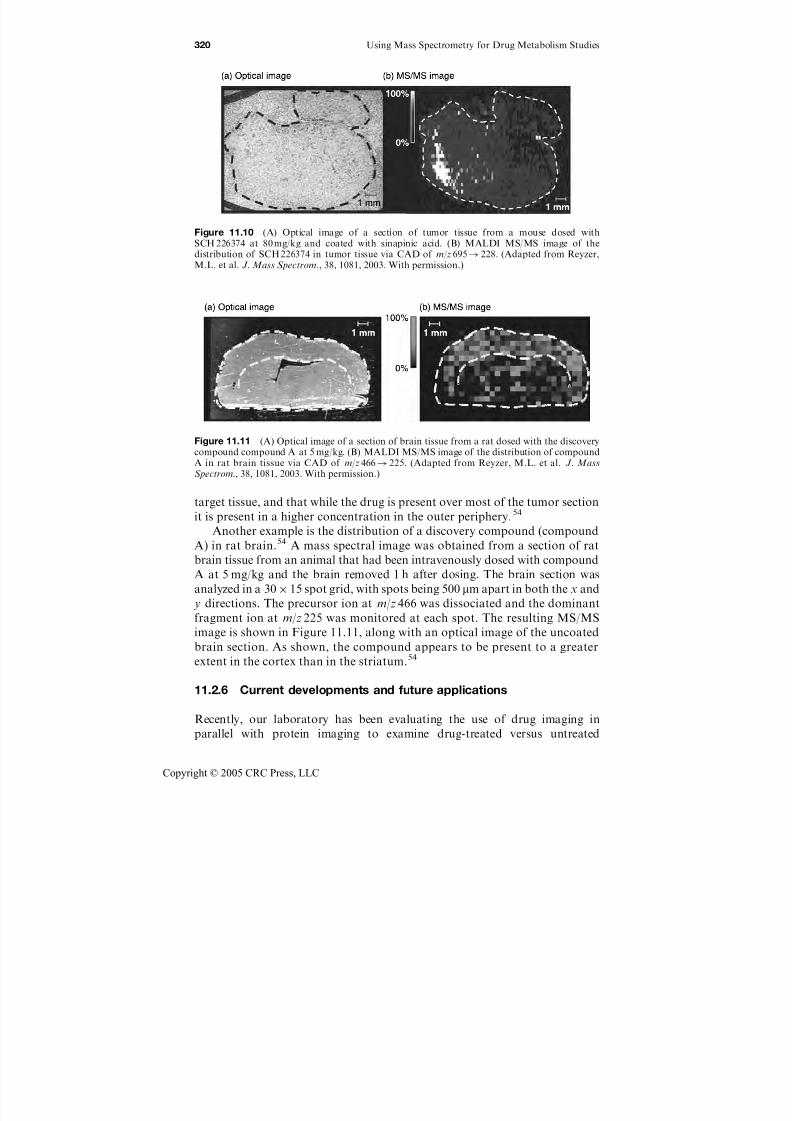
7/21/2019 Using Mass Spectrometry for Drug Metabolism Studies
http://slidepdf.com/reader/full/using-mass-spectrometry-for-drug-metabolism-studies 327/362
target tissue, and that while the drug is present over most of the tumor section
it is present in a higher concentration in the outer periphery.54
Another example is the distribution of a discovery compound (compound
A) in rat brain.54 A mass spectral image was obtained from a section of rat
brain tissue from an animal that had been intravenously dosed with compound
A at 5 mg/kg and the brain removed 1 h after dosing. The brain section was
analyzed in a 30 15 spot grid, with spots being 500 mm apart in both the x and
y directions. The precursor ion at m/z 466 was dissociated and the dominant
fragment ion at m/z 225 was monitored at each spot. The resulting MS/MS
image is shown in Figure 11.11, along with an optical image of the uncoated
brain section. As shown, the compound appears to be present to a greater
extent in the cortex than in the striatum.54
11.2.6 Current developments and future applications
Recently, our laboratory has been evaluating the use of drug imaging in
parallel with protein imaging to examine drug-treated versus untreated
Figure 11.10 (A) Optical image of a section of tumor tissue from a mouse dosed withSCH 226374 at 80 mg/kg and coated with sinapinic acid. (B) MALDI MS/MS image of the
distribution of SCH 226374 in tumor tissue via CAD of m/z 695! 228. (Adapted from Reyzer,M.L. et al. J. Mass Spectrom., 38, 1081, 2003. With permission.)
Figure 11.11 (A) Optical image of a section of brain tissue from a rat dosed with the discoverycompound compound A at 5 mg/kg. (B) MALDI MS/MS image of the distribution of compoundA in rat brain tissue via CAD of m/z 466! 225. (Adapted from Reyzer, M.L. et al. J. MassSpectrom., 38, 1081, 2003. With permission.)
320 Using Mass Spectrometry for Drug Metabolism Studies
Copyright © 2005 CRC Press, LLC

7/21/2019 Using Mass Spectrometry for Drug Metabolism Studies
http://slidepdf.com/reader/full/using-mass-spectrometry-for-drug-metabolism-studies 328/362
samples.70 It is expected that as a drug is administered and accumulates in a
tumor, changes will occur to the proteome of the tumor tissue. Some proteins
may be upregulated while others may be downregulated. Presumably, these
molecular changes may be observed much earlier than any physiological
changes, such as tumor shrinkage, and thus may be useful predictors of the
effectiveness of a given therapy. MALDI imaging techniques make it possible
to monitor both drug accumulation and protein distribution in the same tissue.
Consequently, the relationship between a drug and its resulting protein changesmay be readily observed.
OSI-774 is a small molecule tyrosine kinase inhibitor of the epidermal
growth factor (EGF) receptor,71 which is highly expressed in many forms of
human cancer. It has been observed that MMTV/HER2 tumors in mice show
significant reduction in tumor volume after being dosed with OSI-774 at
100 mg/kg compared to untreated tumors. The distribution of OSI-774 in a
section of mouse tumor removed 16 h after dosing with 100 mg/kg OSI-774 was
determined by imaging MS/MS analysis. The CAD transition m/z 394! 278
was monitored, and the intensity of the main fragment ion at m/z 278 was
plotted as shown in Figure 11.12. As shown, the drug appears to be present
throughout the tumor section.70 (No drug was observed in untreated tumor
tissue.)
Subsequently, the protein distributions in a section of untreated tumor
tissue and a section of tumor tissue treated with OSI-774 (100 mg/kg, removed
16 h after dosing) were determined by MALDI TOF MS analysis.70 Four
selected ion images, along with an optical image of the uncoated tissue sections
are shown in Figure 11.13. As shown, the four selected signals are present
fairly homogeneously across the untreated tumor section (Figure 11.13, top
row). The histone signal at m/z 11,344 and the signal at m/z 4747 are also
homogeneously distributed across the OSI-774 treated tumor section
(Figure 11.13, bottom row). However, the intensities of thymosin b4 at m/z
4965 and ubiquitin at m/z 8562 are significantly decreased in the dosed tumor
compared to the non-dosed tissue, indicating the drug is having a significant
effect on the proteome of the tissue. While it may take days to ascertain the
Figure 11.12 (A) Optical image of a section of tumor tissue from a mouse dosed with the anti-tumor drug OSI-774 at 100 mg/kg. (B) MALDI MS/MS image of the distribution of OSI-774 inmouse tumor tissue via CAD of m/z 394! 278.
MS Imaging: New Technology Provides New Opportunities 321
Copyright © 2005 CRC Press, LLC
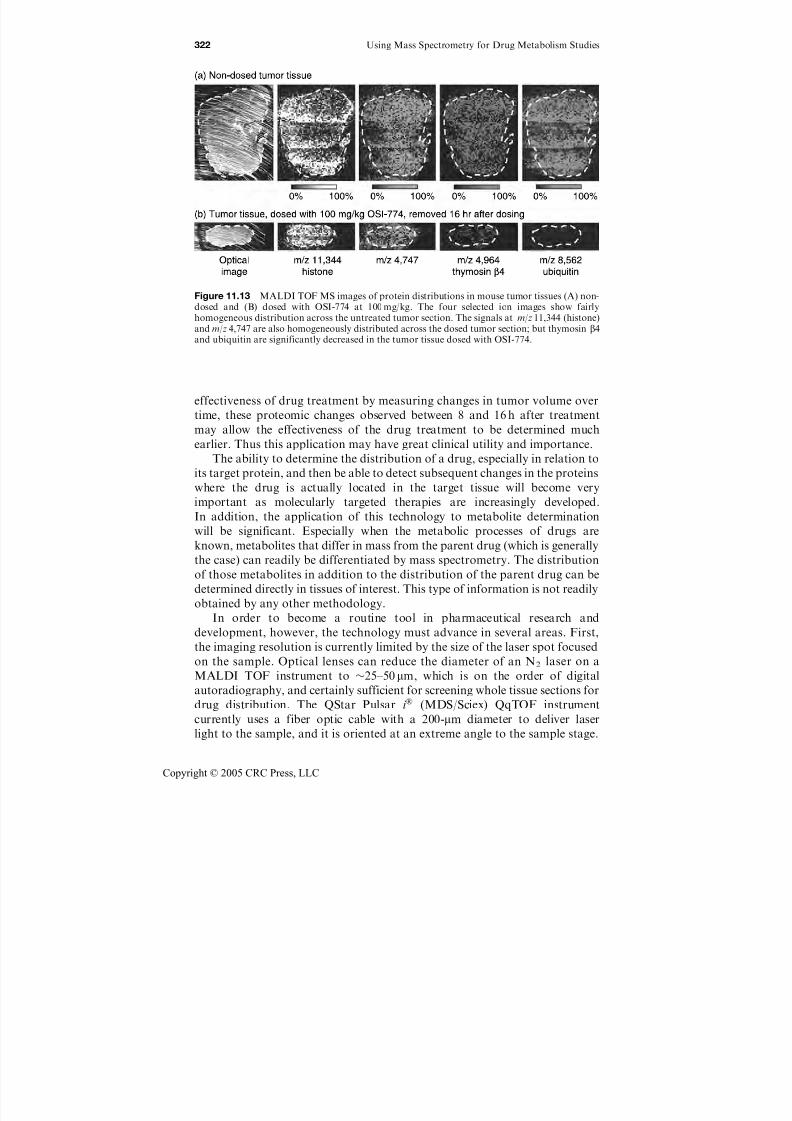
7/21/2019 Using Mass Spectrometry for Drug Metabolism Studies
http://slidepdf.com/reader/full/using-mass-spectrometry-for-drug-metabolism-studies 329/362
effectiveness of drug treatment by measuring changes in tumor volume over
time, these proteomic changes observed between 8 and 16 h after treatment
may allow the effectiveness of the drug treatment to be determined much
earlier. Thus this application may have great clinical utility and importance.
The ability to determine the distribution of a drug, especially in relation to
its target protein, and then be able to detect subsequent changes in the proteins
where the drug is actually located in the target tissue will become very
important as molecularly targeted therapies are increasingly developed.
In addition, the application of this technology to metabolite determination
will be significant. Especially when the metabolic processes of drugs are
known, metabolites that differ in mass from the parent drug (which is generally
the case) can readily be differentiated by mass spectrometry. The distribution
of those metabolites in addition to the distribution of the parent drug can be
determined directly in tissues of interest. This type of information is not readily
obtained by any other methodology.
In order to become a routine tool in pharmaceutical research and
development, however, the technology must advance in several areas. First,
the imaging resolution is currently limited by the size of the laser spot focused
on the sample. Optical lenses can reduce the diameter of an N2 laser on a
MALDI TOF instrument to 25–50 mm, which is on the order of digital
autoradiography, and certainly sufficient for screening whole tissue sections for
drug distribution. The QStar Pulsar i (MDS/Sciex) QqTOF instrument
currently uses a fiber optic cable with a 200-mm diameter to deliver laser
light to the sample, and it is oriented at an extreme angle to the sample stage.
Figure 11.13 MALDI TOF MS images of protein distributions in mouse tumor tissues (A) non-dosed and (B) dosed with OSI-774 at 100 mg/kg. The four selected ion images show fairlyhomogeneous distribution across the untreated tumor section. The signals at m/z 11,344 (histone)and m/z 4,747 are also homogeneously distributed across the dosed tumor section; but thymosin b4and ubiquitin are significantly decreased in the tumor tissue dosed with OSI-774.
322 Using Mass Spectrometry for Drug Metabolism Studies
Copyright © 2005 CRC Press, LLC
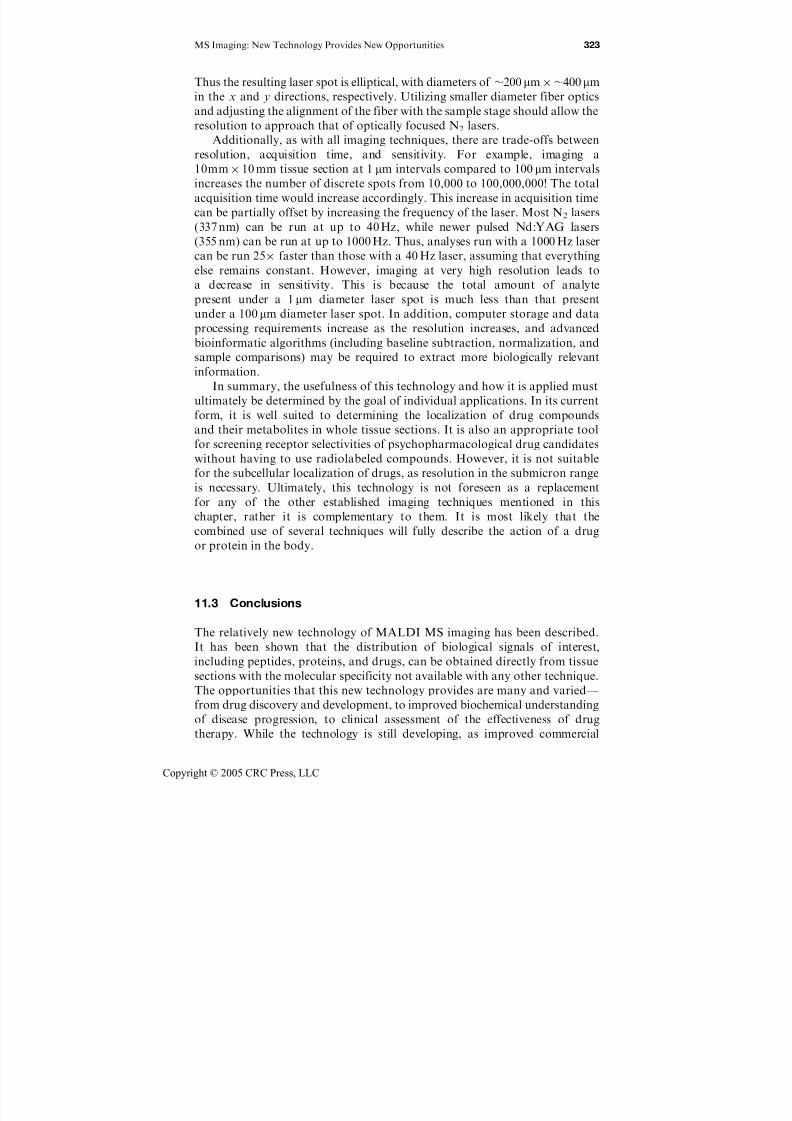
7/21/2019 Using Mass Spectrometry for Drug Metabolism Studies
http://slidepdf.com/reader/full/using-mass-spectrometry-for-drug-metabolism-studies 330/362
Thus the resulting laser spot is elliptical, with diameters of 200 mm400 mm
in the x and y directions, respectively. Utilizing smaller diameter fiber optics
and adjusting the alignment of the fiber with the sample stage should allow the
resolution to approach that of optically focused N2 lasers.Additionally, as with all imaging techniques, there are trade-offs between
resolution, acquisition time, and sensitivity. For example, imaging a
10mm 10 mm tissue section at 1 mm intervals compared to 100 mm intervals
increases the number of discrete spots from 10,000 to 100,000,000! The total
acquisition time would increase accordingly. This increase in acquisition time
can be partially offset by increasing the frequency of the laser. Most N2 lasers
(337 nm) can be run at up to 40 Hz, while newer pulsed Nd:YAG lasers
(355 nm) can be run at up to 1000 Hz. Thus, analyses run with a 1000 Hz laser
can be run 25 faster than those with a 40 Hz laser, assuming that everythingelse remains constant. However, imaging at very high resolution leads to
a decrease in sensitivity. This is because the total amount of analyte
present under a 1 mm diameter laser spot is much less than that present
under a 100 mm diameter laser spot. In addition, computer storage and data
processing requirements increase as the resolution increases, and advanced
bioinformatic algorithms (including baseline subtraction, normalization, and
sample comparisons) may be required to extract more biologically relevant
information.
In summary, the usefulness of this technology and how it is applied mustultimately be determined by the goal of individual applications. In its current
form, it is well suited to determining the localization of drug compounds
and their metabolites in whole tissue sections. It is also an appropriate tool
for screening receptor selectivities of psychopharmacological drug candidates
without having to use radiolabeled compounds. However, it is not suitable
for the subcellular localization of drugs, as resolution in the submicron range
is necessary. Ultimately, this technology is not foreseen as a replacement
for any of the other established imaging techniques mentioned in this
chapter, rather it is complementary to them. It is most likely that the
combined use of several techniques will fully describe the action of a drug
or protein in the body.
11.3 Conclusions
The relatively new technology of MALDI MS imaging has been described.
It has been shown that the distribution of biological signals of interest,
including peptides, proteins, and drugs, can be obtained directly from tissue
sections with the molecular specificity not available with any other technique.
The opportunities that this new technology provides are many and varied—
from drug discovery and development, to improved biochemical understanding
of disease progression, to clinical assessment of the effectiveness of drug
therapy. While the technology is still developing, as improved commercial
MS Imaging: New Technology Provides New Opportunities 323
Copyright © 2005 CRC Press, LLC

7/21/2019 Using Mass Spectrometry for Drug Metabolism Studies
http://slidepdf.com/reader/full/using-mass-spectrometry-for-drug-metabolism-studies 331/362
instruments and imaging software become more widely available, the
applications and opportunities afforded by this technique will only increase.
11.4 Acknowledgments
The authors acknowledge support from the National Institutes of Health
(NIH/NIGMS 5R01 GM 58008). MLR acknowledges Philip Morris Inc. for a
post-doctoral research fellowship.
References
1. Boy, C. et al. Imaging dopamine D4 receptors in the living primate brain:
A positron emission tomography study using the novel D1/D4 antagonist [11C]SDZ
GLC 756, Synapse, 30, 341, 1998.
2. Ekesbo, A. et al. Effects of the substituted (S )-3-phenylpiperidine ()-OSU6162 on
PET measurements of [11C]SCH23390 and [11C]raclopride binding in primate
brains, Neuropharmacology, 38, 331, 1999.
3. Saleem, A. et al. Modulation of fluorouracil tissue pharmacokinetics by eniluracil:
In-vivo imaging of drug action, Lancet, 355, 2125, 2000.
4. Moresco, R.M. et al. PET in psychopharmacology, Pharmacol. Res., 44(3), 151,
2001.
5. Ishiwata, K. et al. Positron emission tomography and ex vivo and in vitro
autoradiography studies on dopamine D2-like receptor degeneration in the
quinolinic acid-lesioned rat striatum: Comparison of [11C]raclopride,
[11C]nemonapride, and [11C]n-methylspiperone, Nucl. Med. Biol., 29, 307, 2002.
6. Kassiou, M. et al. (þ)-[76Br]A-69024: A non-benzazepine radioligand for studies of
dopamine D1 receptors using PET, Nucl. Med. Biol., 29, 295, 2002.
7. Aboagye, E.O. and Price, P.M., Use of positron emission tomography in anticancer
drug development, Invest. New Drugs, 21, 169, 2003.8. Singh, M. and Waluch, V., Physics and instrumentation for imaging in-vivo drug
distribution, Adv. Drug Delivery Rev., 41, 7, 2000.
9. Port, R.E. and Wolf, W., Noninvasive methods to study drug distribution, Invest.
New Drugs, 21, 157, 2003.
10. Faas, H. et al. Monitoring the intragastric distribution of a colloidal drug carrier
model by magnetic resonance imaging, Pharm. Res., 18(4), 460, 2001.
11. Kupriyanov, V.V. et al. The effects of drugs modulating Kþ transport on Rbþ
uptake and distribution in pig hearts following regional ischemia: 87Rb MRI study,
NMR Biomed., 15, 348, 2002.
12. Noworolski, S.M. et al. High spatial resolution 1H-MRSI and segmented MRI of cortical gray matter and subcortical white matter in three regions of the human
brain, Magnet. Reson. Med., 41, 21, 1999.
13. Bouchard, P. and Quirion, R., [3H]1,3-di(2-tolyl)guanidine and [3H](þ)pentazocine
binding sites in the rat brain: Autoradiographic visualization of the putative sigma1
and sigma2 receptor subtypes, Neuroscience, 76(2), 467, 1997.
14. Goldberg, I.E. et al. Pharmacological characterization of endomorphin-1 and
endomorphin-2 in mouse brain, J. Pharmacol. Exp. Ther., 286(2), 1007, 1998.
324 Using Mass Spectrometry for Drug Metabolism Studies
Copyright © 2005 CRC Press, LLC
7/21/2019 Using Mass Spectrometry for Drug Metabolism Studies
http://slidepdf.com/reader/full/using-mass-spectrometry-for-drug-metabolism-studies 332/362
15. Johansson, M. et al. Distribution of estramustine in the BT4C rat glioma model,
Cancer Chemother. Pharm., 41, 317, 1998.
16. Joyce, J.N., D2 but not D3 receptors are elevated after 9 or 11 months chronic
haloperidol treatment: Influence of withdrawal period, Synapse, 40, 137, 2001.
17. Kaichi, Y. et al. Dopamine D3 receptor binding by D3 agonist 7-OH-DPAT
(7-hydroxy-dipropylaminotetralin) and antipsychotic drugs measured ex vivo by
quantitative autoradiography, Can. J. Physiol. Pharm., 78, 7, 2000.
18. Li, C. et al. Biodistribution of paclitaxel and poly(l-glutamic acid)–paclitaxel
conjugate in mice with ovarian OCa-1 tumor, Cancer Chemother. Pharm., 46, 416,
2000.
19. Schotte, A. et al. Endogenous dopamine limits the binding of antipsychotic drugs to
D3 receptors in the rat brain: A quantitative autoradiographic study, Histochem. J.,
28, 791, 1996.
20. Schotte, A. et al. Risperidone compared with new and reference antipsychoticdrugs: In vitro and in vivo receptor binding, Psychopharmacology, 124, 57,
1996.
21. Solon, E.G. and Kraus, L., Quantitative whole-body autoradiography in the
pharmaceutical industry: Survey results on study design, methods, and regulatory
compliance, J. Pharmacol. Toxicol., 46, 73, 2002.
22. Coe, R.A.J., Quantitative whole-body autoradiography, Regul. Toxicol. Pharm., 31,
S1, 2000.
23. Langlois, X. et al. Use of the beta-imager for rapid ex vivo autoradiography
exemplified with central nervous system penetrating neurokinin 3 antagonists,
J. Pharmacol. Exp. Ther., 299(2), 712, 2001.24. Tribollet, E. et al. Localization and quantitation of tritiated compounds in tissue
sections with a gaseous detector of beta particles: Comparison with film
autoradiography, Proc. Natl. Acad. Sci., 88, 1466, 1991.
25. Charpak, G., Dominik, W., and Zaganidis, N., Optical imaging of the spatial
distribution of beta-particles emerging from surfaces, Proc. Natl. Acad. Sci., 86,
1741, 1989.
26. Lees, J.E. et al. An MCP-based system for beta autoradiography, IEEE Trans.
Nucl. Sci., 46(3), 636, 1999.
27. Lees, J.E., Fraser, G.W., and Carthew, P., Microchannel plate detectors for
14
Cautoradiography, IEEE Trans. Nucl. Sci., 45(3), 1288, 1998.
28. Pacholski, M.L. and Winograd, N., Imaging with mass spectrometry, Chem. Rev.,
99, 2977, 1999.
29. Pacholski, M.L. et al. Static time-of-flight secondary ion mass spectrometry
imaging of freeze-fractured, frozen-hydrated biological membranes, Rapid
Commun. Mass Spectrom., 12, 1232, 1998.
30. Audinot, J.-N. et al. Detection and quantification of benzodiazepines in hair by
TOF-SIMS: Preliminary results, Appl. Surf. Sci., 203–204, 718, 2003.
31. Winograd, N., Prospects for imaging TOF-SIMS: From fundamentals to
biotechnology, Appl. Surf. Sci., 203–204, 13, 2003.32. Guerquin-Kern, J.-L. et al. Complementary advantages of fluorescence and SIMS
microscopies in the study of cellular localization of two new antitumor drugs,
Microsc. Res. Techniq., 36, 287, 1997.
33. Chandra, S., Lorey II, D.R., and Smith, D.R., Quantitative subcellular secondary
ion mass spectrometry (SIMS) imaging of boron-10 and boron-11 isotopes in the
same cell delivered by two combined BNCT drugs: In vitro studies on human
glioblastoma T98G cells, Radiat. Res., 157, 700, 2002.
MS Imaging: New Technology Provides New Opportunities 325
Copyright © 2005 CRC Press, LLC
7/21/2019 Using Mass Spectrometry for Drug Metabolism Studies
http://slidepdf.com/reader/full/using-mass-spectrometry-for-drug-metabolism-studies 333/362
34. Bennett, B.D. et al. Subcellular localization of p-boronophenylalanine-delivered
boron-10 in the rat 9L gliosarcoma: Cryogenic preparation in vitro and in vivo,
Radiat. Res., 140, 72, 1994.
35. Fragu, P. and Kahn, E., Secondary ion mass spectrometry (SIMS) microscopy:
A new tool for pharmacological studies in humans, Microsc. Res. Techniq., 36, 296,
1997.
36. Todd, P.J. et al. Organic ion imaging of biological tissue with secondary ion mass
spectrometry and matrix-assisted laser desorption/ionization, J. Mass Spectrom.,
36, 355, 2001.
37. McCandlish, C.A., McMahon, J.M., and Todd, P.J., Secondary ion images of the
rodent brain, J. Am. Soc. Mass Spectrom., 11, 191, 2000.
38. Todd, P.J. et al. Organic SIMS of biologic tissue, Anal. Chem., 69, 529A, 1997.
39. Smith, D.R. et al. Ion microscopy imaging of 10B from p-boronophenylalanine in a
brain tumor model for boron neutron capture therapy, Cancer Res., 56, 4302, 1996.40. Wong, S.C.C. et al. Development of a C60
þ ion gun for static SIMS and chemical
imaging, Appl. Surf. Sci., 203-204, 219, 2003.
41. Karas, M. et al. Matrix-assisted ultraviolet laser desorption of non-volatile
compounds, Int. J. Mass Spectrom. Ion Proc., 78, 53, 1987.
42. Karas, M. and Hillenkamp, F., Laser desorption ionization of proteins with
molecular masses exceeding 10,000 daltons, Anal. Chem., 60(20), 2299, 1988.
43. Li, L., Garden, R.W., and Sweedler, J.V., Single-cell MALDI: A new tool for direct
peptide profiling, Trends Biotechnol., 18(4), 151, 2000.
44. Caprioli, R.M., Farmer, T.B., and Gile, J., Molecular imaging of biological
samples: Localization of peptides and proteins using MALDI-TOF MS, Anal.Chem., 69(23), 4751, 1997.
45. Chaurand, P., Stoeckli, M., and Caprioli, R.M., Direct profiling of proteins in
biological tissue sections by MALDI mass spectrometry, Anal. Chem., 71(23), 5263,
1999.
46. Dreisewerd, K. et al. Direct mass spectrometric peptide profiling and sequencing of
nervous tissues to identify peptides involved in male copulatory behavior in
Lymnaea stagnalis, Int. J. Mass Spectrom. Ion Proc., 169/170, 291, 1997.
47. Garden, R.W. et al. Excess salt removal with matrix rinsing: Direct peptide profiling
of neurons from marine invertebrates using matrix-assisted laser desorption/ionization time-of-flight mass spectrometry, J. Mass Spectrom., 31(10), 1126, 1996.
48. Palmer-Toy, D.E. et al. Direct acquisition of matrix-assisted laser desorption/
ionization time-of-flight mass spectra from laser capture microdissected tissues,
Clin. Chem., 46(9), 1513, 2000.
49. Redeker, V. et al. Combination of peptide profiling by matrix-assisted laser
desorption/ionization time-of-flight mass spectrometry and immunodetection on
single glands or cells, Anal. Chem., 70(9), 1805, 1998.
50. Stoeckli, M. et al. Imaging mass spectrometry: A new technology for the analysis of
protein expression in mammalian tissues, Nature Med., 7(4), 493, 2001.
51. Troendle, F.J., Reddick, C.D., and Yost, R.A., Detection of pharmaceuticalcompounds in tissue by matrix-assisted laser desorption/ionization and laser
desorption/chemical ionization tandem mass spectrometry with a quadrupole ion
trap, J. Am. Soc. Mass Spectrom., 10, 1315, 1999.
52. van Veelen, P.A. et al. Direct peptide profiling of single neurons by matrix-assisted
laser desorption–ionization mass spectrometry, Org. Mass Spectrom., 28(12), 1542,
1993.
326 Using Mass Spectrometry for Drug Metabolism Studies
Copyright © 2005 CRC Press, LLC
7/21/2019 Using Mass Spectrometry for Drug Metabolism Studies
http://slidepdf.com/reader/full/using-mass-spectrometry-for-drug-metabolism-studies 334/362
53. Chaurand, P. et al. Profiling and imaging proteins in the mouse epididymis by
imaging mass spectrometry, Proteomics, 3(11), 2221, 2003.
54. Reyzer, M.L. et al. Direct analysis of drug candidates in tissue by matrix-assisted
laser desorption/ionization mass spectrometry, J. Mass Spectrom., 38(10), 1081,
2003.
55. Spengler, B. and Hubert, M., Scanning microprobe matrix-assisted laser desorption
ionization (SMALDI) mass spectrometry: Instrumentation for sub-micrometer
resolved LDI and MALDI surface analysis, J. Am. Soc. Mass Spectrom., 13, 735,
2002.
56. Berkenkamp, S. et al. Performance of infrared matrix-assisted laser desorption/
ionization mass spectrometry with lasers emitting in the 3 mm wavelength range,
Rapid Commun. Mass Spectrom., 11, 1399, 1997.
57. Menzel, C., Berkenkamp, S., and Hillenkamp, F., Infrared matrix-assisted laser
desorption/ionization mass spectrometry with a transversely excited atmosphericpressure carbon dioxide laser at 10.6 mm wavelength with static and delayed ion
extraction, Rapid Commun. Mass Spectrom., 13, 26, 1999.
58. Schwartz, S.A., Reyzer, M.L., and Caprioli, R.M., Direct tissue analysis using
matrix-assisted laser desorption/ionization mass spectrometry: Practical aspects of
sample preparation, J. Mass Spectrom., 38(7), 699, 2003.
59. Krutchinsky, A.N. and Chait, B.T., On the nature of chemical noise in MALDI
mass spectra, J. Am. Soc. Mass Spectrom., 13, 129, 2002.
60. Ayorinde, F.O. et al. Use of meso-tetrakis(pentafluorophenyl)porphyrin as a
matrix for low molecular weight alkylphenol ethoxylates in laser desorption/
ionization time-of-flight mass spectrometry, Rapid Commun. Mass Spectrom.,13, 2474, 1999.
61. Jones, R.M., Lamb, J.H., and Lim, C.K., 5,10,15,20-meso-tetra(hydroxyphenyl)-
chlorin as a matrix for the analysis of low molecular weight compounds by matrix-
assisted laser desorption/ionization time-of-flight mass spectrometry, Rapid
Commun. Mass Spectrom., 9(10), 968, 1995.
62. Huang, J.-P. et al. Rapid screening for diuretic doping agents in urine by C60-
assisted laser-desorption-ionization-time-of-flight mass spectrometry, J. Anal.
Toxicol., 23, 337, 1999.
63. Kinumi, T. et al. Matrix-assisted laser desorption/ionization time-of-flight massspectrometry using an inorganic particle matrix for small molecule analysis, J. Mass
Spectrom., 35, 417, 2000.
64. Zhang, Q. et al. Matrix-assisted laser desorption/ionization mass spectrometry
using porous silicon and silica gel as matrix, Rapid Commun. Mass Spectrom., 15,
217, 2001.
65. Shen, Z. et al. Porous silicon as a versatile platform for laser desorption/ionization
mass spectrometry, Anal. Chem., 73(3), 612, 2001.
66. Wei, J., Buriak, J.M., and Siuzdak, G., Desorption–ionization mass spectrometry
on porous silicon, Nature, 399, 243, 1999.
67. Cuiffi, J.D. et al. Desorption–ionization mass spectrometry using depositednanostructured silicon films, Anal. Chem., 73(6), 1292, 2001.
68. Guo, Z. et al. A method for the analysis of low-mass molecules by MALDI-TOF
mass spectrometry, Anal. Chem., 74, 1637, 2002.
69. Corr, J.J. et al. MALDI MS/MS on a triple quadrupole mass spectrometer: A new
technology for high throughput small molecule quantitation, In Proc. 51st ASMS
Conference, Montreal, Quebec, Canada, 2003.
MS Imaging: New Technology Provides New Opportunities 327
Copyright © 2005 CRC Press, LLC

7/21/2019 Using Mass Spectrometry for Drug Metabolism Studies
http://slidepdf.com/reader/full/using-mass-spectrometry-for-drug-metabolism-studies 335/362
70. Reyzer, M.L. et al. Parallel monitoring of protein and drug expression in
tissues by MALDI MS, In Proc. 51st ASMS Conference, Montreal, Quebec,
Canada, 2003.
71. Hidalgo, M. et al. Phase I and pharmacologic study of OSI-774, and epidermal
growth factor receptor tyrosine kinase inhibitor, in patients with advanced solid
malignancies, J. Clin. Oncol., 19(13), 3267, 2001.
328 Using Mass Spectrometry for Drug Metabolism Studies
Copyright © 2005 CRC Press, LLC
7/21/2019 Using Mass Spectrometry for Drug Metabolism Studies
http://slidepdf.com/reader/full/using-mass-spectrometry-for-drug-metabolism-studies 336/362
Chapter 12
Understanding the Role and Potential ofInfusion Nanoelectrospray Ionization for
Pharmaceutical Bioanalysis
Bradley L. Ackermann and Jean-Marie Dethy
12.1 Introduction
The position of liquid chromatography–tandem mass spectrometry (LC–MS/
MS) as the default method for pharmaceutical bioanalysis is well established.
As described in previous review articles [1–4], LC–MS/MS derives its power by
coupling the versatility of reversed-phase HPLC with the unique combinationof selectivity and sensitivity afforded by tandem MS (MS/MS) detection. These
combined advantages have had a profound impact on every major step of
the bioanalytical process (i.e., method development, sample preparation and
chromatography) leading to enhanced throughput compared to more con-
ventional forms of on-line LC detection. The net result is that it is literally
possible to perform in hours what once took days a decade ago.
The throughput experienced in today’s bioanalytical laboratory was largely
driven by necessity, given the vast increase in demand for sample analysis that
occurred over the same time period. This shift in demand can be correlated
with the increased production of chemical leads resulting from the introduction
of techniques such as high-throughput screening (HTS) and combinato-
rial chemistry. Higher demand for bioanalysis also resulted from the wide-
spread implementation of MS-based methods to assess the in vitro ADME
0-8493-1963-3/05/$0.00+$1.50 2005 by CRC Press 329
Copyright © 2005 CRC Press, LLC
7/21/2019 Using Mass Spectrometry for Drug Metabolism Studies
http://slidepdf.com/reader/full/using-mass-spectrometry-for-drug-metabolism-studies 337/362
(absorption, distribution, metabolism, excretion) properties of lead molecules.
To keep pace with this demand, a steady evolution in bioanalytical technology
occurred encompassing virtually every step imaginable in the bioanalytical
process. A detailed review of these technological advances is unfortunatelybeyond the scope of this chapter, but readers interested in this subject are
referred to other chapters of this book as well as the review articles cited above.
As LC–MS/MS technology matured over the past decade, a noteworthy
trend occurred regarding its use. In addition to its more traditional role as a
tool for dedicated bioanalytical assays, LC–MS/MS began to be deployed as a
moderate throughput screening technology. Important illustrations include the
now pervasive use of LC–MS/MS for in vitro ADME screens (e.g., metabolic
stability, Caco-2) [5, 6] and the well-documented role of LC–MS/MS for in vivo
exposure screening [7, 8].Two factors are essential for successful application of LC–MS/MS as
a screening tool: (1) high sample throughput and (2) the ability to rapidly
achieve LC–MS/MS conditions for a diverse array of new molecular entities
(NME). Unfortunately, LC contributes significant overhead to each of these
categories. Even with the use of fast gradient elution techniques, chromato-
graphic run times are on the order of 1 to 5 min per sample, depending on
the application. In addition, time must also be invested to achieve suitable
LC conditions prior to analysis. As a result of these factors, researchers
have recently turned to approaches that do not require on-line LC. Forthe sake of this discussion, these techniques will be referred to as direct
bioanalysis methods.
12.2 Review of Recent Literature
Admittedly, there are a number of potential pitfalls associated with direct
bioanalysis, particularly surrounding concerns about assay sensitivity and
selectivity. Despite these challenges, several methods continue to be pursued
driven by the potential for increased throughput and reduced cost per sample.
Perhaps the simplest form of direct bioanalysis is flow injection analysis (FIA).
FIA simply refers to the practice of direct loop injection following some
method for off-line sample cleanup. A published example is the work of Chen
and Carvey who used FIA with liquid–liquid extraction (LLE) for the clinical
bioanalysis of topiramate [9]. One of the drawbacks to FIA is dilution of the
analyte by the injection stream, which is not preferred given the concentration
dependence of ESI [10]. In the case of topiramate, the lower limit of
quantitation (LLOQ) was only 2 mg/mL. Another example of FIA, published
by Zheng and co-workers [11], employed FIA with generic off-line solid-phase
extraction (SPE) for metabolic stability analysis. In this work, the rate of
disappearance of 20 NMEs incubated with human liver microsomes was
studied using two bioanalytical techniques: (1) acetonitrile precipitation
followed by on-line LC-MS/MS, and (2) off-line OasisTM SPE followed by
FIA-MS/MS. The authors concluded that both techniques gave comparable
330 Using Mass Spectrometry for Drug Metabolism Studies
Copyright © 2005 CRC Press, LLC
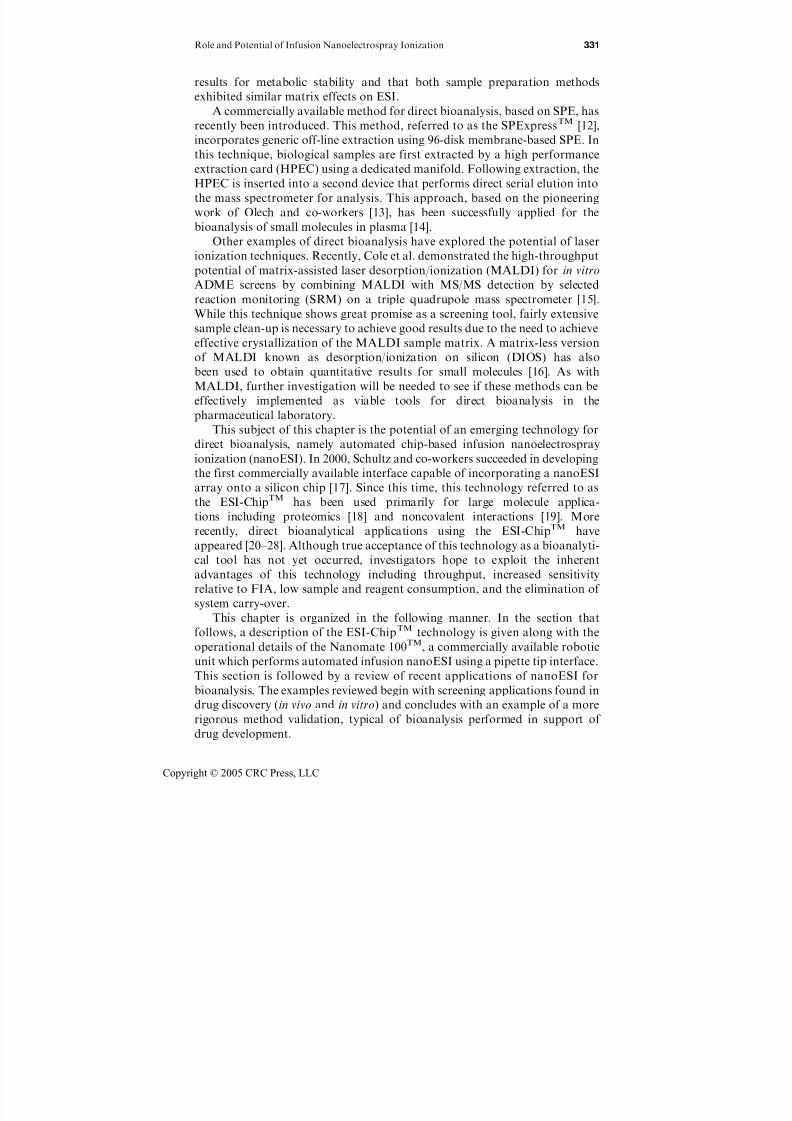
7/21/2019 Using Mass Spectrometry for Drug Metabolism Studies
http://slidepdf.com/reader/full/using-mass-spectrometry-for-drug-metabolism-studies 338/362
results for metabolic stability and that both sample preparation methods
exhibited similar matrix effects on ESI.
A commercially available method for direct bioanalysis, based on SPE, has
recently been introduced. This method, referred to as the SPExpressTM
[12],incorporates generic off-line extraction using 96-disk membrane-based SPE. In
this technique, biological samples are first extracted by a high performance
extraction card (HPEC) using a dedicated manifold. Following extraction, the
HPEC is inserted into a second device that performs direct serial elution into
the mass spectrometer for analysis. This approach, based on the pioneering
work of Olech and co-workers [13], has been successfully applied for the
bioanalysis of small molecules in plasma [14].
Other examples of direct bioanalysis have explored the potential of laser
ionization techniques. Recently, Cole et al. demonstrated the high-throughputpotential of matrix-assisted laser desorption/ionization (MALDI) for in vitro
ADME screens by combining MALDI with MS/MS detection by selected
reaction monitoring (SRM) on a triple quadrupole mass spectrometer [15].
While this technique shows great promise as a screening tool, fairly extensive
sample clean-up is necessary to achieve good results due to the need to achieve
effective crystallization of the MALDI sample matrix. A matrix-less version
of MALDI known as desorption/ionization on silicon (DIOS) has also
been used to obtain quantitative results for small molecules [16]. As with
MALDI, further investigation will be needed to see if these methods can beeffectively implemented as viable tools for direct bioanalysis in the
pharmaceutical laboratory.
This subject of this chapter is the potential of an emerging technology for
direct bioanalysis, namely automated chip-based infusion nanoelectrospray
ionization (nanoESI). In 2000, Schultz and co-workers succeeded in developing
the first commercially available interface capable of incorporating a nanoESI
array onto a silicon chip [17]. Since this time, this technology referred to as
the ESI-ChipTM has been used primarily for large molecule applica-
tions including proteomics [18] and noncovalent interactions [19]. More
recently, direct bioanalytical applications using the ESI-ChipTM have
appeared [20–28]. Although true acceptance of this technology as a bioanalyti-
cal tool has not yet occurred, investigators hope to exploit the inherent
advantages of this technology including throughput, increased sensitivity
relative to FIA, low sample and reagent consumption, and the elimination of
system carry-over.
This chapter is organized in the following manner. In the section that
follows, a description of the ESI-ChipTM technology is given along with the
operational details of the Nanomate 100TM, a commercially available robotic
unit which performs automated infusion nanoESI using a pipette tip interface.
This section is followed by a review of recent applications of nanoESI for
bioanalysis. The examples reviewed begin with screening applications found in
drug discovery (in vivo and in vitro) and concludes with an example of a more
rigorous method validation, typical of bioanalysis performed in support of
drug development.
Role and Potential of Infusion Nanoelectrospray Ionization 331
Copyright © 2005 CRC Press, LLC
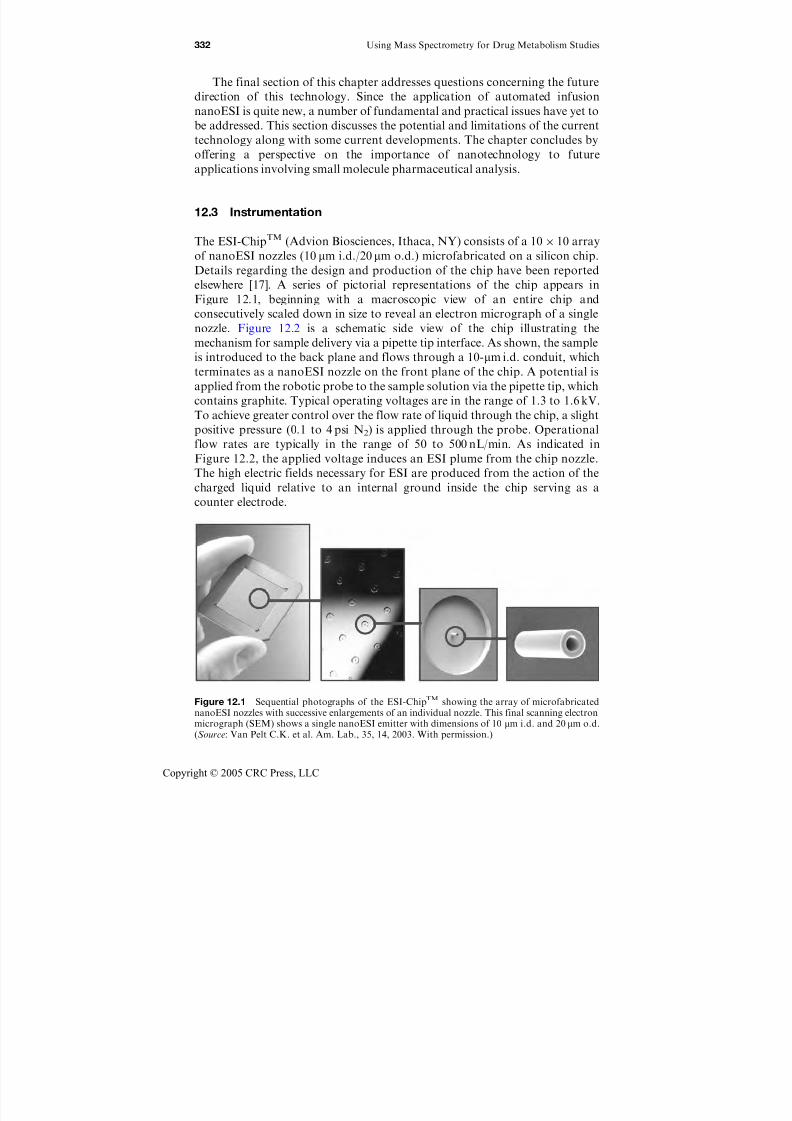
7/21/2019 Using Mass Spectrometry for Drug Metabolism Studies
http://slidepdf.com/reader/full/using-mass-spectrometry-for-drug-metabolism-studies 339/362
The final section of this chapter addresses questions concerning the future
direction of this technology. Since the application of automated infusion
nanoESI is quite new, a number of fundamental and practical issues have yet to
be addressed. This section discusses the potential and limitations of the currenttechnology along with some current developments. The chapter concludes by
offering a perspective on the importance of nanotechnology to future
applications involving small molecule pharmaceutical analysis.
12.3 Instrumentation
The ESI-ChipTM (Advion Biosciences, Ithaca, NY) consists of a 10 10 array
of nanoESI nozzles (10 mm i.d./20 mm o.d.) microfabricated on a silicon chip.Details regarding the design and production of the chip have been reported
elsewhere [17]. A series of pictorial representations of the chip appears in
Figure 12.1, beginning with a macroscopic view of an entire chip and
consecutively scaled down in size to reveal an electron micrograph of a single
nozzle. Figure 12.2 is a schematic side view of the chip illustrating the
mechanism for sample delivery via a pipette tip interface. As shown, the sample
is introduced to the back plane and flows through a 10-mm i.d. conduit, which
terminates as a nanoESI nozzle on the front plane of the chip. A potential is
applied from the robotic probe to the sample solution via the pipette tip, whichcontains graphite. Typical operating voltages are in the range of 1.3 to 1.6 kV.
To achieve greater control over the flow rate of liquid through the chip, a slight
positive pressure (0.1 to 4 psi N2) is applied through the probe. Operational
flow rates are typically in the range of 50 to 500 nL/min. As indicated in
Figure 12.2, the applied voltage induces an ESI plume from the chip nozzle.
The high electric fields necessary for ESI are produced from the action of the
charged liquid relative to an internal ground inside the chip serving as a
counter electrode.
Figure 12.1 Sequential photographs of the ESI-ChipTM showing the array of microfabricatednanoESI nozzles with successive enlargements of an individual nozzle. This final scanning electronmicrograph (SEM) shows a single nanoESI emitter with dimensions of 10 mm i.d. and 20 mm o.d.(Source: Van Pelt C.K. et al. Am. Lab., 35, 14, 2003. With permission.)
332 Using Mass Spectrometry for Drug Metabolism Studies
Copyright © 2005 CRC Press, LLC
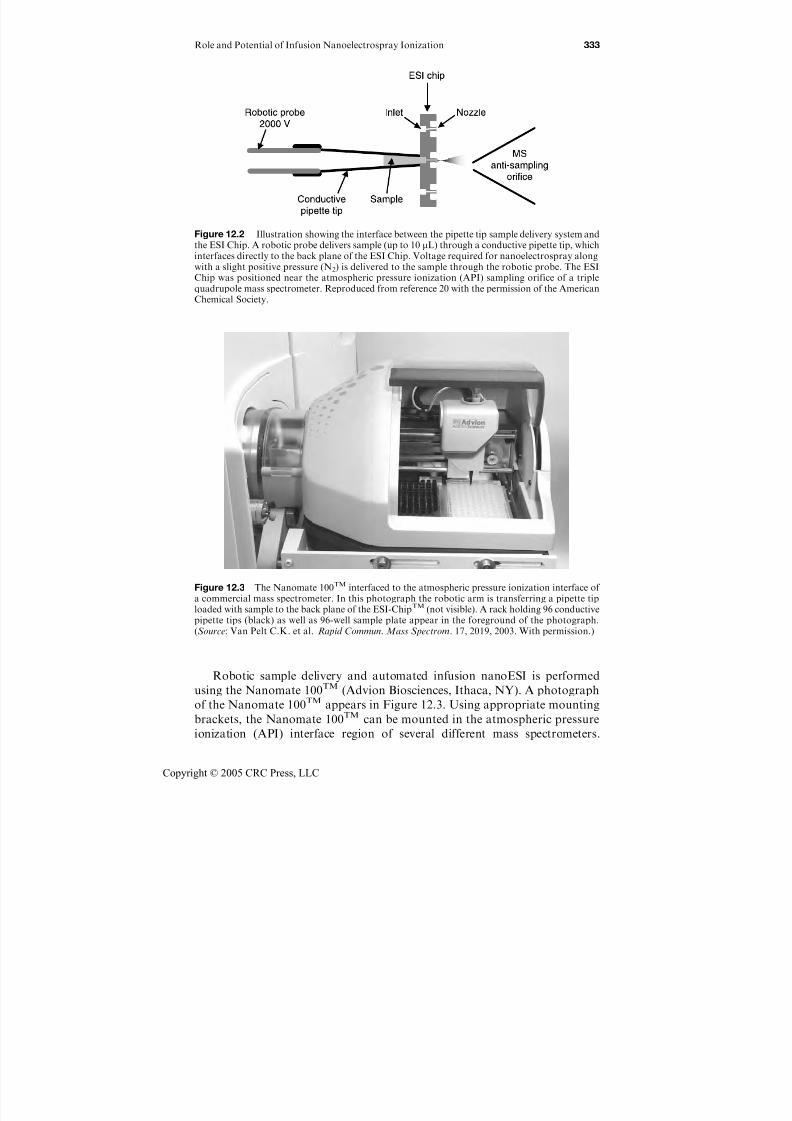
7/21/2019 Using Mass Spectrometry for Drug Metabolism Studies
http://slidepdf.com/reader/full/using-mass-spectrometry-for-drug-metabolism-studies 340/362
Robotic sample delivery and automated infusion nanoESI is performed
using the Nanomate 100TM (Advion Biosciences, Ithaca, NY). A photograph
of the Nanomate 100TM appears in Figure 12.3. Using appropriate mounting
brackets, the Nanomate 100TM can be mounted in the atmospheric pressure
ionization (API) interface region of several different mass spectrometers.
Figure 12.3 The Nanomate 100TM interfaced to the atmospheric pressure ionization interface of a commercial mass spectrometer. In this photograph the robotic arm is transferring a pipette tiploaded with sample to the back plane of the ESI-ChipTM (not visible). A rack holding 96 conductivepipette tips (black) as well as 96-well sample plate appear in the foreground of the photograph.(Source: Van Pelt C.K. et al. Rapid Commun. Mass Spectrom. 17, 2019, 2003. With permission.)
Figure 12.2 Illustration showing the interface between the pipette tip sample delivery system andthe ESI Chip. A robotic probe delivers sample (up to 10 mL) through a conductive pipette tip, which
interfaces directly to the back plane of the ESI Chip. Voltage required for nanoelectrospray alongwith a slight positive pressure (N2) is delivered to the sample through the robotic probe. The ESIChip was positioned near the atmospheric pressure ionization (API) sampling orifice of a triplequadrupole mass spectrometer. Reproduced from reference 20 with the permission of the AmericanChemical Society.
Role and Potential of Infusion Nanoelectrospray Ionization 333
Copyright © 2005 CRC Press, LLC
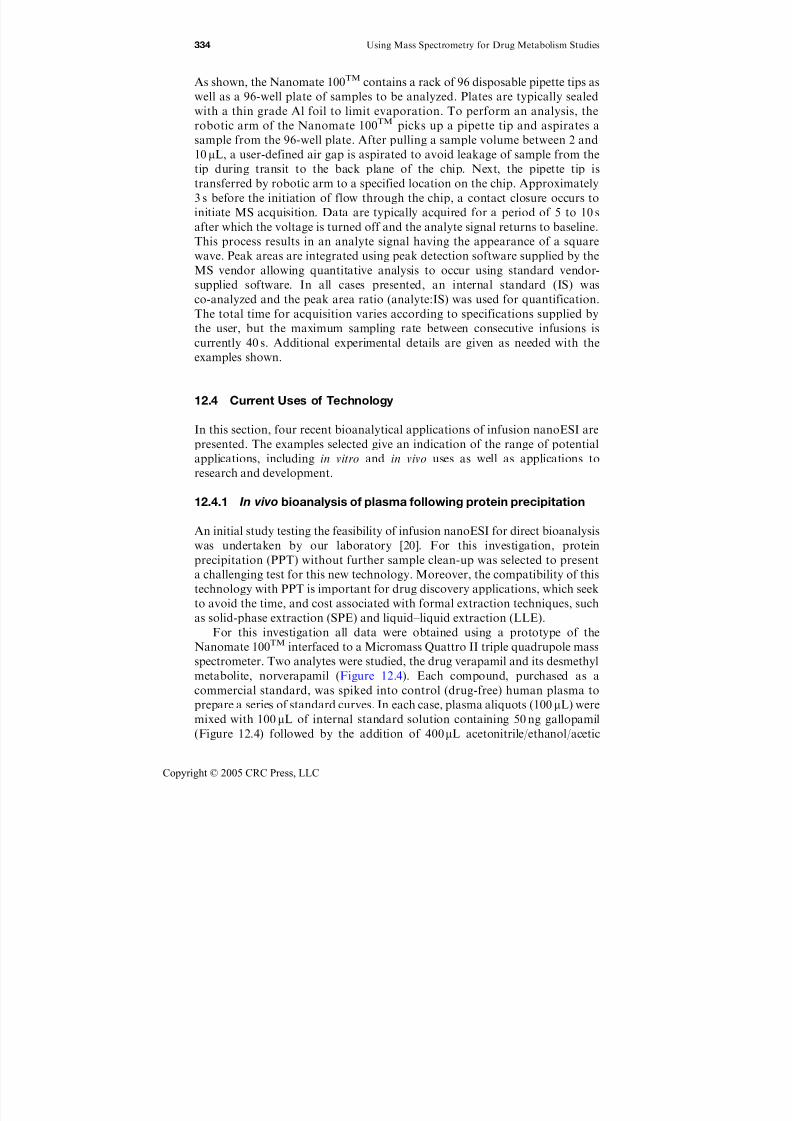
7/21/2019 Using Mass Spectrometry for Drug Metabolism Studies
http://slidepdf.com/reader/full/using-mass-spectrometry-for-drug-metabolism-studies 341/362
As shown, the Nanomate 100TM contains a rack of 96 disposable pipette tips as
well as a 96-well plate of samples to be analyzed. Plates are typically sealed
with a thin grade Al foil to limit evaporation. To perform an analysis, the
robotic arm of the Nanomate 100TM
picks up a pipette tip and aspirates asample from the 96-well plate. After pulling a sample volume between 2 and
10 mL, a user-defined air gap is aspirated to avoid leakage of sample from the
tip during transit to the back plane of the chip. Next, the pipette tip is
transferred by robotic arm to a specified location on the chip. Approximately
3 s before the initiation of flow through the chip, a contact closure occurs to
initiate MS acquisition. Data are typically acquired for a period of 5 to 10 s
after which the voltage is turned off and the analyte signal returns to baseline.
This process results in an analyte signal having the appearance of a square
wave. Peak areas are integrated using peak detection software supplied by theMS vendor allowing quantitative analysis to occur using standard vendor-
supplied software. In all cases presented, an internal standard (IS) was
co-analyzed and the peak area ratio (analyte:IS) was used for quantification.
The total time for acquisition varies according to specifications supplied by
the user, but the maximum sampling rate between consecutive infusions is
currently 40 s. Additional experimental details are given as needed with the
examples shown.
12.4 Current Uses of Technology
In this section, four recent bioanalytical applications of infusion nanoESI are
presented. The examples selected give an indication of the range of potential
applications, including in vitro and in vivo uses as well as applications to
research and development.
12.4.1 In vivo bioanalysis of plasma following protein precipitation
An initial study testing the feasibility of infusion nanoESI for direct bioanalysis
was undertaken by our laboratory [20]. For this investigation, protein
precipitation (PPT) without further sample clean-up was selected to present
a challenging test for this new technology. Moreover, the compatibility of this
technology with PPT is important for drug discovery applications, which seek
to avoid the time, and cost associated with formal extraction techniques, such
as solid-phase extraction (SPE) and liquid–liquid extraction (LLE).
For this investigation all data were obtained using a prototype of the
Nanomate 100TM interfaced to a Micromass Quattro II triple quadrupole mass
spectrometer. Two analytes were studied, the drug verapamil and its desmethyl
metabolite, norverapamil (Figure 12.4). Each compound, purchased as a
commercial standard, was spiked into control (drug-free) human plasma to
prepare a series of standard curves. In each case, plasma aliquots (100mL) were
mixed with 100 mL of internal standard solution containing 50 ng gallopamil
(Figure 12.4) followed by the addition of 400mL acetonitrile/ethanol/acetic
334 Using Mass Spectrometry for Drug Metabolism Studies
Copyright © 2005 CRC Press, LLC

7/21/2019 Using Mass Spectrometry for Drug Metabolism Studies
http://slidepdf.com/reader/full/using-mass-spectrometry-for-drug-metabolism-studies 342/362
acid (90/10/0.1, v/v/v). After vortexing for 30 s, the samples were centrifuged
at 10,000 g for 10 min. The supernatant was transferred to clean glass tubes
and evaporated under nitrogen. Samples were reconstituted in 200 mL of
acetonitrile (0.1% acetic acid) and re-centrifuged (10,000 g for 10 min) to
remove particulate matter. Ten-mL aliquots were sampled for bioanalysis
by the Nanomate 100TM. Data acquisition occurred by SRM over a period of
30 s using a 400 ms dwell time for each SRM channel and a collision energy of
35 eV for all analytes. The overall sampling time between injections was
approximately 1 min.
A standard curve consisting of a series of nanoESI infusions from the
analysis of verapamil and norverapamil appears in Figure 12.5. The square
wave-like appearance of nanoESI infusion profile is readily apparent from this
data set. It should be noted that each rectangular offset in the SRM mass
chromatograms represents a single injection from a separate, consecutive
nozzle on the chip. The upper portion of Figure 12.5 contains three SRM mass
chromatograms for gallopamil (m/z 485.1 to 164.8), verapamil (m/z 455.0 to
164.8) and norverapamil (m/z 441.0 to 164.8). A total of eight standard
concentrations were analyzed ranging from 2.5 to 500 ng/mL. An expanded
Figure 12.4 Chemical structures and nominal molecular weights for verapamil, its activemetabolite norverapamil and the internal standard, gallopamil. (Source: Dethy, J.M. et al. Anal .Chem. 75, 805, 2003. With permission.)
Role and Potential of Infusion Nanoelectrospray Ionization 335
Copyright © 2005 CRC Press, LLC

7/21/2019 Using Mass Spectrometry for Drug Metabolism Studies
http://slidepdf.com/reader/full/using-mass-spectrometry-for-drug-metabolism-studies 343/362
view at the bottom of Figure 12.5 was included to allow better observation of
the four lowest standards.
The bioanalytical precision and accuracy of the ESI ChipTM technology
were assessed through the analysis of multiple standard curves for verapamil
Figure 12.5 (a) Series of eight nanoelectrospray infusion ion current profiles representing a singlestandard curve prepared by spiking drug-free human plasma with the internal standard, gallopamil(upper), verapamil (middle) and norverapamil (lower). Each flat-top deflection in the SRM ioncurrent profiles corresponds to a single sample analyzed from a different ESI nozzle. The standardconcentrations represented for verapamil and norverapamil are 2.5, 5.0, 10, 25, 50, 100, 250, and500 ng/mL. The internal standard concentration was 500 ng/mL. (b) Expanded view of the lowestfour standards analyzed in panel. (Source: Dethy, J.M. et al. Anal . Chem. 75, 805, 2003. With
permission.)
336 Using Mass Spectrometry for Drug Metabolism Studies
Copyright © 2005 CRC Press, LLC

7/21/2019 Using Mass Spectrometry for Drug Metabolism Studies
http://slidepdf.com/reader/full/using-mass-spectrometry-for-drug-metabolism-studies 344/362
and norverapamil. In this experiment, the first set of standards analyzed was
used to define the calibration curves for each analyte. Subsequent analysis of
replicate standards resulted in the precision and accuracy data found in
Table 12.1. For both analytes the precision was under 20% relative standard
deviation, except for the lowest standard (2.5 ng/mL). Due to the high degree
of imprecision at this level, the lower limit of quantitation (LLOQ) was
assigned as 5 ng/mL for both verapamil and norverapamil. Overall theprecision ranged from 4 to 11% RSD (relative standard deviation) for
verapamil and from 5.7 to 19.6% RSD for norverapamil. Accuracy values
shown in Table 12.1 represent mean values for the replicates at a given
concentration following interpolation of individual concentrations from the
calibration curve. The accuracy values for verapamil ranged from 93 to 102%
and from 83 to 98% for norverapamil. In evaluating these data, it is
acknowledged that overall precision and accuracy found in Table 12.1 would
not meet the more rigorous acceptance criteria associated with GLP (good
laboratory practice) validation [29]. Nonetheless, these data are consistent with
the expectations of discovery bioanalysis.
Calibration curves for verapamil and norverapamil were constructed by
plotting the peak area ratio of analyte to internal standard versus analyte
plasma concentration. The curves, fit using linear regression with 1/X
weighting, were linear over the range tested (2.5–500 ng/mL). The following
straight-line equations and correlation coefficients were obtained: for
verapamil, y¼ 0.00180xþ 0.00141 (r2¼ 0.999); and for norverapamil,
y¼ 0.00105xþ 0.00017 (r2¼ 0.9998).
Prior to assessing system carry-over, the selectivity of the method was first
established for both verapamil and norverapamil through the analysis of blank
(drug-free) human plasma. Having demonstrated selectivity for both analytes,
the question of system carry-over was investigated. Figure 12.6 displays SRM
ion current profiles for verapamil (top) and the internal standard gallopamil
(bottom) for a series of three consecutive nanoESI infusions. The first infusion
period (12.5 to 13.3 min) indicates the signal observed from a 500 ng/mL
Table 12.1 Precision and accuracy data obtained from the nanoelectrospray infusion deter-mination of verapamil and norverapamil in human plasma
Standard
Verapamil Norverapamil
(ng/mL)Mean
(ng/mL) %RSD %AccuracyMean
(ng/mL) %RSD %Accuracy n
2.5 2.6 33 102 2.7 27.7 109 95.0 4.6 11 93 4.9 19.6 98 8
10 9.8 7 98 8.9 5.7 89 925 24.2 9 97 20.6 18.7 83 850 51.0 9 102 43.9 16.8 88 9
100 99.4 7 99 92.9 14.1 93 6250 252 7 101 234 9.7 93 7500 497 4 99 445 6.3 89 10
Source: Dethy, J.M. et al. Anal. Chem., 75, 805, 2003. With permission.
Role and Potential of Infusion Nanoelectrospray Ionization 337
Copyright © 2005 CRC Press, LLC

7/21/2019 Using Mass Spectrometry for Drug Metabolism Studies
http://slidepdf.com/reader/full/using-mass-spectrometry-for-drug-metabolism-studies 345/362
verapamil plasma standard. Immediately after this high standard a drug-free
blank plasma sample was infused. Data from this second infusion appear in the
period from 14.0 to 14.8 min (defined by the two dotted lines in Figure 12.6). It
is noteworthy that the signal observed during this period did not exceed the
level of background noise present during sample loading (i.e., no spray; 13.3 to
14.0 min). This infusion was followed by the analysis of a blank plasma sample
containing the internal standard (15.5 to 16.2 min). The results from this
experiment document the complete elimination of system carry-over and are
representative of the standard performance of this system. As expected, no
carry-over was detected in the concomitant analysis of norverapamil (data
not shown).
One of the advantages of direct bioanalysis by infusion nanoESI is that the
infused solution can contain a high organic solvent content. This not only leads
to higher analyte signal through improved desolvation, but is also likely to
limit salt content in the infused solution. The effect of the composition of the
infused solution was investigated by using two schemes for protein precipita-
tion. In the first scheme (process 1), a 100-mL plasma sample fortified with
100 mL of internal standard solution was precipitated using 200 mL acetonitrile/
ethanol/acetic acid (90/10/0.1, v/v/v). In this case, the supernatant was infused
immediately after the centrifugation step. process 2 was similar to process 1,
Figure 12.6 SRM ion current profiles for verapamil (upper) and gallopamil (lower) indicating thesignal obtained from three sequential nanoelectrospray infusions used to assess system carryover.The first infusion (12.5 to 13.3 min) shows the signal observed from a 500 ng/mL verapamil humanplasma standard. This fusion was immediately followed by the analysis of a blank human plasmasample. The analysis period for this sample (14.0 to 14.8 min) is delineated by two dotted lines. Thefinal infusion (15.5 to 16.2 min) corresponds to the analysis of a blank plasma sample containinginternal standard. (Source: Dethy, J.M. et al. Anal . Chem. 75, 805, 2003. With permission.)
338 Using Mass Spectrometry for Drug Metabolism Studies
Copyright © 2005 CRC Press, LLC
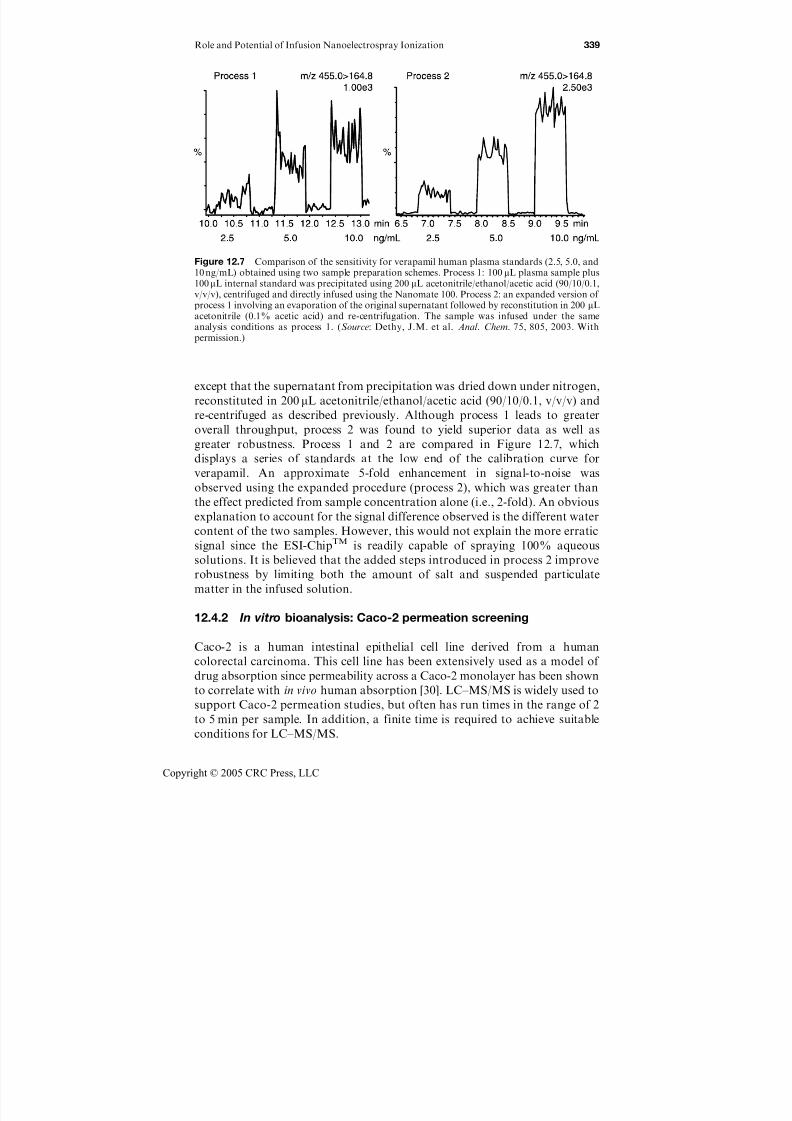
7/21/2019 Using Mass Spectrometry for Drug Metabolism Studies
http://slidepdf.com/reader/full/using-mass-spectrometry-for-drug-metabolism-studies 346/362
except that the supernatant from precipitation was dried down under nitrogen,reconstituted in 200 mL acetonitrile/ethanol/acetic acid (90/10/0.1, v/v/v) and
re-centrifuged as described previously. Although process 1 leads to greater
overall throughput, process 2 was found to yield superior data as well as
greater robustness. Process 1 and 2 are compared in Figure 12.7, which
displays a series of standards at the low end of the calibration curve for
verapamil. An approximate 5-fold enhancement in signal-to-noise was
observed using the expanded procedure (process 2), which was greater than
the effect predicted from sample concentration alone (i.e., 2-fold). An obvious
explanation to account for the signal difference observed is the different water
content of the two samples. However, this would not explain the more erratic
signal since the ESI-ChipTM is readily capable of spraying 100% aqueous
solutions. It is believed that the added steps introduced in process 2 improve
robustness by limiting both the amount of salt and suspended particulate
matter in the infused solution.
12.4.2 In vitro bioanalysis: Caco-2 permeation screening
Caco-2 is a human intestinal epithelial cell line derived from a human
colorectal carcinoma. This cell line has been extensively used as a model of
drug absorption since permeability across a Caco-2 monolayer has been shown
to correlate with in vivo human absorption [30]. LC–MS/MS is widely used to
support Caco-2 permeation studies, but often has run times in the range of 2
to 5 min per sample. In addition, a finite time is required to achieve suitable
conditions for LC–MS/MS.
Figure 12.7 Comparison of the sensitivity for verapamil human plasma standards (2.5, 5.0, and10 ng/mL) obtained using two sample preparation schemes. Process 1: 100mL plasma sample plus100mL internal standard was precipitated using 200 mL acetonitrile/ethanol/acetic acid (90/10/0.1,v/v/v), centrifuged and directly infused using the Nanomate 100. Process 2: an expanded version of process 1 involving an evaporation of the original supernatant followed by reconstitution in 200 mLacetonitrile (0.1% acetic acid) and re-centrifugation. The sample was infused under the sameanalysis conditions as process 1. (Source: Dethy, J.M. et al. Anal . Chem. 75, 805, 2003. Withpermission.)
Role and Potential of Infusion Nanoelectrospray Ionization 339
Copyright © 2005 CRC Press, LLC
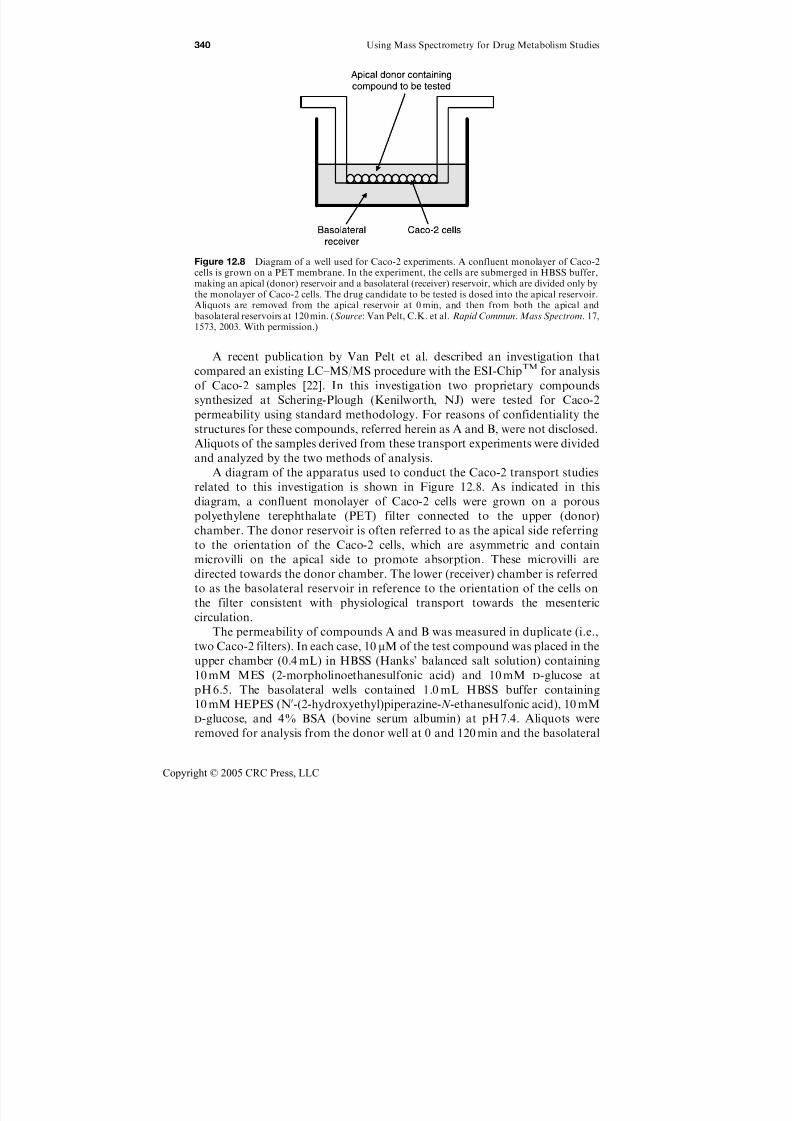
7/21/2019 Using Mass Spectrometry for Drug Metabolism Studies
http://slidepdf.com/reader/full/using-mass-spectrometry-for-drug-metabolism-studies 347/362
A recent publication by Van Pelt et al. described an investigation that
compared an existing LC–MS/MS procedure with the ESI-ChipTM for analysis
of Caco-2 samples [22]. In this investigation two proprietary compoundssynthesized at Schering-Plough (Kenilworth, NJ) were tested for Caco-2
permeability using standard methodology. For reasons of confidentiality the
structures for these compounds, referred herein as A and B, were not disclosed.
Aliquots of the samples derived from these transport experiments were divided
and analyzed by the two methods of analysis.
A diagram of the apparatus used to conduct the Caco-2 transport studies
related to this investigation is shown in Figure 12.8. As indicated in this
diagram, a confluent monolayer of Caco-2 cells were grown on a porous
polyethylene terephthalate (PET) filter connected to the upper (donor)
chamber. The donor reservoir is often referred to as the apical side referring
to the orientation of the Caco-2 cells, which are asymmetric and contain
microvilli on the apical side to promote absorption. These microvilli are
directed towards the donor chamber. The lower (receiver) chamber is referred
to as the basolateral reservoir in reference to the orientation of the cells on
the filter consistent with physiological transport towards the mesenteric
circulation.
The permeability of compounds A and B was measured in duplicate (i.e.,
two Caco-2 filters). In each case, 10 mM of the test compound was placed in the
upper chamber (0.4 mL) in HBSS (Hanks’ balanced salt solution) containing
10 mM MES (2-morpholinoethanesulfonic acid) and 10 mM d-glucose at
pH 6.5. The basolateral wells contained 1.0 mL HBSS buffer containing
10 mM HEPES (N0-(2-hydroxyethyl)piperazine-N -ethanesulfonic acid), 10 mM
d-glucose, and 4% BSA (bovine serum albumin) at pH 7.4. Aliquots were
removed for analysis from the donor well at 0 and 120 min and the basolateral
Figure 12.8 Diagram of a well used for Caco-2 experiments. A confluent monolayer of Caco-2cells is grown on a PET membrane. In the experiment, the cells are submerged in HBSS buffer,making an apical (donor) reservoir and a basolateral (receiver) reservoir, which are divided only bythe monolayer of Caco-2 cells. The drug candidate to be tested is dosed into the apical reservoir.Aliquots are removed from the apical reservoir at 0 min, and then from both the apical andbasolateral reservoirs at 120 min. (Source: Van Pelt, C.K. et al. Rapid Commun. Mass Spectrom. 17,1573, 2003. With permission.)
340 Using Mass Spectrometry for Drug Metabolism Studies
Copyright © 2005 CRC Press, LLC
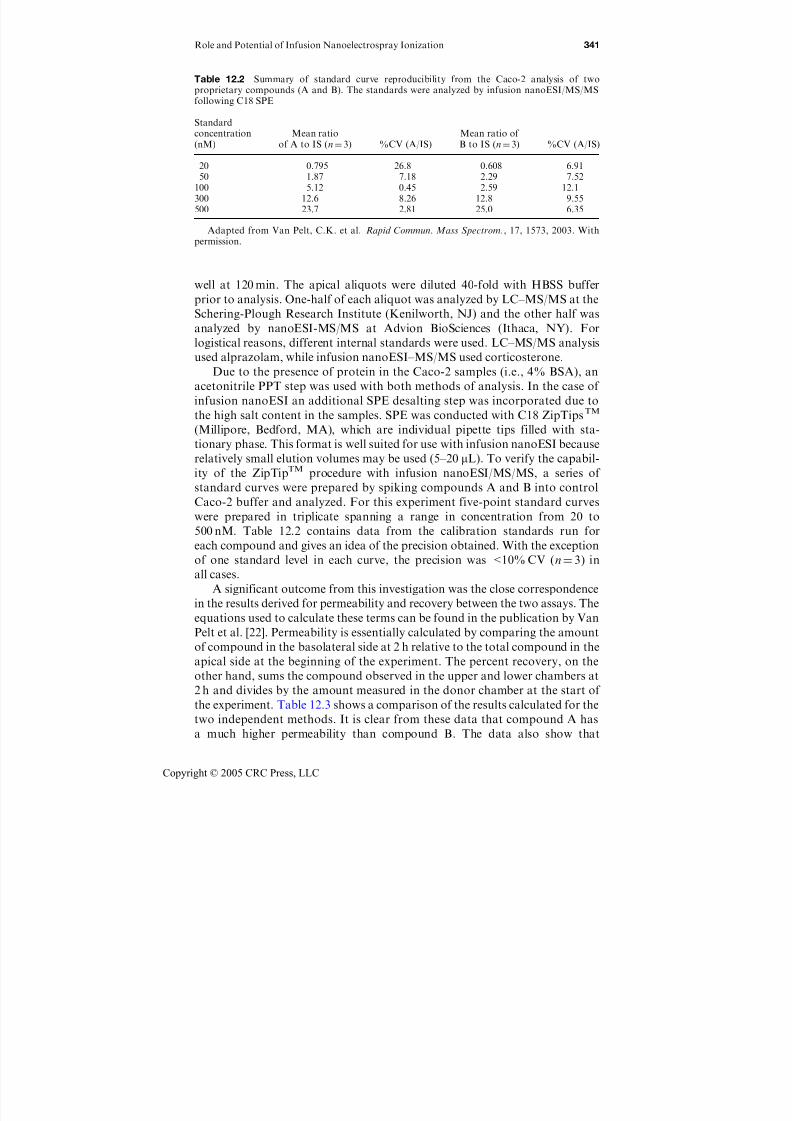
7/21/2019 Using Mass Spectrometry for Drug Metabolism Studies
http://slidepdf.com/reader/full/using-mass-spectrometry-for-drug-metabolism-studies 348/362
well at 120 min. The apical aliquots were diluted 40-fold with HBSS buffer
prior to analysis. One-half of each aliquot was analyzed by LC–MS/MS at the
Schering-Plough Research Institute (Kenilworth, NJ) and the other half was
analyzed by nanoESI-MS/MS at Advion BioSciences (Ithaca, NY). For
logistical reasons, different internal standards were used. LC–MS/MS analysis
used alprazolam, while infusion nanoESI–MS/MS used corticosterone.
Due to the presence of protein in the Caco-2 samples (i.e., 4% BSA), an
acetonitrile PPT step was used with both methods of analysis. In the case of infusion nanoESI an additional SPE desalting step was incorporated due to
the high salt content in the samples. SPE was conducted with C18 ZipTipsTM
(Millipore, Bedford, MA), which are individual pipette tips filled with sta-
tionary phase. This format is well suited for use with infusion nanoESI because
relatively small elution volumes may be used (5–20 mL). To verify the capabil-
ity of the ZipTipTM procedure with infusion nanoESI/MS/MS, a series of
standard curves were prepared by spiking compounds A and B into control
Caco-2 buffer and analyzed. For this experiment five-point standard curves
were prepared in triplicate spanning a range in concentration from 20 to
500 nM. Table 12.2 contains data from the calibration standards run for
each compound and gives an idea of the precision obtained. With the exception
of one standard level in each curve, the precision was <10% CV (n¼ 3) in
all cases.
A significant outcome from this investigation was the close correspondence
in the results derived for permeability and recovery between the two assays. The
equations used to calculate these terms can be found in the publication by Van
Pelt et al. [22]. Permeability is essentially calculated by comparing the amount
of compound in the basolateral side at 2 h relative to the total compound in the
apical side at the beginning of the experiment. The percent recovery, on the
other hand, sums the compound observed in the upper and lower chambers at
2 h and divides by the amount measured in the donor chamber at the start of
the experiment. Table 12.3 shows a comparison of the results calculated for the
two independent methods. It is clear from these data that compound A has
a much higher permeability than compound B. The data also show that
Table 12.2 Summary of standard curve reproducibility from the Caco-2 analysis of twoproprietary compounds (A and B). The standards were analyzed by infusion nanoESI/MS/MSfollowing C18 SPE
Standardconcentration(nM)
Mean ratioof A to IS (n¼ 3) %CV (A/IS)
Mean ratio of B to IS (n¼ 3) %CV (A/IS)
20 0.795 26.8 0.608 6.9150 1.87 7.18 2.29 7.52
100 5.12 0.45 2.59 12.1300 12.6 8.26 12.8 9.55500 23.7 2.81 25.0 6.35
Adapted from Van Pelt, C.K. et al. Rapid Commun. Mass Spectrom., 17, 1573, 2003. Withpermission.
Role and Potential of Infusion Nanoelectrospray Ionization 341
Copyright © 2005 CRC Press, LLC
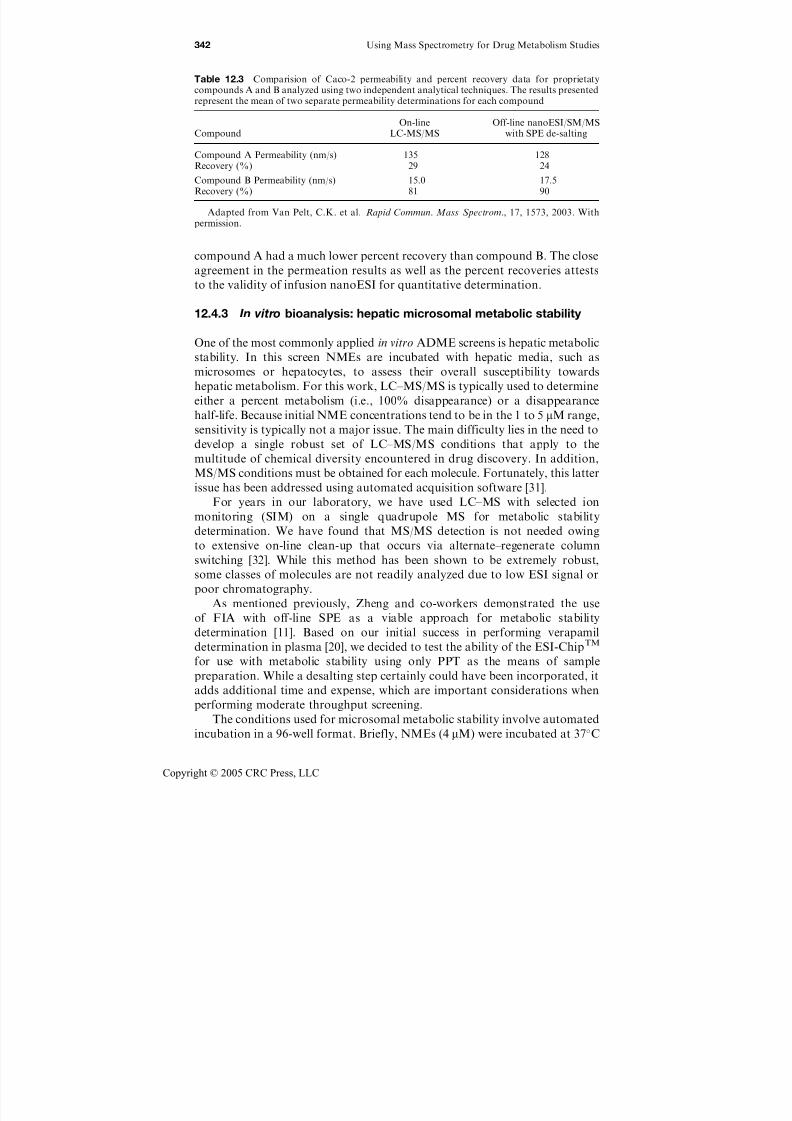
7/21/2019 Using Mass Spectrometry for Drug Metabolism Studies
http://slidepdf.com/reader/full/using-mass-spectrometry-for-drug-metabolism-studies 349/362
compound A had a much lower percent recovery than compound B. The closeagreement in the permeation results as well as the percent recoveries attests
to the validity of infusion nanoESI for quantitative determination.
12.4.3 In vitro bioanalysis: hepatic microsomal metabolic stability
One of the most commonly applied in vitro ADME screens is hepatic metabolic
stability. In this screen NMEs are incubated with hepatic media, such as
microsomes or hepatocytes, to assess their overall susceptibility towards
hepatic metabolism. For this work, LC–MS/MS is typically used to determineeither a percent metabolism (i.e., 100% disappearance) or a disappearance
half-life. Because initial NME concentrations tend to be in the 1 to 5 mM range,
sensitivity is typically not a major issue. The main difficulty lies in the need to
develop a single robust set of LC–MS/MS conditions that apply to the
multitude of chemical diversity encountered in drug discovery. In addition,
MS/MS conditions must be obtained for each molecule. Fortunately, this latter
issue has been addressed using automated acquisition software [31].
For years in our laboratory, we have used LC–MS with selected ion
monitoring (SIM) on a single quadrupole MS for metabolic stability
determination. We have found that MS/MS detection is not needed owing
to extensive on-line clean-up that occurs via alternate–regenerate column
switching [32]. While this method has been shown to be extremely robust,
some classes of molecules are not readily analyzed due to low ESI signal or
poor chromatography.
As mentioned previously, Zheng and co-workers demonstrated the use
of FIA with off-line SPE as a viable approach for metabolic stability
determination [11]. Based on our initial success in performing verapamil
determination in plasma [20], we decided to test the ability of the ESI-ChipTM
for use with metabolic stability using only PPT as the means of sample
preparation. While a desalting step certainly could have been incorporated, it
adds additional time and expense, which are important considerations when
performing moderate throughput screening.
The conditions used for microsomal metabolic stability involve automated
incubation in a 96-well format. Briefly, NMEs (4 mM) were incubated at 37C
Table 12.3 Comparision of Caco-2 permeability and percent recovery data for proprietatycompounds A and B analyzed using two independent analytical techniques. The results presentedrepresent the mean of two separate permeability determinations for each compound
CompoundOn-line
LC-MS/MSOff-line nanoESI/SM/MS
with SPE de-salting
Compound A Permeability (nm/s) 135 128Recovery (%) 29 24
Compound B Permeability (nm/s) 15.0 17.5Recovery (%) 81 90
Adapted from Van Pelt, C.K. et al. Rapid Commun. Mass Spectrom., 17, 1573, 2003. Withpermission.
342 Using Mass Spectrometry for Drug Metabolism Studies
Copyright © 2005 CRC Press, LLC

7/21/2019 Using Mass Spectrometry for Drug Metabolism Studies
http://slidepdf.com/reader/full/using-mass-spectrometry-for-drug-metabolism-studies 350/362
with human liver micosomes (XenoTech, Lenexa, KS) at 1 mg/mL (total
protein) with or without the addition of NADPH (2 mM), a co-factor needed
for phase I hepatic oxidation. The incubation was buffered at pH 7.4 using
50 mM sodium phosphate and had a total incubation volume of 100 mL.Following a pre-incubation period to bring the reagents to 37C, the reaction
was initiated by addition of the NME-containing solution. Incubation
occurred for 30 min and was stopped with the addition of 100 mL
acetonitrile/methanol/water/acetic acid (25/25/50/0.5, v/v/v/v). The super-
natant obtained after centrifugation was injected for LC–MS analysis.
For infusion nanoESI, the microsomal supernatant (100mL) was mixed
with 200 mL of internal standard solution containing 100 ng gallopamil
(Figure 12.4) in acetonitrile/water/acetic acid (50/50/0.1, v/v/v). The final
solution was centrifuged prior to infusion nanoESI using the Nanomate100TM. The operating conditions used were similar to those applied previously
for plasma analysis [20] with the exception that SIM detection was used instead
of SRM. This decision was made to allow direct comparison to the LC–MS
results, which also used SIM.
Table 12.4 contains the results for 12 marketed drugs studied in this
preliminary comparison. The data indicate that, in general, a high correlation
was found between the two methods, although the data set obtained by
nanoESI was unfortunately incomplete. While all 12 drugs were detected by
positive ion ESI using the column switching method, only 11 compounds weredetected by nanoESI. It is noted that the single compound not detected by
Table 12.4 Comparison of metabolic stability data for 12 drugs analyzed by two separateanalytical techniques
DrugPercent metabolism
LC–ESI/MSPercent metabolism
Infusion nanoESI/MS
Carbamazepine 10.9 0.0*Propranolol 20.9 10.3Dextromethorphan 25.0 31.0Promethazine 28.1 0.0*Imipramine 31.4 0.0*Bufuralol 32.1 32.5Diltiazem 34.3 40.7Tolbutamide 36.4 0.0*Erythromycin 41.1 39.5Propafenone 59.0 58.7Verapamil 62.9 63.6Diclofenac 89.5 n.d.
In both cases drugs (4mM) were incubated with human liver microsomes and the percentmetabolism after 30 min was determined either by LC–ESI/MS or by infusion nanoESI/MS. TheMS detection scheme used in both cases was selected ion monitoring (SIM). The protonated parentmolecule was monitored in all cases.
*No metabolism evident; high matrix background in SIM mode too high to observe signaldifference related to metabolism.
n.d., not detected.Table Adapted from Dethy, J.M. et al. Proc. 51st Conf. Mass Spectrom. and Allied Topics. With
permission.
Role and Potential of Infusion Nanoelectrospray Ionization 343
Copyright © 2005 CRC Press, LLC

7/21/2019 Using Mass Spectrometry for Drug Metabolism Studies
http://slidepdf.com/reader/full/using-mass-spectrometry-for-drug-metabolism-studies 351/362
nanoESI, diclofenac, is often analyzed under negative ion conditions and that
negative ion conditions were not employed in the existing study. Another
recognized difference between the two data sets is that four of the 12
compounds analyzed by nanoESI exhibited a spurious value of zero percentmetabolism. This phenomenon was attributed to high matrix background,
since all compounds, with the exception of diclofenac, were readily detected as
neat solutions. SIM conditions were employed in this study to allow direct
comparison to the column-switching LC–MS approach. It is clear from these
results that MS/MS detection is a prerequisite for successful bioanalysis by
infusion nanoESI. The incorporation of MS/MS detection with metabolic
stability screening is currently being investigated.
In addition to matrix interference, matrix-related ion suppression also
affects the observed analyte signal (see Chapter 4 for more on this topic). Toinvestigate this phenomenon, three of the 12 compounds listed in Table 12.4
were subjected to a formal assessment of ion suppression. In this experiment,
replicate infusion of a neat solution was compared to replicates obtained
from spiking the same amount of neat compound into control matrix that
had not been extracted. The method cited above for PPT was applied to both
sample sets. The overall matrix ion suppression observed for erythromycin,
bufuralol, and diltiazem was 75, 84, and 73%, respectively. While this level of
ion suppression is significant, it should be noted that strong agreement was
still observed between the two methods. The following conclusions can bedrawn from this investigation. First, ion suppression by NADPH did not
seem to play a major role in this investigation. Since one-half of the samples
did not contain NADPH, there was concern about ionization suppression
affecting the results. The close correlation between the metabolic stability
results for compounds not affected by matrix interference suggests that this
was not the case. One explanation is that the NADPH was largely insoluble
in the final solution taken for infusion. Ultimately, this investigation showed
the possibility of infusion nanoESI for metabolic stability assessment without
the need for sample clean-up by SPE. Although not rigorously established in
this limited study, the likelihood of instrument robustness is high, despite the
lack of sample clean-up, due to the finite sample volume used per analysis.
Finally, it is fully acknowledged that an understanding of the true utility of
this approach will require a vastly expanded investigation and will need to
incorporate MS/MS detection.
12.4.4 In vivo bioanalysis: expanded method validation and
sample clean-up
The final example is an illustration of the potential use of infusion nanoESI for
clinical bioanalysis. In contrast to the discovery-based applications presented
to this point, clinical applications require a higher level of validation, similar to
what is expected for GLP–toxicology assays [29]. In this particular example,
Kapron and co-workers quantified the drug midazolam in human plasma by
344 Using Mass Spectrometry for Drug Metabolism Studies
Copyright © 2005 CRC Press, LLC
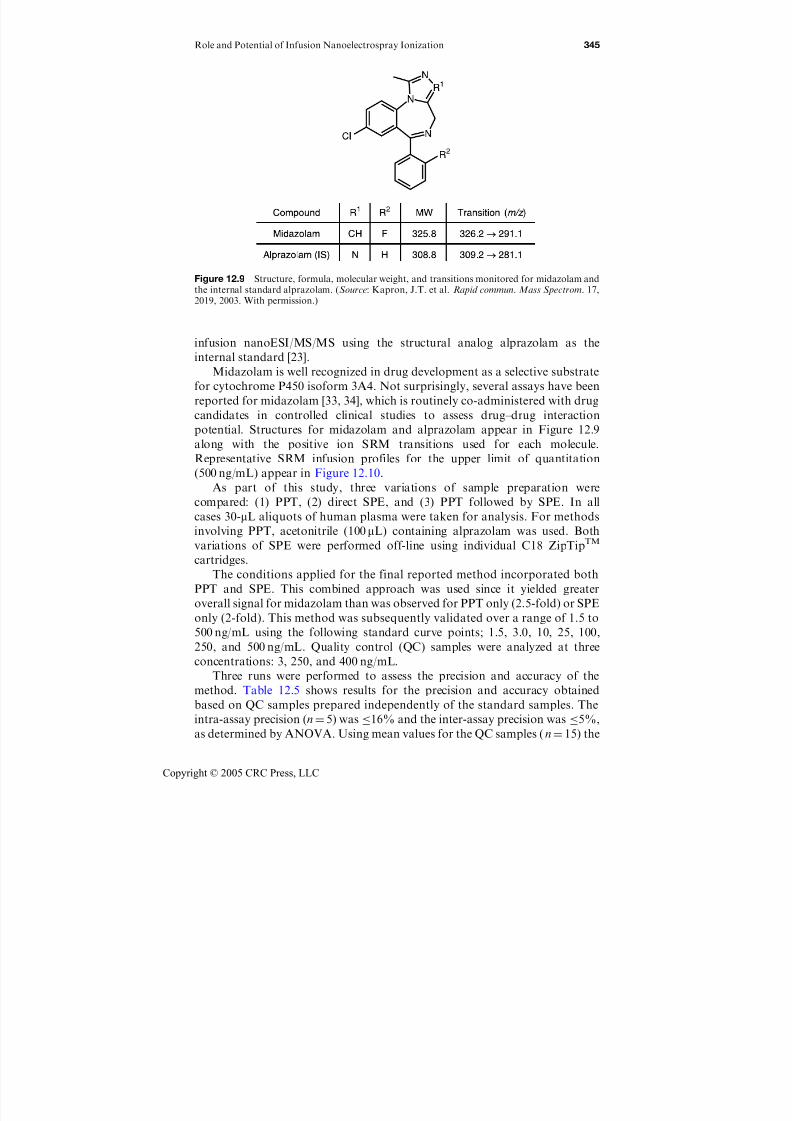
7/21/2019 Using Mass Spectrometry for Drug Metabolism Studies
http://slidepdf.com/reader/full/using-mass-spectrometry-for-drug-metabolism-studies 352/362
infusion nanoESI/MS/MS using the structural analog alprazolam as the
internal standard [23].
Midazolam is well recognized in drug development as a selective substrate
for cytochrome P450 isoform 3A4. Not surprisingly, several assays have beenreported for midazolam [33, 34], which is routinely co-administered with drug
candidates in controlled clinical studies to assess drug–drug interaction
potential. Structures for midazolam and alprazolam appear in Figure 12.9
along with the positive ion SRM transitions used for each molecule.
Representative SRM infusion profiles for the upper limit of quantitation
(500 ng/mL) appear in Figure 12.10.
As part of this study, three variations of sample preparation were
compared: (1) PPT, (2) direct SPE, and (3) PPT followed by SPE. In all
cases 30-mL aliquots of human plasma were taken for analysis. For methods
involving PPT, acetonitrile (100 mL) containing alprazolam was used. Both
variations of SPE were performed off-line using individual C18 ZipTipTM
cartridges.
The conditions applied for the final reported method incorporated both
PPT and SPE. This combined approach was used since it yielded greater
overall signal for midazolam than was observed for PPT only (2.5-fold) or SPE
only (2-fold). This method was subsequently validated over a range of 1.5 to
500 ng/mL using the following standard curve points; 1.5, 3.0, 10, 25, 100,
250, and 500 ng/mL. Quality control (QC) samples were analyzed at three
concentrations: 3, 250, and 400 ng/mL.
Three runs were performed to assess the precision and accuracy of the
method. Table 12.5 shows results for the precision and accuracy obtained
based on QC samples prepared independently of the standard samples. The
intra-assay precision (n¼ 5) was 16% and the inter-assay precision was 5%,
as determined by ANOVA. Using mean values for the QC samples ( n¼ 15) the
Figure 12.9 Structure, formula, molecular weight, and transitions monitored for midazolam andthe internal standard alprazolam. (Source: Kapron, J.T. et al. Rapid commun. Mass Spectrom. 17,2019, 2003. With permission.)
Role and Potential of Infusion Nanoelectrospray Ionization 345
Copyright © 2005 CRC Press, LLC
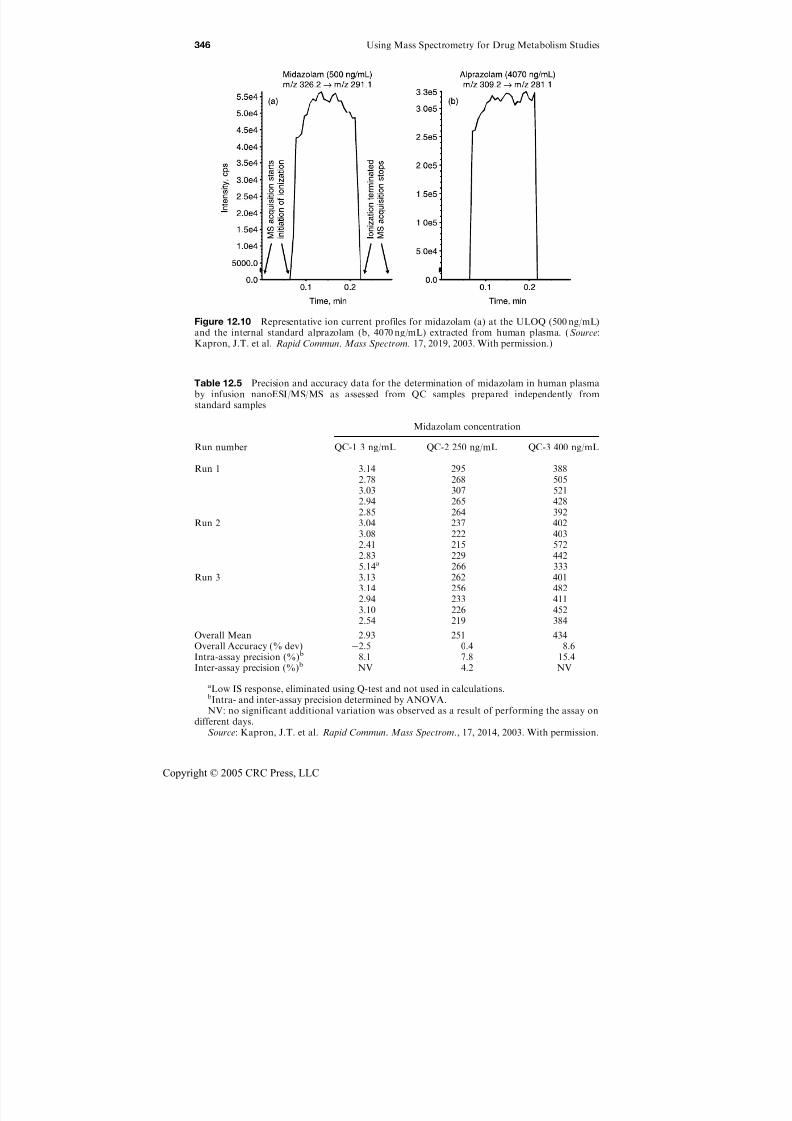
7/21/2019 Using Mass Spectrometry for Drug Metabolism Studies
http://slidepdf.com/reader/full/using-mass-spectrometry-for-drug-metabolism-studies 353/362
Table 12.5 Precision and accuracy data for the determination of midazolam in human plasmaby infusion nanoESI/MS/MS as assessed from QC samples prepared independently fromstandard samples
Midazolam concentration
Run number QC-1 3 ng/mL QC-2 250 ng/mL QC-3 400 ng/mL
Run 1 3.14 295 3882.78 268 5053.03 307 5212.94 265 428
2.85 264 392Run 2 3.04 237 402
3.08 222 4032.41 215 5722.83 229 4425.14a 266 333
Run 3 3.13 262 4013.14 256 4822.94 233 4113.10 226 4522.54 219 384
Overall Mean 2.93 251 434Overall Accuracy (% dev) 2.5 0.4 8.6Intra-assay precision (%)b 8.1 7.8 15.4Inter-assay precision (%)b NV 4.2 NV
aLow IS response, eliminated using Q-test and not used in calculations.bIntra- and inter-assay precision determined by ANOVA.NV: no significant additional variation was observed as a result of performing the assay on
different days.Source: Kapron, J.T. et al. Rapid Commun. Mass Spectrom., 17, 2014, 2003. With permission.
Figure 12.10 Representative ion current profiles for midazolam (a) at the ULOQ (500 ng/mL)and the internal standard alprazolam (b, 4070 ng/mL) extracted from human plasma. (Source:Kapron, J.T. et al. Rapid Commun. Mass Spectrom. 17, 2019, 2003. With permission.)
346 Using Mass Spectrometry for Drug Metabolism Studies
Copyright © 2005 CRC Press, LLC
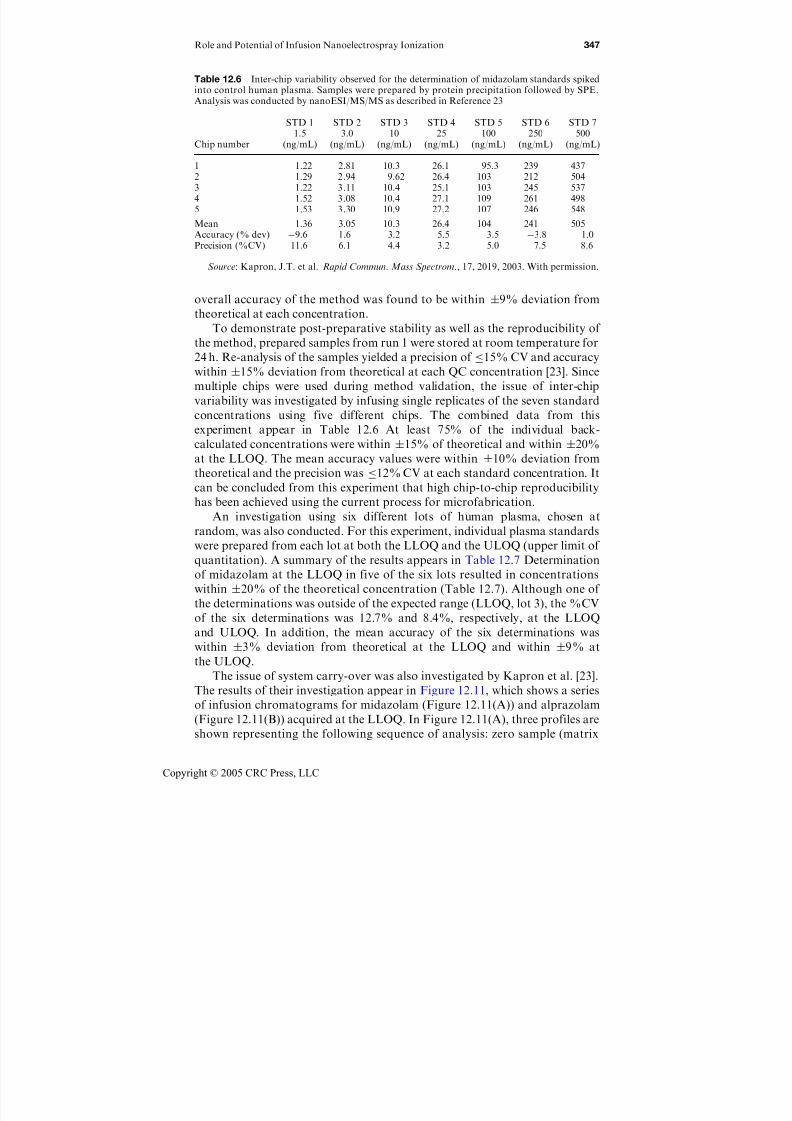
7/21/2019 Using Mass Spectrometry for Drug Metabolism Studies
http://slidepdf.com/reader/full/using-mass-spectrometry-for-drug-metabolism-studies 354/362
overall accuracy of the method was found to be within 9% deviation from
theoretical at each concentration.
To demonstrate post-preparative stability as well as the reproducibility of
the method, prepared samples from run 1 were stored at room temperature for
24 h. Re-analysis of the samples yielded a precision of 15% CV and accuracy
within 15% deviation from theoretical at each QC concentration [23]. Since
multiple chips were used during method validation, the issue of inter-chipvariability was investigated by infusing single replicates of the seven standard
concentrations using five different chips. The combined data from this
experiment appear in Table 12.6 At least 75% of the individual back-
calculated concentrations were within 15% of theoretical and within 20%
at the LLOQ. The mean accuracy values were within 10% deviation from
theoretical and the precision was 12% CV at each standard concentration. It
can be concluded from this experiment that high chip-to-chip reproducibility
has been achieved using the current process for microfabrication.
An investigation using six different lots of human plasma, chosen at
random, was also conducted. For this experiment, individual plasma standards
were prepared from each lot at both the LLOQ and the ULOQ (upper limit of
quantitation). A summary of the results appears in Table 12.7 Determination
of midazolam at the LLOQ in five of the six lots resulted in concentrations
within 20% of the theoretical concentration (Table 12.7). Although one of
the determinations was outside of the expected range (LLOQ, lot 3), the %CV
of the six determinations was 12.7% and 8.4%, respectively, at the LLOQ
and ULOQ. In addition, the mean accuracy of the six determinations was
within 3% deviation from theoretical at the LLOQ and within 9% at
the ULOQ.
The issue of system carry-over was also investigated by Kapron et al. [23].
The results of their investigation appear in Figure 12.11, which shows a series
of infusion chromatograms for midazolam (Figure 12.11(A)) and alprazolam
(Figure 12.11(B)) acquired at the LLOQ. In Figure 12.11(A), three profiles are
shown representing the following sequence of analysis: zero sample (matrix
Table 12.6 Inter-chip variability observed for the determination of midazolam standards spikedinto control human plasma. Samples were prepared by protein precipitation followed by SPE.Analysis was conducted by nanoESI/MS/MS as described in Reference 23
Chip number
STD 11.5
(ng/mL)
STD 23.0
(ng/mL)
STD 310
(ng/mL)
STD 425
(ng/mL)
STD 5100
(ng/mL)
STD 6250
(ng/mL)
STD 7500
(ng/mL)
1 1.22 2.81 10.3 26.1 95.3 239 4372 1.29 2.94 9.62 26.4 103 212 5043 1.22 3.11 10.4 25.1 103 245 5374 1.52 3.08 10.4 27.1 109 261 4985 1.53 3.30 10.9 27.2 107 246 548
Mean 1.36 3.05 10.3 26.4 104 241 505Accuracy (% dev) 9.6 1.6 3.2 5.5 3.5 3.8 1.0Precision (%CV) 11.6 6.1 4.4 3.2 5.0 7.5 8.6
Source: Kapron, J.T. et al. Rapid Commun. Mass Spectrom., 17, 2019, 2003. With permission.
Role and Potential of Infusion Nanoelectrospray Ionization 347
Copyright © 2005 CRC Press, LLC
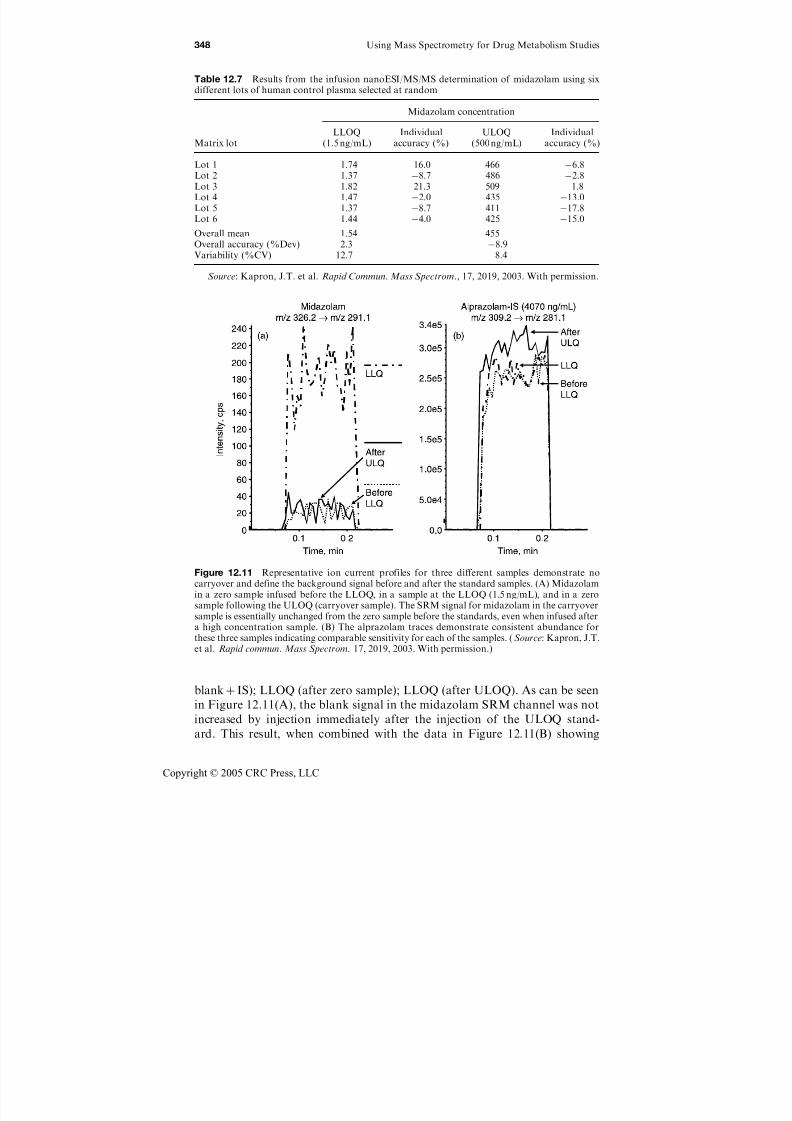
7/21/2019 Using Mass Spectrometry for Drug Metabolism Studies
http://slidepdf.com/reader/full/using-mass-spectrometry-for-drug-metabolism-studies 355/362
blankþ IS); LLOQ (after zero sample); LLOQ (after ULOQ). As can be seen
in Figure 12.11(A), the blank signal in the midazolam SRM channel was not
increased by injection immediately after the injection of the ULOQ stand-
ard. This result, when combined with the data in Figure 12.11(B) showing
Figure 12.11 Representative ion current profiles for three different samples demonstrate nocarryover and define the background signal before and after the standard samples. (A) Midazolamin a zero sample infused before the LLOQ, in a sample at the LLOQ (1.5 ng/mL), and in a zerosample following the ULOQ (carryover sample). The SRM signal for midazolam in the carryoversample is essentially unchanged from the zero sample before the standards, even when infused aftera high concentration sample. (B) The alprazolam traces demonstrate consistent abundance for
these three samples indicating comparable sensitivity for each of the samples. ( Source: Kapron, J.T.et al. Rapid commun. Mass Spectrom. 17, 2019, 2003. With permission.)
Table 12.7 Results from the infusion nanoESI/MS/MS determination of midazolam using sixdifferent lots of human control plasma selected at random
Midazolam concentration
Matrix lotLLOQ
(1.5 ng/mL)Individual
accuracy (%)ULOQ
(500 ng/mL)Individual
accuracy (%)
Lot 1 1.74 16.0 466 6.8Lot 2 1.37 8.7 486 2.8Lot 3 1.82 21.3 509 1.8Lot 4 1.47 2.0 435 13.0Lot 5 1.37 8.7 411 17.8Lot 6 1.44 4.0 425 15.0
Overall mean 1.54 455Overall accuracy (%Dev) 2.3 8.9
Variability (%CV) 12.7 8.4
Source: Kapron, J.T. et al. Rapid Commun. Mass Spectrom., 17, 2019, 2003. With permission.
348 Using Mass Spectrometry for Drug Metabolism Studies
Copyright © 2005 CRC Press, LLC

7/21/2019 Using Mass Spectrometry for Drug Metabolism Studies
http://slidepdf.com/reader/full/using-mass-spectrometry-for-drug-metabolism-studies 356/362
consistent response for the internal standard, confirms the avoidance of system
carryover.
The midazolam application by Kapron et al. indicates the potential of
infusion nanoESI for applications in drug development. The elimination of system carryover is a powerful advantage of this technology, particularly for
validated applications, where a considerable fraction of method development
time is devoted to this issue.
Another potential use of this technology is for multi-analyte assays, such as
drugs and metabolites, or parent and pro-drug combinations. Such applica-
tions require additional chromatographic methods development and require
extractions to be less selective than single analyte assays. Infusion nanoESI
would appear well suited to such situations, provided cases are selected
that do not need LC separation for selectivity. A recent example of a multi-analyte assay was reported by Leuthold et al. [24]. This work, which
was conducted on a linear ion trap instrument, used infusion nanoESI/
MS/MS to quantify a drug and its desethyl metabolite in human plasma.
The method, which involved LLE and used a stable labeled isotope internal
standard for the parent drug, was validated over a range from 2.5 to
1000 ng/mL. Although these preliminary investigations appear promising,
further investigations involving direct comparisons to existing LC–MS/MS
methods will be needed to understand the role and potential of infusion
nanoESI/MS/MS for validated assays and before this work can truly beapplied for GLP bioanalysis.
12.5 Future Work
12.5.1 Nano ESI
As indicated by the four preceding examples, automated infusion nanoESI has
been demonstrated as a viable technique for several forms of pharmaceutical
bioanalysis. However, despite the initial excitement surrounding this technol-
ogy, it is important to acknowledge that infusion nanoESI has not been fully
reduced-to-practice for routine bioanalytical applications. In the section that
follows, the promise and potential pitfalls of this technology are addressed
based on current knowledge and experience. How this technology ultimately
fares compared to existing methods will depend on several factors such as
robustness, reliability (quality) and cost effectiveness. These issues are
discussed along with some fundamental experiments that remain to be
performed. Recent or ongoing upgrades to the Nanomate 100TM will also be
mentioned.
Depending on the method used for sample preparation, nanoESI would
appear to be robust enough for routine use. Based on our own experience, care
must be taken to avoid particulate matter, which can clog the ESI nozzles on
the chip. Nevertheless, good precision and accuracy data can be derived
in biological matrices using only PPT when a suitable internal standard is
Role and Potential of Infusion Nanoelectrospray Ionization 349
Copyright © 2005 CRC Press, LLC
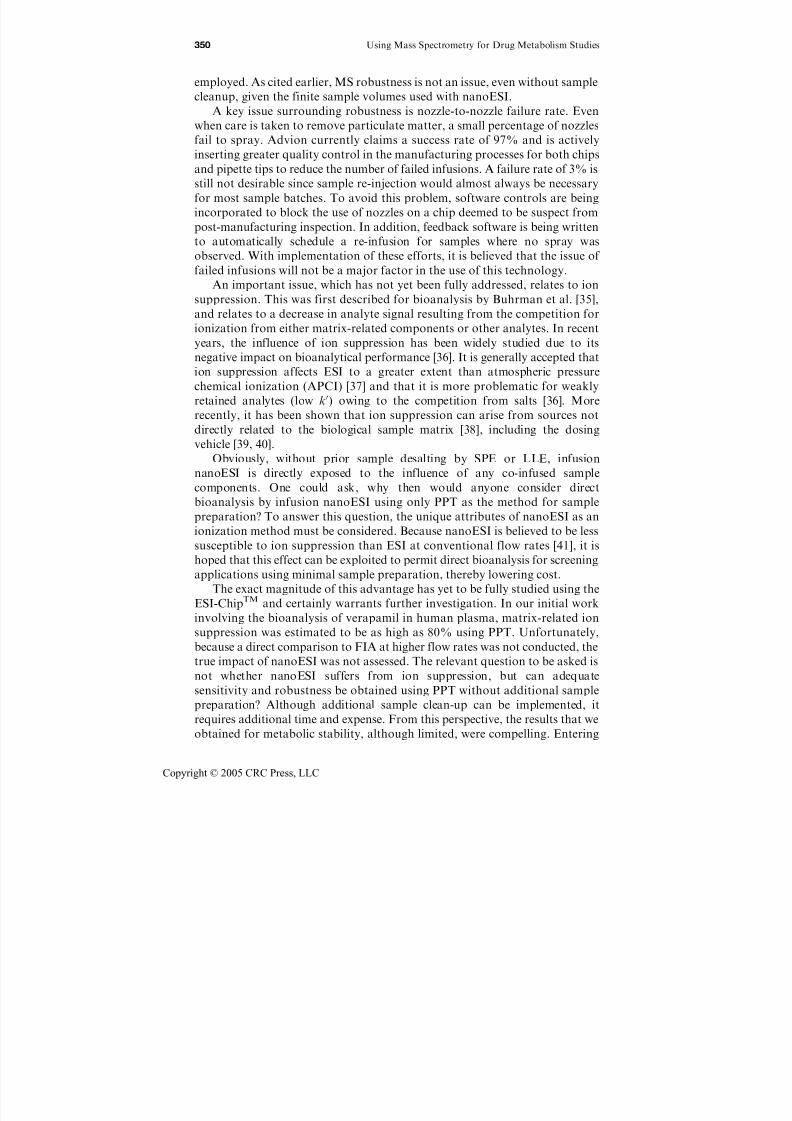
7/21/2019 Using Mass Spectrometry for Drug Metabolism Studies
http://slidepdf.com/reader/full/using-mass-spectrometry-for-drug-metabolism-studies 357/362
employed. As cited earlier, MS robustness is not an issue, even without sample
cleanup, given the finite sample volumes used with nanoESI.
A key issue surrounding robustness is nozzle-to-nozzle failure rate. Even
when care is taken to remove particulate matter, a small percentage of nozzlesfail to spray. Advion currently claims a success rate of 97% and is actively
inserting greater quality control in the manufacturing processes for both chips
and pipette tips to reduce the number of failed infusions. A failure rate of 3% is
still not desirable since sample re-injection would almost always be necessary
for most sample batches. To avoid this problem, software controls are being
incorporated to block the use of nozzles on a chip deemed to be suspect from
post-manufacturing inspection. In addition, feedback software is being written
to automatically schedule a re-infusion for samples where no spray was
observed. With implementation of these efforts, it is believed that the issue of failed infusions will not be a major factor in the use of this technology.
An important issue, which has not yet been fully addressed, relates to ion
suppression. This was first described for bioanalysis by Buhrman et al. [35],
and relates to a decrease in analyte signal resulting from the competition for
ionization from either matrix-related components or other analytes. In recent
years, the influence of ion suppression has been widely studied due to its
negative impact on bioanalytical performance [36]. It is generally accepted that
ion suppression affects ESI to a greater extent than atmospheric pressure
chemical ionization (APCI) [37] and that it is more problematic for weaklyretained analytes (low k0) owing to the competition from salts [36]. More
recently, it has been shown that ion suppression can arise from sources not
directly related to the biological sample matrix [38], including the dosing
vehicle [39, 40].
Obviously, without prior sample desalting by SPE or LLE, infusion
nanoESI is directly exposed to the influence of any co-infused sample
components. One could ask, why then would anyone consider direct
bioanalysis by infusion nanoESI using only PPT as the method for sample
preparation? To answer this question, the unique attributes of nanoESI as an
ionization method must be considered. Because nanoESI is believed to be less
susceptible to ion suppression than ESI at conventional flow rates [41], it is
hoped that this effect can be exploited to permit direct bioanalysis for screening
applications using minimal sample preparation, thereby lowering cost.
The exact magnitude of this advantage has yet to be fully studied using the
ESI-ChipTM and certainly warrants further investigation. In our initial work
involving the bioanalysis of verapamil in human plasma, matrix-related ion
suppression was estimated to be as high as 80% using PPT. Unfortunately,
because a direct comparison to FIA at higher flow rates was not conducted, the
true impact of nanoESI was not assessed. The relevant question to be asked is
not whether nanoESI suffers from ion suppression, but can adequate
sensitivity and robustness be obtained using PPT without additional sample
preparation? Although additional sample clean-up can be implemented, it
requires additional time and expense. From this perspective, the results that we
obtained for metabolic stability, although limited, were compelling. Entering
350 Using Mass Spectrometry for Drug Metabolism Studies
Copyright © 2005 CRC Press, LLC

7/21/2019 Using Mass Spectrometry for Drug Metabolism Studies
http://slidepdf.com/reader/full/using-mass-spectrometry-for-drug-metabolism-studies 358/362
into the investigation, we fully expected that generic SPE would be needed
similar to the FIA study reported by Zheng et al. [11]. As reported earlier in
this chapter, reasonable data were obtained by nanoESI despite the high salt
concentration present in the microsomal buffer used. This observation leadsto a key question that has not yet been fully addressed about the viability of
the ESI-ChipTM for drug discovery applications. Namely, how often is sample
clean-up (SPE, LLE, etc.) required for successful bioanalysis? While an
informed answer to this question awaits further testing, it is a critical issue
since it governs two key determinants of successful discovery bioanalysis: cost
and speed.
An important fact about LC–MS/MS based ion suppression is that it is
time dependent. It is widely known that ion suppression often varies
considerably over the course of a chromatogram and in many cases thesechanges occur over the time frame of a chromatographic peak. This issue, often
cited as a reason for poor IS tracking, ultimately leads to poor precision and
accuracy. Regardless of the level of ion suppression observed with infusion
nanoESI, it has the distinct advantage of remaining constant over the course of
analysis. This factor is significant, since it may lead to improved IS tracking for
infusion nanoESI relative to LC–MS/MS. In our opinion, this is another
attribute that merits detailed investigation.
In addition to the advantage of constant ion suppression, IS tracking might
also benefit from the use of nanoESI since by default the IS is alwaysco-ionized with the analyte. Recent reports in the literature, such as the work
of Shi [42], confirm the widely held belief that superior bioanalytical
performance results when an IS co-elutes with the analyte (for cases when a
structural analog IS is used). Among other effects, a wider dynamic range was
observed in the case when co-elution occurred.
Nevertheless, because stable isotope-labeled internal standards are rarely
available for discovery applications, the impact of ion suppression from
components not present in the sample matrix is of major concern. Examples of
this problem include the dosing vehicle, other analytes and drug metabolites.
The degree to which analog internal standards can compensate for these effects
in nanoESI remains to be determined. Needless to say, this is an important
issue since the agents listed above (i.e., vehicle, analytes, metabolites) all have
the potential to remain in the sample even after deliberate clean-up (e.g., SPE).
It is important to note these situations can occur during LC–MS/MS, albeit
they are less likely to do so.
Another issue regarding the ESI-ChipTM that must be addressed is the
potential loss in selectivity owing to the lack of on-line chromatography. In
addition to the obvious inability to analyze isomers, another potential issue
arises from what is typically referred to as ‘metabolite cross-talk.’ A common
example of this effect occurs when drug conjugates, such as sulfates and
glucuronides, undergo in-source collision-induced dissociation (CID) to
generate alternate sources of precursor ions for the drug prior to mass
selection by the triple quadrupole (see Chapter 1 for more on this topic), this
problem is sometimes referred to as metabolite cross-talk. Because these
Role and Potential of Infusion Nanoelectrospray Ionization 351
Copyright © 2005 CRC Press, LLC
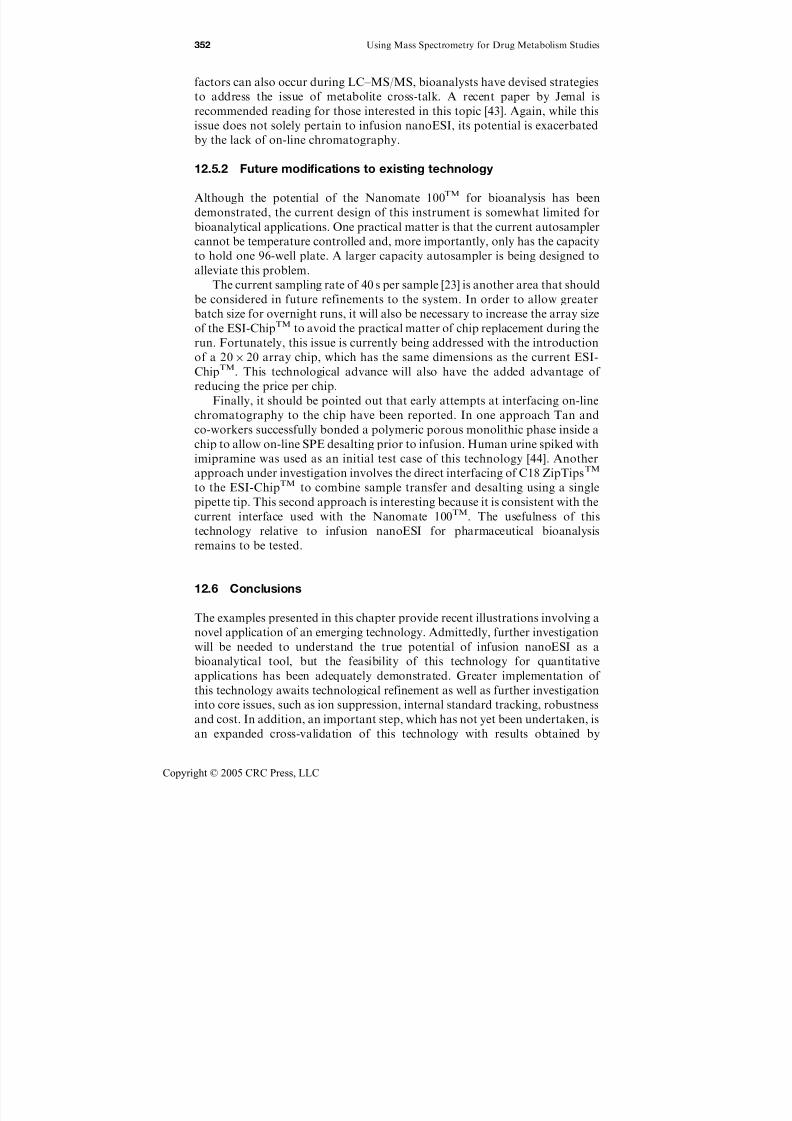
7/21/2019 Using Mass Spectrometry for Drug Metabolism Studies
http://slidepdf.com/reader/full/using-mass-spectrometry-for-drug-metabolism-studies 359/362
factors can also occur during LC–MS/MS, bioanalysts have devised strategies
to address the issue of metabolite cross-talk. A recent paper by Jemal is
recommended reading for those interested in this topic [43]. Again, while this
issue does not solely pertain to infusion nanoESI, its potential is exacerbatedby the lack of on-line chromatography.
12.5.2 Future modifications to existing technology
Although the potential of the Nanomate 100TM for bioanalysis has been
demonstrated, the current design of this instrument is somewhat limited for
bioanalytical applications. One practical matter is that the current autosampler
cannot be temperature controlled and, more importantly, only has the capacity
to hold one 96-well plate. A larger capacity autosampler is being designed toalleviate this problem.
The current sampling rate of 40 s per sample [23] is another area that should
be considered in future refinements to the system. In order to allow greater
batch size for overnight runs, it will also be necessary to increase the array size
of the ESI-ChipTM to avoid the practical matter of chip replacement during the
run. Fortunately, this issue is currently being addressed with the introduction
of a 20 20 array chip, which has the same dimensions as the current ESI-
ChipTM. This technological advance will also have the added advantage of
reducing the price per chip.Finally, it should be pointed out that early attempts at interfacing on-line
chromatography to the chip have been reported. In one approach Tan and
co-workers successfully bonded a polymeric porous monolithic phase inside a
chip to allow on-line SPE desalting prior to infusion. Human urine spiked with
imipramine was used as an initial test case of this technology [44]. Another
approach under investigation involves the direct interfacing of C18 ZipTipsTM
to the ESI-ChipTM to combine sample transfer and desalting using a single
pipette tip. This second approach is interesting because it is consistent with the
current interface used with the Nanomate 100TM. The usefulness of this
technology relative to infusion nanoESI for pharmaceutical bioanalysis
remains to be tested.
12.6 Conclusions
The examples presented in this chapter provide recent illustrations involving a
novel application of an emerging technology. Admittedly, further investigation
will be needed to understand the true potential of infusion nanoESI as a
bioanalytical tool, but the feasibility of this technology for quantitative
applications has been adequately demonstrated. Greater implementation of
this technology awaits technological refinement as well as further investigation
into core issues, such as ion suppression, internal standard tracking, robustness
and cost. In addition, an important step, which has not yet been undertaken, is
an expanded cross-validation of this technology with results obtained by
352 Using Mass Spectrometry for Drug Metabolism Studies
Copyright © 2005 CRC Press, LLC
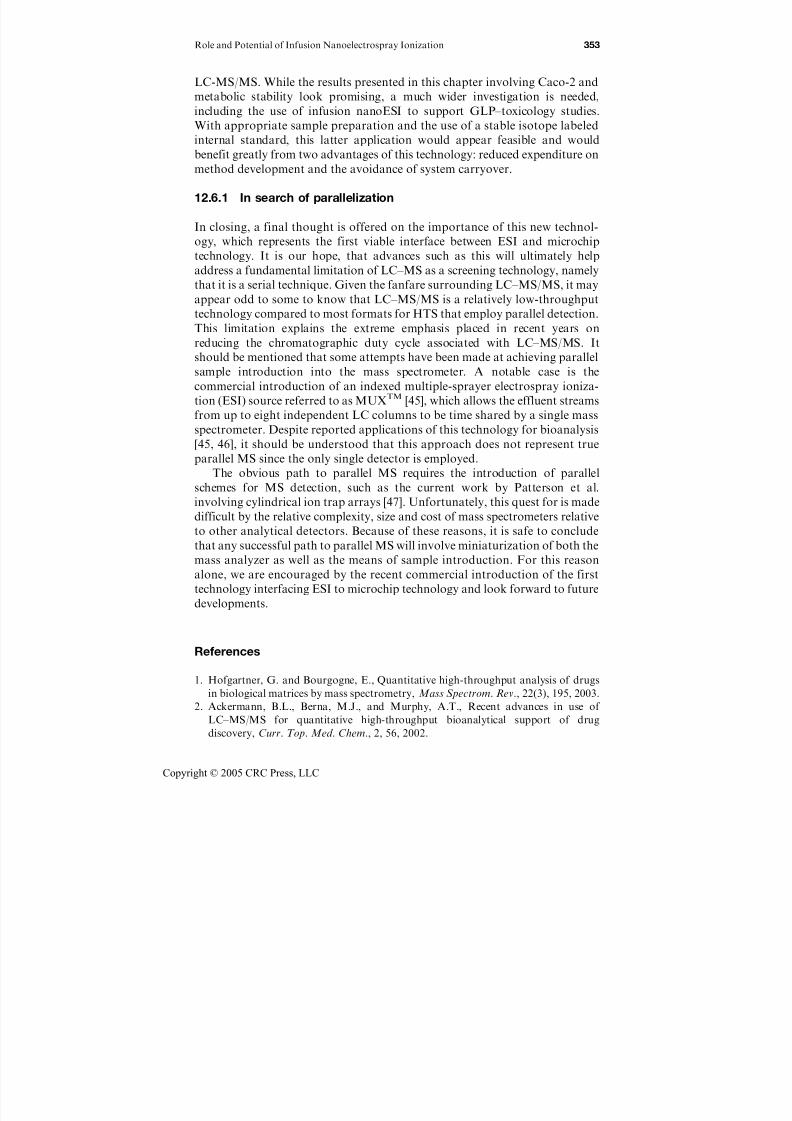
7/21/2019 Using Mass Spectrometry for Drug Metabolism Studies
http://slidepdf.com/reader/full/using-mass-spectrometry-for-drug-metabolism-studies 360/362
LC-MS/MS. While the results presented in this chapter involving Caco-2 and
metabolic stability look promising, a much wider investigation is needed,
including the use of infusion nanoESI to support GLP–toxicology studies.
With appropriate sample preparation and the use of a stable isotope labeledinternal standard, this latter application would appear feasible and would
benefit greatly from two advantages of this technology: reduced expenditure on
method development and the avoidance of system carryover.
12.6.1 In search of parallelization
In closing, a final thought is offered on the importance of this new technol-
ogy, which represents the first viable interface between ESI and microchip
technology. It is our hope, that advances such as this will ultimately helpaddress a fundamental limitation of LC–MS as a screening technology, namely
that it is a serial technique. Given the fanfare surrounding LC–MS/MS, it may
appear odd to some to know that LC–MS/MS is a relatively low-throughput
technology compared to most formats for HTS that employ parallel detection.
This limitation explains the extreme emphasis placed in recent years on
reducing the chromatographic duty cycle associated with LC–MS/MS. It
should be mentioned that some attempts have been made at achieving parallel
sample introduction into the mass spectrometer. A notable case is the
commercial introduction of an indexed multiple-sprayer electrospray ioniza-tion (ESI) source referred to as MUXTM [45], which allows the effluent streams
from up to eight independent LC columns to be time shared by a single mass
spectrometer. Despite reported applications of this technology for bioanalysis
[45, 46], it should be understood that this approach does not represent true
parallel MS since the only single detector is employed.
The obvious path to parallel MS requires the introduction of parallel
schemes for MS detection, such as the current work by Patterson et al.
involving cylindrical ion trap arrays [47]. Unfortunately, this quest for is made
difficult by the relative complexity, size and cost of mass spectrometers relative
to other analytical detectors. Because of these reasons, it is safe to conclude
that any successful path to parallel MS will involve miniaturization of both the
mass analyzer as well as the means of sample introduction. For this reason
alone, we are encouraged by the recent commercial introduction of the first
technology interfacing ESI to microchip technology and look forward to future
developments.
References
1. Hofgartner, G. and Bourgogne, E., Quantitative high-throughput analysis of drugs
in biological matrices by mass spectrometry, Mass Spectrom. Rev., 22(3), 195, 2003.
2. Ackermann, B.L., Berna, M.J., and Murphy, A.T., Recent advances in use of
LC–MS/MS for quantitative high-throughput bioanalytical support of drug
discovery, Curr. Top. Med. Chem., 2, 56, 2002.
Role and Potential of Infusion Nanoelectrospray Ionization 353
Copyright © 2005 CRC Press, LLC
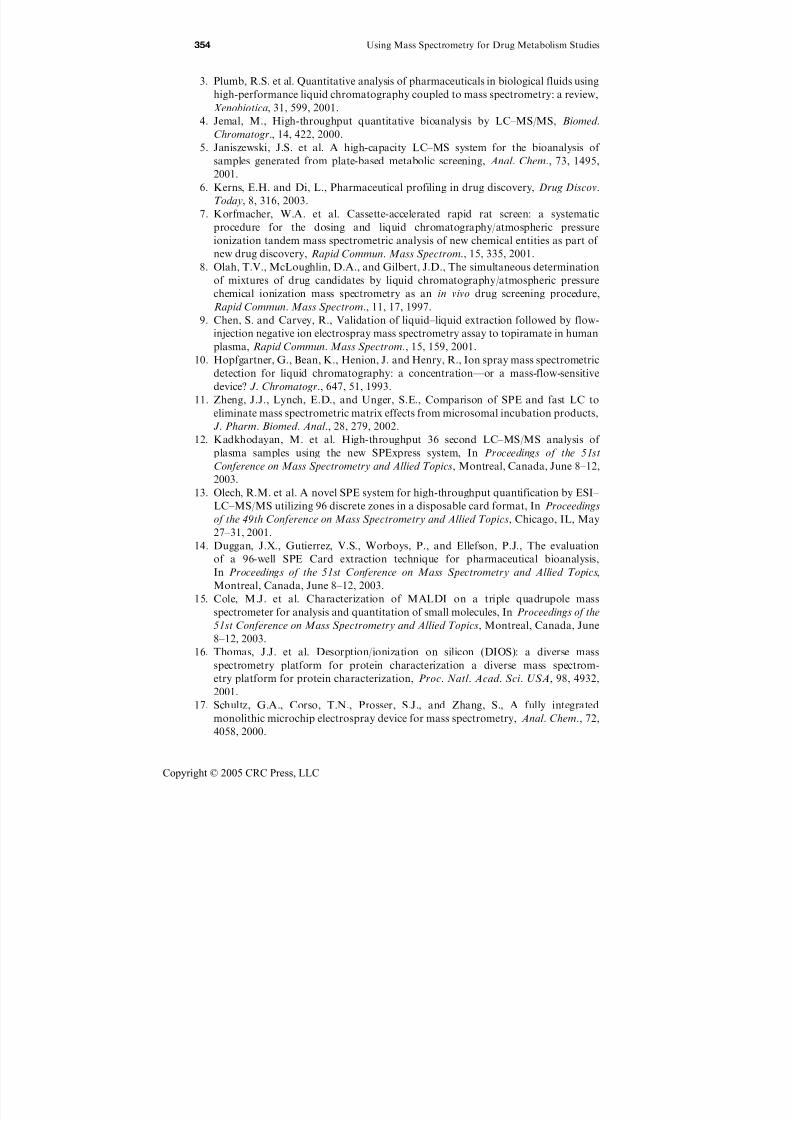
7/21/2019 Using Mass Spectrometry for Drug Metabolism Studies
http://slidepdf.com/reader/full/using-mass-spectrometry-for-drug-metabolism-studies 361/362
3. Plumb, R.S. et al. Quantitative analysis of pharmaceuticals in biological fluids using
high-performance liquid chromatography coupled to mass spectrometry: a review,
Xenobiotica, 31, 599, 2001.
4. Jemal, M., High-throughput quantitative bioanalysis by LC–MS/MS, Biomed.
Chromatogr., 14, 422, 2000.
5. Janiszewski, J.S. et al. A high-capacity LC–MS system for the bioanalysis of
samples generated from plate-based metabolic screening, Anal. Chem., 73, 1495,
2001.
6. Kerns, E.H. and Di, L., Pharmaceutical profiling in drug discovery, Drug Discov.
Today, 8, 316, 2003.
7. Korfmacher, W.A. et al. Cassette-accelerated rapid rat screen: a systematic
procedure for the dosing and liquid chromatography/atmospheric pressure
ionization tandem mass spectrometric analysis of new chemical entities as part of
new drug discovery, Rapid Commun. Mass Spectrom., 15, 335, 2001.8. Olah, T.V., McLoughlin, D.A., and Gilbert, J.D., The simultaneous determination
of mixtures of drug candidates by liquid chromatography/atmospheric pressure
chemical ionization mass spectrometry as an in vivo drug screening procedure,
Rapid Commun. Mass Spectrom., 11, 17, 1997.
9. Chen, S. and Carvey, R., Validation of liquid–liquid extraction followed by flow-
injection negative ion electrospray mass spectrometry assay to topiramate in human
plasma, Rapid Commun. Mass Spectrom., 15, 159, 2001.
10. Hopfgartner, G., Bean, K., Henion, J. and Henry, R., Ion spray mass spectrometric
detection for liquid chromatography: a concentration—or a mass-flow-sensitive
device? J. Chromatogr., 647, 51, 1993.11. Zheng, J.J., Lynch, E.D., and Unger, S.E., Comparison of SPE and fast LC to
eliminate mass spectrometric matrix effects from microsomal incubation products,
J. Pharm. Biomed. Anal., 28, 279, 2002.
12. Kadkhodayan, M. et al. High-throughput 36 second LC–MS/MS analysis of
plasma samples using the new SPExpress system, In Proceedings of the 51st
Conference on Mass Spectrometry and Allied Topics, Montreal, Canada, June 8–12,
2003.
13. Olech, R.M. et al. A novel SPE system for high-throughput quantification by ESI–
LC–MS/MS utilizing 96 discrete zones in a disposable card format, In Proceedingsof the 49th Conference on Mass Spectrometry and Allied Topics, Chicago, IL, May
27–31, 2001.
14. Duggan, J.X., Gutierrez, V.S., Worboys, P., and Ellefson, P.J., The evaluation
of a 96-well SPE Card extraction technique for pharmaceutical bioanalysis,
In Proceedings of the 51st Conference on Mass Spectrometry and Allied Topics,
Montreal, Canada, June 8–12, 2003.
15. Cole, M.J. et al. Characterization of MALDI on a triple quadrupole mass
spectrometer for analysis and quantitation of small molecules, In Proceedings of the
51st Conference on Mass Spectrometry and Allied Topics, Montreal, Canada, June
8–12, 2003.16. Thomas, J.J. et al. Desorption/ionization on silicon (DIOS): a diverse mass
spectrometry platform for protein characterization a diverse mass spectrom-
etry platform for protein characterization, Proc. Natl. Acad. Sci. USA, 98, 4932,
2001.
17. Schultz, G.A., Corso, T.N., Prosser, S.J., and Zhang, S., A fully integrated
monolithic microchip electrospray device for mass spectrometry, Anal. Chem., 72,
4058, 2000.
354 Using Mass Spectrometry for Drug Metabolism Studies
Copyright © 2005 CRC Press, LLC
7/21/2019 Using Mass Spectrometry for Drug Metabolism Studies
http://slidepdf.com/reader/full/using-mass-spectrometry-for-drug-metabolism-studies 362/362
18. Van Pelt, C., Zhang, S., and Henion, J., Characterization of a fully automated
nanoelectrospray system with mass spectrometric detection for proteomic analyses,
J. Biomolecular Techniques, 6, 3, 2002.
19. Zhang, S., Van Pelt, C.K., and Wilson, D.B., Quantitative determination of
noncovalent binding interactions using automated nanoelectrospray mass spectrom-
etry, Anal. Chem., 75, 3010, 2003.
20. Dethy, J.M. et al. Demonstration of direct bioanalysis of drugs in plasma using
nanoESI infusion from a silicon chip coupled with tandem mass spectrometry, Anal.
Chem., 75, 805, 2003.
21. Van Pelt, C.K. et al. Chip-based automated nanoelectrospray mass spectrometry,
Am. Lab., 35, 14, 2003.
22. Van Pelt, C.K. et al. A fully automated nanoESI tandem mass spectrometric
method for analysis of Caco-2 samples, Rapid Commun. Mass Spectrom., 17, 1573,
2003.23. Kapron, J.T., Pace, E., Van Pelt, C.K., and Henion, J., Quantitation of midazolam
in human plasma by automated chip-based infusion nanoESI tandem mass
spectrometry, Rapid Commun. Mass Spectrom., 17, 2019, 2003.
24. Leuthold, L.A. et al. The use of alternative SRM and full scan MS/MS with chip-
based infusion MS for high throughput analysis in biological fluids with improved
assay selectivity, In Proceedings of the 51st Conference on Mass Spectrometry and
Allied Topics, Montreal, Canada, June 8–12, 2003.
25. Rule, G., Corso, T., Prosser, S., and Schultz, G., Small molecule determination
by nanoelectrospray mass spectrometry from a silicon chip, In Proceedings of the
49th Conference on Mass Spectrometry and Allied Topics, Chicago, IL, May 27–31,2001.
26. Leaver, N. et al. A novel method for the quantitative analysis of immunosuppres-
sive drugs in whole blood using chromatography-free chip-based infusion ion trap
mass spectrometry, In Proceedings of the 51st Conference on Mass Spectrometry and
Allied Topics, Montreal, Canada, June 8–12, 2003.
27. Dethy, J.M. et al. Investigation of infusion nano-ESI using a silicon chip for high
throughput determination of hepatic metabolic stability, In Proceedings of the 51st
Conference on Mass Spectrometry and Allied Topics, Montreal, Canada, June 8–12,
2003.28. Lastelle, M. et al. Utilization of an automated blood sampling device for rat
pharmacokinetic studies with direct bioanalysis by nano-ESI-MS/MS from a silicon
chip, In Proceedings of the 51st Conference on Mass Spectrometry and Allied Topics,
Montreal, Canada, June 8–12, 2003.
29. Shah, V.P. et al. Bioanalytical method validation—a revisit with a decade of
progress. Pharm. Res., 17, 1551, 2000.
30. Hidalgo, I.J., Raub, T.J., and Borchardt, R.T., Characterization of the human
colon carcinoma cell line (Caco-2) as a model system for intestinal epithelial
permeability, Gastroenterology, 96, 736, 1989.
31. Whalen, K.M., Rogers, K.J., Cole, M.J., and Janiszewski, J.S., AutoScan: anautomated workstation for rapid determination of mass and tandem mass
spectrometry conditions for quantitative bioanalytical mass spectrometry, Rapid
Commun. Mass Spectrom., 14, 2074, 2000.
Role and Potential of Infusion Nanoelectrospray Ionization 355