Embed Size (px)
Citation preview
A Good Life in Old Age?
Monitoring and Improving Quality in Long-term Care
© OECD/European Commission 2013
93
PART I
Chapter 3
Using interRAI assessment systems to measure and maintain quality
of long-term care1
by
Iain Carpenter, Royal College of Physicians, London
and
John P. Hirdes, University of Waterloo, Ontario
Rapidly ageing populations and increasing prevalence of chronic diseases present major challenges for policy makers. Populations as well as individuals have different prevalence of conditions related to ageing and chronic disease. This is compounded by cultural and institutional differences in care service provision, eligibility criteria and funding models. Comparing differences at population and individual level helps policy makers address the complexities of maintaining quality in long-term care. This chapter describes how evolution in development of needs assessment instruments has led to a way of producing high-quality data for policy makers. It describes in detail the interRAI system of standardised needs assessment instruments for routine care that generate aggregatable data. Data driven algorithms generate outcome scales, care planning support protocols, quality indicators, and a resource-use casemix system. The chapter then illustrates, with data from nine OECD countries and regions, how needs assessment data recorded at the point of care using the interRAI system can inform policy. It ends with a discussion of factors for consideration when implementing sophisticated needs assessment tools.
I.3. USING INTERRAI ASSESSMENT SYSTEMS TO MEASURE AND MAINTAIN QUALITY OF LONG-TERM CARE
94
I.3. USING INTERRAI ASSESSMENT SYSTEMS TO MEASURE AND MAINTAIN QUALITY OF LONG-TERM CARE
A GOOD LIFE IN OLD AGE? MONITORING AND IMPROVING QUALITY IN LONG-TERM CARE © OECD/EUROPEAN COMMISSION 2013
The quality challenge in long-term care
Providing for the health and social care needs of the growing numbers of older
people and people with chronic diseases in the face of rising costs, limited budgets and
increasing dependency ratios is a major challenge for industrialised countries. In emerging
economies, the rate of population ageing is accelerating, increasing the pressures on policy
makers attempting to respond to the needs of rapidly growing numbers of older people.
For example, it is estimated that the proportion of people aged 65+ in China will double
from 7% to 14% of the population in 26 years (Kinsella and He, 2009). In France this change
took place over 115 years. For countries that are already “old” demographically, as well as
for those that are ageing rapidly, concerns about the costs and quality of care for older
people are inextricably linked. Good quality integrated services across the continuum of
care can slow the rate of health-related declines, reduce health care expenditures related
to avoidable conditions and improve quality of life.
This challenge is immense as the nature of ageing-related conditions and factors
relating to provision of care and support are multiple and varied. They include variation in
prevalence of conditions commonly related to ageing, different configurations of service
provision and different funding models. The result is a tangle of interdependent factors
that connect in different patterns from care provider to care provider, region to region and
nation to nation.
Only by using reliable data with understandable and comparable constructs can one
begin to make progress in determining cost effective services that maintain quality of
care. A logical starting point would be aggregating reliable valid data on those individuals
receiving care, thus allowing for analysis of the benefits of different models of care for
people with comparable care requirements.
The interRAI system for assessment of care needs (www.interRAI.org) generates data that
can be aggregated from routine clinical practice to provide evidence that is highly relevant
to key questions facing decision makers in long-term care. For example, policy makers and
service providers must understand the needs and resource requirements of persons across
the continuum of care. The inherent complexity of the populations served in nursing home
and community settings means that this evidence must be multidimensional and provide
a comprehensive view of the person – one that cannot be obtained from administrative
records alone.
The information can be used for planning purposes to determine the nature and
intensity of the health and social services that are needed. Longitudinal information
is essential at the person-level to evaluate the effectiveness of care plans and at the
organisational level to evaluate the quality of care. Comparative regional and cross-
national data provide insights about practice patterns and policy decisions that may not
be self-evident if comparisons are made only between like-minded organisations within a
limited geographic region.
95
I.3. USING INTERRAI ASSESSMENT SYSTEMS TO MEASURE AND MAINTAIN QUALITY OF LONG-TERM CARE
A GOOD LIFE IN OLD AGE? MONITORING AND IMPROVING QUALITY IN LONG-TERM CARE © OECD/EUROPEAN COMMISSION 2013
This chapter describes the background to the formation of the interRAI collaboration,
the development, design, distribution, and potential contribution of the interRAI approach
to assessment for care and systematic embedding of a quality driven assessment system in
care delivery. It also presents data from use of the interRAI system in nine OECD and non-
OECD countries and regions, demonstrating the potential for international benchmarking
of performance in long-term care.
Poor care quality led to a call for more systematic assessments of care needs in the United States
In the United States, major scandals in long-term care of older people prompted
Congress to ask the US National Academy of Sciences and its Institute of Medicine (IOM)
to examine nursing home quality and report on how to improve nursing home regulation.
The IOM’s expert committee issued its report in 1986 after a 2.5 year study and a series of
hearings (Institute of Medicine, 1986; Hawes, 1990). One of the central recommendations
was the development of a uniform, comprehensive resident assessment system.
The IOM Committee argued that a uniform, comprehensive assessment of each
resident was essential to improving the quality of care in the nation’s nursing homes.
Comprehensive assessment of physical, cognitive and social functional status was
(and still is) seen as the cornerstone of high quality care of older people, identifying
issues requiring individualised care planning so that the best outcome of care can be
achieved. The IOM recognised that resident-level data from routine assessment of care
needs would be the most likely to provide reliable data on quality and outcomes of
care. In fact it is not possible to monitor or improve quality of care without being able
to measure and compare progress over time or performance between organisations,
regions or nations.
Many clinical and care services adopt structured approaches to assessment, and the
tradition of standardised assessment is strong in many clinical domains. Many disciplines
such as neuropsychology, physical, occupational, speech and respiratory therapy have
specific assessment tools for structured recording of care need, severity and care outcomes.
In care of older people, there is now a long tradition of assessment and there are many
publications listing historical best practice (Kane and Kane, 1981; Rubenstein et al., 1995).
As a result of the IOM report, development of the nursing home Minimum Data Set –
Resident Assessment Instrument (MDS-RAI) was embedded in a set of reforms enacted by
the United States Congress in the Omnibus Budget Reconciliation Act of 1987 (OBRA ’87).
The original RAI project development consortium was commissioned by the Health
Quality Bureau of the US Health Care Finance Administration. The process began by
reviewing more than 80 existing assessment instruments incorporating inputs from the
designers of those assessments and the long tradition of behavioural and performance
assessments and symptom reviews, including that of developmentally disabled individuals.
The importance of the review of these kinds of assessments was that they enabled the
measures developed within the MDS-RAI, the assessment devices, records of symptoms
present and other pieces of information about the resident, to substantially increase the
breadth, depth and strength of the assessment system (Morris et al., 1990).
Development was completed in 1990 and the first version of the MDS-RAI was
implemented in all US nursing homes in 1990-92.

96
I.3. USING INTERRAI ASSESSMENT SYSTEMS TO MEASURE AND MAINTAIN QUALITY OF LONG-TERM CARE
A GOOD LIFE IN OLD AGE? MONITORING AND IMPROVING QUALITY IN LONG-TERM CARE © OECD/EUROPEAN COMMISSION 2013
The evolution of assessment instruments and the interRAI collaboration has provided an answer
Standardised assessment instruments enable the structured recording of information
about an individual in such a way that the data generated can be used to create performance
scales. These scales measure, for example, physical abilities (activities of daily living, or
ADLs) cognitive impairment and quality of life. The information recorded can be observed
performance against assessment items or self-reported responses to questionnaires. The
data can be aggregated to show change in performance of individuals and populations over
time and in response to treatment and service developments.
The evolution of assessment instruments can be divided into three generations. First
generation instruments, of which there are very large numbers, are standalone scales
designed to measure a single construct for a single purpose [e.g., Barthel Index for Activities
of Daily Living; (Mahoney and Barthel, 1965), Mini Mental State Examination – MMSE (Folstein
et al., 1975), Geriatric Depression Scale – GDS (Yesavage et al., 1982), “MUST” for nutrition
(Stratton et al., 2004)]. The strength of the single domain assessments lies in their discrete
measurement rules and (for the best) extensive testing of psychometric properties (i.e.,
reliability and validity) and use in clinical trials. However, these limited domain assessment
instruments cannot be used together to produce efficient and reliable integrated multi-
dimensional assessment tools. Attempts to use clusters of these instruments typically
result in cumbersome assessment approaches employing overlapping assessment items
and conflicting assessment methods. The use of clusters of stand-alone instruments also
lacks proven utility and acceptability across different care settings.
Second-generation instruments are multidimensional instruments that address many
clinical domains with applicability in many settings. Individual items are constructed to record
focused information about the individual, and it is the assembly of these items into specific
sections that form the backbone of a comprehensive assessment schedule. Examples include
CAPE (Pattie et al., 1979), FACE (www.face.eu.com) and EASYCARE (www.easycare.org.uk). The
other principal feature is that they are designed to support care planning, rather than just to
record function in particular domains. The combination of assessment items covers specific
medical, functional and social issues that need to be addressed in order to provide optimal
care to the individual as a whole person. Some include the ability to trigger action through care
planning protocols for conditions identified in the assessment.
A secondary but very significant by-product of good multi-dimensional assessment
instruments is that the data can be aggregated to produce measures of outcome, casemix,
quality of care and eligibility criteria for access to services (Hirdes et al., 1999). Databases
consisting of aggregated data from quality second-generation instruments provide a basis
for comparisons between regions and nations as well as changes over time.
Adoption and use of these assessment scales and assessment systems are largely
dependent on the local choice of practitioners, though the more sophisticated second
generation scales may be adopted by provider organisations or local and regional
jurisdictions. Two systematic reviews describe and compare the characteristics of the
most widely available instruments including the first versions of the interRAI assessment
instruments. Box 3.1 provides an overview of the history and evolution of the interRAI
collaboration (Lincoln Centre for Ageing and Community Care Research, 2004; and
www.nzgg.org.nz/resources/57/Assess_Processes_GL.pdf).
97
I.3. USING INTERRAI ASSESSMENT SYSTEMS TO MEASURE AND MAINTAIN QUALITY OF LONG-TERM CARE
A GOOD LIFE IN OLD AGE? MONITORING AND IMPROVING QUALITY IN LONG-TERM CARE © OECD/EUROPEAN COMMISSION 2013
Box 3.1. The interRAI collaboration and the interRAI integrated suite
InterRAI is a not-for-profit collaboration, now composed of around 70 clinicians, researchers and health administrators from over 30 countries. It was founded in 1992 with the vision statement “the assembly of accurate clinical information in a common format within and across services sectors and countries enhances both the well-being of frail persons and the efficient and equitable distribution of resources” (Fries et al., 2003).
During the first two years, the founding members from Europe, Nordic countries and the United States focussed on the use of the MDS-RAI and the application of the RUGs casemix system in long-term residential care (Resource Utilization Groups – RUG-III – see below). Introduction of the MDS-RAI into nursing home (NH) care was associated with measurable improvements in the standard of care, particularly when quality indicators derived from the instrument were introduced (Mor et al., 1997; Mor et al., 2005). Work soon began on a community care version of the MDS-RAI, and in 1994 the initial version of the Resident Assessment Instrument for Home Care (RAI-HC) was introduced as a model for comprehensive assessment in a community setting (Morris et al., 1997). By 1997, interRAI researchers had completed a revision of the MDS-RAI (v 2.0) and the initial focus of interRAI on care of older persons had broadened, applying the assessment technology to other vulnerable populations. To date assessment instruments have been developed for: acute care (Carpenter et al., 2001), post-acute care, community health, home (community) care, long-term care facilities, assisted living, initial contacts, deaf blind persons, emergency psychiatric screening, hospital and community mental health Hirdes et al., 2002a), palliative care (Steel et al., 2003), physical and intellectual disability (Martin et al., 2007), child and youth intellectual disability, and quality of life (www.interrai.org/index.php?id=3).
InterRAI’s work continued to evolve toward development of a fully integrated assessment system (known as the interRAI Suite), the first third-generation assessment system. A new set of subjective quality of life instruments is about to be released as companions to the assessor-rated interRAI instruments, the combination of which will comprise the first fourth generation assessment system for use in the continuum of care.
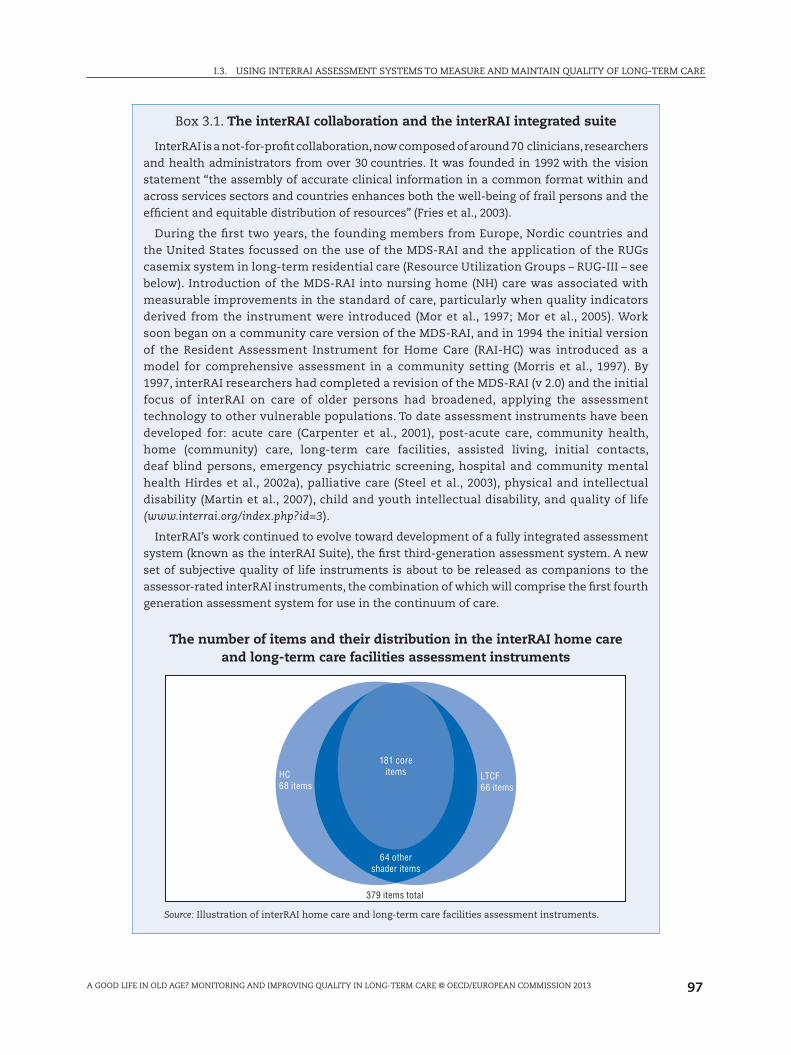
The number of items and their distribution in the interRAI home care and long-term care facilities assessment instruments
LTCF66 items
379 items total
181 coreitems
64 othershader items
HC68 items
Source: Illustration of interRAI home care and long-term care facilities assessment instruments.
98
I.3. USING INTERRAI ASSESSMENT SYSTEMS TO MEASURE AND MAINTAIN QUALITY OF LONG-TERM CARE
A GOOD LIFE IN OLD AGE? MONITORING AND IMPROVING QUALITY IN LONG-TERM CARE © OECD/EUROPEAN COMMISSION 2013
Box 3.1. The interRAI collaboration and the interRAI integrated suite (cont.)
The first versions of interRAI instruments all had a comparable look and feel, since they were developed sequentially from 1993 through 2001. However, specific items did not always measure identical phenomena in identical ways across settings and care groups. While not a problem within any given care setting or for general comparisons of populations across settings, these inconsistencies limited the extent to which interRAI assessment information could flow seamlessly across all boundaries. An integrated system enables transfer of common information across transitions across care settings, both orienting the recipient caregiver and reducing the need for completing paper work. In 2001, interRAI therefore established a systematic process to create a third-generation assessment system – a fully integrated suite of instruments – the interRAI Suite. It is composed of a unified set of items that are used to populate the full range of assessment instruments.
A principal benefit of the interRAI Suite is that it delivers consistent recording of information across care settings, allowing comparison of immediate or long term change in status and across settings. Clinicians in one care setting can understand the language and information from health and social care professionals in another, and the data are directly transferrable. The assessment items are standard, the core items used in all settings, with other items used in many, several, or even only a single setting (see figure above). Thus, design of software systems to support multi-sector assessment and care planning is facilitated by having consistent items across multiple different assessment instruments. This also greatly facilitates the development of assessments in new care settings or for new care groups. Training of assessors is also simplified as, for example, a nurse trained in the use of an instrument in one sector can quickly learn to use a companion instrument in another.
Third-generation instruments extend the concept of second-generation tools to
multiple care settings. They provide assessment processes that can be used across different
populations and care settings. Moreover, they comprise an integrated suite of instruments
designed to support continuity of assessment practices across the continuum of care.
They create person-focussed, longitudinal records that can be viewed, understood and
used irrespective of care setting. The use of the same protocols to support care planning
in sectors between which people may move (e.g. acute, community and residential care)
allow for a collaborative approach to service provision that spans the continuum of care.
The focus is on recording the information about the individual, their changing strengths,
abilities and preferences rather than the information required only by a particular care
setting where that person happens to be at any given time. Currently the interRAI suite
of assessment instruments is the only example of this type (see Box 3.1). This integrated
system enables transfer of common information across care settings, thereby facilitating
continuity of care across transitions. A number of regional and national jurisdictions
are now introducing the interRAI instruments in response to growing pressures on care
delivery services (http://interrai.org/index.php?id=7).
Combining observations and subjective ratings by the person describing his/
her experience in a care setting will become the next generation of interRAI solutions.
These instruments will combine the physical, cognitive and social functional measures
in assessor-rated instruments with self-reported quality of life surveys completed by the
person.
99
I.3. USING INTERRAI ASSESSMENT SYSTEMS TO MEASURE AND MAINTAIN QUALITY OF LONG-TERM CARE
A GOOD LIFE IN OLD AGE? MONITORING AND IMPROVING QUALITY IN LONG-TERM CARE © OECD/EUROPEAN COMMISSION 2013
Structure and use of the interRAI assessment instruments
InterRAI instruments include manuals to support training on standardised assessment
items. They also include Clinical Assessment Protocols (CAPs) and numerous clinical
summary scales and algorithms that help to “interpret” the clinical findings and describe the
severity of impairment or risk of problems in a variety of domain areas. The manuals give an
extensive description of the assessment process. They also describe the intent of assessing
that domain and the process for conducting a high quality assessment of the domain. In
addition, they outline coding rules for each item and provide case examples to illustrate key
principles associated with appropriate assessment and coding. They are designed to be used
by care professionals for the assessment of the care needs of individuals and to support and
inform best practice care planning. Once the assessment is completed, scales summarising
major domains (e.g., depression, cognition, and physical function) are calculated. These
scales are automatically constructed from the aggregation of information that has been
recorded for the sole purpose of determining the care that a person will require.
Assessments are mostly commonly completed by registered nurses, but are also
undertaken by therapists and care managers from social work who have been trained
in their use. The process of assessment includes a conversational dialogue between the
care professional and person whose care needs are being assessed, covering all relevant
domains. A number of items are specifically addressed to the person being assessed, such
as aspects of mood, self-reported perception of health and preferences for activities, etc.
However, to complete other items, assessors also review all available relevant records and
talk with formal and informal care givers and relatives who are associated with the person
whose assessment is being completed. Typically assessments will take around 40 minutes
to one hour to complete where assessors are familiar with the assessment instruments.
Those people with complex care needs will require more time, up to two hours. In nursing
home populations in particular, this time is likely to be distributed across more than one
day as carers and assessors get to know residents and their family and carers.
The assessment records what is achieved by the person, not his or her hypothetical
“potential”. Where there is uncertainty (e.g., conflicting information from different
sources), the assessor records information based on his/her best judgement. Where there
is evidence of cognitive or communication impairment, there will be increased reliance
on information provided by care-givers and staff, driven by clear protocols laid out in
the instrument training manuals. The process has been shown to be reliable and valid
in systematic evaluation of the instruments with data from a wide range of settings and
nations (Morris et al., 1990; Morris et al., 1997a, Morris et al., 1997b; Poss et al., 2008).
The assessment instruments themselves have a uniform structure that gives them their
inherent strength. The suite of instruments are constructed around a set of data items that are
assembled and configured differently for given care populations and care settings. There is a
set of core items addressing key aspects of domains common to all settings and populations
that appears in all the instruments. Each complete interRAI instrument consists of the core
set and additional data items relevant for assessments in the care setting and care group. The
figure in Box 3.1 shows the number of data items in the interRAI Home (community) Care
(HC) and interRAI Long-term care Facilities (LTCF) assessment instruments. Each complete
assessment instrument also includes a training manual, calculated scales (including
screeners and severity measures), a set of algorithms that trigger “Clinical Assessment
Protocols” (CAPs), quality indicators and casemix measures relevant to resource use.
100
I.3. USING INTERRAI ASSESSMENT SYSTEMS TO MEASURE AND MAINTAIN QUALITY OF LONG-TERM CARE
A GOOD LIFE IN OLD AGE? MONITORING AND IMPROVING QUALITY IN LONG-TERM CARE © OECD/EUROPEAN COMMISSION 2013
The assessment items
The assessment items are organised into sections dealing with issues such as
cognitive patterns, communication and hearing patterns, physical functioning, health
conditions and preventive health measures. Typically, an assessment instrument will
have around 20 sections within which there are a number of items to characterise
each issue in various ways (e.g., frequency, severity, presence/absence). Every item and
response code has concise and precise definitions including time frames. Most, but not
all items refer to the past three days and define specific exclusions (e.g., excluding the
washing of the back as part of assessing ability to bathe), as well as giving examples
(e.g., vision is measured “with glasses or with other visual appliance used”). These
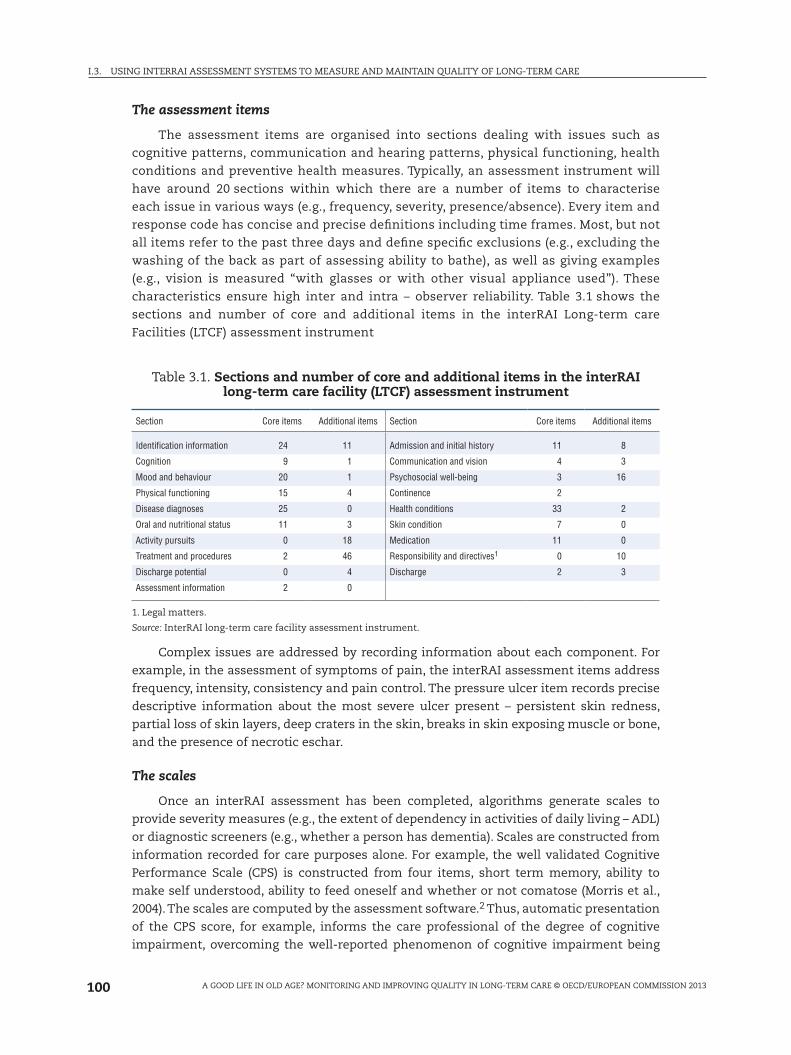
characteristics ensure high inter and intra – observer reliability. Table 3.1 shows the
sections and number of core and additional items in the interRAI Long-term care
Facilities (LTCF) assessment instrument
Table 3.1. Sections and number of core and additional items in the interRAI long-term care facility (LTCF) assessment instrument
Section Core items Additional items Section Core items Additional items
Identification information 24 11 Admission and initial history 11 8
Cognition 9 1 Communication and vision 4 3
Mood and behaviour 20 1 Psychosocial well-being 3 16
Physical functioning 15 4 Continence 2
Disease diagnoses 25 0 Health conditions 33 2
Oral and nutritional status 11 3 Skin condition 7 0
Activity pursuits 0 18 Medication 11 0
Treatment and procedures 2 46 Responsibility and directives1 0 10
Discharge potential 0 4 Discharge 2 3
Assessment information 2 0
1. Legal matters.
Source: InterRAI long-term care facility assessment instrument.
Complex issues are addressed by recording information about each component. For
example, in the assessment of symptoms of pain, the interRAI assessment items address
frequency, intensity, consistency and pain control. The pressure ulcer item records precise
descriptive information about the most severe ulcer present – persistent skin redness,
partial loss of skin layers, deep craters in the skin, breaks in skin exposing muscle or bone,
and the presence of necrotic eschar.
The scales
Once an interRAI assessment has been completed, algorithms generate scales to
provide severity measures (e.g., the extent of dependency in activities of daily living – ADL)
or diagnostic screeners (e.g., whether a person has dementia). Scales are constructed from
information recorded for care purposes alone. For example, the well validated Cognitive
Performance Scale (CPS) is constructed from four items, short term memory, ability to
make self understood, ability to feed oneself and whether or not comatose (Morris et al.,
2004). The scales are computed by the assessment software.2 Thus, automatic presentation
of the CPS score, for example, informs the care professional of the degree of cognitive
impairment, overcoming the well-reported phenomenon of cognitive impairment being
101
I.3. USING INTERRAI ASSESSMENT SYSTEMS TO MEASURE AND MAINTAIN QUALITY OF LONG-TERM CARE
A GOOD LIFE IN OLD AGE? MONITORING AND IMPROVING QUALITY IN LONG-TERM CARE © OECD/EUROPEAN COMMISSION 2013
under-recognised (McDonald et al., 2003). Numerous scales are currently available (www.
interrai.org/index.php?id=106) encompassing cognition, communication, mood (depression),
instrumental and personal ADL, pain and health stability, social engagement, etc. (Morris
et al., 1999; Carpenter et al., 1999; Burrows et al., 2000; Fries et al., 2001; Hirdes et al., 2003;
Mor et al., 1995).
The Clinical Assessment Protocols
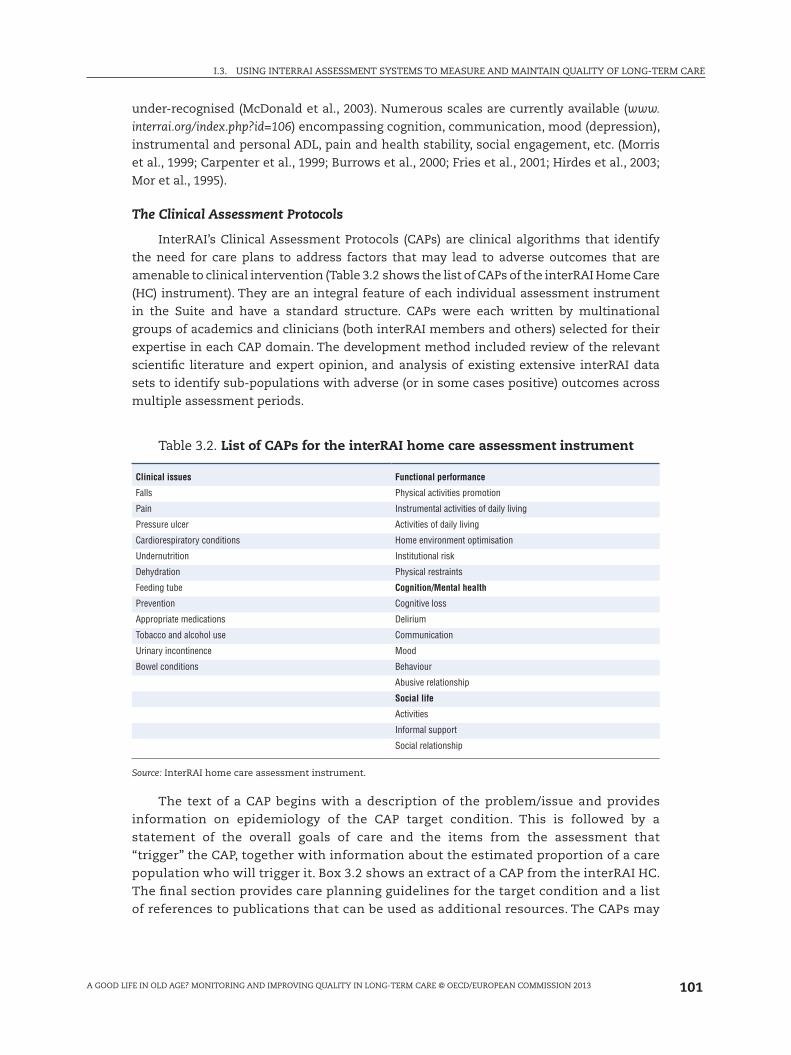
InterRAI’s Clinical Assessment Protocols (CAPs) are clinical algorithms that identify
the need for care plans to address factors that may lead to adverse outcomes that are
amenable to clinical intervention (Table 3.2 shows the list of CAPs of the interRAI Home Care
(HC) instrument). They are an integral feature of each individual assessment instrument
in the Suite and have a standard structure. CAPs were each written by multinational
groups of academics and clinicians (both interRAI members and others) selected for their
expertise in each CAP domain. The development method included review of the relevant
scientific literature and expert opinion, and analysis of existing extensive interRAI data
sets to identify sub-populations with adverse (or in some cases positive) outcomes across
multiple assessment periods.
Table 3.2. List of CAPs for the interRAI home care assessment instrument
Clinical issues Functional performance
Falls Physical activities promotion
Pain Instrumental activities of daily living
Pressure ulcer Activities of daily living
Cardiorespiratory conditions Home environment optimisation
Undernutrition Institutional risk
Dehydration Physical restraints
Feeding tube Cognition/Mental health
Prevention Cognitive loss
Appropriate medications Delirium
Tobacco and alcohol use Communication
Urinary incontinence Mood
Bowel conditions Behaviour
Abusive relationship
Social life
Activities
Informal support
Social relationship
Source: InterRAI home care assessment instrument.
The text of a CAP begins with a description of the problem/issue and provides
information on epidemiology of the CAP target condition. This is followed by a
statement of the overall goals of care and the items from the assessment that
“trigger” the CAP, together with information about the estimated proportion of a care
population who will trigger it. Box 3.2 shows an extract of a CAP from the interRAI HC.
The final section provides care planning guidelines for the target condition and a list
of references to publications that can be used as additional resources. The CAPs may
102
I.3. USING INTERRAI ASSESSMENT SYSTEMS TO MEASURE AND MAINTAIN QUALITY OF LONG-TERM CARE
A GOOD LIFE IN OLD AGE? MONITORING AND IMPROVING QUALITY IN LONG-TERM CARE © OECD/EUROPEAN COMMISSION 2013
be used in their own right as a form of clinical guideline, or they may be used in
conjunction with existing guidelines in any given jurisdiction. The interRAI assessment
system, manuals and CAPs are themselves used as resources in general training of
care professionals.
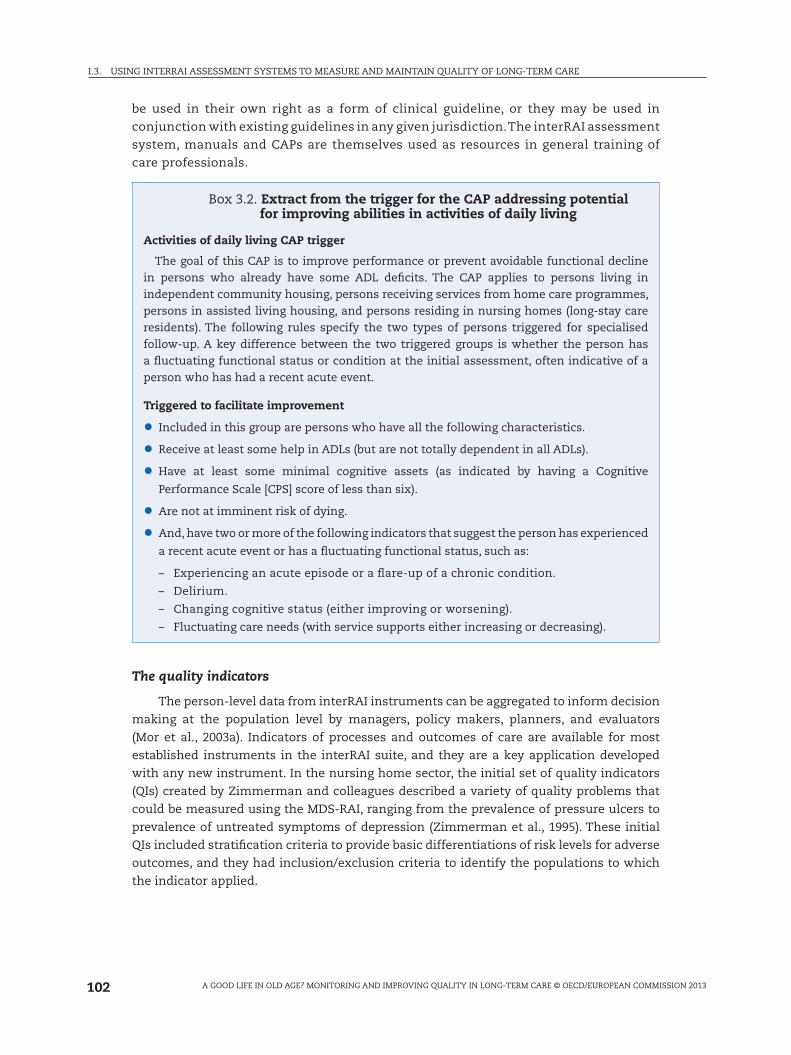
Box 3.2. Extract from the trigger for the CAP addressing potential for improving abilities in activities of daily living
Activities of daily living CAP trigger
The goal of this CAP is to improve performance or prevent avoidable functional decline in persons who already have some ADL deficits. The CAP applies to persons living in independent community housing, persons receiving services from home care programmes, persons in assisted living housing, and persons residing in nursing homes (long-stay care residents). The following rules specify the two types of persons triggered for specialised follow-up. A key difference between the two triggered groups is whether the person has a fluctuating functional status or condition at the initial assessment, often indicative of a person who has had a recent acute event.
Triggered to facilitate improvement
● Included in this group are persons who have all the following characteristics.
● Receive at least some help in ADLs (but are not totally dependent in all ADLs).
● Have at least some minimal cognitive assets (as indicated by having a Cognitive
Performance Scale [CPS] score of less than six).
● Are not at imminent risk of dying.
● And, have two or more of the following indicators that suggest the person has experienced
a recent acute event or has a fluctuating functional status, such as:
– Experiencing an acute episode or a flare-up of a chronic condition.
– Delirium.
– Changing cognitive status (either improving or worsening).
– Fluctuating care needs (with service supports either increasing or decreasing).
The quality indicators
The person-level data from interRAI instruments can be aggregated to inform decision
making at the population level by managers, policy makers, planners, and evaluators
(Mor et al., 2003a). Indicators of processes and outcomes of care are available for most
established instruments in the interRAI suite, and they are a key application developed
with any new instrument. In the nursing home sector, the initial set of quality indicators
(QIs) created by Zimmerman and colleagues described a variety of quality problems that
could be measured using the MDS-RAI, ranging from the prevalence of pressure ulcers to
prevalence of untreated symptoms of depression (Zimmerman et al., 1995). These initial
QIs included stratification criteria to provide basic differentiations of risk levels for adverse
outcomes, and they had inclusion/exclusion criteria to identify the populations to which
the indicator applied.

103
I.3. USING INTERRAI ASSESSMENT SYSTEMS TO MEASURE AND MAINTAIN QUALITY OF LONG-TERM CARE
A GOOD LIFE IN OLD AGE? MONITORING AND IMPROVING QUALITY IN LONG-TERM CARE © OECD/EUROPEAN COMMISSION 2013
An extensive evaluation of QIs developed in the 1990s combined with new research on
risk adjustment methodologies resulted in the release of updated quality indicators with
more emphasis on longitudinal outcomes in nursing homes and post-acute care (Berg
et al., 2002; Mor et al., 2003a; Mor et al., 2003b). Rather than considering only the prevalence
of indicators at a given point in time, these indicators emphasized changes in clinical
status in areas that could potentially respond to intervention. A further refinement was
additional enhancements to risk adjustment through direct standardisation of populations
(Jones et al., 2010; Table 3.3). The newest QIs involved three levels of adjustment: a) use
of inclusion and exclusion criteria to limit the application of the indicator to subgroups
for whom the indicator would represent a true potential quality problem (e.g., persons
at the end of life are excluded from many QIs because their changes in health are less
likely to be a function of quality); b) individual level adjustment for related factors likely
to lead to a higher or lower baseline rate of the indicator for reasons likely to be unrelated
to quality (e.g., ADL problems related to locomotion are used as adjusters for falls); and
c) computation of QI rates within strata of variables with strong associations with the
indicator and then standardisation of facility populations using a fixed distribution of
those strata as a reference (e.g., facility distribution of Case Mix Index values from the
RUG-III classification system for comparing facilities with similar levels of dependency).
Table 3.3. Examples of interRAI risk adjusted quality indicators for nursing homes
Improvements in: Presence of:
Mid-loss ADL (mobility, transfer) Stage 2-4 pressure ulcers
Behaviour Occurrence of:
Worsening of: Falls
Mid-loss ADL Use of:
Behaviour Physical restraints
Bladder continence Antipsychotics without related diagnosis
Mood Catheter
Pain Feeding tube
Source: InterRAI nursing home assessment instrument.
By 2004, interRAI had released a comparable set of QIs for home care settings (Hirdes
et al., 2004; Table 3.4). Similar work is underway to extend QI development to acute care
(Brand et al., 2011) and mental health settings (Hirdes et al., 2001).
Public reporting on nursing home QIs was first made available in the United States
through the Nursing Home Compare website (www.medicare.gov/NursingHomeCompare);
but the indicators reported include relatively basic risk adjustment strategies. In Canada,
the Canadian Institute for Health Information (www.cihi.ca) and Health Quality Ontario
(www.hqontario.ca) have collaborated to develop a web-based public reporting system
that provides fully risk adjusted QI information to the public on all nursing homes in the
province of Ontario.
104
I.3. USING INTERRAI ASSESSMENT SYSTEMS TO MEASURE AND MAINTAIN QUALITY OF LONG-TERM CARE
A GOOD LIFE IN OLD AGE? MONITORING AND IMPROVING QUALITY IN LONG-TERM CARE © OECD/EUROPEAN COMMISSION 2013
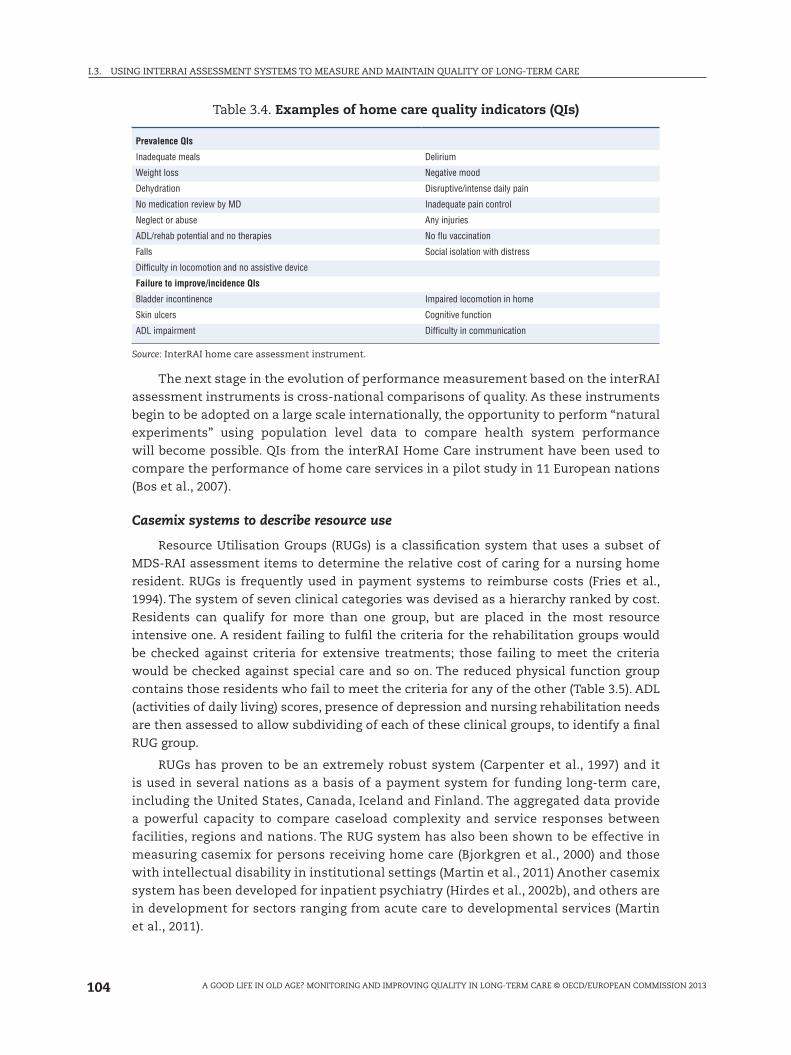
Table 3.4. Examples of home care quality indicators (QIs)
Prevalence QIs
Inadequate meals Delirium
Weight loss Negative mood
Dehydration Disruptive/intense daily pain
No medication review by MD Inadequate pain control
Neglect or abuse Any injuries
ADL/rehab potential and no therapies No flu vaccination
Falls Social isolation with distress
Difficulty in locomotion and no assistive device
Failure to improve/incidence QIs
Bladder incontinence Impaired locomotion in home
Skin ulcers Cognitive function
ADL impairment Difficulty in communication
Source: InterRAI home care assessment instrument.
The next stage in the evolution of performance measurement based on the interRAI
assessment instruments is cross-national comparisons of quality. As these instruments
begin to be adopted on a large scale internationally, the opportunity to perform “natural
experiments” using population level data to compare health system performance
will become possible. QIs from the interRAI Home Care instrument have been used to
compare the performance of home care services in a pilot study in 11 European nations
(Bos et al., 2007).
Casemix systems to describe resource use
Resource Utilisation Groups (RUGs) is a classification system that uses a subset of
MDS-RAI assessment items to determine the relative cost of caring for a nursing home
resident. RUGs is frequently used in payment systems to reimburse costs (Fries et al.,
1994). The system of seven clinical categories was devised as a hierarchy ranked by cost.
Residents can qualify for more than one group, but are placed in the most resource
intensive one. A resident failing to fulfil the criteria for the rehabilitation groups would
be checked against criteria for extensive treatments; those failing to meet the criteria
would be checked against special care and so on. The reduced physical function group
contains those residents who fail to meet the criteria for any of the other (Table 3.5). ADL
(activities of daily living) scores, presence of depression and nursing rehabilitation needs
are then assessed to allow subdividing of each of these clinical groups, to identify a final
RUG group.
RUGs has proven to be an extremely robust system (Carpenter et al., 1997) and it
is used in several nations as a basis of a payment system for funding long-term care,
including the United States, Canada, Iceland and Finland. The aggregated data provide
a powerful capacity to compare caseload complexity and service responses between
facilities, regions and nations. The RUG system has also been shown to be effective in
measuring casemix for persons receiving home care (Bjorkgren et al., 2000) and those
with intellectual disability in institutional settings (Martin et al., 2011) Another casemix
system has been developed for inpatient psychiatry (Hirdes et al., 2002b), and others are
in development for sectors ranging from acute care to developmental services (Martin
et al., 2011).
105
I.3. USING INTERRAI ASSESSMENT SYSTEMS TO MEASURE AND MAINTAIN QUALITY OF LONG-TERM CARE
A GOOD LIFE IN OLD AGE? MONITORING AND IMPROVING QUALITY IN LONG-TERM CARE © OECD/EUROPEAN COMMISSION 2013
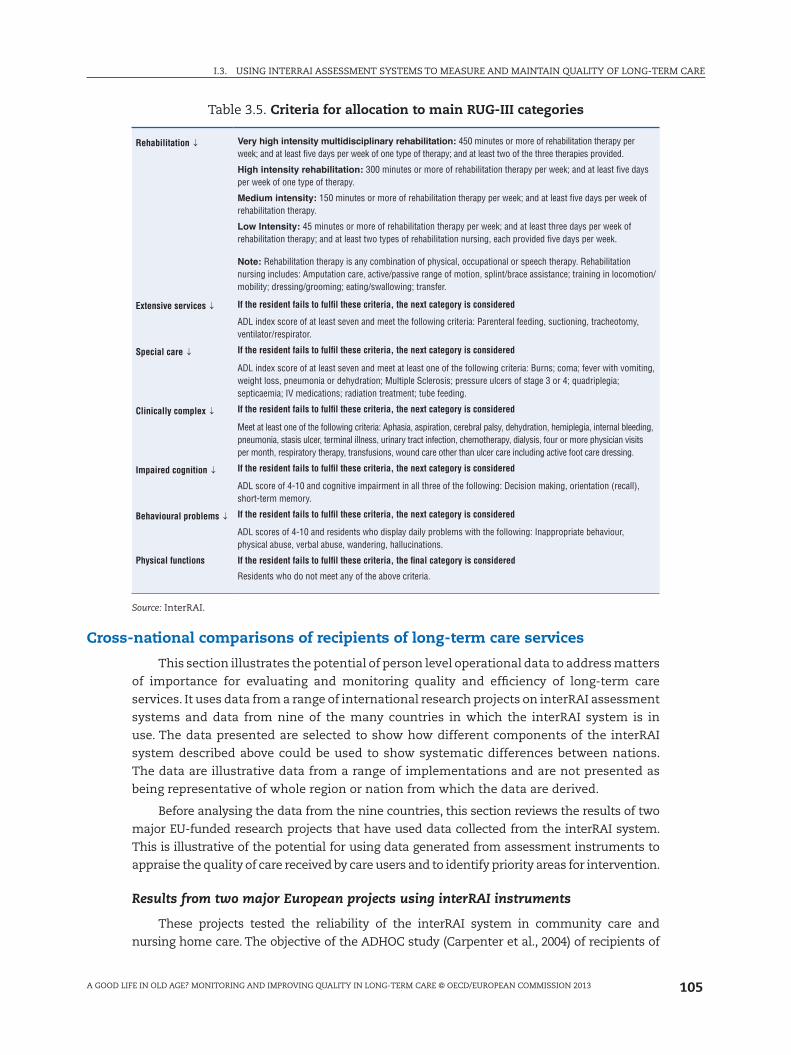
Table 3.5. Criteria for allocation to main RUG-III categories
Rehabilitation ↓ Very high intensity multidisciplinary rehabilitation: 450 minutes or more of rehabilitation therapy per week; and at least five days per week of one type of therapy; and at least two of the three therapies provided.
High intensity rehabilitation: 300 minutes or more of rehabilitation therapy per week; and at least five days per week of one type of therapy.
Medium intensity: 150 minutes or more of rehabilitation therapy per week; and at least five days per week of rehabilitation therapy.
Low Intensity: 45 minutes or more of rehabilitation therapy per week; and at least three days per week of rehabilitation therapy; and at least two types of rehabilitation nursing, each provided five days per week.
Note: Rehabilitation therapy is any combination of physical, occupational or speech therapy. Rehabilitation nursing includes: Amputation care, active/passive range of motion, splint/brace assistance; training in locomotion/mobility; dressing/grooming; eating/swallowing; transfer.
Extensive services ↓ If the resident fails to fulfil these criteria, the next category is considered
ADL index score of at least seven and meet the following criteria: Parenteral feeding, suctioning, tracheotomy, ventilator/respirator.
Special care ↓ If the resident fails to fulfil these criteria, the next category is considered
ADL index score of at least seven and meet at least one of the following criteria: Burns; coma; fever with vomiting, weight loss, pneumonia or dehydration; Multiple Sclerosis; pressure ulcers of stage 3 or 4; quadriplegia; septicaemia; IV medications; radiation treatment; tube feeding.
Clinically complex ↓ If the resident fails to fulfil these criteria, the next category is considered
Meet at least one of the following criteria: Aphasia, aspiration, cerebral palsy, dehydration, hemiplegia, internal bleeding, pneumonia, stasis ulcer, terminal illness, urinary tract infection, chemotherapy, dialysis, four or more physician visits per month, respiratory therapy, transfusions, wound care other than ulcer care including active foot care dressing.
Impaired cognition ↓ If the resident fails to fulfil these criteria, the next category is considered
ADL score of 4-10 and cognitive impairment in all three of the following: Decision making, orientation (recall), short-term memory.
Behavioural problems ↓ If the resident fails to fulfil these criteria, the next category is considered
ADL scores of 4-10 and residents who display daily problems with the following: Inappropriate behaviour, physical abuse, verbal abuse, wandering, hallucinations.
Physical functions If the resident fails to fulfil these criteria, the final category is considered
Residents who do not meet any of the above criteria.
Source: InterRAI.
Cross-national comparisons of recipients of long-term care services
This section illustrates the potential of person level operational data to address matters
of importance for evaluating and monitoring quality and efficiency of long-term care
services. It uses data from a range of international research projects on interRAI assessment
systems and data from nine of the many countries in which the interRAI system is in
use. The data presented are selected to show how different components of the interRAI
system described above could be used to show systematic differences between nations.
The data are illustrative data from a range of implementations and are not presented as
being representative of whole region or nation from which the data are derived.
Before analysing the data from the nine countries, this section reviews the results of two
major EU-funded research projects that have used data collected from the interRAI system.
This is illustrative of the potential for using data generated from assessment instruments to
appraise the quality of care received by care users and to identify priority areas for intervention.
Results from two major European projects using interRAI instruments
These projects tested the reliability of the interRAI system in community care and
nursing home care. The objective of the ADHOC study (Carpenter et al., 2004) of recipients of
106
I.3. USING INTERRAI ASSESSMENT SYSTEMS TO MEASURE AND MAINTAIN QUALITY OF LONG-TERM CARE
A GOOD LIFE IN OLD AGE? MONITORING AND IMPROVING QUALITY IN LONG-TERM CARE © OECD/EUROPEAN COMMISSION 2013
community care services in 11 countries was to link the characteristics of community care
recipients, the services they receive, and the outcomes they experience. In each country a
cohort of 250 people receiving community care services were assessed using the interRAI HC
assessment at baseline, six months and 12 months. Use of formal care services and amount of
informal care were also recorded for the same period. The SHELTER study (Onder et al., 2012)
assessed the reliability of the interRAI LTCF instrument in nursing home care when translated
into the languages of eight participating EU countries and tested the implementation of the
instrument on a large scale. 450 nursing home residents were assessed at baseline, six months
and 12 months using the interRAI LTCF. Mortality, admissions to hospital and discharge from
nursing home care were also recorded. In both studies data on configuration, staffing and
models of management of the community and the nursing homes services was also recorded.
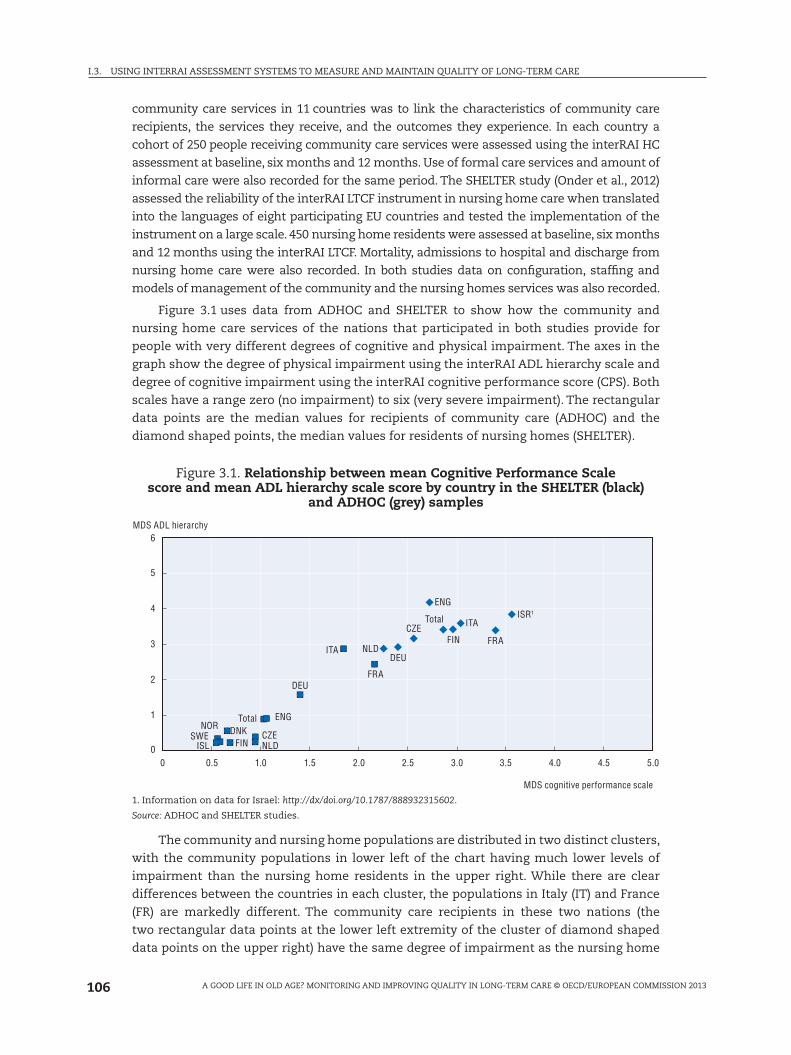
Figure 3.1 uses data from ADHOC and SHELTER to show how the community and
nursing home care services of the nations that participated in both studies provide for
people with very different degrees of cognitive and physical impairment. The axes in the
graph show the degree of physical impairment using the interRAI ADL hierarchy scale and
degree of cognitive impairment using the interRAI cognitive performance score (CPS). Both
scales have a range zero (no impairment) to six (very severe impairment). The rectangular
data points are the median values for recipients of community care (ADHOC) and the
diamond shaped points, the median values for residents of nursing homes (SHELTER).
Figure 3.1. Relationship between mean Cognitive Performance Scale score and mean ADL hierarchy scale score by country in the SHELTER (black)
and ADHOC (grey) samples
0
1
2
3
4
5
6
0 0.5
SWEISL
ISR1
NORTotal
Total
DNKFIN
FIN
NLDCZE
CZE
ENG
ENG
DEU
ITA
ITA
FRA
FRANLD
DEU
1.0 1.5 2.0 2.5 3.0 3.5 4.0 4.5 5.0
MDS cognitive performance scale
MDS ADL hierarchy
1. Information on data for Israel: http://dx/doi.org/10.1787/888932315602.
Source: ADHOC and SHELTER studies.
The community and nursing home populations are distributed in two distinct clusters,
with the community populations in lower left of the chart having much lower levels of
impairment than the nursing home residents in the upper right. While there are clear
differences between the countries in each cluster, the populations in Italy (IT) and France
(FR) are markedly different. The community care recipients in these two nations (the
two rectangular data points at the lower left extremity of the cluster of diamond shaped
data points on the upper right) have the same degree of impairment as the nursing home
107
I.3. USING INTERRAI ASSESSMENT SYSTEMS TO MEASURE AND MAINTAIN QUALITY OF LONG-TERM CARE
A GOOD LIFE IN OLD AGE? MONITORING AND IMPROVING QUALITY IN LONG-TERM CARE © OECD/EUROPEAN COMMISSION 2013
population in the Netherlands (NL). Providing for such extremely dependent older people
in their own homes must be due to different patterns of service provision and/or support
of extended families. In either case, there are clearly lessons to be learned, as there will
be significant differences between the eligibility criteria for access to services, and the
financial and social costs of community and nursing home care.
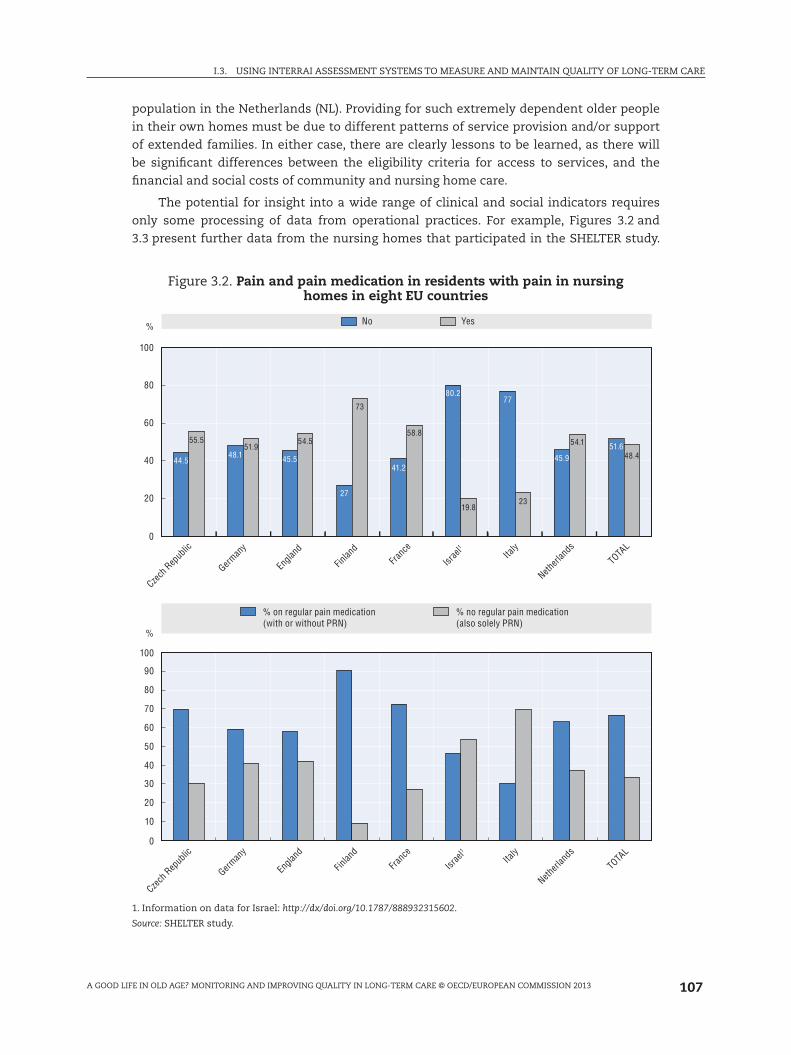
The potential for insight into a wide range of clinical and social indicators requires
only some processing of data from operational practices. For example, Figures 3.2 and
3.3 present further data from the nursing homes that participated in the SHELTER study.
Figure 3.2. Pain and pain medication in residents with pain in nursing homes in eight EU countries
% No Yes
Czech
Rep
ublic
Netherl
andsIta
ly
TOTA
L
Israe
l1
Franc
e
Finlan
d
Engla
nd
German
y
44.5
55.551.9
54.5
73
58.8
19.823
54.1
48.448.1 45.5
27
41.2
80.277
45.951.6
100
80
60
40
20
0
0
10
20
30
40
50
60
70
80
90
100
%
Czech
Rep
ublic
Netherl
ands
Italy
TOTA
L
Israe
l1
Franc
e
Finlan
d
Engla
nd
German
y
% on regular pain medication(with or without PRN)
% no regular pain medication(also solely PRN)
1. Information on data for Israel: http://dx/doi.org/10.1787/888932315602.
Source: SHELTER study.

108
I.3. USING INTERRAI ASSESSMENT SYSTEMS TO MEASURE AND MAINTAIN QUALITY OF LONG-TERM CARE
A GOOD LIFE IN OLD AGE? MONITORING AND IMPROVING QUALITY IN LONG-TERM CARE © OECD/EUROPEAN COMMISSION 2013
Figure 3.2 shows the prevalence of pain and use of pain relieving medication. The upper
graph shows the percentage of residents who complain of daily pain (lighter columns).
The lower graph shows the percentage with pain who are not receiving regular pain
relieving medication (pale section of each column). There are wide differences between
countries, with 73% of nursing home residents in the Finnish sample (FI) reporting daily
pain (light column upper graph), although only a small proportion are not receiving regular
medication (pale column section in lower graph). In Italy (IT), just 23% of the residents of
the participating homes reported daily pain (pale column in upper graph), but only 30%
of these received regular pain relieving medication (dark column section in lower graph).
Figure 3.3 shows how the degree of social activity relates to physical disability and
severity of dementia in the participating nursing homes. The upper graph shows how the
degree of engagement in social activities reduces as physical disability increases for the
resident in the homes from the United Kingdom and France. For the United Kingdom, the
level of activity is higher than in the French homes across nearly all levels of disability, and
falls more slowly with increasing disability than the SHELTER average. The lower graph
Figure 3.3. Relationship between engagement in social activity physical and cognitive impairment in residents in nursing homes in eight EU countries
Physical disability and social activity
No problems Mild disability
England
All
France
Severedisability
Moderatedisability
0
2
4
6
8
10
12
14
16
18
Linear (all) Linear (England) Linear (France)
0
2
4
6
8
10
12
14
16
Netherlands
Czech Republic
Normal Milddementia
Moderatedementia
Severedementia
Linear (Netherlands) Linear (Czech Republic)
Source: SHELTER study.
109
I.3. USING INTERRAI ASSESSMENT SYSTEMS TO MEASURE AND MAINTAIN QUALITY OF LONG-TERM CARE
A GOOD LIFE IN OLD AGE? MONITORING AND IMPROVING QUALITY IN LONG-TERM CARE © OECD/EUROPEAN COMMISSION 2013
shows reduction in social activity with increasing severity of dementia. However the slope
of the line is less marked for the Netherlands, showing that the severity of dementia in
the residents of the participating homes has a smaller impact on their participation in
social activities than for those in the Czech Republic homes. Exploring the factors and
management practices underlying these differences can increase knowledge and improve
quality of care.
Data from nine OECD and non-OECD countries and regions
Data are shown from nine of the OECD and non-OECD countries and regions in
which the interRAI assessment system is in use. The data are from interRAI fellows in
the countries and regions that have contributed to this report: Ontario Province (Canada),
Michigan State (United States), Iceland, Finland, Hong Kong (China), New Zealand, the
United Kingdom, Belgium and Italy. In all of these countries except the United Kingdom,
the data are derived from operational use of the interRAI assessment instruments
for long-term care facilities (LTCF) and home (community) care (HC). The UK data are
from the two EU-funded research projects conducted in South East England, ADHOC
and SHELTER.
While countries like the United States and Canada have large data holdings for
interRAI data, other nations such as Finland, New Zealand, and Belgium are well underway
in their progress toward similar population level data, derived from the operational use of
the interRAI assessment system. This report does not include direct comparisons of fully
risk adjusted QIs, but it does provide some basic examples of stratified comparisons of
potential quality issues in nursing home and home care settings.
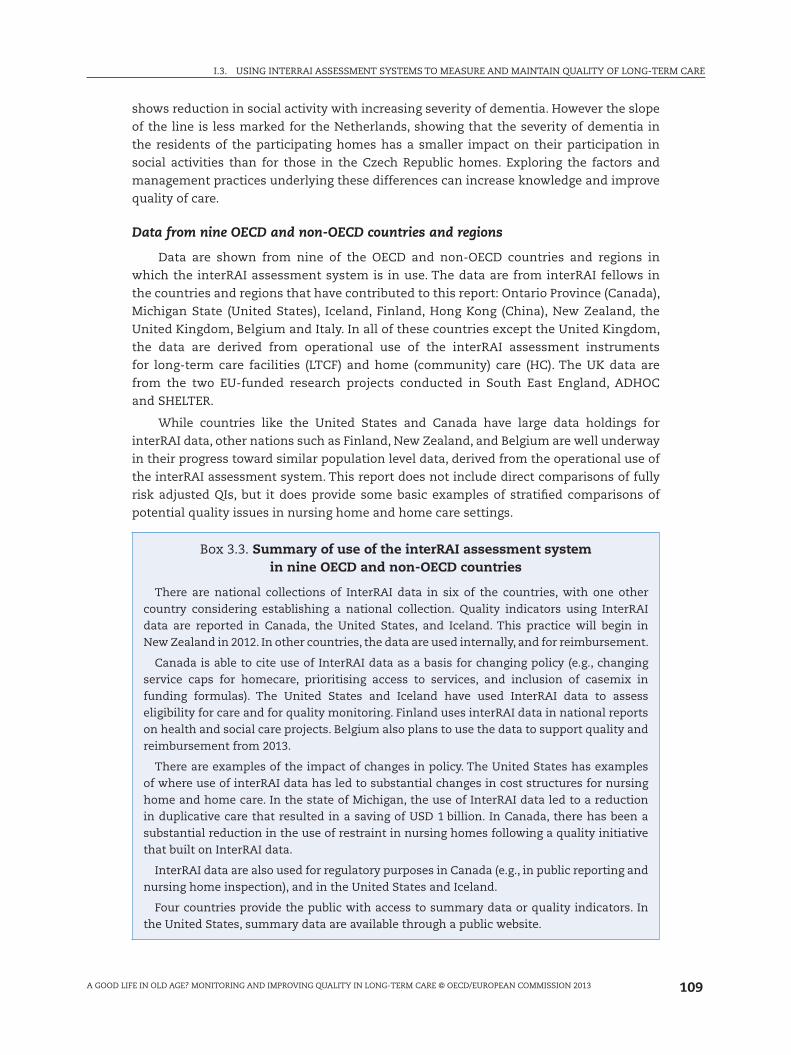
Box 3.3. Summary of use of the interRAI assessment system in nine OECD and non-OECD countries
There are national collections of InterRAI data in six of the countries, with one other country considering establishing a national collection. Quality indicators using InterRAI data are reported in Canada, the United States, and Iceland. This practice will begin in New Zealand in 2012. In other countries, the data are used internally, and for reimbursement.
Canada is able to cite use of InterRAI data as a basis for changing policy (e.g., changing service caps for homecare, prioritising access to services, and inclusion of casemix in funding formulas). The United States and Iceland have used InterRAI data to assess eligibility for care and for quality monitoring. Finland uses interRAI data in national reports on health and social care projects. Belgium also plans to use the data to support quality and reimbursement from 2013.
There are examples of the impact of changes in policy. The United States has examples of where use of interRAI data has led to substantial changes in cost structures for nursing home and home care. In the state of Michigan, the use of InterRAI data led to a reduction in duplicative care that resulted in a saving of USD 1 billion. In Canada, there has been a substantial reduction in the use of restraint in nursing homes following a quality initiative that built on InterRAI data.
InterRAI data are also used for regulatory purposes in Canada (e.g., in public reporting and nursing home inspection), and in the United States and Iceland.
Four countries provide the public with access to summary data or quality indicators. In the United States, summary data are available through a public website.
110
I.3. USING INTERRAI ASSESSMENT SYSTEMS TO MEASURE AND MAINTAIN QUALITY OF LONG-TERM CARE
A GOOD LIFE IN OLD AGE? MONITORING AND IMPROVING QUALITY IN LONG-TERM CARE © OECD/EUROPEAN COMMISSION 2013
Iceland, Finland and New Zealand present data from the national data repositories.
Michigan (entire state), Ontario (entire province), Italy (Umbria Region) and Hong Kong
(China) present data from their entire region, with the exception that the HK nursing
home data are from ten participating nursing homes. Belgium data come from pilot
implementations prior to national deployment of the interRAI system; UK data are from
the EU projects SHELTER (NH) and ADHOC (HC) only. The most recent deployments of Italy,
Belgium and UK NH are data from implementations of the interRAI suite; the remainder
are from implementations of the interRAI NH and HC versions 2.0.
The report represents the beginning of the opportunity to benchmark care
internationally. The following sections reference tables listed in the annex.
Comparing demographics
Annex Table 3.A1.1 (“demographics worksheet”) shows age, gender, marital status
and prevalence of common clinical diagnoses in nursing home (NH) and home care (HC)
populations. Both home care and nursing home settings serve a predominantly older, female
population. All nations show the NH residents being marginally older than those cared for
in the community, with the exception of Italy, where the age distribution is the same across
both settings. Figure 3.1 showed how the levels of impairment in the community dwelling
older people were remarkably similar to the NH residents in the other countries in the
SHELTER study. There is likely something quite different about the way that NH and HC
services are provided in Italy.
Women are more likely to not be married in both settings, and males in home care
settings are generally more likely to be married than those in nursing homes. The lowest
proportions of married people were in Finland (NH and HC) and the NH residents in Italy.
This points to the importance of informal supports as a resource for maintaining older
persons in the community, especially in Italy where the community dwelling older people
are so dependent (see above in relation to Figure 3.1).
There are also clear differences in the diagnoses of persons in community and
institutional settings. For example, the prevalence of Alzheimer’s disease and related
dementia is notably higher in nursing homes than in home care. The lowest NH prevalences
are seen in Michigan, where there is a major initiative to provide increased care in the
community, in Hong Kong (China) and in the United Kingdom. In the case of the United
Kingdom, it could be simply that it is under-diagnosed in NH populations in spite of the
high prevalence of cognitive impairment in the United Kingdom (McDonald et al., 2003).
There are cross-national differences in the rates of diabetes (highest in Michigan of both
populations and lowest in Belgium). However there are only modest differences in the rates
of diabetes between the NH and HC settings within the same country. This demonstrates
that some conditions are important risk factors for institutionalisation, whereas others
may be managed effectively in either care settings. It also points to the importance of
rising prevalence rates of dementia in many developed nations. Current approaches to
community based care may not be sufficiently well equipped to deal with the rapidly
growing population of people with cognitive impairment in later life.
Comparing casemix and quality indicators
Annex Table 3.A1.2 shows prevalence of triggered Client Assessment Protocols
(CAP) that give an indication of the clinical syndromes requiring care planning in
111
I.3. USING INTERRAI ASSESSMENT SYSTEMS TO MEASURE AND MAINTAIN QUALITY OF LONG-TERM CARE
A GOOD LIFE IN OLD AGE? MONITORING AND IMPROVING QUALITY IN LONG-TERM CARE © OECD/EUROPEAN COMMISSION 2013
both NH and HC settings. Table 3.A1.3 (Scales) shows the mean scores of some of the
principal outcome scales that demonstrate the prevalence of functional impairment
(cognitive performance and activities of daily living – ADL) and clinical syndromes (pain
and depression).
Physical disability is an important area of need in both care settings cross-nationally.
The ADL Hierarchy Scale (Morris et al., 1999) shows higher proportions of older people
in the severe impairment groups in NH settings with more than 75% in the higher two
groups (ADL Hierarchy scores 3-4 and 5-6) across all countries (Table 3.A1.3). The fact that
a high proportion of NH residents trigger3 the “ADL Prevent Decline” CAP (Table 3.A1.2)
also implies that these residents are more physically impaired and less likely to benefit
from physical rehabilitation in dressing, transferring between bed and chair, eating and
mobility in bed (ADL Facilitate improvement CAP) than is the case in the HC populations. A
striking difference is the high proportion of nursing home resident in Michigan that trigger
“ADL Facilitate improvement”. This is most likely as a result of policy in the United States
which provides Medicare funding for rehabilitation in nursing homes, which likely enables
earlier discharge from hospital with rehabilitation and discharge home from NHs. The fact
that the “Delirium” CAP is also triggered in a greater proportion of Michigan NH residents
(33.9% cf. <15% in all other countries except Italy – 24.8%) also suggests more acutely ill
residents discharged from hospital to NH or possibly poor recognition of the critical clinical
syndrome.
In addition, there are cross-national differences of note with the United Kingdom
reporting about two-thirds of its nursing home residents to have the most severe levels
of impairment compared with about one third in Hong Kong (China) and Canada. Similar
patterns are evident with respect to cognitive impairment. These are likely to reflect
differences in eligibility criteria for admission to NH between countries.
Use of physical restraints
Restraint use is an important issue with respect to quality in nursing homes.
Table 3.A1.4 shows the percentage of residents triggering the “restraints” CAP in those
who are relatively physically disabled and those with little physical disability. In most
countries the CAP is triggered for more of the physically disabled (unable to perform
early/mid loss ADLs – 13% to 25%) than the less disabled (able to perform early/mid loss
ADLs – 1% to 3%). Rates of restraint use in the United Kingdom (0.6% and 0%) and the
United States (0.3% and 1.1%) are substantially lower than in Canada (16% and 1.6%)
and Hong Kong, China (20.7% and 3.5%). These differences are evident even though
there has been a substantial reduction in restraint use in Canada in the last decade (see
Figure 3.6). The differences between countries can only be explained by differences in
policy and culture.
Depression
Depression (Annex Table 3.A1.3) is an important problem affecting the quality of
life of older persons in community and institutional settings. However, a reasonably
consistent pattern of more depression in nursing home settings is evident in most
countries, except Hong Kong (China). For that country, the question of the adequacy
and quality of home care services is important, particularly given the relatively lighter
care needs of Hong Kong (China) home care clients. This finding is important given
112
I.3. USING INTERRAI ASSESSMENT SYSTEMS TO MEASURE AND MAINTAIN QUALITY OF LONG-TERM CARE
A GOOD LIFE IN OLD AGE? MONITORING AND IMPROVING QUALITY IN LONG-TERM CARE © OECD/EUROPEAN COMMISSION 2013
the recognised phenomenon of under-detection of depression (Huang et al., 2011)
and many may take for granted that sadness/depression in nursing home residents is
normal. In other countries, policy makers must consider whether there are alternative
strategies that may be used in nursing home settings to respond to or prevent the onset
of depressive symptoms.
Pain
Pain (Annex Table 3.A1.2) is a pervasive problem affecting older persons around the
world. The rates and severity of pain appear to be higher in home care settings; however,
that may be associated with cross-sector variations in the severity of cognitive impairment
(making pain more difficult to detect). In fact, in each country, the minority of home care
clients report no pain. Therefore, effective pain management should be an important
dimension of any country’s strategy to improve the quality of life of older persons in the
community.
Resource use
Casemix classification systems can provide summary information about the overall
resource needs of health care service recipients. The RUGs system identifies those residents
with higher and more complex care needs that make greatest demand on the skills and
time of nursing care staff. By linking the RUGs system to payment systems, jurisdictions
are able to direct funding to those with greatest need. Integral within the RUGs system is
a linkage to good practice. Thus, the fact that it can take more time to support the good
practice of enabling residents to, for example, dress themselves rather than care staff
actually dressing the resident is recognised as “nursing rehabilitation” within RUGs, and is
reflected in the casemix measure. Indicators of poor care are also embedded in the system,
so that “gaming” the system to increase payments is difficult and not without consequences.
In addition, statistical methods have been developed by interRAI researchers to identify
dubious coding practices.
The Resource Utilisation Groups algorithms for nursing homes (RUG-III) and for home
care (RUGIII/HC) have been extensively validated in cross-national studies of staff time use
in those settings. The RUG algorithms differ somewhat between the two settings. Annex
Table 3.A1.4 shows the distribution between the RUG system clinical groups of the nursing
home (NH) and home care (HC) populations. These clinical groups are listed in the order
of highest resource use (Rehabilitation) through to the lowest resource use group (Physical
Function Reduced).
In all comparisons and all settings, the largest group of persons served are in the
Physical Function Reduced RUG level, which includes persons with physical disabilities
but few other medical complexities. The next most common groups are the impaired
cognition and clinically complex groups. There are notable cross-national differences in the
rehabilitation levels,4 suggesting international variations in access to therapies, probably
reflected in the funding available to provide care. There are also differences between
home care and nursing homes with home care having larger proportions of persons in the
clinically complex level but nursing homes having more in the somewhat more resource
intensive special care level.
Despite the various differences that may be found with respect to specific RUG
levels, perhaps the more interesting finding is the general similarity of RUG distributions

113
I.3. USING INTERRAI ASSESSMENT SYSTEMS TO MEASURE AND MAINTAIN QUALITY OF LONG-TERM CARE
A GOOD LIFE IN OLD AGE? MONITORING AND IMPROVING QUALITY IN LONG-TERM CARE © OECD/EUROPEAN COMMISSION 2013
in nursing homes and home care settings. This implies that in most places the two
sectors are serving a relatively comparable population with respect to clinical factors
associated with resource use. It also suggests that other, non-clinical factors (e.g., social
support) may be important differentiating factors determining who is in facility versus
community settings.
Comparing sub-populations
Annex Table 3.A1.5 shows health and social care indicators within sub-populations
in nursing home and community care across the nations. In this example, the data have
been subdivided into four groups by degree of physical and cognitive impairment. The sub-
groups are those with good physical function and good cognitive function, poor physical
function but good cognitive function, poor physical function but good cognitive function
and both poor physical function and poor cognitive function. The creation of the sub-
groups is identical for both nursing home and community (home) care.
The prevalence of bladder incontinence as one would expect is higher in the “poor
cognition” groups than “good cognition” groups. It is also higher in the “poor physical
function” groups than the “good physical function” groups, with highest prevalence of
all in those with both poor physical function and poor cognition. In addition there is a
general pattern of bladder incontinence being higher in nursing home than home care
populations in all sub-groups, with the exception of those with good physical function
and poor cognition, where the pattern is reversed in all the country data, with the
exception of the United Kingdom and Hong Kong (China). What is striking is that in
Michigan, prevalence in home care is higher than any other country and greater than
in nursing homes in all sub-groups. This could be of interest as it may reflect quality of
care provision differences, or an impact of a policy decision that has an ill-understood
or unexpected impact.
Use of physical restraints is highly related to culture and policy. Examining the data
in Annex Table 3.A1.5, there is virtually no restraint use in any nation or in those people
with good physical function and either good or poor cognition. However where there is
poor physical function there are significant differences between nations. For those with
poor physical function, but who still have good cognition, Finland (9.2%), Belgium (9.5%)
and Hong Kong, China (19.2%) have the highest rates of use. In the most impaired group,
the differences between nations are the greatest. In the United Kingdom (1%) and Michigan
(2.7%), there is virtually no restraint use in those with poor physical and cognitive function.
The rates in the other nations is much higher in this sub-group – Ontario (23.1%), Finland
(18.7%), Belgium (19.9%), Italy 23.1%) and Hong Kong, China (54.2%). These differences can
only represent differences in policy.
A further example of differences that stimulate thought, are in relation to the
prevalence of feeling lonely. The highest rates of loneliness are seen in all the home care
sub-groups in the United Kingdom and Belgium and Finland. In Belgium, a significant
proportion of nursing home residents also feel lonely.
Falls
Falls are an important threat to the autonomy and well-being of older adults. As shown
in Table 3.A1.5 in the annex, falls are more common in community settings (except in Italy)
where exposure to risk and physical mobility is greater. Not all falls result in injury, and a
114
I.3. USING INTERRAI ASSESSMENT SYSTEMS TO MEASURE AND MAINTAIN QUALITY OF LONG-TERM CARE
A GOOD LIFE IN OLD AGE? MONITORING AND IMPROVING QUALITY IN LONG-TERM CARE © OECD/EUROPEAN COMMISSION 2013
balance must be struck between maintaining mobility and independence and the risk of
falling. Much can be done to reduce the risks associated with falling (OECD, 2007).5 Routinely
available comparable data highlights variations in incidence that permits exploration of
different policies and practices associated with reduced risk of injury.
Longitudinal information and relation to policy
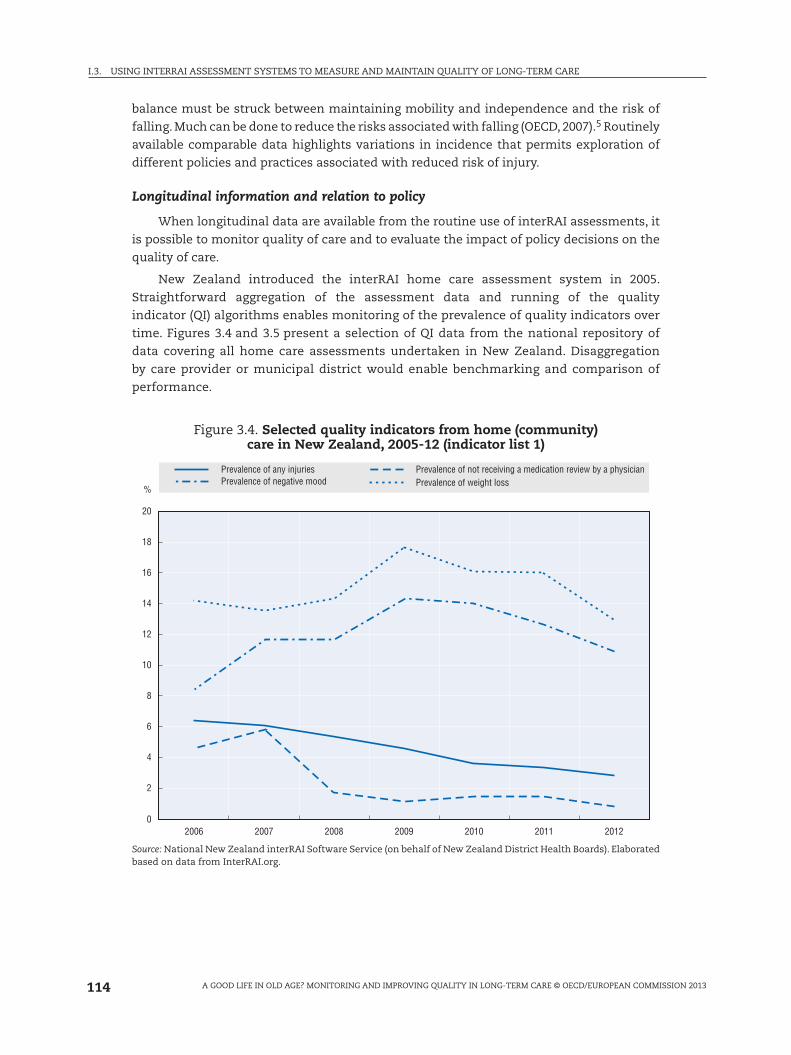
When longitudinal data are available from the routine use of interRAI assessments, it
is possible to monitor quality of care and to evaluate the impact of policy decisions on the
quality of care.
New Zealand introduced the interRAI home care assessment system in 2005.
Straightforward aggregation of the assessment data and running of the quality
indicator (QI) algorithms enables monitoring of the prevalence of quality indicators over
time. Figures 3.4 and 3.5 present a selection of QI data from the national repository of
data covering all home care assessments undertaken in New Zealand. Disaggregation
by care provider or municipal district would enable benchmarking and comparison of
performance.
Figure 3.4. Selected quality indicators from home (community) care in New Zealand, 2005-12 (indicator list 1)
%
Prevalence of any injuriesPrevalence of negative mood
Prevalence of not receiving a medication review by a physicianPrevalence of weight loss
0
2
4
6
8
10
12
14
16
18
20
2006 2007 2008 2009 2010 2011 2012
Source: National New Zealand interRAI Software Service (on behalf of New Zealand District Health Boards). Elaborated based on data from InterRAI.org.
115
I.3. USING INTERRAI ASSESSMENT SYSTEMS TO MEASURE AND MAINTAIN QUALITY OF LONG-TERM CARE
A GOOD LIFE IN OLD AGE? MONITORING AND IMPROVING QUALITY IN LONG-TERM CARE © OECD/EUROPEAN COMMISSION 2013
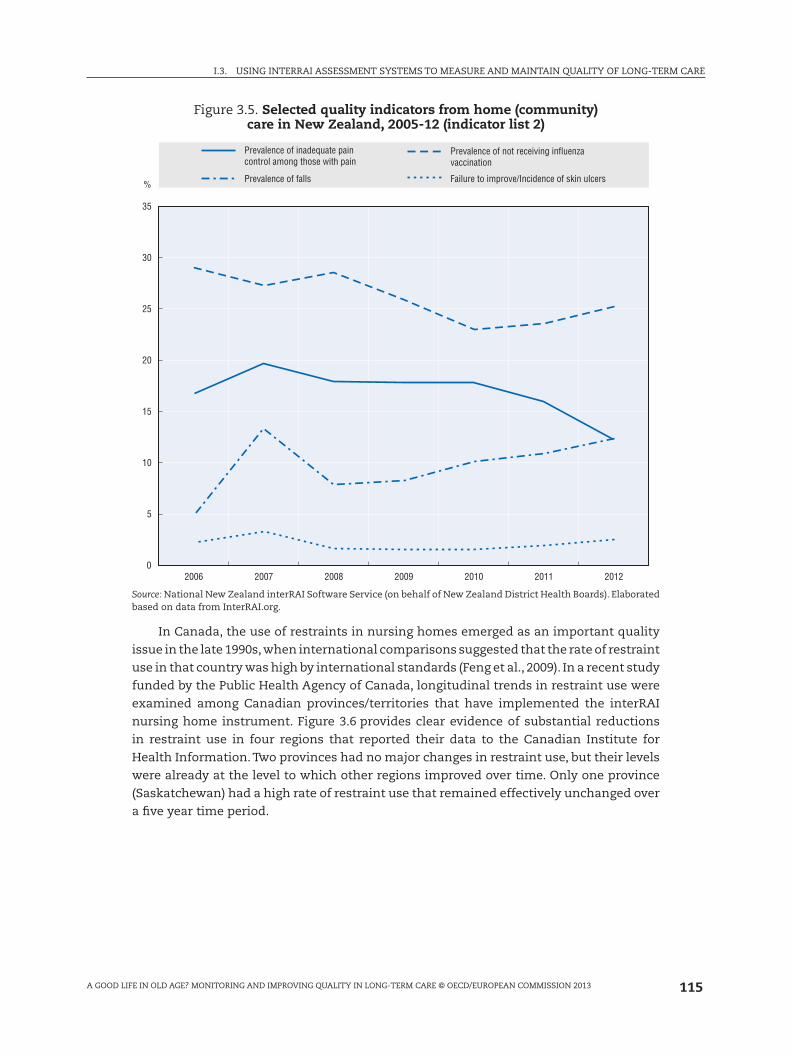
Figure 3.5. Selected quality indicators from home (community) care in New Zealand, 2005-12 (indicator list 2)
%
0
5
10
15
20
25
30
35
2006 2007 2008 2009 2010 2011 2012
Prevalence of inadequate paincontrol among those with pain
Prevalence of falls
Prevalence of not receiving influenzavaccination
Failure to improve/Incidence of skin ulcers
Source: National New Zealand interRAI Software Service (on behalf of New Zealand District Health Boards). Elaborated based on data from InterRAI.org.
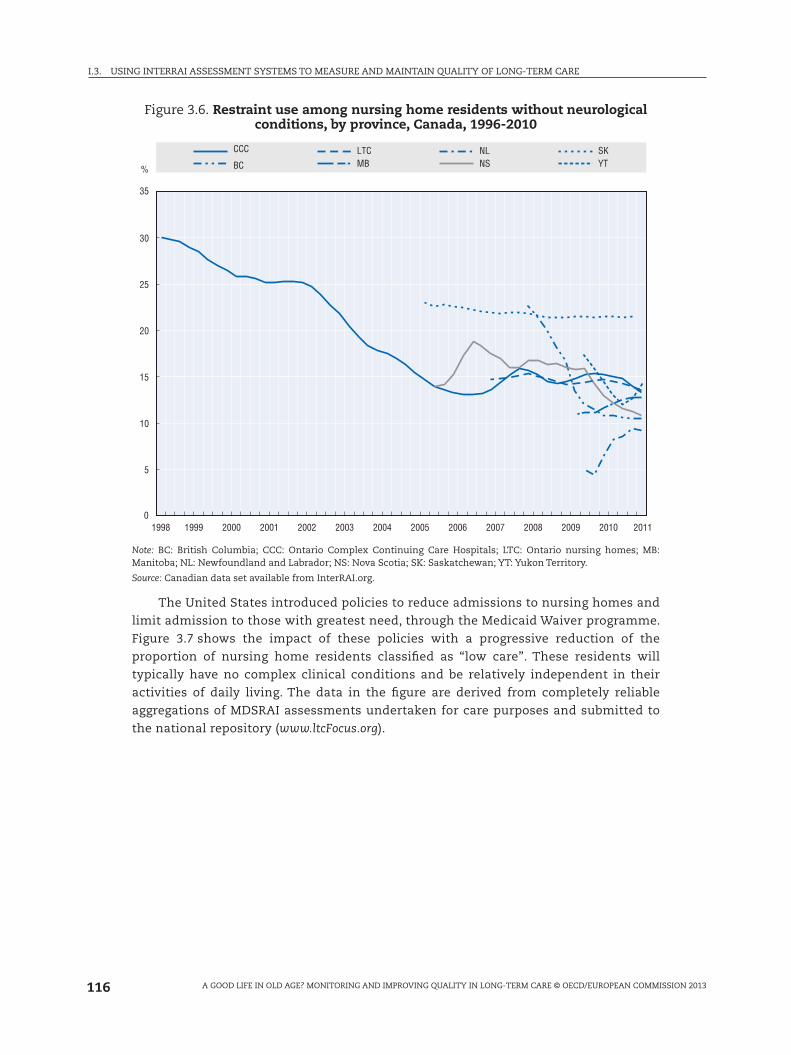
In Canada, the use of restraints in nursing homes emerged as an important quality
issue in the late 1990s, when international comparisons suggested that the rate of restraint
use in that country was high by international standards (Feng et al., 2009). In a recent study
funded by the Public Health Agency of Canada, longitudinal trends in restraint use were
examined among Canadian provinces/territories that have implemented the interRAI
nursing home instrument. Figure 3.6 provides clear evidence of substantial reductions
in restraint use in four regions that reported their data to the Canadian Institute for
Health Information. Two provinces had no major changes in restraint use, but their levels
were already at the level to which other regions improved over time. Only one province
(Saskatchewan) had a high rate of restraint use that remained effectively unchanged over
a five year time period.
116
I.3. USING INTERRAI ASSESSMENT SYSTEMS TO MEASURE AND MAINTAIN QUALITY OF LONG-TERM CARE
A GOOD LIFE IN OLD AGE? MONITORING AND IMPROVING QUALITY IN LONG-TERM CARE © OECD/EUROPEAN COMMISSION 2013
Figure 3.6. Restraint use among nursing home residents without neurological conditions, by province, Canada, 1996-2010
0
5
10
15
20
25
30
35
%
1998 1999 2000 2001 2002 2003 2004 2005 2006 2007 2008 2009 2010 2011
CCC
BC
LTCMB
NLNS
SKYT
Note: BC: British Columbia; CCC: Ontario Complex Continuing Care Hospitals; LTC: Ontario nursing homes; MB: Manitoba; NL: Newfoundland and Labrador; NS: Nova Scotia; SK: Saskatchewan; YT: Yukon Territory.
Source: Canadian data set available from InterRAI.org.
The United States introduced policies to reduce admissions to nursing homes and
limit admission to those with greatest need, through the Medicaid Waiver programme.
Figure 3.7 shows the impact of these policies with a progressive reduction of the
proportion of nursing home residents classified as “low care”. These residents will
typically have no complex clinical conditions and be relatively independent in their
activities of daily living. The data in the figure are derived from completely reliable
aggregations of MDSRAI assessments undertaken for care purposes and submitted to
the national repository (www.ltcFocus.org).

117
I.3. USING INTERRAI ASSESSMENT SYSTEMS TO MEASURE AND MAINTAIN QUALITY OF LONG-TERM CARE
A GOOD LIFE IN OLD AGE? MONITORING AND IMPROVING QUALITY IN LONG-TERM CARE © OECD/EUROPEAN COMMISSION 2013
Figure 3.7. Percentage of long stay residents needing only limited care are in US nursing homes
0
10
20
30
40
50
60
70
1998 2000 2002 2004 2006 2008 2010 2012
1% 25% Median 75% 99%
Source: www.ltcFocus.org.
Implementation issues and opportunities
The need to move toward evidence-informed decision making is a relatively
uncontroversial proposition. The question is what conditions are required in order to
implement solutions like the interRAI instruments on a large scale basis, as has been
achieved in a number of countries including Canada, United States, New Zealand, Finland,
Iceland, and currently underway in Belgium.
Political will, leadership and effective partnerships are essential. Decision makers
often need information to address:
● policy challenges that lie ahead;
● clinical information for the entire jurisdiction;
● the needs of vulnerable populations across the continuum of care.
These can only be met by a common cross-sectoral information standard, without
which all comparisons are subject to doubt and the evidence needed to inform decisions
will be equivocal. This point is illustrated in the NHS Information Strategy for England
which specifically addresses the importance of standards and comparable information in
all aspects of health care (Department of Health, 2012).
However, to select and implement a single standard is a substantial political challenge
because even if most agree with the decision, it is highly unlikely that all stakeholders will
118
I.3. USING INTERRAI ASSESSMENT SYSTEMS TO MEASURE AND MAINTAIN QUALITY OF LONG-TERM CARE
A GOOD LIFE IN OLD AGE? MONITORING AND IMPROVING QUALITY IN LONG-TERM CARE © OECD/EUROPEAN COMMISSION 2013
support any single choice. The issues encompass consensus, technical issues, education
and providing feedback to the care providers.
The nature of the challenge
Availability of integrated multi-setting person level data provides a wide array of
opportunities for clinicians, administrators and researchers. This proposition is not unique
to long-term care. It has been the focus of a major health informatics programme in the
United Kingdom, led by the Health Informatics Unit at the Royal College of Physicians
(www.rcplondon.ac.uk/policy/improving-healthcare/health-informatics) and is a major component
of the EU eHealth interoperability roadmap (Calliope, 2011) for example. However achieving
the goal of implementing a standardised integrated approach to assessment, such as the
interRAI system, across whole jurisdictions presents challenges that are not insignificant.
In 2003 the Millbank Memorial Fund published a series of case studies that illustrated the
challenges of implementing the interRAI system in the United States, Canada, Iceland, Israel,
Italy, Japan, Spain and the United Kingdom (Milbank Memorial Fund, 2003). Some of these
countries have made significant progress (United States, Israel, Canada) but others remain
embroiled in dialogue over models for assessment, funding and information management
(e.g. United Kingdom). The report listed seven key issues that are still relevant today:
● It is difficult to introduce compatible, consistent assessment instruments across different
systems and domains, each of which has a culture, history, and current approach to
gathering and using information.
● The interRAI assessment system can be seen by persons in various professions as
unnecessarily burdensome, less precise than existing instruments, too medically
oriented, and an encroachment on the responsibilities of particular professions.
● The [interRAI assessment system] can be the basis for reimbursement based on nursing
home residents’ levels of acuity and thus disrupt the status quo in reimbursement.
● The introduction, maintenance, and full exploitation of a data system can only develop
over time and with a significant expenditure of resources.
● Staff turnover impedes the consistent, continuing use of the instrument.
● The use of the [interRAI assessment system] is affected by such contingent factors as
perceived crises that claim public attention.
● The [interRAI assessment system] can assist but not determine the judgment of policy
makers.
The increasing pressures associated with ageing populations and constrained
resources, together with the rapid development of information technology is leading to the
development of models for successfully addressing the challenge.
Introducing new integrated assessment instruments across different systems and domains
The establishment of systems across regions, nations and care settings is likely to
require significant political and administrative investment by governments. Specific
services are often separately administered by different agencies under the jurisdiction
of different levels of government – national, state, and regional. Even within one level of
government, administrative “silos” can develop which attend to each service type (e.g.,
hospitals and community care). To further complicate matters, the health and social
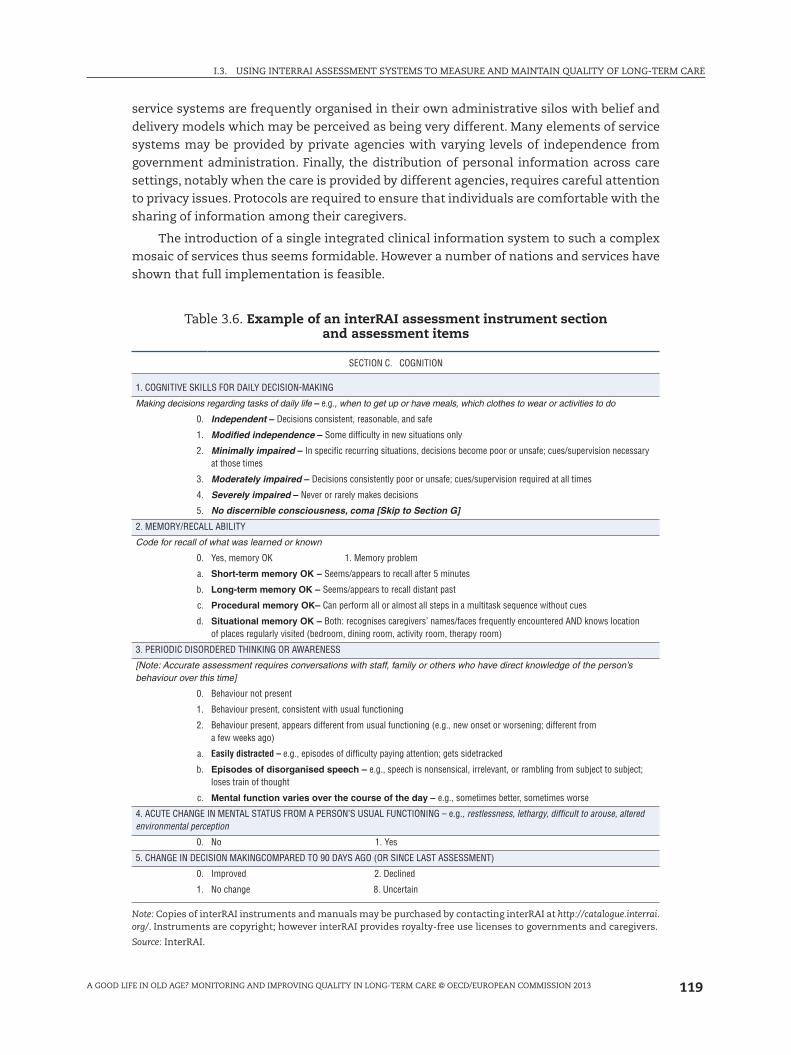
119
I.3. USING INTERRAI ASSESSMENT SYSTEMS TO MEASURE AND MAINTAIN QUALITY OF LONG-TERM CARE
A GOOD LIFE IN OLD AGE? MONITORING AND IMPROVING QUALITY IN LONG-TERM CARE © OECD/EUROPEAN COMMISSION 2013
service systems are frequently organised in their own administrative silos with belief and
delivery models which may be perceived as being very different. Many elements of service
systems may be provided by private agencies with varying levels of independence from
government administration. Finally, the distribution of personal information across care
settings, notably when the care is provided by different agencies, requires careful attention
to privacy issues. Protocols are required to ensure that individuals are comfortable with the
sharing of information among their caregivers.
The introduction of a single integrated clinical information system to such a complex
mosaic of services thus seems formidable. However a number of nations and services have
shown that full implementation is feasible.
Table 3.6. Example of an interRAI assessment instrument section and assessment items
SECTION C. COGNITION
1. COGNITIVE SKILLS FOR DAILY DECISION-MAKING
Making decisions regarding tasks of daily life – e.g., when to get up or have meals, which clothes to wear or activities to do
0. Independent – Decisions consistent, reasonable, and safe
1. Modified independence – Some difficulty in new situations only
2. Minimally impaired – In specific recurring situations, decisions become poor or unsafe; cues/supervision necessary at those times
3. Moderately impaired – Decisions consistently poor or unsafe; cues/supervision required at all times
4. Severely impaired – Never or rarely makes decisions
5. No discernible consciousness, coma [Skip to Section G]
2. MEMORY/RECALL ABILITY
Code for recall of what was learned or known
0. Yes, memory OK 1. Memory problem
a. Short-term memory OK – Seems/appears to recall after 5 minutes
b. Long-term memory OK – Seems/appears to recall distant past
c. Procedural memory OK– Can perform all or almost all steps in a multitask sequence without cues
d. Situational memory OK – Both: recognises caregivers’ names/faces frequently encountered AND knows location of places regularly visited (bedroom, dining room, activity room, therapy room)
3. PERIODIC DISORDERED THINKING OR AWARENESS
[Note: Accurate assessment requires conversations with staff, family or others who have direct knowledge of the person’s behaviour over this time]
0. Behaviour not present
1. Behaviour present, consistent with usual functioning
2. Behaviour present, appears different from usual functioning (e.g., new onset or worsening; different from a few weeks ago)
a. Easily distracted – e.g., episodes of difficulty paying attention; gets sidetracked
b. Episodes of disorganised speech – e.g., speech is nonsensical, irrelevant, or rambling from subject to subject; loses train of thought
c. Mental function varies over the course of the day – e.g., sometimes better, sometimes worse
4. ACUTE CHANGE IN MENTAL STATUS FROM A PERSON’S USUAL FUNCTIONING – e.g., restlessness, lethargy, difficult to arouse, altered environmental perception
0. No 1. Yes
5. CHANGE IN DECISION MAKINGCOMPARED TO 90 DAYS AGO (OR SINCE LAST ASSESSMENT)
0. Improved 2. Declined
1. No change 8. Uncertain
Note: Copies of interRAI instruments and manuals may be purchased by contacting interRAI at http://catalogue.interrai.org/. Instruments are copyright; however interRAI provides royalty-free use licenses to governments and caregivers.
Source: InterRAI.
120
I.3. USING INTERRAI ASSESSMENT SYSTEMS TO MEASURE AND MAINTAIN QUALITY OF LONG-TERM CARE
A GOOD LIFE IN OLD AGE? MONITORING AND IMPROVING QUALITY IN LONG-TERM CARE © OECD/EUROPEAN COMMISSION 2013
An incremental approach to introduction is likely to be more successful than a
blanket introduction across all care providers. Administrations operating two or more
related services may introducing one of the instruments followed by a second and third
(e.g., acute and post-acute care; community and institutional mental health). Services with
relationships to the organisations that implement instruments may then see opportunities
to improve sharing of interoperable data by implementing other instruments from the
suite. Ultimately, the choice not to share instrumentation may place an organisation
at considerable disadvantage (e.g., inability to avail themselves of the opportunity to
benchmark their performance). This effect is likely to be particularly pronounced in
adjacent health or social service sectors providing care to overlapping populations.
In New Zealand, the interRAI Home Care assessment system and interRAI Contact
Assessment are used across all of community care. Introducing the LTCF assessment is
being linked to the development of an information model for the interRAI system that
will support interoperability of the data across computer systems of the full range of
care providers. The New Zealand model of implementation was cited as an example of
innovation in the NHS England Information Strategy 2012 (Department of Health, 2012).
Other countries that have, or plan, advanced implementations of multiple instruments of
the interRAI suite include Canada (Hirdes, 2006), Finland and Belgium.
Consensus
Reluctance to share instrumentation is also evident between health and social care
disciplines, particularly in multi-disciplinary settings. Each professional group uses its
own instrument set to evaluate aspects such as cognition, ADL and mood. There is often a
division of labour in which each profession attends to aspects of the problem – medical staff
to cognition, occupational therapists to functional activities, and nurses to pressure ulcer
prevention. The introduction of a “shared” clinical dataset can be perceived to compromise
the quality of instrumentation and threaten professional autonomy.
Conversely, the use of a shared dataset presents the opportunity to improving
productivity through reduction in duplication of data recording, particularly if this
information is linked to a wider system that brings previous data to the current setting,
and offers an opportunity to efficiently pass on information to subsequent care settings.
The Canadian experience points to two important decision making dynamics. First,
a consensus building process is often needed to reach a critical mass of opinion leaders
of differing types (clinicians, administrators, researchers, policy makers) who will support
the selection of a given information standard. Second, mandated use will ensure full
implementation across all settings, including organisations that may be indifferent to or
unsupportive of the recommendation. It is telling that the only province to recommend,
but not mandate, use of the interRAI instruments (Nova Scotia) was not able to expand use
beyond five opinion-leader homes.
Technical issues
InterRAI instruments are intimately dependent on computerisation, since an integral
feature is a series of complex algorithms that generate scales, CAPs and numerous other
administrative by-products. High quality, computer-based information systems are required
to collect, compile and report on interRAI data to decision makers at all levels from the
bedside to the minister’s office. Paper based solutions are untenable, as are poorly designed
121
I.3. USING INTERRAI ASSESSMENT SYSTEMS TO MEASURE AND MAINTAIN QUALITY OF LONG-TERM CARE
A GOOD LIFE IN OLD AGE? MONITORING AND IMPROVING QUALITY IN LONG-TERM CARE © OECD/EUROPEAN COMMISSION 2013
IT systems. Considerations that will affect data quality range from the human-computer
interface at the clinical level to information standards for national databases. In addition,
tools for on-going monitoring and correction of data quality issues (e.g., auditing systems,
data submission standards, statistical controls). Information governance (including
privacy, access to and secondary uses of interRAI information) need to be built into the
implementation model from the start. Consent models for sharing and transmission of
person identifiable data across care settings and between care professionals are increasingly
available.
Thus, a major challenge to implementation is access to computers and the need for
a reasonable degree of computer literacy among front line staff. Many service settings
are not yet ready for this level of sophistication, and see investment in computerisation
as a significant cost barrier. However, as the benefits of such systems grow and with the
development of lower cost web based solutions, the development of the formal interRAI
information model and the increasing availability of cheaper computer hardware, the case
for investment in these capabilities become increasingly powerful.
Education and training
Education is another core requirement for successful implementation. This includes
training on the technical task of completing assessments correctly, but it also includes:
education to support transitions to a culture of evidence, role modelling on collaborative
exchange and use of data to inform decision making, and training on the use of interRAI’s
decision support algorithms address clinical, service delivery and policy related questions.
The educational strategy must be multidimensional (e.g., in-person education, e-learning
solutions, workshops, conferences), dynamic (to change with evolving learning needs), and
ongoing (e.g., to deal with staff turnover, emergence of new evidence or applications).
Feedback to care providers
Feedback is a critical requirement at all levels of implementation. The required cycle
times for feedback vary depending on the information user and the application of the
information. For example, clinicians should receive virtually instantaneous feedback on
the results of the person’s assessment in order to initiate care planning and interventions
in a timely manner. Managers require information on a somewhat longer time period
to support internal administrative decisions and for governance purposes (e.g., reports
to boards of directors). Governments may find a quarterly to annual information cycle
adequate to inform population level decisions and public accountability. Despite the
different time frames for feedback, each of these levels of consumers must see a “payback”
of evidence arising from the investments made to gather these data.
Data quality
Continually monitoring, evaluating and protecting data quality is important. The
maintenance of data quality is a continuous responsibility for all stakeholders and it can be
addressed through a variety of educational and technical strategies. The fact that assessment
data is generated at the interface between the patient/resident/care recipient, for the purpose
of day to day care planning and delivery is itself a powerful driver for data quality.
122
I.3. USING INTERRAI ASSESSMENT SYSTEMS TO MEASURE AND MAINTAIN QUALITY OF LONG-TERM CARE
A GOOD LIFE IN OLD AGE? MONITORING AND IMPROVING QUALITY IN LONG-TERM CARE © OECD/EUROPEAN COMMISSION 2013
Conclusions
Ageing and its associated chronic diseases and disability will be one of the major global
challenges of this century. Almost all middle and high income nations are experiencing
growth in the size of the older population, and the rate of population ageing is accelerating
as birth rates and mortality rates decline. The availability of high quality evidence to inform
policy development will be an essential resource to governments at all levels. It is not
possible to monitor or improve quality of care without being able to measure and compare
progress over time or performance between organisations, regions or nations. Assessment
instruments such as the interRAI family of assessment instruments provide a unique,
scientifically sound evidence base that can provide insights into the service needs, quality
of care, and impact of policy choices on vulnerable persons across the continuum of care.
This chapter has described the history, scope and use of the interRAI assessment
system. It also presented data illustrating how standardised person level data, recorded for
the purpose of care planning and provision of care, can be aggregated to compare quality
of care and efficiency of care services. Data from cross-national studies illustrate how
only person level data (as opposed to service level data) can provide comparisons of the
characteristics of nursing home and community care service populations and how these
same data provide information on quality indicators of health and social care. Comparisons
have illustrated differences that suggest improved outcomes can be achieved by examining
policies and practices across organisations, regions and nations.
Standardisation of assessment in routine care practice is the most efficient means of
delivering both high quality care and performance data. Standardising assessment and
implementing sophisticated technologies such as the interRAI system on a large scale has
the potential for huge transformational change. It is a significant undertaking that requires
political commitment and presents a significant challenge. This chapter has described
the nature of the challenge, highlighting the importance of overcoming interdisciplinary
defensiveness and reluctance to change practice, commitment to generating reliable
evidence to inform policy and investing in training, education and feedback to the care
professionals and managers whose practice is required to change. There are also essential
technology requirements. Investing in appropriate IT infrastructure seems an expensive
investment. However it is probable that in the face of demographic change and financial
pressure, it is only developing technology that is likely to deliver year on year improved
efficiencies in service organisation and delivery.
Currently it would appear that the interRAI technology is unique in the depth and
breadth of assessment and the well developed products in the form of quality, outcome
and resource use indicators. All constructed entirely on the basis of supporting care
professionals in assessing care needs and developing plans and delivering care. However
great the challenge, governments must address the transformational change of introducing
technology of this nature. OECD countries and regions’ data used in this chapter demonstrate
that this is feasible.
HL7 is the standard for the safe transmission of computerised clinical messages
and the coded clinical information they contain. Health Level Seven International (HL7
– www.hl7.org) is the global authority that maintains and develops the HL7 standards.
SNOMED CT is the international coding standard for clinical terminology that enables
recording, transmission and retrieval of clinical information in a coded digital format.
The International Health Terminology Standards Development Organisation (IHTSDO –
123
I.3. USING INTERRAI ASSESSMENT SYSTEMS TO MEASURE AND MAINTAIN QUALITY OF LONG-TERM CARE
A GOOD LIFE IN OLD AGE? MONITORING AND IMPROVING QUALITY IN LONG-TERM CARE © OECD/EUROPEAN COMMISSION 2013
www.ihtsdo.org) is an international organisation with nation stake holders, created to support
and develop – SNOMED CT. For functional assessment of care needs and the reliable use
of valid comparable person level data, the interRAI assessment technology is the uniquely
powerful system that delivers a full range of reliable aggregatable data from the day
to day care of vulnerable populations. A move from an informal collaboration to a more
formal international organisation such as IHTSDO will help manage the care challenges of
population ageing.
Box 3.4. Suggestions for countries considering the use of standardised assessment systems
1. Foster a culture of evidence-informed decision making and a shared commitment to
high data quality: the introduction of standardised assessment instruments with the
sophisticated associated constructs (such as outcome scales, quality indicators and
casemix systems) can provide a foundation of evidence to inform decision making;
however, the use of evidence in this way itself requires a cultural shift at all levels of
health and social service delivery. The protection of the quality of evidence must become
a fundamental concern for all stakeholders investing in the implementation of these
systems.
2. Engage a broad range of stakeholders as “consumers” of information from standardised
assessment generated from routine practice: the key value of the interRAI assessments
lies not in the collection of data, but rather the application of those data to create
evidence that different stakeholders can use immediately to inform their decisions.
Operational person level data should become a major source of evidence for decision
makers at “the bedside” through to their counterparts in government. The information
will also be of interest to patients, residents and other service users as they review
their own care and compare quality of care across care providers. The engagement
of these stakeholders supports improved data quality and cost-effectiveness for the
implementation investment.
3. Integrate the assessment systems into normal clinical and social care practice: interRAI
assessments should replace redundant systems and those with weak psychometric
evidence as the required standard assessment approach for service recipients.
4. Invest in good quality IT systems to support data collection, reporting and information
exchange: poorly designed computer systems can have profound negative consequences
for any implementation effort. In addition to basic considerations related to the human-
computer interface for a given solution, it is important that the system is able to process
data into meaningful information to support the care professional in day to day work as
well as providing performance data. In the case of the interRAI system this means all the
major interRAI applications (e.g., care planning, outcome measures, quality indicators,
casemix) across sectors and over time for individuals.
5. Employ the suite of instruments across adjacent sectors: although it may not be feasible
to implement every instrument in a short period of time, health and social service
providers serving overlapping populations (e.g., home care and nursing homes) should
adopt instruments with interoperable data.
124
I.3. USING INTERRAI ASSESSMENT SYSTEMS TO MEASURE AND MAINTAIN QUALITY OF LONG-TERM CARE
A GOOD LIFE IN OLD AGE? MONITORING AND IMPROVING QUALITY IN LONG-TERM CARE © OECD/EUROPEAN COMMISSION 2013
Box 3.4. Suggestions for countries considering the use of standardised assessment systems (cont.)
6. Ensure that information feedback loops are responsive to stakeholders’ needs:
clinicians should get virtually instantaneous results from having completed an
assessment, but these results should be shared among all colleagues in the “circle
of care” in a timely manner. Similarly, aggregated data should be available to support
decisions related to governance, regulation and policy development as those decisions
are being formulated.
7. Promote transparency in the use of data: evidence should be available to all decision
makers including consumers, clinicians, managers, administrators and policy makers.
Transparency supports “buy-in” to the introduction of these systems, enhances data
quality, identifies best practices and industry leaders, helps to establish appropriate
quality targets, and fosters and diffuses innovations through collaborative quality
improvement initiatives.
8. Use casemix applications based on person level data to support appropriate allocation of
limited resources to those most in need: in any economic circumstance, but particularly
when resources are constrained by economic pressures, needs based solutions to funding
through proven casemix methodologies provide an equitable approach to resource
allocation.
Notes
1. The authors of the chapter wish to acknowledge the following interRAI fellows for their contribution: Vincent Mor, Brant Fries, President of interRAI; Pálmi Jónsson; Harriet Finne-Soverei; Anja Declercq; Roberto Bernabei; Iris Chi; Nigel Miller; and contributions from Graziano Onder; Andrew Downes; Anna Bjorg Aradottir; Ingibjorg Hjaltadottir; and Johanna De Almeida Mello.
2. InterRAI instruments are intimately dependent on computerisation, since an integral feature is the suite of complex algorithms that generate scales, assessment protocols, resource use casemix products etc. Some software packages developed to deliver the interRAI system include full care planning, rostering and staffing tools and links to knowledge databases, features that are not interRAI products.
3. Trigger – have assessed care needs that trigger a CAP which draws the attention of the care provider to a matter that should be considered in the care plan and provides guidance on the specific issues that should be addressed
4. Some of the differences between United States and other nursing home sites regarding the RUGs distribution may be a function of the US sampling strategy, which would favour new admissions that tend to receive more post-acute care services.
5. The goals of care are specified in the interRAI Falls CAP: Identify and change underlying risk factors for falls; Promote activity in a safe manner and in a safe environment. Recognise common pathways among falls, incontinence, and functional decline. Fall prevention is not an isolated goal but part of a larger objective of promoting physical activity and improved quality of life.
ReferencesBerg, K., V. Mor, J. Morris, K.M. Murphy, T. Moore and Y. Harris (2002), “Identification and Evaluation of
Existing Nursing Homes Quality Indicators”, Health Care Financing Review, Vol. 23, pp. 19-36.
Bjorkgren, M.A., B.E. Fries, A. Arbor and L.R. Shugarman (2000), “A RUG-III Casemix System for Home Care”, Canadian Journal on Aging 2000, Vol. 19 (Suppl. 2), pp. 106-125.

125
I.3. USING INTERRAI ASSESSMENT SYSTEMS TO MEASURE AND MAINTAIN QUALITY OF LONG-TERM CARE
A GOOD LIFE IN OLD AGE? MONITORING AND IMPROVING QUALITY IN LONG-TERM CARE © OECD/EUROPEAN COMMISSION 2013
Bos, J.T., D.H. Frijters, C. Wagner, G.I. Carpenter et al. (2007), “Variations in quality of Home Care between sites across Europe, as measured by Home Care Quality Indicators”, Aging Clinical and Experimental Research, Vol. 19, No. 4, pp. 323-329, August.
Brand, C.A., M. Martin-Khan, O. Wright et al. (2011), “Development of Quality Indicators for Monitoring Outcomes of Frail Elderly Hospitalised in Acute Care Health Settings: Study Protocol”, BMC Health Services Research, Vol. 11:281, 20 October.
Burrows, A.B., J.N. Morris, S.E. Simon, J.P. Hirdes and C. Phillips (2000), “Development of a Minimum Data Set-based Depression Rating Scale for Use in Nursing Homes”, Age and Ageing, Vol. 29, No. 2, pp. 165-172.
Calliope (CALL for InterOPErability) Network (2011), “European eHealth Interoperability Roadmap – Final European Progress Report”, Belgium, retrieved at www.epractice.eu/en/library/5318244.
Carpenter, G.I., N. Ikegami, G. Ljunngren, E. Carrillo and B.E. Fries (1997), “RUG-III and Resource Allocation: Comparing the Relationship of Direct Care Rime with Patient Characteristics in Five Countries”, Age and Ageing, Vol. 26-S2, pp. 61-65.
Carpenter, G.I., G.F. Teare, K. Steel, K. Berg, K. Murphy, J. Bjornson, P.V Jonsson and J.P. Hirdes (2001), “A New Assessment for Elders Admitted to Acute Care: Reliability of the MDS-AC”, Aging Clinical and Experimental Research, Vol. 13, pp. 316-330.
Carpenter, G.I., S. Gill et al. (1999), “A Comparison of MDS/RAI Activity of Daily Living, Cognitive Performance and Depression Scales with Widely Used Scales”, Age and Ageing, Vol. 28(S2), p. 29.
Carpenter, G.I., G. Gambassi, E. Topinkova et al. (2004), “Community Care in Europe: The Aged in Home Care Project (AdHOC)”, Aging Clinical and Experimental Research, Vol. 16, pp. 259-269.
Department of Health (2012), “The Power of Information. Putting All of Us in Control of the Health and Care Information We Need”, London, retrieved at www.dh.gov.uk/prod_consum_dh/groups/dh_digitalassets/@dh/@en/documents/digitalasset/dh_134205.pdf.
Feng, Z., J. Hirdes, T. Smith, H. Finne Soveri et al. (2009), “Use of Physical Restraints and Antipsychotic Medications in Nursing Homes: A Cross-national Study”, International Journal of Geriatric Psychiatry, Vol. 24, pp. 1110-1118.
Folstein, M.F., S.E. Folstein and P.R. McHugh (1975), “Mini-mental State. A Practical Method for Grading the Cognitive State of Patients for the Clinician”, Journal of Psychiatric Research, Vol. 12, No. 3, pp. 189-198.
Fries, B.E., S.E. Simon, J.N. Morris, C. Flodstrom and F.L. Bookstein (2001), “Pain in U.S. Nursing Homes: Validating a Pain Scale for the Minimum Data Set”, The Gerontologist, Vol. 41, No. 2, pp. 173-179.
Fries, B.E., D.P. Schneider, W.J. Foley, M. Gavazzi, R. Burke and E. Cornelius (1994), “Refining a Case-mix Measure for Nursing Homes: Resource Utilisation Groups (RUG-III)”, Medical Care, Vol. 32, pp. 668-685.
Fries, B.E., C.J. Fahey, C. Hawes, B.C. Vladeck, J. Morris, C. Phillips, H. Fredeking, J. Hirdes, D.G. Sinclair, J.T. King et al. (2003), “Implementing the Resident Assessment Instrument: Case Studies of Policymaking for Long-term Care in Eight Countries”, Milbank Memorial Fund, p. 129.
Hawes, C. (1990), “The Institute of Medicine Study: Improving Quality of Care in Nursing Homes”, in P. Katz, R.L. Kane and M. Mezey (eds.), Advances in Long-term Care, Springer, New York.
Hirdes, J.P., B.E. Fries, J.N. Morris, K. Steel, V. Mor, D. Frijters, S. LaBine, C. Schalm, M.J. Stones, G. Teare et al. (1999), “Integrated Health Information Systems Based on the RAI/MDS Series of Instruments”, Health Manage Forum, Vol. 12, No. 4, pp. 30-40.
Hirdes, J.P. et al. (2002a), “A System for Classification of Inpatient Psychiatry (SCIPP): A New Case Mix Methodology for Mental Health”, Joint Policy and Planning Committee, Toronto.
Hirdes, J.P., T.F. Smith, T. Rabinowitz, K. Yamauchi, E. Perez, N.C. Telegdi, P. Prendergast, J.N. Morris, N. Ikegami, C.D. Phillips et al. (2002b), “The Resident Assessment Instrument-Mental Health (RAI-MH): Inter-rater Reliability and Convergent Validity”, Journal of Behavioral Health Services & Research, Vol. 29, pp. 419-432.
Hirdes, J.P., G. Ljunggren, J.N. Morris, D.H. Frijters, H. Finne Soveri, L. Gray, M. Björkgren and R. Gilgen (2008), “Reliability of the InterRAI Suite of Assessment Instruments: A 12-country Study of an Integrated Health Information System”, retrieved at www.biomedcentral.com/1472-6963/8/277.
Hirdes, J.P., D.H. Frijters and G.F. Teare (2003), “The MDS-CHESS Scale: A New Measure to Predict Mortality in Institutionalized Older People”, Journal of American Geriatrics Society, Vol. 51, No. 1, pp. 96-100.
126
I.3. USING INTERRAI ASSESSMENT SYSTEMS TO MEASURE AND MAINTAIN QUALITY OF LONG-TERM CARE
A GOOD LIFE IN OLD AGE? MONITORING AND IMPROVING QUALITY IN LONG-TERM CARE © OECD/EUROPEAN COMMISSION 2013
Hirdes, J.P., B.E. Fries, J.N. Morris, N. Ikegami et al. (2004), “Home Care Quality Indicators (HCQIs) Based on the MDS-HC”, The Gerontologist, Vol. 44, No. 5, pp. 665-679, October.
Hirdes, J.P., M. Marhaba, T.F. Smith et al. (2001), “Development of the Resident Assessment Instrument – Mental Health (RAI-MH) Resident Assessment Instrument-Mental Health Group”, Hospital Quarterly, Vol. 4, No. 2, pp. 44-51, Winter.
Hirdes, J.P. (2006), “Addressing the Health Needs of Frail Elderly People: Ontario’s Experience with an Integrated Health Information System”, Age and Ageing, Vol. 35, No. 4, pp. 329-331, July.
Huang, Y. and G.I. Carpenter (2011), “Identifying Elderly Depression Using the Depression Rating Scale as Part of Comprehensive Standardised Care Assessment in Nursing Homes”, Aging and Mental Health, Vol. 15, No. 8, pp. 1045-1051.
Institute of Medicine (1986), “Improving the Quality of Care in Nursing Homes”, National Academy of Sciences Press, Washington, DC.
Jones, R.N., J.P. Hirdes, J.W. Poss, M. Kelly, K. Berg, B.E. Fries and J.N. Morris (2010), “BMC Adjustment of Nursing Home Quality Indicators”, Health Services Research, Vol. 15, 10:96, April.
Kane, R.A. and R.L. Kane (1981), Assessing the Elderly: A Practical Guide to Measurement, Lexington, United States.
Kinsella, K. and W. He (2009), An Aging World: 2008, US Department of Commerce, Washington.
Lincoln Centre for Ageing and Community Care Research (2004), “The Review and Identification of an Existing, Validated, Comprehensive Assessment Tool”, retrieved at www.health.vic.gov.au/subacute/assess.pdf.
Mahoney, F. and D. Barthel (1965), “Functional Evaluation: The Barthel Index”, Maryland Medical Journal, Vol. 14, pp. 61-65.
Martin, L., B.E. Fries, J.P. Hirdes and M. James (2011), “Using the RUG-III Classification System for Understanding the Resource Intensity of Persons with Intellectual Disability Residing in Nursing Homes”, Journal of Intellectual Disabilities, Vol. 15, No. 2, pp. 131-141, June.
Martin, L., J.P. Hirdes, B.E. Fries and T.F. Smith (2007), “Development and Psychometric Properties of an Assessment for Persons with Intellectual Disability – The interRAI ID”, Journal of Policy and Practice in Intellectual Disabilities, Vol. 4, pp. 23-29.
McDonald, A.J.D. and G.I. Carpenter (2003), “The Recognition of Dementia in ‘Non-EMI’ Nursing Home Residents in South East England”, International Journal of Psychology, Vol. 18, pp. 105-108.
Milbank Memorial Fund (2003), “Implementing the Resident Assessment Instrument:Case Studies of Policymaking for Long-Term Care in Eight Countries”, retrieved at www.milbank.org/uploads/documents/interRAI/ResidentAssessment_Mech2.pdf.
Mor, V., K. Branco, J. Fleishman, C. Hawes, C. Phillips, I. Morris and B. Fries (1995), “The Structure of Social Engagement Among Nursing Home Residents”, Journals of Gerontology Series B-Psychological Sciences & Social Sciences, Vol. 50, pp. P1-P8.
Mor, V., O. Intrator, B.E. Fries, C. Phillips, J. Teno, J. Hiris, C. Hawes and J. Morris (1997), “Changes in Hospitalization Associated with Introducing the Resident Assessment Instrument”, Journal of the American Geriatrics Society, Vol. 45, No. 8, pp. 1002-1010.
Mor, V., J. Angelelli, D. Gifford, J. Morris and T. Moore (2003), “Benchmarking and Quality in Residential and Nursing Homes: Lessons from the US”, International Journal of Geriatric Psychiatry, Vol. 18, No. 3, pp. 258-266, March.
Mor, V., J. Angelelli, R. Jones, J. Roy, T. Moore and J. Morris (2003a), “Inter-rater reliability of nursing home quality indicators in the U.S.”, BMC Health Services Research, Vol. 4, No. 3(1), p. 20, November.
Mor, V., K. Berg, J. Angelelli, D. Gifford, J. Morris and T. Moore (2003b), “The Quality of Quality Measurement in U.S. Nursing Homes”, The Gerontologist, Vol. 43, Spec. No. 2, pp. 37-46.
Mor, V. (2005), “Improving the Quality of Long-term Care with Better Information”, Milbank Quarterly, Vol. 83, No. 3, pp. 333-364.
Morris, J., C. Hawes, B.E. Fries, C. Phillips, V. Mor and S. Katz (1990), “Designing the National Resident Assessment System for Nursing Homes”, The Gerontologist, Vol. 30, No. 3, pp. 293-307.
Morris, J.N., B.E. Fries, K. Steel, N. Ikegami, R. Bernabei, G.I. Carpenter et al. (1997), “Comprehensive Clinical Assessment in Community Setting – Applicability of the MDS-HC”, Journal of the American Geriatrics Society, Vol. 45, pp. 1017-1024.
127
I.3. USING INTERRAI ASSESSMENT SYSTEMS TO MEASURE AND MAINTAIN QUALITY OF LONG-TERM CARE
A GOOD LIFE IN OLD AGE? MONITORING AND IMPROVING QUALITY IN LONG-TERM CARE © OECD/EUROPEAN COMMISSION 2013
Morris, J.N., S. Nonemaker, K. Murphy, C. Hawes, B.E. Fries, V. Mor and C. Phillips (1997), “A Commitment to Change: Revision of HCFA’s RAI”, Journal of the American Geriatrics Society, Vol. 45, No. 8, pp. 1011-1016, August.
Morris, J.N., B.E. Fries, D.R. Mehr, C. Hawes, C.D. Phillips, V. Mor and L.A. Lipsitz (1994), “MDS Cognitive Performance Scale”, Journal of Gerontology, Vol. 49, pp. 174-182.
Morris, J.N., B.E. Fries and S.A. Morris (1999), “Scaling ADLs within the MDS”, Journals of Gerontology Series A: Biological Sciences and Medical Sciences, Vol. 54, No. 11, pp. 546-553.
OECD (2007), Reviews of Risk Management Policies: Sweden – The Safety of Older People, OECD Publishing, Paris, http://dx.doi.rg/ 10.1787/9789264027077-en.
Onder, G., I. Carpenter, H. Finne-Soveri, J. Gindin, D. Frijters, J.C. Henrard, T. Nikolaus, E. Topinkova et al. (2012), “Assessment of Nursing Home Residents in Europe: The Services and Health for Elderly in Long-term Care (SHELTER) Study”, BMC Health Services Research, Vol. 12, No. 5, www.biomedcentral.com/1472-6963/12/5.
Pattie, A.H. and C.J. Gilleard (1979), “Manual of the Clifton Assessment Procedures for the Elderly (CAPE)”, Hodder and Stoughton Educational, Sevenoaks, United Kingdom.
Poss, J.W., N.M. Jutan, J.P. Hirdes, B.E. Fries, J.N. Morris, G.F. Teare and K. Reidel (2008), “A Review of Evidence on the Reliability and Validity of Minimum Data Set Data”, Health Management Forum, Vol. 21, No. 1, pp. 33-39, Spring.
Rubenstein, E., L.Z. Wieland and D. Bernabei (1995), Geriatric Assessment Technology – The State of the Art, Editris Kurtis, Milan.
Steel, K., G. Ljunggren, E. Topinkova, J.N. Morris, C. Vitale, J. Parzuchowski, S. Nonemaker, D.H. Frijters, T. Rabinowitz, K.M. Murphy et al. (2003), “The RAI-PC: An Assessment Instrument for Palliative Care in All Settings”, American Journal of Hospice & Palliative Care, Vol. 20, pp. 211-219.
Stratton, R.J., A. Hackston, D. Longmore, R. Dixon, S. Price, M. Stroud, C. King and M. Elia (2004), “Malnutrition in Hospital Outpatients and Inpatients: Prevalence, Concurrent Validity and Ease of Use of the ‘Malnutrition Universal Screening Tool’ (‘MUST’) for Adults”, British Journal of Nutrition, Vol. 92, No. 05, pp. 799-808.
Yesavage, J.A., T.L. Brink, T.L. Rose et al. (1982), “Development and Validation of a Geriatric Depression Screening Scale: A Preliminary Report”, Journal of Psychiatric Research 198283, Vol. 17, No. 1, pp. 37-49.
Zimmerman, D.R., S.L. Karon, G. Arling, B.R. Clark, T. Collins, R. Ross and F. Sainfort (1995), “Development and Testing of Nursing Home Quality Indicators”, Health Care Financing Review, Vol. 16, No. 4, pp. 107-127, Summer.

129
I.3. USING INTERRAI ASSESSMENT SYSTEMS TO MEASURE AND MAINTAIN QUALITY OF LONG-TERM CARE
A GOOD LIFE IN OLD AGE? MONITORING AND IMPROVING QUALITY IN LONG-TERM CARE © OECD/EUROPEAN COMMISSION 2013
ANNEX 3.A1
Reference tables from nine OECD and non-OECD countries and regions using interRAI
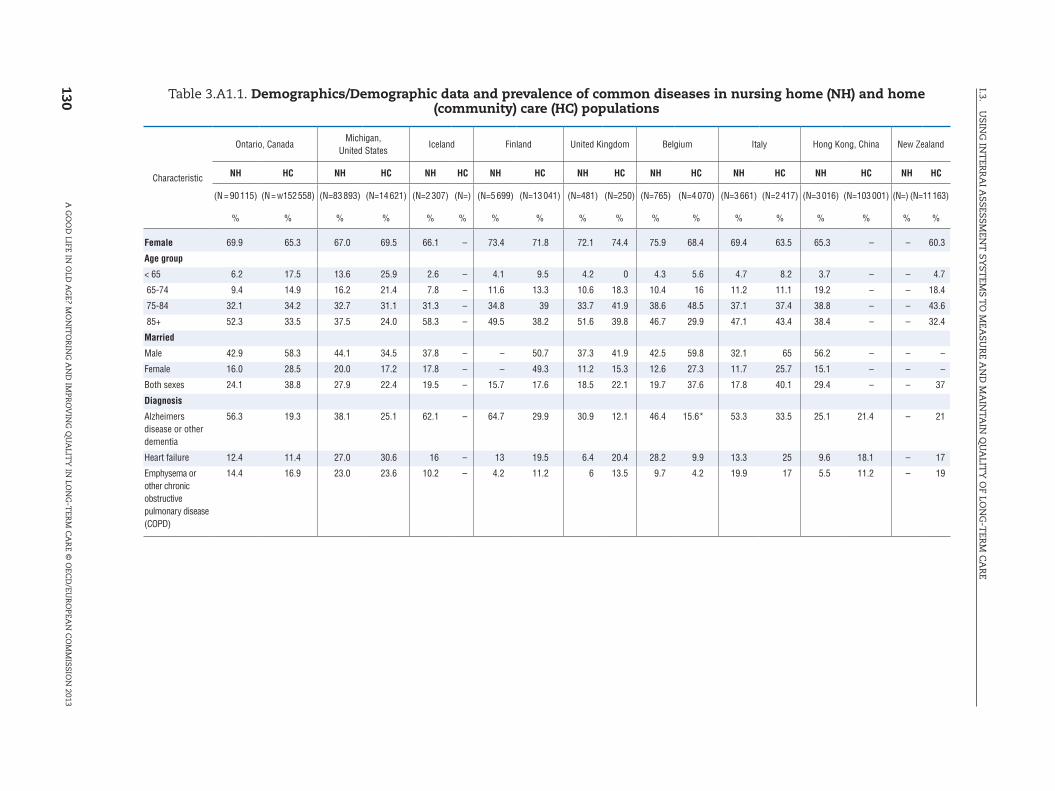
130
I.3. U
SING
INT
ERR
AI A
SSESSMEN
T SY
STEM
S TO
MEA
SUR
E AN
D M
AIN
TAIN
QU
ALIT
Y O
F LON
G-T
ERM
CA
RE
A G
OO
D LIFE IN
OLD
AG
E? MO
NIT
OR
ING
AN
D IM
PRO
VIN
G Q
UA
LITY
IN LO
NG
-TER
M C
AR
E © O
ECD
/EUR
OPEA
N C
OM
MISSIO
N 2013
Table 3.A1.1. Demographics/Demographic data and prevalence of common diseases in nursing home (NH) and home (community) care (HC) populations
Characteristic
Ontario, CanadaMichigan,
United StatesIceland Finland United Kingdom Belgium Italy Hong Kong, China New Zealand
NH HC NH HC NH HC NH HC NH HC NH HC NH HC NH HC NH HC
(N = 90 115) (N = w152 558) (N=83 893) (N=14 621) (N=2 307) (N=) (N=5 699) (N=13 041) (N=481) (N=250) (N=765) (N=4 070) (N=3 661) (N=2 417) (N=3 016) (N=103 001) (N=) (N=11 163)
% % % % % % % % % % % % % % % % % %
Female 69.9 65.3 67.0 69.5 66.1 – 73.4 71.8 72.1 74.4 75.9 68.4 69.4 63.5 65.3 – – 60.3
Age group
< 65 6.2 17.5 13.6 25.9 2.6 – 4.1 9.5 4.2 0 4.3 5.6 4.7 8.2 3.7 – – 4.7
65-74 9.4 14.9 16.2 21.4 7.8 – 11.6 13.3 10.6 18.3 10.4 16 11.2 11.1 19.2 – – 18.4
75-84 32.1 34.2 32.7 31.1 31.3 – 34.8 39 33.7 41.9 38.6 48.5 37.1 37.4 38.8 – – 43.6
85+ 52.3 33.5 37.5 24.0 58.3 – 49.5 38.2 51.6 39.8 46.7 29.9 47.1 43.4 38.4 – – 32.4
Married
Male 42.9 58.3 44.1 34.5 37.8 – – 50.7 37.3 41.9 42.5 59.8 32.1 65 56.2 – – –
Female 16.0 28.5 20.0 17.2 17.8 – – 49.3 11.2 15.3 12.6 27.3 11.7 25.7 15.1 – – –
Both sexes 24.1 38.8 27.9 22.4 19.5 – 15.7 17.6 18.5 22.1 19.7 37.6 17.8 40.1 29.4 – – 37
Diagnosis
Alzheimers disease or other dementia
56.3 19.3 38.1 25.1 62.1 – 64.7 29.9 30.9 12.1 46.4 15.6* 53.3 33.5 25.1 21.4 – 21
Heart failure 12.4 11.4 27.0 30.6 16 – 13 19.5 6.4 20.4 28.2 9.9 13.3 25 9.6 18.1 – 17
Emphysema or other chronic obstructive pulmonary disease (COPD)
14.4 16.9 23.0 23.6 10.2 – 4.2 11.2 6 13.5 9.7 4.2 19.9 17 5.5 11.2 – 19
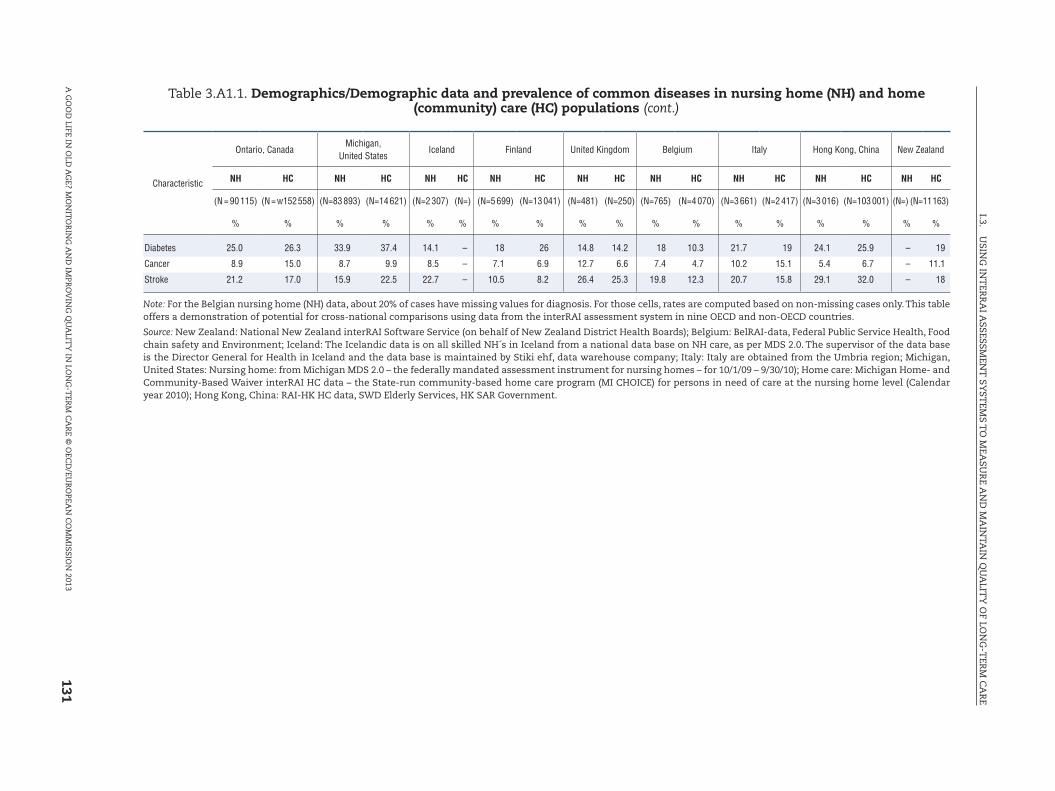
131
I.3. U
SING
INT
ERR
AI A
SSESSMEN
T SY
STEM
S TO
MEA
SUR
E AN
D M
AIN
TAIN
QU
ALIT
Y O
F LON
G-T
ERM
CA
RE
A G
OO
D LIFE IN
OLD
AG
E? MO
NIT
OR
ING
AN
D IM
PRO
VIN
G Q
UA
LITY
IN LO
NG
-TER
M C
AR
E © O
ECD
/EUR
OPEA
N C
OM
MISSIO
N 2013
Characteristic
Ontario, CanadaMichigan,
United StatesIceland Finland United Kingdom Belgium Italy Hong Kong, China New Zealand
NH HC NH HC NH HC NH HC NH HC NH HC NH HC NH HC NH HC
(N = 90 115) (N = w152 558) (N=83 893) (N=14 621) (N=2 307) (N=) (N=5 699) (N=13 041) (N=481) (N=250) (N=765) (N=4 070) (N=3 661) (N=2 417) (N=3 016) (N=103 001) (N=) (N=11 163)
% % % % % % % % % % % % % % % % % %
Diabetes 25.0 26.3 33.9 37.4 14.1 – 18 26 14.8 14.2 18 10.3 21.7 19 24.1 25.9 – 19
Cancer 8.9 15.0 8.7 9.9 8.5 – 7.1 6.9 12.7 6.6 7.4 4.7 10.2 15.1 5.4 6.7 – 11.1
Stroke 21.2 17.0 15.9 22.5 22.7 – 10.5 8.2 26.4 25.3 19.8 12.3 20.7 15.8 29.1 32.0 – 18
Note: For the Belgian nursing home (NH) data, about 20% of cases have missing values for diagnosis. For those cells, rates are computed based on non-missing cases only. This table offers a demonstration of potential for cross-national comparisons using data from the interRAI assessment system in nine OECD and non-OECD countries.
Source: New Zealand: National New Zealand interRAI Software Service (on behalf of New Zealand District Health Boards); Belgium: BelRAI-data, Federal Public Service Health, Food chain safety and Environment; Iceland: The Icelandic data is on all skilled NH´s in Iceland from a national data base on NH care, as per MDS 2.0. The supervisor of the data base is the Director General for Health in Iceland and the data base is maintained by Stiki ehf, data warehouse company; Italy: Italy are obtained from the Umbria region; Michigan, United States: Nursing home: from Michigan MDS 2.0 – the federally mandated assessment instrument for nursing homes – for 10/1/09 – 9/30/10); Home care: Michigan Home- and Community-Based Waiver interRAI HC data – the State-run community-based home care program (MI CHOICE) for persons in need of care at the nursing home level (Calendar year 2010); Hong Kong, China: RAI-HK HC data, SWD Elderly Services, HK SAR Government.
Table 3.A1.1. Demographics/Demographic data and prevalence of common diseases in nursing home (NH) and home (community) care (HC) populations (cont.)
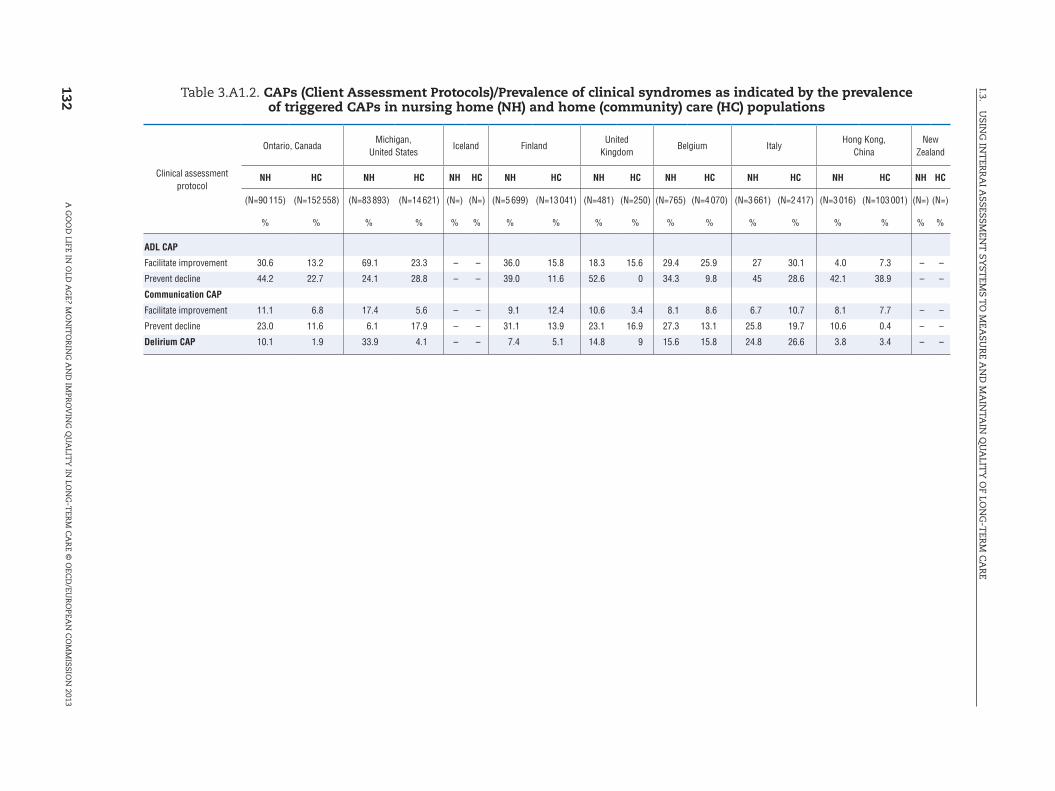
132
I.3. U
SING
INT
ERR
AI A
SSESSMEN
T SY
STEM
S TO
MEA
SUR
E AN
D M
AIN
TAIN
QU
ALIT
Y O
F LON
G-T
ERM
CA
RE
A G
OO
D LIFE IN
OLD
AG
E? MO
NIT
OR
ING
AN
D IM
PRO
VIN
G Q
UA
LITY
IN LO
NG
-TER
M C
AR
E © O
ECD
/EUR
OPEA
N C
OM
MISSIO
N 2013
Table 3.A1.2. CAPs (Client Assessment Protocols)/Prevalence of clinical syndromes as indicated by the prevalence of triggered CAPs in nursing home (NH) and home (community) care (HC) populations
Clinical assessment protocol
Ontario, CanadaMichigan,
United StatesIceland Finland
United Kingdom
Belgium ItalyHong Kong,
ChinaNew
Zealand
NH HC NH HC NH HC NH HC NH HC NH HC NH HC NH HC NH HC
(N=90 115) (N=152 558) (N=83 893) (N=14 621) (N=) (N=) (N=5 699) (N=13 041) (N=481) (N=250) (N=765) (N=4 070) (N=3 661) (N=2 417) (N=3 016) (N=103 001) (N=) (N=)
% % % % % % % % % % % % % % % % % %
ADL CAP
Facilitate improvement 30.6 13.2 69.1 23.3 – – 36.0 15.8 18.3 15.6 29.4 25.9 27 30.1 4.0 7.3 – –
Prevent decline 44.2 22.7 24.1 28.8 – – 39.0 11.6 52.6 0 34.3 9.8 45 28.6 42.1 38.9 – –
Communication CAP
Facilitate improvement 11.1 6.8 17.4 5.6 – – 9.1 12.4 10.6 3.4 8.1 8.6 6.7 10.7 8.1 7.7 – –
Prevent decline 23.0 11.6 6.1 17.9 – – 31.1 13.9 23.1 16.9 27.3 13.1 25.8 19.7 10.6 0.4 – –
Delirium CAP 10.1 1.9 33.9 4.1 – – 7.4 5.1 14.8 9 15.6 15.8 24.8 26.6 3.8 3.4 – –
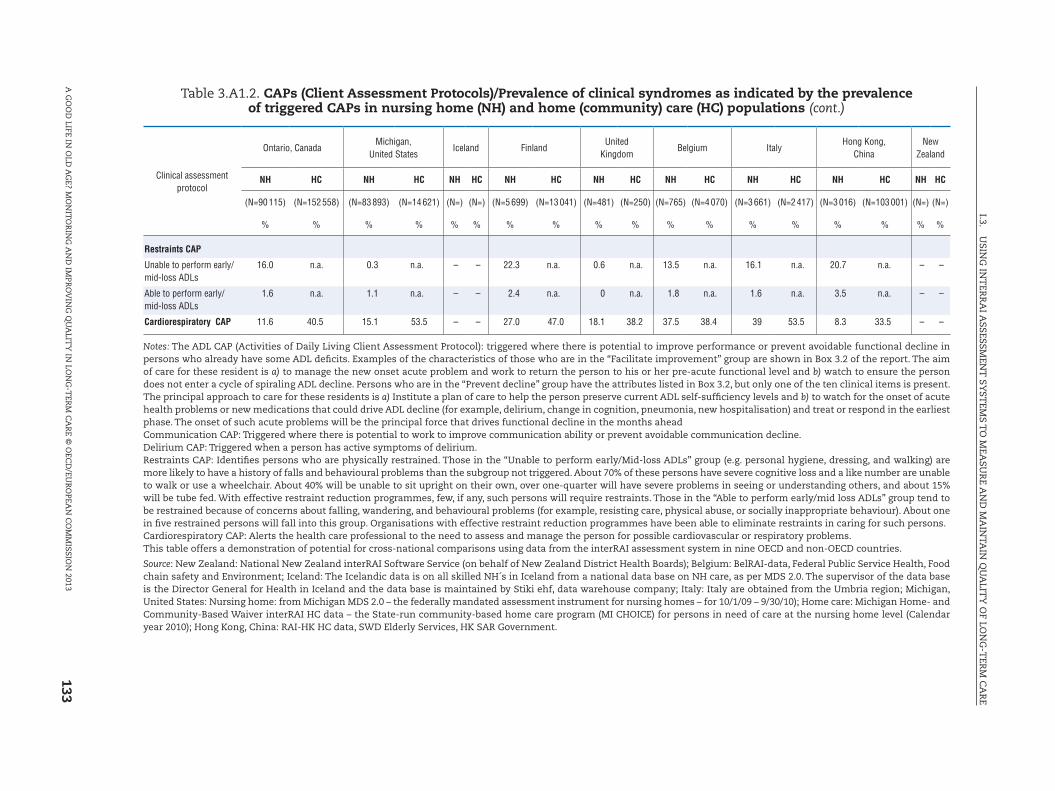
133
I.3. U
SING
INT
ERR
AI A
SSESSMEN
T SY
STEM
S TO
MEA
SUR
E AN
D M
AIN
TAIN
QU
ALIT
Y O
F LON
G-T
ERM
CA
RE
A G
OO
D LIFE IN
OLD
AG
E? MO
NIT
OR
ING
AN
D IM
PRO
VIN
G Q
UA
LITY
IN LO
NG
-TER
M C
AR
E © O
ECD
/EUR
OPEA
N C
OM
MISSIO
N 2013
Clinical assessment protocol
Ontario, CanadaMichigan,
United StatesIceland Finland
United Kingdom
Belgium ItalyHong Kong,
ChinaNew
Zealand
NH HC NH HC NH HC NH HC NH HC NH HC NH HC NH HC NH HC
(N=90 115) (N=152 558) (N=83 893) (N=14 621) (N=) (N=) (N=5 699) (N=13 041) (N=481) (N=250) (N=765) (N=4 070) (N=3 661) (N=2 417) (N=3 016) (N=103 001) (N=) (N=)
% % % % % % % % % % % % % % % % % %
Restraints CAP
Unable to perform early/mid-loss ADLs
16.0 n.a. 0.3 n.a. – – 22.3 n.a. 0.6 n.a. 13.5 n.a. 16.1 n.a. 20.7 n.a. – –
Able to perform early/mid-loss ADLs
1.6 n.a. 1.1 n.a. – – 2.4 n.a. 0 n.a. 1.8 n.a. 1.6 n.a. 3.5 n.a. – –
Cardiorespiratory CAP 11.6 40.5 15.1 53.5 – – 27.0 47.0 18.1 38.2 37.5 38.4 39 53.5 8.3 33.5 – –
Notes: The ADL CAP (Activities of Daily Living Client Assessment Protocol): triggered where there is potential to improve performance or prevent avoidable functional decline in persons who already have some ADL deficits. Examples of the characteristics of those who are in the “Facilitate improvement” group are shown in Box 3.2 of the report. The aim of care for these resident is a) to manage the new onset acute problem and work to return the person to his or her pre-acute functional level and b) watch to ensure the person does not enter a cycle of spiraling ADL decline. Persons who are in the “Prevent decline” group have the attributes listed in Box 3.2, but only one of the ten clinical items is present. The principal approach to care for these residents is a) Institute a plan of care to help the person preserve current ADL self-sufficiency levels and b) to watch for the onset of acute health problems or new medications that could drive ADL decline (for example, delirium, change in cognition, pneumonia, new hospitalisation) and treat or respond in the earliest phase. The onset of such acute problems will be the principal force that drives functional decline in the months aheadCommunication CAP: Triggered where there is potential to work to improve communication ability or prevent avoidable communication decline.Delirium CAP: Triggered when a person has active symptoms of delirium.Restraints CAP: Identifies persons who are physically restrained. Those in the “Unable to perform early/Mid-loss ADLs” group (e.g. personal hygiene, dressing, and walking) are more likely to have a history of falls and behavioural problems than the subgroup not triggered. About 70% of these persons have severe cognitive loss and a like number are unable to walk or use a wheelchair. About 40% will be unable to sit upright on their own, over one-quarter will have severe problems in seeing or understanding others, and about 15% will be tube fed. With effective restraint reduction programmes, few, if any, such persons will require restraints. Those in the “Able to perform early/mid loss ADLs” group tend to be restrained because of concerns about falling, wandering, and behavioural problems (for example, resisting care, physical abuse, or socially inappropriate behaviour). About one in five restrained persons will fall into this group. Organisations with effective restraint reduction programmes have been able to eliminate restraints in caring for such persons.Cardiorespiratory CAP: Alerts the health care professional to the need to assess and manage the person for possible cardiovascular or respiratory problems.This table offers a demonstration of potential for cross-national comparisons using data from the interRAI assessment system in nine OECD and non-OECD countries.
Source: New Zealand: National New Zealand interRAI Software Service (on behalf of New Zealand District Health Boards); Belgium: BelRAI-data, Federal Public Service Health, Food chain safety and Environment; Iceland: The Icelandic data is on all skilled NH´s in Iceland from a national data base on NH care, as per MDS 2.0. The supervisor of the data base is the Director General for Health in Iceland and the data base is maintained by Stiki ehf, data warehouse company; Italy: Italy are obtained from the Umbria region; Michigan, United States: Nursing home: from Michigan MDS 2.0 – the federally mandated assessment instrument for nursing homes – for 10/1/09 – 9/30/10); Home care: Michigan Home- and Community-Based Waiver interRAI HC data – the State-run community-based home care program (MI CHOICE) for persons in need of care at the nursing home level (Calendar year 2010); Hong Kong, China: RAI-HK HC data, SWD Elderly Services, HK SAR Government.
Table 3.A1.2. CAPs (Client Assessment Protocols)/Prevalence of clinical syndromes as indicated by the prevalence of triggered CAPs in nursing home (NH) and home (community) care (HC) populations (cont.)

134
I.3. U
SING
INT
ERR
AI A
SSESSMEN
T SY
STEM
S TO
MEA
SUR
E AN
D M
AIN
TAIN
QU
ALIT
Y O
F LON
G-T
ERM
CA
RE
A G
OO
D LIFE IN
OLD
AG
E? MO
NIT
OR
ING
AN
D IM
PRO
VIN
G Q
UA
LITY
IN LO
NG
-TER
M C
AR
E © O
ECD
/EUR
OPEA
N C
OM
MISSIO
N 2013
Table 3.A1.3. Scales/Physical impairment, cognitive impairment, severity of depressive symptoms and severity of pain in nursing home (NH) and home (community) care (HC) populations
Scale name
Ontario, Canada Michigan, United States Iceland Finland United Kingdom Belgium Italy Hong Kong, China New Zealand
NH HC NH HC NH HC NH HC NH HC NH HC NH HC NH HC NH HC
(N=90 115) (N=152 558) (N=83 893) (N=14 621) (N=2 307) (N=) (N=5 699) (N=13 041) (N=481) (N=250) (N=765) (N=4 070) (N=3 661) (N=2 417) (N=3 016) (N=103 001) (N=) (N=11 163)
% % % % % % % % % % % % % % % % % %
Cognitive performance scale
0 15.2 44.4 34.6 33.2 4.9 – 4.9 35.0 21.4 52.6 17.7 41.5 7.6 24.2 36.0 10.3 – 38.3
1-2 26.4 44.2 26.3 40.3 17.6 – 16.8 37.6 28.5 26.3 21.6 27.3 30.4 27.3 26.9 83.0 – 31.6
3-4 33.4 7.3 30.2 15.9 30.1 – 35.5 21.8 20.8 9.3 33.6 20.9 21.5 14.0 18.4 5.0 – 25.1
5-6 25.0 4.2 8.8 7.5 47.4 – 42.8 5.7 29.5 8.0 27.1 10.3 40.5 34.5 18.6 1.7 – 5.0
ADL hierarchy
0 7.9 62.6 2.3 41.3 – – 2.8 72.2 6.9 67.8 7.9 23.4 5.6 10.6 42.5 53.7 – 65.3
1-2 17.1 24.0 19.0 26.6 – – 15.2 17.7 ore 11.1 12.8 24.4 16.1 8.4 12.0 38.0 – 22.3
3-4 38.2 10.0 57.1 20.3 – – 28.7 8.4 20.8 16.6 46.8 41.1 31.6 27.6 12.1 7.6 – 9.3
5-6 36.8 3.4 21.6 9.6 – – 53.4 1.8 64.7 4.5 32.5 11.1 46.6 53.5 33.4 0.8 – 3.1
Depression rating scale
0 34.1 60.5 61.3 60.6 33.4 – 35.0 62.9 39.3 >2 31.1 46.1 37.9 49.9 83.2 64.8 – 60.5
1-2 33.0 23.1 29.8 24.0 42.1 – 34.1 20.9 28.3 26.3 30.3 24.6 28.1 20.3 13.6 27.6 – 23.4
3+ 32.9 16.4 8.8 15.4 24.5 – 30.9 16.3 32.2 g 38.6 29.3 34.0 29.8 3.3 7.6 – 16.1

135
I.3. U
SING
INT
ERR
AI A
SSESSMEN
T SY
STEM
S TO
MEA
SUR
E AN
D M
AIN
TAIN
QU
ALIT
Y O
F LON
G-T
ERM
CA
RE
A G
OO
D LIFE IN
OLD
AG
E? MO
NIT
OR
ING
AN
D IM
PRO
VIN
G Q
UA
LITY
IN LO
NG
-TER
M C
AR
E © O
ECD
/EUR
OPEA
N C
OM
MISSIO
N 2013
Scale name
Ontario, Canada Michigan, United States Iceland Finland United Kingdom Belgium Italy Hong Kong, China New Zealand
NH HC NH HC NH HC NH HC NH HC NH HC NH HC NH HC NH HC
(N=90 115) (N=152 558) (N=83 893) (N=14 621) (N=2 307) (N=) (N=5 699) (N=13 041) (N=481) (N=250) (N=765) (N=4 070) (N=3 661) (N=2 417) (N=3 016) (N=103 001) (N=) (N=11 163)
% % % % % % % % % % % % % % % % % %
Pain scale
0 57.5 32.4 39.8 28.4 24.5 – 51.0 38.7 63.2 29.4 ges 50.0 77.9 63.5 72.4 48.8 – 40.4
1-2 39.6 53.8 56.1 51.0 63.9 – 45.6 53.9 34.1 51.6 37.0 40.6 20.2 31.0 21.5 46.6 – 45.9
3 3.0 13.8 4.0 13.5 11.6 – 3.3 7.5 2.7 19.0 4.3 9.3 1.9 5.5 6.1 4.6 – 13.7
Cognitive Performance Scale: Combines information on memory impairment, level of consciousness, and executive function, with scores ranging from 0 (intact) to 6 (very severe impairment). Scores of 3 or greater indicate likely presence of dementia (www.interrai.org/assets/files/Scales/Cognitive%20Performance%20Scale.pdf).ADL (activities of daily living) hierarchy groups activities of daily living according to the stage of the disablement process in which they occur. Early loss ADLs (for example, dressing) are assigned lower scores than late loss ADLs (for example, eating). The ADL Hierarchy ranges from 0 (no impairment) to 6 (total dependence). (www.interrai.org/assets/files/Scales/ADL%20Hierarchy.pdf).Depression rating scale: Used as a clinical screen for depression. Scores of 3 or greater indicate likely presence of major or minor depressive disorders (www.interrai.org/assets/files/Scales/Depression%20Rating%20Scale.pdf).Pain scale: Uses two items to create a score from 0 to 3. It has been shown to be highly predictive of pain as measured by the Visual Analogue Scale (www.interrai.org/assets/files/Scales/Pain%20Scale.pdf).This table offers a demonstration of potential for cross-national comparisons using data from the interRAI assessment system in nine OECD and non-OECD countries.
Source: New Zealand: National New Zealand interRAI Software Service (on behalf of New Zealand District Health Boards); Belgium: BelRAI-data, Federal Public Service Health, Food chain safety and Environment; Iceland: The Icelandic data is on all skilled NH´s in Iceland from a national data base on NH care, as per MDS 2.0. The supervisor of the data base is the Director General for Health in Iceland and the data base is maintained by Stiki ehf, data warehouse company; Italy: Italy are obtained from the Umbria region; Michigan, United States: Nursing home: from Michigan MDS 2.0 – the federally mandated assessment instrument for nursing homes – for 10/1/09 – 9/30/10); Home care: Michigan Home- and Community-Based Waiver interRAI HC data – the State-run community-based home care program (MI CHOICE) for persons in need of care at the nursing home level (Calendar year 2010); Hong Kong, China: RAI-HK HC data, SWD Elderly Services, HK SAR Government.
Table 3.A1.3. Scales/Physical impairment, cognitive impairment, severity of depressive symptoms and severity of pain in nursing home (NH) and home (community) care (HC) populations (cont.)

136
I.3. U
SING
INT
ERR
AI A
SSESSMEN
T SY
STEM
S TO
MEA
SUR
E AN
D M
AIN
TAIN
QU
ALIT
Y O
F LON
G-T
ERM
CA
RE
A G
OO
D LIFE IN
OLD
AG
E? MO
NIT
OR
ING
AN
D IM
PRO
VIN
G Q
UA
LITY
IN LO
NG
-TER
M C
AR
E © O
ECD
/EUR
OPEA
N C
OM
MISSIO
N 2013
Table 3.A1.4. Casemix/Distribution of populations in nursing home (NH) and home (community) care (HC) populations by the clinical groups of the Resource Utilisation Groups (RUGs) resource use casemix system
RUG-III hierarchical groups1
Ontario, Canada
Michigan, United States
Iceland FinlandUnited
KingdomBelgium Italy
Hong Kong, China
New Zealand
NH HC NH HC NH HC NH HC NH HC NH HC NH HC NH HC NH HC
(N=90 115) (N=152 558) (N=83 893) (N=14 621) (N=2 307) (N=) (N=5 699) (N=13 041) (N=481) (N=250) (N=765) (N=3 661) (N=2 417) (N=3 016) (N=103 001) (N=) (N=11 163)
% % % % % % % % % % % % % % % % % %
Rehabilitation 15.0 3.7 65.0 9.6 19.2 – 2.6 1.8 1.6 1.0 43.5 – 0.0 1.1 17.0 4.7 – 6.7
Extensive services 1.6 0.7 4.0 2.2 3.2 – 1.1 0.3 0.0 0.7 1.0 – 10.8 11.4 0.1 0.0 – 0.4
Special care 9.0 1.6 3.5 5.3 9.8 – 8.0 4.4 10.3 1.0 5.5 – 21.1 8.9 1.8 0.7 – 1.0
Clinically complex 16.5 22.0 9.4 44.5 19.5 – 16.9 1.4 20.7 31.1 11.5 – 20.1 32.5 21.7 40.1 – 18.8
Impaired cognition 10.8 7.3 4.4 8.3 13.5 – 16.3 20.4 6.6 4.8 13.5 – 9.6 2.8 8.5 1.1 – 19.4
Behaviour problems 2.8 1.2 0.1 0.9 1.6 – 2.8 6.3 2.7 1.7 2.0 – 2.0 0.4 0.4 6.7 – 0.7
Physical function reduced 44.3 63.5 13.6 28.9 33.1 – 52.2 55.4 57.8 59.5 23.0 – 36.3 42.9 50.5 46.6 – 53.2
1. Group: Outline of the clinical criteria for each group.Rehabilitation group: Those receiving rehabilitation servicesExtensive services: Physically dependent and requiring high intensity services parenteral feeding, suctioning, tracheostomy, ventilator/respirator.Special care: Physically dependent and with clinical conditions associated with high nursing care input.Clinically complex: Presence of clinical conditions that are associated with medical conditions.Impaired cognition: Intermediate physical impairment and significant cognitive impairment.Behaviour problems: Intermediate physical impairment and disruptive behavioural symptoms.Physical function reduced: Those who do not match any of the above criteria.For full explanation of the RUGs Casemix system see: Fries, B.E., D.P. Schneider, W.J. Foley, M. Gavazzi, R. Burke and E. Cornelius (1994), “Refining a Case-mix Measure for Nursing Homes: Resource Utilisation Groups RUG-III”, Medical Care, Vol. 32, pp. 668-685.Carpenter, G.I., A. Main and G. Turner (1995), “Case Mix for the Elderly In-patient. Resource Utilisation Groups (RUGs) Validation Project”, Age and Ageing, Vol. 24, pp. 513.Carpenter, G.I., N. Ikegami, G. Ljunngren, E. Carrillo and B.E. Fries (1997), “RUG-III and Resource Allocation: Comparing the Relationship of Direct Care Time with Patient Characteristics in Five Countries”, Age and Ageing, Vol. 26-S2, pp. 61-65.Bjorkgren, M.A., B.E. Fries, A. Arbor and L.R. Shugarman (2000), “A RUG-III Casemix System for Home Care”, Canadian Journal on Aging, Vol. 19, Suppl. No. 2, pp. 106-125.This table offers a demonstration of potential for cross-national comparisons using data from the interRAI assessment system in nine OECD and non-OECD countries.
Source: New Zealand: National New Zealand interRAI Software Service (on behalf of New Zealand District Health Boards); Belgium: BelRAI-data, Federal Public Service Health, Food chain safety and Environment; Iceland: The Icelandic data is on all skilled NH´s in Iceland from a national data base on NH care, as per MDS 2.0. The supervisor of the data base is the Director General for Health in Iceland and the data base is maintained by Stiki ehf, data warehouse company; Italy: Italy are obtained from the Umbria region; Michigan, United States: Nursing home: from Michigan MDS 2.0 – the federally mandated assessment instrument for nursing homes – for 10/1/09 – 9/30/10); Home care: Michigan Home- and Community-Based Waiver interRAI HC data – the State-run community-based home care program (MI CHOICE) for persons in need of care at the nursing home level (Calendar year 2010); Hong Kong, China: RAI-HK HC data, SWD Elderly Services, HK SAR Government.

137
I.3. U
SING
INT
ERR
AI A
SSESSMEN
T SY
STEM
S TO
MEA
SUR
E AN
D M
AIN
TAIN
QU
ALIT
Y O
F LON
G-T
ERM
CA
RE
A G
OO
D LIFE IN
OLD
AG
E? MO
NIT
OR
ING
AN
D IM
PRO
VIN
G Q
UA
LITY
IN LO
NG
-TER
M C
AR
E © O
ECD
/EUR
OPEA
N C
OM
MISSIO
N 2013
Table 3.A1.5. Casemix/Prevalence of clinical and social indicators by physical and cognitively impaired sub-groups in nursing home (NH) and home (community) care (HC) populations
Sub-groups1 Characteristic
Ontario, Canada
Michigan, United States
FinlandUnited
KingdomBelgium Italy
Hong Kong, China
New Zealand
NH HC NH HC NH HC NH HC NH HC NH HC NH HC NH HC
(N=90 115) (N=152 558) (N=83 893) (N=14 621) (N=5 699) (N=13 041) (N=481) (N=250) (N=765) (N=4 070) (N=3 661) (N=2 417) (N=3 016) (N=103 001) (N=) (N=11 163)
% % % % % % % % % % % % % % % %
Good physical condition/Good cognition(ADLH 0-1/CPS 0-1)
% (N) in this sub- population
8.3 (6,210) 50.2 (76,636) 3.6 (2,985) 32.2 (4714) 3.5 (202) 49.2 (6416) 7.3 (35) 58.1 (168) 8.9 (68) 24.0 (975) 5.8 (213) 11.3 (272) 36.3 (1096) 38.7 (39881) – 46.9 (5222)
Uncontrolled pain 20.7 17.5 34.3 11.5 19.5 0 19 10.8 11.8 1.9 5.1 12.2 9.6 – 16.5
Falls (any in past 90 days) 16.5 26.6 11.6 21 5.5 21.3 14.3 31 11.3 30.3 9.4 8.4 9.3 29.1 – 27.7
Any use of trunk restraint/chair prevents rising
0 n.a. 0 n.a. 0 n.a. 0 n.a. 0.1 n.a. 2.8 n.a. 0.2 n.a. – n.a.
Bladder incontinence daily or more freq.
9.4 10.2 1.7 28.6 13.9 12.9 17.1 15.5 25.9 21.38 7 9.5 1.1 1 – 17.6
Pressure ulcers (any > grade 1)
1.1 1.7 2.7 2 1.5 2 0 2.4 4.7 2.2 0.5 4 0.3 0.4 – 0.9
No flu shot in past year n.a. 27.1 n.a. 22.1 n.a. 34.1 25.7 19 7.8 23.6 17.8 16.4 – 44.2 – 23.6
Lonely n.a. 13.7 n.a. 18.7 n.a. 24.2 8.6 36.3 26.5 37.1 15 15 – 28.8 – 19.4
Depression (DRS > 2) 15.7 12.4 5.3 9.3 21.3 11.9 17.1 20.2 20.2 24.9 26.8 19.3 2.1 8.1 – n/a
Poor physical condition/Good cognition (ADLH 2+/CPS 0-1)
% (N) in this sub- population
17.9 (13,418) 10.9 (16,608) 40.7 (34,177) 21.7 (3171) 10.1 (574) 5.6% (726) 27.7 (133) 14.5 (42) 21.2 (162) 34.8 (1417) 19.6 (717) 28.8 (696) 14.0 (421) 9.2 (9460) – 8.2 (916)
Uncontrolled pain 25.5 21.5 39 13 25.3 27.1 4.5 33.3 14.5 9.6 3.5 8.8 18.5 10.7 – 17
Falls (any in past 90 days) 21.4 35.2 11.9 24.4 8 26.9 5.3 23.8 32.1 36.6 29.1 16.8 11.9 37.1 – 33.2
Any use of trunk restraint/chair prevents rising
5 n.a. 0.2 n.a. 9.2 n.a. 0 n.a. 8.2 n.a. 5.3 n.a. 19.2 n.a. – n.a.
Bladder Incontinence daily or more freq.
52 22 15.1 43.7 62.7 37.3 64.7 11.9 41.18 30.52 41 31.2 39.9 0.9 – 32.4
Pressure ulcers (any > grade 1)
6.8 5.2 11.1 9 4.7 5.9 6 7.1 7.1 2.9 9.5 16.7 2.9 6.1 – 4
No flu shot in past year n.a. 31.7 n.a. 30.6 n.a. 36.8 29.3 33.3 10.3 17.8 12.4 14.2 – 45.6 – 32.2
Lonely n.a. 11.1 n.a. 17.8 n.a. 19.2 21.8 28.6 35.1 29.6 11.2 10.8 – 27.5 – 15
Depression (DRS > 2) 28.3 18.3 5.8 12.7 29.6 19 30.8 23.8 27.5 22.8 32.6 30 3.6 7.3 – n/a
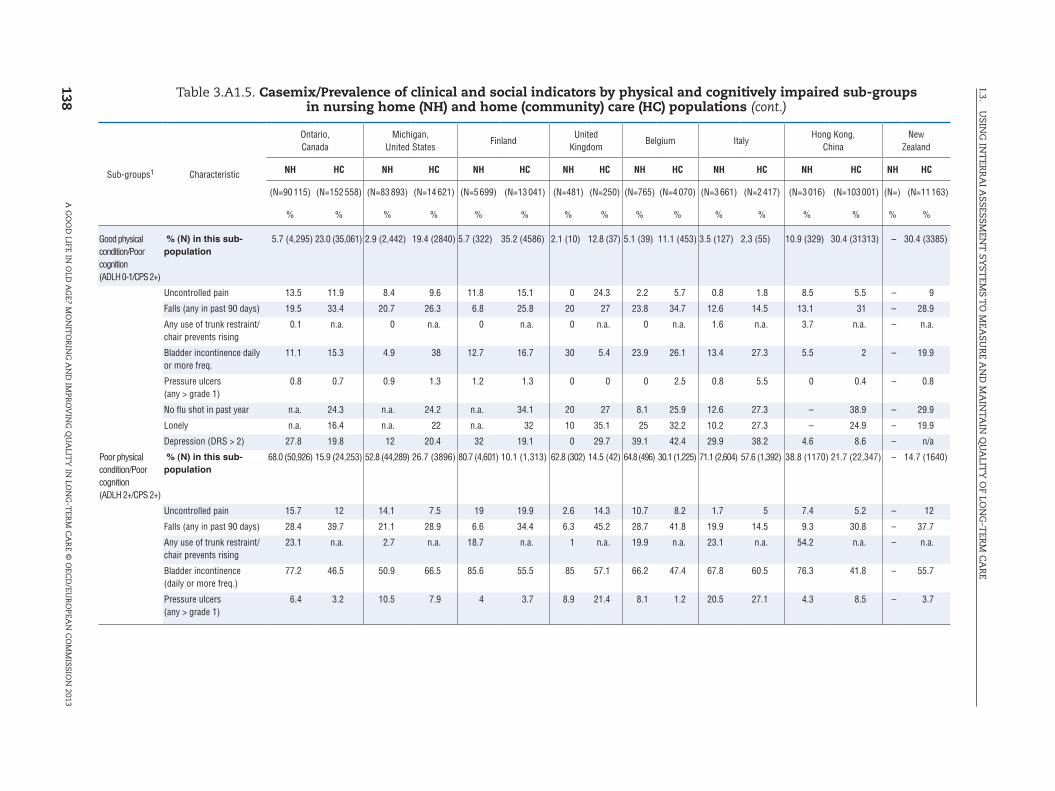
138
I.3. U
SING
INT
ERR
AI A
SSESSMEN
T SY
STEM
S TO
MEA
SUR
E AN
D M
AIN
TAIN
QU
ALIT
Y O
F LON
G-T
ERM
CA
RE
A G
OO
D LIFE IN
OLD
AG
E? MO
NIT
OR
ING
AN
D IM
PRO
VIN
G Q
UA
LITY
IN LO
NG
-TER
M C
AR
E © O
ECD
/EUR
OPEA
N C
OM
MISSIO
N 2013
Sub-groups1 Characteristic
Ontario, Canada
Michigan, United States
FinlandUnited
KingdomBelgium Italy
Hong Kong, China
New Zealand
NH HC NH HC NH HC NH HC NH HC NH HC NH HC NH HC
(N=90 115) (N=152 558) (N=83 893) (N=14 621) (N=5 699) (N=13 041) (N=481) (N=250) (N=765) (N=4 070) (N=3 661) (N=2 417) (N=3 016) (N=103 001) (N=) (N=11 163)
% % % % % % % % % % % % % % % %
Good physical condition/Poor cognition(ADLH 0-1/CPS 2+)
% (N) in this sub- population
5.7 (4,295) 23.0 (35,061) 2.9 (2,442) 19.4 (2840) 5.7 (322) 35.2 (4586) 2.1 (10) 12.8 (37) 5.1 (39) 11.1 (453) 3.5 (127) 2,3 (55) 10.9 (329) 30.4 (31313) – 30.4 (3385)
Uncontrolled pain 13.5 11.9 8.4 9.6 11.8 15.1 0 24.3 2.2 5.7 0.8 1.8 8.5 5.5 – 9
Falls (any in past 90 days) 19.5 33.4 20.7 26.3 6.8 25.8 20 27 23.8 34.7 12.6 14.5 13.1 31 – 28.9
Any use of trunk restraint/chair prevents rising
0.1 n.a. 0 n.a. 0 n.a. 0 n.a. 0 n.a. 1.6 n.a. 3.7 n.a. – n.a.
Bladder incontinence daily or more freq.
11.1 15.3 4.9 38 12.7 16.7 30 5.4 23.9 26.1 13.4 27.3 5.5 2 – 19.9
Pressure ulcers (any > grade 1)
0.8 0.7 0.9 1.3 1.2 1.3 0 0 0 2.5 0.8 5.5 0 0.4 – 0.8
No flu shot in past year n.a. 24.3 n.a. 24.2 n.a. 34.1 20 27 8.1 25.9 12.6 27.3 – 38.9 – 29.9
Lonely n.a. 16.4 n.a. 22 n.a. 32 10 35.1 25 32.2 10.2 27.3 – 24.9 – 19.9
Depression (DRS > 2) 27.8 19.8 12 20.4 32 19.1 0 29.7 39.1 42.4 29.9 38.2 4.6 8.6 – n/a
Poor physical condition/Poor cognition(ADLH 2+/CPS 2+)
% (N) in this sub- population
68.0 (50,926) 15.9 (24,253) 52.8 (44,289) 26.7 (3896) 80.7 (4,601) 10.1 (1,313) 62.8 (302) 14.5 (42) 64.8 (496) 30.1 (1,225) 71.1 (2,604) 57.6 (1,392) 38.8 (1170) 21.7 (22,347) – 14.7 (1640)
Uncontrolled pain 15.7 12 14.1 7.5 19 19.9 2.6 14.3 10.7 8.2 1.7 5 7.4 5.2 – 12
Falls (any in past 90 days) 28.4 39.7 21.1 28.9 6.6 34.4 6.3 45.2 28.7 41.8 19.9 14.5 9.3 30.8 – 37.7
Any use of trunk restraint/chair prevents rising
23.1 n.a. 2.7 n.a. 18.7 n.a. 1 n.a. 19.9 n.a. 23.1 n.a. 54.2 n.a. – n.a.
Bladder incontinence (daily or more freq.)
77.2 46.5 50.9 66.5 85.6 55.5 85 57.1 66.2 47.4 67.8 60.5 76.3 41.8 – 55.7
Pressure ulcers (any > grade 1)
6.4 3.2 10.5 7.9 4 3.7 8.9 21.4 8.1 1.2 20.5 27.1 4.3 8.5 – 3.7
Table 3.A1.5. Casemix/Prevalence of clinical and social indicators by physical and cognitively impaired sub-groups in nursing home (NH) and home (community) care (HC) populations (cont.)

139
I.3. U
SING
INT
ERR
AI A
SSESSMEN
T SY
STEM
S TO
MEA
SUR
E AN
D M
AIN
TAIN
QU
ALIT
Y O
F LON
G-T
ERM
CA
RE
A G
OO
D LIFE IN
OLD
AG
E? MO
NIT
OR
ING
AN
D IM
PRO
VIN
G Q
UA
LITY
IN LO
NG
-TER
M C
AR
E © O
ECD
/EUR
OPEA
N C
OM
MISSIO
N 2013
Sub-groups1 Characteristic
Ontario, Canada
Michigan, United States
FinlandUnited
KingdomBelgium Italy
Hong Kong, China
New Zealand
NH HC NH HC NH HC NH HC NH HC NH HC NH HC NH HC
(N=90 115) (N=152 558) (N=83 893) (N=14 621) (N=5 699) (N=13 041) (N=481) (N=250) (N=765) (N=4 070) (N=3 661) (N=2 417) (N=3 016) (N=103 001) (N=) (N=11 163)
% % % % % % % % % % % % % % % %
No flu shot in past year n.a. 27 n.a. 26.4 – 29.2 20.9 26.2 7.6 21.2 12.6 11.8 – 50.1 – 33.3
Lonely n.a. 9.4 n.a. 15.3 – 27 15 14.3 29.8 28.6 9.3 10.1 – 17.3 – 11.2
Depression (DRS >2) 34.5 22 11.3 21.2 31.4 25.9 35 26.2 44 36.7 35.1 31.5 3.9 5.2 – n/a
1. Sub-groups are created by dividing the population into physical function groups – good (ADL Hierarchy score of 0-1) or poor (ADL Hierarchy score ≥ 2), and cognitive function groups – good (interRAI Cognitive Performance Score 0-1) or poor (interRAI Cognitive Performance Score ≥ 2), and combining them to give four distinct sub-groups. The ADL hierarchy groups activities of daily living according to the stage of the disablement process in which they occur. The ADL hierarchy ranges from 0 (no impairment) to 6 (total dependence) (www.interai.org/asets/files/scales/ADLhierarchy.pdf).Cognitive performance scale: Combines information on memory impairment, level of consciousness, and executive function, with scores ranging from 0 (intact) to 6 (very severe impairment). Scores of 3 or greater indicate likely presence of dementia (www.interrai.org/assets/files/Scales/Cognitive Performance Scale.pdf). This table offers a demonstration of potential for cross-national comparisons using data from the interRAI assessment system in nine OECD and non-OECD countries.
Source: New Zealand: National New Zealand interRAI Software Service (on behalf of New Zealand District Health Boards); Belgium: BelRAI-data, Federal Public Service Health, Food chain safety and Environment; Iceland: The Icelandic data is on all skilled NH´s in Iceland from a national data base on NH care, as per MDS 2.0. The supervisor of the data base is the Director General for Health in Iceland and the data base is maintained by Stiki ehf, data warehouse company; Italy: Italy are obtained from the Umbria region; Michigan, United States: Nursing home: from Michigan MDS 2.0 – the federally mandated assessment instrument for nursing homes – for 10/1/09 – 9/30/10); Home care: Michigan Home- and Community-Based Waiver interRAI HC data – the State-run community-based home care program (MI CHOICE) for persons in need of care at the nursing home level (Calendar year 2010); Hong Kong, China: RAI-HK HC data, SWD Elderly Services, HK SAR Government.
Table 3.A1.5. Casemix/Prevalence of clinical and social indicators by physical and cognitively impaired sub-groups in nursing home (NH) and home (community) care (HC) populations (cont.)


