Embed Size (px)
Citation preview
Using Indicators for Technology Monitoring Steps toward a proposed framework Master of Science Thesis in the Master Degree Programme, Business Design
ANNIKA NYBERG SEBASTIAN PALMGREN Department of Technology Management and Economics Division of Management of Organizational Renewal and Entrepreneurship – MORE
CHALMERS UNIVERSITY OF TECHNOLOGY Göteborg, Sweden, 2011 Report No. E 2011:058
i
Using indicators for technology monitoring
‐Steps toward a proposed framework
ANNIKA NYBERG
SEBASTIAN PALMGREN
©ANNIKA NYBERG & SEBASTIAN PALMGREN, 2011
Division of Management of Organizational Renewal and Entrepreneurship ‐ MORE
Department of Technology Management and Economics
Chalmers University of Technology
SE – 412 96 Göteborg
Sweden
ii
Abstract Many companies are experiencing an increased need to manage the complexity surrounding the
process of technology management. This need is largely driven by the fact that products and services
in most technology‐intensive industries increasingly incorporate technologies beyond the traditional
core capabilities of the firms. This increases the necessity for firms to keep track of external
technology development through technology intelligence efforts. However, every business day, there
are more than 5000 new patents issued worldwide and 3700 scientific papers are published, which
carries potentially important information about technological trends. These increasing quantities
make it impractical to, as traditionally done, manually read and keep track of all developments.
Consequently, there is a need for a more structured way of monitoring external technologies.
Since most contemporary literature focus on tools, processes and organization of technology
intelligence we argue that this thesis, focusing on the use of indicators and how to analyze
technology, adds to the understanding of how one should conduct monitoring. The stated purpose of
this thesis is to investigate how technology indicators can be used to systematically monitor
developments in a given technology field, and propose steps toward an applicable framework.
The proposed framework makes up the synthesis of the thesis by providing guidelines and tools for
how to conduct monitoring activities. The basis for the proposed framework was established from
extensive theory on technology intelligence but also theory from other disciplines together with
interviews performed in a small scale case study conducted with large technology intensive Swedish
company.
The proposed framework consists of six parts which we argue are essential for a well‐functioning
indicator monitoring process; How to assess a technology, Defining what to monitor, Using indicators
for monitoring and analysis of the technology, How to communicate the technology intelligence
information and lastly Putting the framework into the company context. The framework was applied
in two pilot studies which both proved the applicability of the framework together and gave us
further operative knowledge about how it could be used in a real context.
We conclude that, compared to the ad hoc way of monitoring done in the organizations analyzed in
this thesis, our proposed framework provide objective information that is easy to use. In addition,
using a structured approach bring several advantages with some of the most important ones being:
improved early warning of global developments and trends within technology fields, better,
understanding external organizations positions and opportunities for technical collaboration with
those and to feed intelligence to the company’s strategic R&D agenda.
However, the framework does not in any way completely satisfy the technology intelligence need in
a company but should be seen as one initiative among others. The technology indicators generate a
good overall picture of the technology, where to focus further search but do not provide any specific
details about developments. We propose that our framework should be complemented by network
based intelligence, where experts in a company have the role to monitor developments in their
technology fields with help from external networks.
For further research we suggest quantitative evaluations of the indicators presented in the thesis by
measuring indicators versus real development but also how a company could use IT systems to deal
with the large information loads on a daily basis.
iii
Preface and Acknowledgments This thesis is a result of an internship that was performed at Volvo Technology AB (VTEC),
Gothenburg, during the spring of 2011. We are very happy and grateful for the opportunity to work
for VTEC as a basis for this master thesis, and there are many people we wish to thank for helping us
making this thesis possible.
In parallel, we performed an internship at CIP Professional Services who are thought and practice
leaders in intellectual asset management and intellectual property strategy. Some of the tools
regarding hierarchical representation of technologies were inspired by their work and to which we
are grateful.
First of all, we would like to express our appreciation to all the employees at VTEC that contributed
and supported us during the path of our research. We would express a special thanks to our
supervisors, Hans Persson, Michael Balthasar and Daniel Lexen, for entrusting us with this
assignment which has been enjoyable, stimulating and very developing for both of us. Hans and
Michael have contributed with difficult questions, challenging our work, and Daniel has been our
closest partner in the development of the framework. We would also like to thank Anna‐Karin
Sanderöd, at the Intelligence group who has been a tremendous help for us in the search for patent
and publication information. We would also like to show our appreciation to the many people
working at the VTEC who took their time for interviews and for supporting our work in other ways.
We would also like to thank the people from the companies participating in our small scale case
study. Without hesitation they invited us to visit them and presented for us how they work with
technology intelligence. The input from those three companies has been very useful for this thesis.
On the academic side we would like to thank our supervisor, Jonas Lindgren at the Institute for
Innovation and Entrepreneurship, for not letting us “burn around” too much. Jonas has continuously,
throughout the thesis work, challenged our thinking and writing in a constructive way, and steered us
in the right direction. We would also like to thank Dr. Magnus Eriksson who has overseen the
research process and given us guidance in the research work.
Last but not least, we would like to show our gratitude to all our friends and family that have been
extremely supportive during the entire period of the thesis work.
Lindholmen, Göteborg, May 22th, 2011
‐‐‐‐‐‐‐‐‐‐‐‐‐‐‐‐‐‐‐‐‐‐‐‐‐‐‐‐‐‐‐‐‐‐‐‐‐‐‐‐‐‐‐‐‐ ‐‐‐‐‐‐‐‐‐‐‐‐‐‐‐‐‐‐‐‐‐‐‐‐‐‐‐‐‐‐‐‐‐‐‐‐‐‐‐‐‐‐‐‐‐‐‐‐
Annika Nyberg Sebastian Palmgren
4
Table of Contents 1 Introduction ..................................................................................................................................... 9
1.1 Motives and Background ......................................................................................................... 9
1.2 Purpose .................................................................................................................................. 11
1.3 Problem Analysis and Research Questions ........................................................................... 11
1.4 Delimitations ......................................................................................................................... 13
1.5 Disposition of the Thesis and Reading Directions ................................................................. 14
2 Methodology ................................................................................................................................. 16
2.1 Research Method .................................................................................................................. 16
2.2 Reserach Procedure .............................................................................................................. 17
2.3 Data Collection ...................................................................................................................... 20
2.4 Data Analysis ......................................................................................................................... 21
2.5 Quality of Research ............................................................................................................... 22
3 Theoretical Framework ................................................................................................................. 24
3.1 Monitoring of External Technologies .................................................................................... 24
3.2 Defining a Technology and Technological Development ...................................................... 28
3.3 Technology Assessment ........................................................................................................ 34
3.4 Technology Indicators ........................................................................................................... 41
3.5 Communicating Indication Monitoring ................................................................................. 47
4 Small Scale Case Studies ................................................................................................................ 51
4.1 Company A ............................................................................................................................ 51
4.2 Company B ............................................................................................................................. 54
4.3 Company C ............................................................................................................................. 57
5 Proposed Framework for Target Technology Intelligence ............................................................ 61
5.1 The Situation of Volvo Technology ........................................................................................ 61
5.2 Overview of the Framework .................................................................................................. 62
5.3 Defining What to Monitor ..................................................................................................... 62
5.4 How to Assess a Technology ................................................................................................. 66
5.5 Using Indicators for Monitoring and Analysis of the Technology ......................................... 68
5.6 How to Communicate the Technology Intelligence Information .......................................... 79
5.7 Putting the Framework into the Company Context .............................................................. 81
6 Observations and Discussion ......................................................................................................... 84
6.1 General Discussion ................................................................................................................ 84
5
6.2 Pilot Projects .......................................................................................................................... 85
6.3 Discussion in Relation to the Research Questions ................................................................ 85
7 Final Conclusions ........................................................................................................................... 89
7.1 Generalization and Applicability of our Framework ............................................................. 89
7.2 Final Words ............................................................................................................................ 89
7.3 Suggestions for Further Research ......................................................................................... 90
8 Bibliography ................................................................................................................................... 91
9 Appendix 1 – Interview Template for Small Scale Case Studies .................................................... 96
6
List of Figures Figure 1: The scope of the thesis explained by the technology intelligence system modes ................ 13
Figure 2: Graphical overview of the research procedure used in this thesis ........................................ 18
Figure 3: Perspectives of technology intelligence ................................................................................. 26
Figure 4: Monitoring is a task subsequent to scanning for new technologies ...................................... 26
Figure 5: Foster’s S‐curves showing competing technologies, each with its own S‐curve ................... 28
Figure 6: A technology is mainly driven by developments in sub‐technologies ................................... 29
Figure 7: The principles of a Technology tree ....................................................................................... 30
Figure 8: Radical innovation from a Technology tree perspective ........................................................ 32
Figure 9: Modular innovation from a Technology tree perspective ..................................................... 32
Figure 10: Architectural innovation from a technology tree perspective ............................................. 33
Figure 11: Incremental innovation from a technology tree perspective .............................................. 33
Figure 12: An example of how a technology application could be assessed ........................................ 34
Figure 13: Illustration of how the different parameters could be linked .............................................. 37
Figure 14: The links between technology roadmapping and technology intelligence ......................... 39
Figure 15: Linking technology monitoring to the technology roadmap process .................................. 39
Figure 16: Evolvement of technological activities over the life cycle ................................................... 40
Figure 17: Watts and Porter’s framework for technology indicators ................................................... 43
Figure 18: Grupp’s framework for technology indicators ..................................................................... 44
Figure 19: Chang’s Technology‐Indicator‐Ontology .............................................................................. 45
Figure 20: Technology signals vary over the technology lifecycle ........................................................ 46
Figure 21: An example of a Technology Radar Screen .......................................................................... 49
Figure 22: An example of knowledge map ............................................................................................ 49
Figure 23: Example of a Technology tree for communicative purposes ............................................... 50
Figure 24: Organization of Company A's technology intelligence ......................................................... 52
Figure 25: One type of technology intelligence graphs generated from Company A's semantics tool 53
Figure 26: Organization of Company B's technology intelligence ......................................................... 55
Figure 27: General process for technology intelligence at Company C ................................................ 57
Figure 28: Organization of Company C's technology intelligence ......................................................... 58
Figure 29: Monitoring of external technologies at Company C ............................................................ 59
Figure 30: Company C's Technology Radar ........................................................................................... 60
Figure 31: From industry silos to industry convergence ....................................................................... 61
Figure 32: Overview of the proposed framework ................................................................................. 62
Figure 34: The top level sets the width and the depth of the monitoring activities ............................. 64
Figure 33: Building a technology watch‐list (product platform focus) .................................................. 68
Figure 35: Proposed framework for technology indicators .................................................................. 69
Figure 36: Defining the position on the S‐curve by patent analysis ...................................................... 71
Figure 37: Reference scheme for classifying scientifico‐technical progress in market formation ....... 72
Figure 38: A matrix for evaluation of technology indicators ................................................................. 77
Figure 39: The top‐down versus the bottom‐up approach in allocating information .......................... 78
Figure 40: Comparison of development activity and key actors using a technology tree .................... 79
Figure 41: Tool for deciding the company relevance for the technology radar screen ........................ 80
Figure 42: Extracting technology radar screen from the technology tree ............................................ 81
Figure 43: Proposed organization for technology intelligence at VTEC ................................................ 82
Figure 44: Company culture and decision‐making style as drivers of intelligence approaches ........... 83
7
List of Tables Table 1: Key analytical parameters for the TEA .................................................................................... 35
Table 2: Finding application areas where the performance and cost parameters are valued ............. 36
Table 3: Extract from Watts & Porter's framework for technology indicators ..................................... 43
Table 4: Overview of the technology intelligence reports delivered within Company B ...................... 56
Table 5: Overview of the 16 technology indicators in the framework .................................................. 71
8
Glossary Technology intelligence The management process that provides a
company with the capability to capture and deliver the information to develop an awareness of technology threats and opportunities
Technology monitoring A systematic way of characterizing and following technology trends for technologies that are already known to a company
Technology indicators Features or values that can characterize and evaluate technologies
Technology forecasting Anticipating possible future development paths for particular technologies
Technology roadmap A plan for the technology portfolio of a company that matches short‐term and long‐term goals with specific technology solutions to help meet those goals
Technology tree A hierarchical presentation of a technological system
9
1 Introduction The introduction begins with the background in section 1.1 which describes why the particular area of
technology intelligence and technology monitoring is interesting for Volvo Technology and why it is
generally important for technology‐intensive companies to monitor technology developments in its
surroundings. This lays the ground for the purpose of this master thesis in section 1.2 followed by a
thorough analysis of the actual problems that need to be answered throughout the study found in
section 1.3. Hereafter follows the delimitations in section 1.4 and in order to guide the reader through
this thesis, a few reading directions are presented in section 1.5.
1.1 Motives and Background It is nowadays obvious that a company could face severe problems if it fails to keep up with
developments of its products and technologies, following the technological change in its industry.
Firms that do not manage to anticipate the impact of new technologies will likely struggle to
maintain their market position in the changing market. In fact, it is widely accepted that companies
that don’t innovate eventually die (Chesbrough, 2003). Keeping up with the technological change is
further complicated by the trends of increased global competition and shortened product life cycles.
It is therefore not wrong to conclude that today, more than ever, innovation is a key to company
growth, profitability and sustainability which makes management of the innovation process a crucial
success factor.
Another important aspect that can’t be neglected when discussing innovation processes is the
concept of open innovation. Partly due to mentioned globalization and shortened life cycles but also
due to merging technology areas, it becomes increasingly difficult for high‐tech companies to source
and develop all relevant technologies within the company boarders. Obviously, this increases the
pressure on the company’s capability to develop an awareness of technology threats and
opportunities in its technological surrounding.
Therefore, the management of internal, but also external, technological change in companies is of
high interest in both practice and theory (Lichtenthaler, 2004). To ensure a solid and sustainable
technological base that also withstands rapidly changing market requirements, it is advisable for a
firm to have an early focus on high‐potential, future technologies (Schuh & Grawatsch, Triz‐based
Technology Intelligence, 2004). Hence, smart organizations should not wait for changes to happen in
the technological environment but actively monitor and create competitive advantages of changing
environments and new innovations (Veugelers, Bury, & Viaene, 2010).
The observations made about current and future technology trends in time, and the translation of
that information into its impact on the business of a company, is fundamental for the effectiveness of
technology management and strategic planning (Lichtenthaler, 2004; Lang & Mueller, 1997).
Therefore, technology intelligence is one of the core processes of technology management, which
involves acquisition, assessment and communication of relevant information on technological trends
to support technological and other strategic decisions of a company (Lichtenthaler, 2006). In this
thesis we will define technology intelligence according to Mortara et al.: “technology intelligence is
the management process that provides a company with the capability to capture and deliver the
information to develop an awareness of technology threats and opportunities” (Mortara, Kerr, Phaal,
& Probert, 2009, p. 323).
10
As the goal of technology intelligence is to exploit potential opportunities and to discover potential
threats in time, technology intelligence includes early identification and understanding of
breakthroughs in science, technology trends, and changes in the technological bases of suppliers and
customers. It also involves the observation and analysis of universities and start‐up companies where
much of new technology is invented (Lichtenthaler, 2006). Actions responding to these
developments could create sustainable long‐term competitive advantages (Brenner, 1996).
What is problematic for the development of such awareness of threats and opportunities is the
already huge and exploding volume of available and potential relevant information such as patents,
scientific articles, and other publications (Chang, 2008) . Every business day there are at least 3,700
new research papers published and at least 5,000 new patent documents issued worldwide (Björk,
Roos, & Lauri, 2009; WIPO, 2010). Those documents include knowledge that is driving the sales,
profits, and growth of technology‐based companies (Narin, 1993). However, the key to successful
technology intelligence is not to have large volumes of data available, but to transfer important
knowledge based on the right data and information to decision makers (Mortara, Kerr, Probert, &
Phaal, 2007). Hence, companies is in need of an efficient way of sorting out relevant information and
trends to monitor important aspect of external technologies, in order to manage this enormous
complexity in technology management in order to gain a competitive advantage.
This master thesis has been conducted as a case study at Volvo Technology AB, hereafter named
VTEC. VTEC is a fully owned subsidiary of the Volvo Group with the purpose of serving and
developing technology for the Volvo group companies, especially focusing on the long term
technology needs and to develop a lead in future technology areas of high importance to the Volvo
Group. The company’s business model is mainly based on a contract R&D model in which it charges
its customers, even though they are internal, on a project basis for new technologies, new products
and new business concepts. However, it also participates in international projects with universities,
research institutes and other companies where the aim is rather to develop a certain technology that
could later be sold internally within Volvo Group.
The company is structured according to six different technology areas which aim to cover the main
strategic interests of Volvo Group. Apart from developing technologies and employing experts in said
areas, VTEC also hosts a number of centralized functions of which the most important ones are
Patents, Standardization and Business Intelligence.
VTEC owns the main responsibility for technology intelligence within the Volvo Group, and similarly
to what is described above on a general level, it is experiencing an increased need to manage the
complexity surrounding the process of technology intelligence. This need is largely driven by the fact
that automotive products and services increasingly incorporate technologies beyond the traditional
core technologies of the automotive actors, and thus the current intelligence organization based on
experts in core technology areas is becoming less effective. Hence, VTEC has realized that it needs to
expand its efforts within technology intelligence, with focus on finding out more on technologies that
are identified as having potential to become either a threat or a possibility for Volvo’s business.
More specifically, VTEC is in need of an approach to systematically monitor technologies that are
identified as potentially relevant for Volvo’s business in order to take informed decisions on when
and how to invest in said technology.
11
In the initial literature studies of this project we realized that the concept of technology indicators is
a powerful way of translating information into meaningful knowledge. Technology indicators could
be defined as features or values that can characterize and evaluate technologies (Chang, 2008).
However, little research is devoted to these kind of overall approaches to technology intelligence and
specifically guidelines of how to navigate the wide set of technology indicators to monitor technology
developments in a systematic way.
1.2 Purpose Based on the background described above, describing the challenges within industry and for VTEC to
manage the challenges relating to technological change, but also the lack of academic literature
describing how to manage this challenge in a systematic way, we have chosen to focus our study on
the field of technology indicators and how these indicators could be used to effectively work with
technology intelligence.
Hence, the purpose of this master thesis is to:
Investigate how technology indicators can be used to systematically monitor developments in a given
technology field, and propose steps toward an applicable framework.
Our ambition is that the framework should enable a smart and structured approach for a company or
organization to work with how to monitor technologies which are already known to a company, but
where there is a need to get an overview of the technological maturity and the market prospects of
the technology and to see where monitoring efforts should be focused.
1.3 Problem Analysis and Research Questions In order to be able to grasp the fairly general nature of the purpose, breaking down the problem into
four sub‐questions will help envision what is needed to fulfill the purpose. Accordingly, following the
stated purpose, the research questions of this thesis are presented below.
1.3.1 Research Question 1 Definition of What to Monitor In contrast to in the industrial economy, where products was a result of a linear material value
chains, the deconstruction of a product in the intellectualized economy, e.g. a technology, offers an
increased complexity due to its intangible nature, which adds even more to the complexity inherent
in technology management described in the background (Petrusson, 2004). In order to bring the
complexity to a manageable level, a frame for analysis that enables consistent analysis of technology
characteristics on many levels is needed. This is especially true in the technology intelligence process
where an understanding of the dynamic relationships between different technology fields and its
context is required.
As we see it, a fundamental element for technology monitoring is the definition of technology and
technological development. If a technology is not properly defined, it is difficult to conduct any
relevant analysis as one would for example not know for certain if a certain invention falls within or
outside the scope of the technology. Most intelligence literature do not recognize the importance of
actually defining what it is one is monitoring, i.e. how a technology is defined, but in order to get into
depth with how to analyze technologies we see it as something that deserves some attention.
Therefore our first research question is:
12
1. How could one define what to monitor?
1.3.2 Research Question 2 – Technology Assessment Once the object to monitor could be defined properly, one needs to define what it should be
assessed in relation to. This is because it is important for a company to have a strategy for why and
how the technology development should be monitored and how the monitoring activity relates to
the overall technology and product strategy and how to use the monitored technology. It could
potentially be a product, a specific application area or several areas in parallel. We see this as an
important step as a technology could for example be mature in relation to one application area while
being immature in relation to another area. Furthermore, what aspects or characteristics of the
technology that is of interest to the company also needs to be set in order to formulate an
information need, which could vary depending on the choice of application area.. Therefore our
second research question is:
2. How could one go about defining how a technology should be assessed?
1.3.3 Research Question 3 – Technology Indicators Knowing what to monitor, and what information is needed for potential decision making we have
arrived at the core of this thesis; the technology indicators. Depending on the information need, one
would have to study and measure different technology indicators. Therefore, investigating what
indicators could reveal what technology characteristics will be a core area of research. Also, once one
knows what indicators to measure, one has to ask oneself; what are the best sources of information,
and the best method and tools available to carry out the intelligence? And what exactly is it in those
sources that will give the best indication? Obviously, a process for monitoring technological
developments will not produce better results than what is fed into it. Therefore our third research
question is:
3. How could technology indicators be used to satisfy the information need of monitoring
activities?
1.3.4 Research Question 4 – Visualization of Technology Indicators One should not forget that the main underlying reason to perform any kind of technology
intelligence activities is by definition to support decision making. As the activities normally not are
carried out by the persons taking the decisions, the dissemination and visualization of the insights
becomes crucial. Accordingly, one could argue that it is an as important issue to present the
information in an intuitive and useful manner as it is to gather the data:
4. How to interpret and visualize the indicators in order to disseminate the information to
decision makers?
13
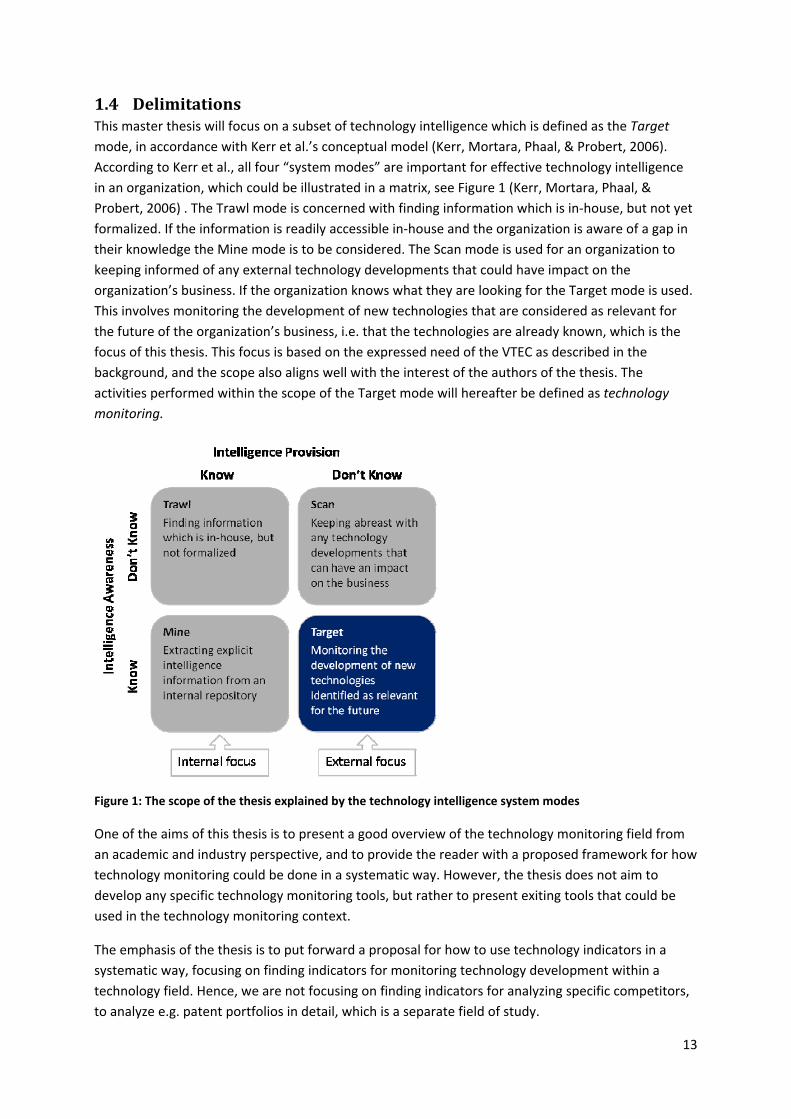
1.4 Delimitations This master thesis will focus on a subset of technology intelligence which is defined as the Target
mode, in accordance with Kerr et al.’s conceptual model (Kerr, Mortara, Phaal, & Probert, 2006).
According to Kerr et al., all four “system modes” are important for effective technology intelligence
in an organization, which could be illustrated in a matrix, see Figure 1 (Kerr, Mortara, Phaal, &
Probert, 2006) . The Trawl mode is concerned with finding information which is in‐house, but not yet
formalized. If the information is readily accessible in‐house and the organization is aware of a gap in
their knowledge the Mine mode is to be considered. The Scan mode is used for an organization to
keeping informed of any external technology developments that could have impact on the
organization’s business. If the organization knows what they are looking for the Target mode is used.
This involves monitoring the development of new technologies that are considered as relevant for
the future of the organization’s business, i.e. that the technologies are already known, which is the
focus of this thesis. This focus is based on the expressed need of the VTEC as described in the
background, and the scope also aligns well with the interest of the authors of the thesis. The
activities performed within the scope of the Target mode will hereafter be defined as technology
monitoring.
Figure 1: The scope of the thesis explained by the technology intelligence system modes
One of the aims of this thesis is to present a good overview of the technology monitoring field from
an academic and industry perspective, and to provide the reader with a proposed framework for how
technology monitoring could be done in a systematic way. However, the thesis does not aim to
develop any specific technology monitoring tools, but rather to present exiting tools that could be
used in the technology monitoring context.
The emphasis of the thesis is to put forward a proposal for how to use technology indicators in a
systematic way, focusing on finding indicators for monitoring technology development within a
technology field. Hence, we are not focusing on finding indicators for analyzing specific competitors,
to analyze e.g. patent portfolios in detail, which is a separate field of study.
14
Another delimitation that needs to be presented is that the purpose of this thesis is not to develop a
full process for how to perform technology monitoring, but a framework that needs to be further
refined before it could be implemented as a process. To the extent that we will discuss processes, we
will keep it on a general level and not go into defining what company specific roles and processes are
needed. The reason behind this is simply the vast time and resources that would be needed to
understand and analyze the company, its processes and culture, which was not possible to cover
within the scope and timeframe of this thesis.
The proposed framework in this thesis has been created with an assumption being that a future
possible implementation will be in a large organization primarily, to suit the need of VTEC. The
reason behind the applicability only for large organizations is that we are assuming that sufficient
resources are available within the company in order to have a dedicated group working with
Technology monitoring. A small firm could probably not work with technology monitoring in
accordance with the framework, and would most likely not disseminate information in the same way
or have a need for the same type of centralized organization.
1.5 Disposition of the Thesis and Reading Directions This thesis is divided into seven chapters excluding references and appendices. In order to guide the
reader through this thesis, an outline of it is presented here containing a brief description of the
contents of the different chapters together with a few reading directions.
1.5.1 Disposition In the first introductory chapter, the problem background and context for this thesis, the purpose of
the study, the problem analysis including the research questions and the delimitations have been
described.
In the second chapter, the methodology of the thesis is described, including the research procedure
that is structured in chronological order of how the thesis work was performed. The chapter explains
how and why a certain method was chosen for each part of the study. Chapter three presents the
theoretical framework that was developed from the literature study on technology monitoring,
technology development, technology assessment, technology indicators, and communication of
technology monitoring.
Chapter four presents the empirical information from the small‐scale case studies performed at three
technology‐intensive companies within other industries. Chapter five presents the synthesis of the
study which is the proposed framework for how technology indicators could be used for monitoring
of external technologies. The proposed framework is based on the theoretical framework and the
collected empirical information.
In chapter six, an observation and discussion of the results of the study and the pilot implementation
of the proposed framework at VTEC is held, where the results are compared to the existing research
in the field of study as well as to the purpose of the study. The answers to the research questions are
also presented and reflected upon. This is followed by the final conclusions in chapter 7, where the
generalization and applicability is reflected on, and some suggestions for further research are
suggested.
15
1.5.2 Reading Directions For the executive person reading this report, the focus should be on reading the synthesis, the
proposed framework in chapter five, which presents the answers to the research questions and the
results of the study. In order to gain a better and clearer understanding of the most crucial points to
be addressed, chapter six and seven containing the observations, discussions and conclusions of the
applicability of the framework in a company setting, should also be carefully examined.
For the academic readers, such as supervisors, professors and teachers in the field of study, the
entire thesis should be of interest. However, focus should be on chapters one through three, five and
six. Chapter one sets the focus of the study and relates it to the existing research, while chapter two
clearly explains how the study has been performed. Chapter three provides the reader with an
overview of the existing research and builds the framework used in the study. Chapter four is more
industry‐focused and specific for this study and could be given less focus. However, chapter five and
six contain the synthesis and the observation and discussion of the study, thus providing some new
insights to the field of study.
For students using this thesis as a benchmark for writing their own theses the focus should be on
chapters one, two and six. Reading chapter one gives a good indication of how a problem is delimited
and broken down into manageable pieces for a study, while chapter two highlights some of the
major methodological points that should be considered when performing a qualitative study.
Chapter six should finally be read as a suggestion for how a thesis could be summed up and
concluded.
16
2 Methodology The methodology motivates how the method of answering the research questions in section 1.3 is
performed, and describes how the work of generating a proposed framework for how to
systematically work with technology monitoring using technology indicators has been performed. It
begins with a description of research strategy of this thesis in section 2.1, followed by a more in‐depth
description of the research procedure throughout the thesis including a description for how and why a
certain method was chosen for each part of the study in section 2.2. In section 2.3 and 2.4, the data
collection and data analysis are separately described. The last section, 2.5 describes how the
reliability and validity of the research is ensured.
2.1 Research Method The method with which research is conducted pertains to the way a study is performed. Several
aspects have to be considered when choosing research method, and certain strategies are more or
less suitable in different situations. In this thesis we have chosen a qualitative research method that
can be seen as a combination of the constructive approach and the case study approach, where
depth of information has been of interest.
The constructive approach could be defined as problem solving through the construction of models,
plans, organizational procedures, etc, and generally involves the following steps (Kasanen, Lukka, &
Siitonen, 1993):
1. Identify a practically relevant problem.
2. Establish a comprehensive overview of the field through literature and industry practices.
3. Use the theoretical overview as support to construct a model for solving the problem.
4. Test and evaluate whether the proposed solution works.
5. Show the theoretical connections and the research contribution of the solution concept.
6. Examine the scope of applicability of the solution.
The constructive approach supports the aim of the thesis well overall, and we were encouraged of
that it provides the opportunity to validate the proposed framework by testing it at VTEC. It is also
well suited since an essential part of the constructive approach is to tie the existing problem to its
solution with accumulation of theoretical knowledge, which we thought would be a good approach
for this study. However, a problem that we have identified with the constructive approach is that it
focuses on constructing a completely new and innovative solution to a certain problem (Kärkkäinen,
2005). This could not entirely be applied to our thesis since our proposed framework for technology
monitoring is based on existing literature and business practice and the novelty lies in combining
existing thinking into a framework. Also, since technology monitoring is supposed to be made
continuously over a long period of time for valuable knowledge to be gained, the evaluation step was
not possible to do fully due to the limited time for the study and hence the hypothesis could not be
verified or falsified entirely. To the extent possible, the proposed framework was instead partly
validated through our own observations and comments from VTEC on its applicability.
Another research design approach that is closely related to the constructive approach, but does not
require the full verification of a hypothesis is the case study. The case study research method could
be defined as “…a way of investigating an empirical topic by following a set of pre‐specified
17
procedures” (Yin, 1994, p. 15), and is generally seen as a good method when answering research
questions like “how” and “why” according to Yin (1994). The case study approach is to be used when
certain questions are made concerning a certain event and when a certain outcome is desired
(Merriam, 1994). Hence, the case study could also be seen as a suitable approach for our purpose to
develop a framework applicable for VTEC. However, since the study does not include a detailed and
intensive study of the VTEC case in particular but more a brief insight into VTEC’s business and a
number of other businesses, there are some limitations in the applicability of the case study
approach as well.
However, by combining the two research approaches into a modified case study with influence from
the constructive approach, a suitable research strategy could be designed. The suggested research
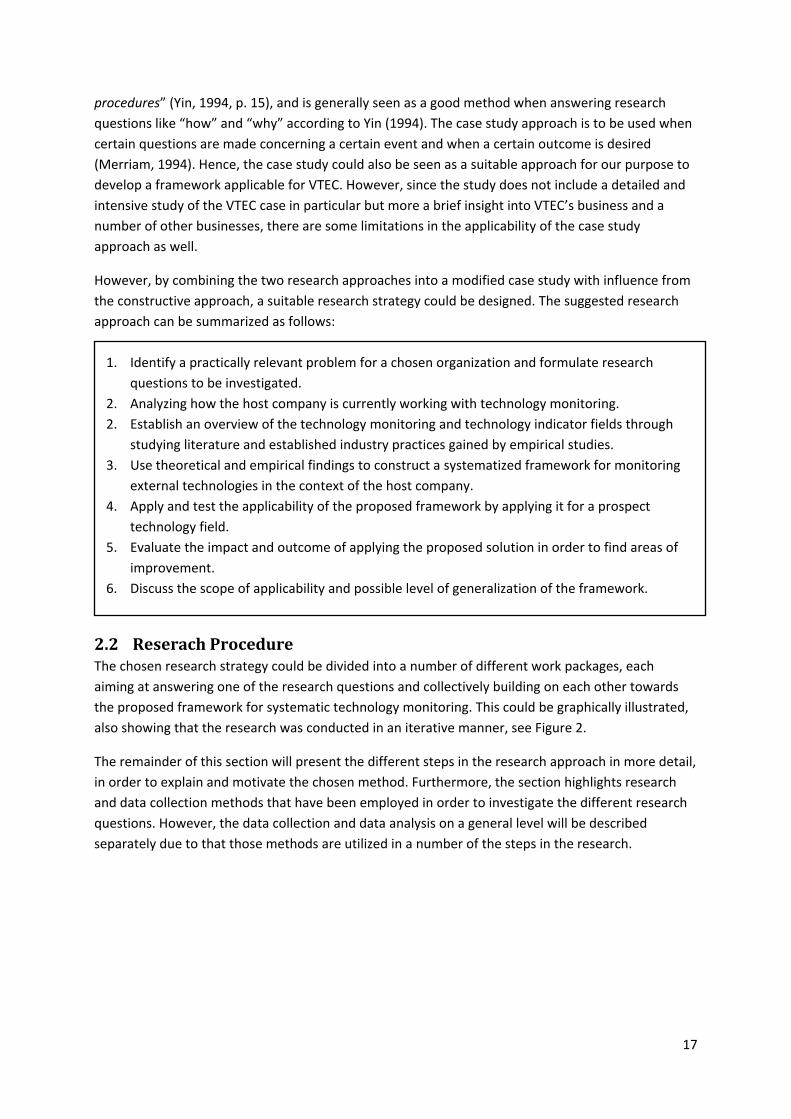
approach can be summarized as follows:
1. Identify a practically relevant problem for a chosen organization and formulate research
questions to be investigated.
2. Analyzing how the host company is currently working with technology monitoring.
2. Establish an overview of the technology monitoring and technology indicator fields through
studying literature and established industry practices gained by empirical studies.
3. Use theoretical and empirical findings to construct a systematized framework for monitoring
external technologies in the context of the host company.
4. Apply and test the applicability of the proposed framework by applying it for a prospect
technology field.
5. Evaluate the impact and outcome of applying the proposed solution in order to find areas of
improvement.
6. Discuss the scope of applicability and possible level of generalization of the framework.
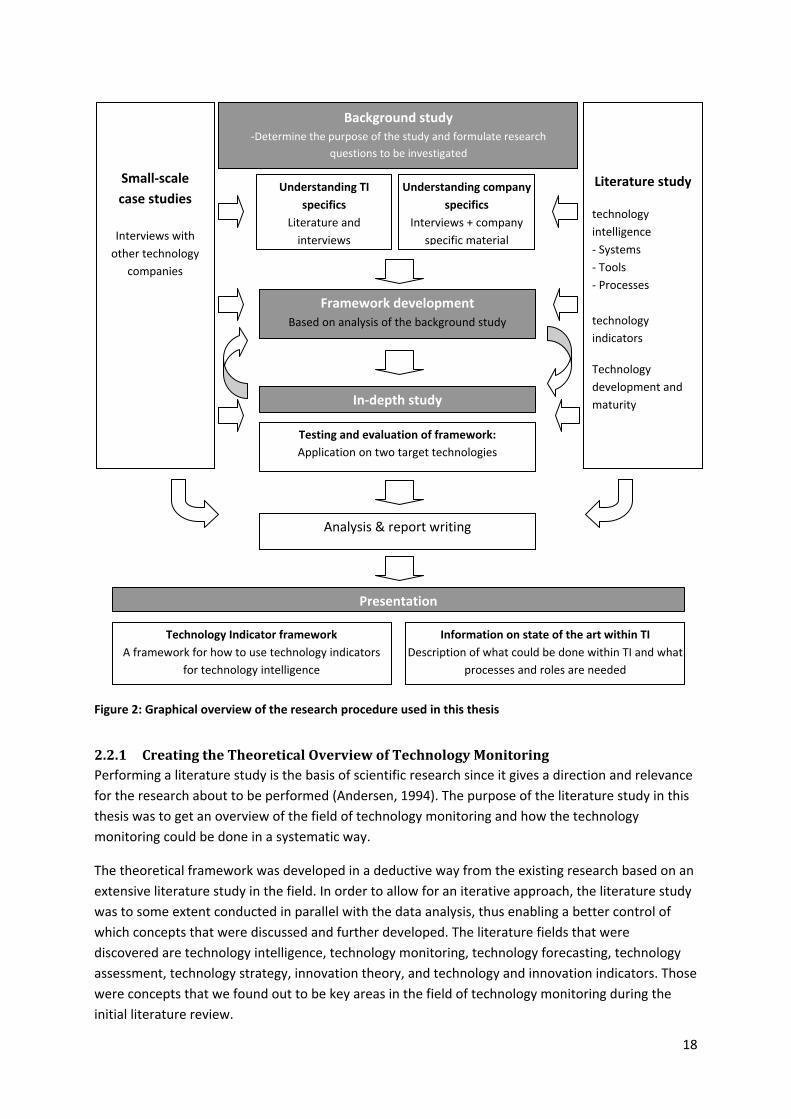
2.2 Reserach Procedure The chosen research strategy could be divided into a number of different work packages, each
aiming at answering one of the research questions and collectively building on each other towards
the proposed framework for systematic technology monitoring. This could be graphically illustrated,
also showing that the research was conducted in an iterative manner, see Figure 2.
The remainder of this section will present the different steps in the research approach in more detail,
in order to explain and motivate the chosen method. Furthermore, the section highlights research
and data collection methods that have been employed in order to investigate the different research
questions. However, the data collection and data analysis on a general level will be described
separately due to that those methods are utilized in a number of the steps in the research.
18
2.2.1 Creating the Theoretical Overview of Technology Monitoring Performing a literature study is the basis of scientific research since it gives a direction and relevance
for the research about to be performed (Andersen, 1994). The purpose of the literature study in this
thesis was to get an overview of the field of technology monitoring and how the technology
monitoring could be done in a systematic way.
The theoretical framework was developed in a deductive way from the existing research based on an
extensive literature study in the field. In order to allow for an iterative approach, the literature study
was to some extent conducted in parallel with the data analysis, thus enabling a better control of
which concepts that were discussed and further developed. The literature fields that were
discovered are technology intelligence, technology monitoring, technology forecasting, technology
assessment, technology strategy, innovation theory, and technology and innovation indicators. Those
were concepts that we found out to be key areas in the field of technology monitoring during the
initial literature review.
Understanding TI
specifics
Literature and
interviews
Understanding company
specifics
Interviews + company
specific material
Analysis & report writing
Literature study
technology
intelligence
‐ Systems
‐ Tools
‐ Processes
technology
indicators
Technology
development and
maturity
In‐depth study
Testing and evaluation of framework:
Application on two target technologies
Background study ‐Determine the purpose of the study and formulate research
questions to be investigated
Framework development
Based on analysis of the background study
Presentation
Information on state of the art within TI
Description of what could be done within TI and what
processes and roles are needed
Small‐scale
case studies
Interviews with
other technology
companies
Technology Indicator framework
A framework for how to use technology indicators
for technology intelligence
Figure 2: Graphical overview of the research procedure used in this thesis
19
From reading current literature technology monitoring it is unclear how companies could adopt
technology monitoring on a detailed level; especially how this could be done by finding signals of
change that could be monitored. Therefore, a second purpose of the literature study was to identify
what different specific activities that a company would need to do and how those could be done,
which was done by studying other literature on technology management, technology strategy and
technology assessment that was not specific for technology intelligence purposes. In addition, a
thorough study was made in the subject of technology trees and how technologies could be broken
down in sub‐technologies and sub‐systems since we have learnt during our studies at ICM the
importance of breaking down technologies and see what is really driving the development when
managing technology strategy.
Denscombe points out a number of critical aspects to consider while reading various sources;
authenticity, credibility and representativeness (Denscombe, 1998). The authenticity of the material
is considered to be high since it is mainly collected from public libraries and highly accredited
journals within the field of study. The credibility is also considered to be high, as multiple sources
have been used. However, the representativeness of the literature concerning systematic monitoring
using technology indicators could be questioned, since most literature found have a more
organizational perspective on technology monitoring and do not focus on the more analytical
perspective of the use of indicators. The representativeness and possible critics is discussed in
chapter 6.
2.2.2 Analysis of the Host Company’s Current Technology Intelligence Process In a case study, it is of importance to understand the complexity and particular nature of the case
that one is studying (Bryman & Bell, 2007). Hence, in order for us to be able to apply the study to the
context of VTEC we started with trying to understand VTEC’s existing way of working with technology
intelligence and keeping track of threats and opportunities in the external environment. To get a
broad picture of how all the different parts of the organization worked with this, and how they would
like to work we conducted over 12 interviews with people from the library, technology specialists,
and technology managers within VTEC as well as technology managers within some of the product
development companies within the Volvo Group. That gave a lot of valuable insights into the way of
working with technology and business monitoring, and how the technology monitoring could be
improved.
2.2.3 Analysis of Three External Companies' Monitoring of External Technologies Three small‐scale case studies were performed in parallel to the main case study at VTEC. This was
done in order to find inspiration for how a general framework for working with technology
monitoring could be designed at VTEC, and to give valuable input on how the overall work with
technology monitoring is performed at other companies. The three companies were chosen since
they are technology intensive firms that are seen as leading the technological field in their respective
industry. Hence, we figured that those three firms should be relatively good at working with
technology intelligence.
The small‐scale case studies were carried out by visiting the companies and examining how they
worked with technology intelligence and technology monitoring in specific through interviews with
the technology intelligence manager, or a similar role, for each company. One interview template
20
was developed that was sent to the interviewees in advance, see Appendix 1, and the interviews
were conducted in a semi‐structured manner.
2.2.4 Hypothesis Formulation – Developing the Proposed Framework The next step in the research process focused on constructing and describing a proposed framework
for how companies like VTEC could work systematically with technology monitoring. The proposed
framework was built based on four different building blocks. First of all, the literature study made up
the main source to find tools and frameworks that related to monitoring of technologies and how
that could be done in a systematic and analytical way. Second, the discussion that we had with
people at VTEC for defining the scope of the research and the challenges that they were facing in
their technology intelligence work provided valuable input for what needs that exists. Third, the
empirical study at the three external companies gave us valuable input on how other companies
have organized their technology monitoring and what tools that are used. Finally, much inspiration to
the framework came from tools and skills that we have acquired during the course of our studies at
Intellectual Capital Management (ICM).
2.2.5 Applying, Testing and Evaluating the Framework for a Target Technology In order to avoid having a purely descriptive and literature study‐based in our thesis, this step of the
research procedure aimed at applying and testing the proposed framework. This was done by taking
active participation in testing the framework for two technologies that were in the interest of our
host company to look further into and understand what opportunities and threats that those
technologies could imply. The goal of applying the framework was to assess what impact the
framework could have for the technology strategy of VTEC, and to see how it would fit together with
the other technology intelligence activities. In addition, we wanted to be able to identify limitations
of the framework.
Each step of the proposed framework was gone through in accordance with the framework and
searches for information was done with help from the information specialists at VTEC. The results
from applying the framework were presented to a group of people involving both technology
specialists and technology managers. That gave us further insights into how the framework could be
applied and its limitations. However, no quantitative and more systematic evaluation has been done
of the framework. That is largely dependent on that the result of doing technology monitoring with
indicators could not be evaluated after just one instance, but a continuous monitoring by measuring
the indicators needs to be done for a thorough evaluation to be made.
2.3 Data Collection In general, data collection can be divided into two areas: primary and secondary data. Primary data is
defined as new data gathered to shed light on the research issue at hand, while secondary data is
defined as information having been collected for another purpose but that is relevant to the study at
hand (Holme & Solvang, 1997). There are basically four different types of data collection techniques:
questionnaires, interviews, observation or analyzing documents. The use of multiple techniques for
studying the same phenomenon is referred to as triangulation, which enables the researcher to
question or confirm the results obtained (Denscombe, 1998).
In this thesis, studying literature about technology intelligence, technology monitoring, technology
forecasting, technology assessment, technology strategy, and technology and innovation indicators,
was used as the main technique for collecting data. However, it was complemented by a number of
21
interviews both internally at VTEC and at other companies in order to provide background
information and allow for triangulation of the data.
2.3.1 Primary Data Collection – Interviews A combination of semi‐structured and unstructured interviews has been utilized throughout the
thesis. For the small‐scale case studies, a semi‐structured interview methodology was used. The
reason for choosing this type of interview was that it made it possible to derive specific areas of
interest for the interviews from the literature, thus enabling the interview template to be organized
in topics around the areas of interest. The different set of questions were handled in a specific order
based on an interview template, and the interviewee could combine answers to direct questions with
more open answers where he or she could elaborate on a specific topic (Lantz, 2007). The same
interview template was used in all interviews for the small‐scale case studies (see Appendix 1) in
order to structure the interviews in the same way and ensure that we acquired comparable and
equivalent data (Patton, 2002). For the interviews with people at the host company a more
unstructured interview methodology was used, which was more like a discussion regarding different
subjects connected to technology management and technology intelligence.
An important aspect to consider when choosing interviews as a data collection technique is how the
interview should be documented. The interviews for this thesis were documented using field notes.
The advantage of using field notes is that the processing of the data is less time consuming, but the
possibility of listening to the interview again is lost (Denscombe, 1998). In order to extract as much
information as possible from the interviews, both project members participated in the interview
where one was in charge of leading the interview and focusing on the overall picture, and the other
took notes. After each interview, a short discussion in the project group was held in order to extract
the main points quickly and precisely.
2.3.2 Secondary Data Collection – The Literature Study Performing a literature study is the basis of scientific research since it gives a direction and relevance
for the research about to be performed. The literature study constitutes the basis for this thesis and
has been conducted mainly by reading books and articles on relevant subjects, from which the
theoretical framework was developed.
The most difficult issue is often how to find relevant literature. Andersen suggests that the literature
study starts with the general literature and progress to the specific one, and always from the latest to
the older (Andersen, 1994). In doing so, the references can be followed chronologically backwards
and the entire field can be covered fairly easily and correctly. For this thesis we have identified all
literature by searching in online libraries, article databases and through regular Internet search
engine searches. As the scientific area builds upon quite few authors, we have been able to cover a
large part of the technology monitoring literature field.
2.4 Data Analysis In scientific methodology, there is no universal approach to analyzing qualitative data. Instead, it is
more or less common practice that researchers develop their own methods for performing this type
of analysis. However, there are though some recommendations and advice on a general process of
attacking the abundance of material that qualitative techniques produce (Patel & Davidson, 2003).
22
Merriam proposes a general approach for analyzing qualitative data in relation to case studies
(Merriam, 1994). The first step is to organize the data in a manageable way before the analysis starts,
which could be done in a topical or chronological order. The aim is that all the data should have a
similar format in order for the researcher to be able to get a better grasp of the data. The next step is
to classify the data into categories, themes or types. Having done this, the data should be broken
down into units of analysis. These units of analysis need to be small enough to be able to handle
quickly and easily. Depending on the study, they could be special words, descriptions or ideas. The
last step is to identify themes, make inferences, develop models or generate theory by seeking
dependencies between these units of analysis.
In this thesis, the collected data has been analyzed following an abductive approach since the work
has been conducted in iterative loops between the empirical data and the literature, combining
inductive and deductive approaches. The data was organized, through discussions and based on the
literature, into five different topics: 1) ways of monitoring external technologies, 2) assessment of
technology 3) breaking down a technology in subfields, 4) technology indicators, and 5)
communication of technology monitoring. Based on the analyzed data from both literature and
interviews, a framework was developed.
2.5 Quality of Research To ensure the quality of research in qualitative studies, there are some measures that could be
taken. According to Eriksson & Wiedersheim‐Paul a credible report should include both high validity
and reliability, so that the credibility in the conclusions means that the results are reasonable and
generated through acceptable methods (Eriksson & Wiedersheim‐Paul, 2001). Yin discusses the
following concepts in relation to case studies (Yin, 1994):
Construct validity
Internal validity
External validity
Reliability
Validity is the items, scale or instruments ability to measure what it is intended to measure (Eriksson
& Wiedersheim‐Paul, 2001). The concept of construct validity is focused on how the research is
constructed, and the instrument used for conducting the research. Internal validity is more directed
towards if the researcher captures what is exposed to him or her, and can hence be examined
without collecting data, since the method of generating the conclusions are examined. These two
concepts can be said to be evaluating the same aspect of the research and will hence be discussed in
the same section. External validity is how well the generated results coincide with reality. The
reliability refers to if the research would produce the same result if it would be performed on
another occasion. This makes the concept of reliability somewhat difficult to apply to case studies
since the world is non‐static and since the persons conducting the case study affect the result by
applying their knowledge and views. Hence, the reliability could be said to be generated from
conclusions based on how well the validity is performed; why we will only discuss the validity in
relation to the study.
2.5.1 Construct and Internal Validity Different methods to generate a valid outcome of a research story are presented by Garson and
Merriam (Merriam, 1994; Garson, 2002). A number of these methods have been used in this thesis to
23
generate internal and construct validity; triangulation, observation during an extensive period of
time, control of the participants, horizontal evaluation and critique and a participated approach.
Triangulation, meaning that multiple sources are used for synthesizing information, has been carried
out with the aim of generating a more valid study to be able to draw general conclusions concerning
frameworks for how to conduct technology monitoring. This motivates the project including
empirical studies at different companies as well as literature studies consisting of papers, books and
e‐sources.
All necessary data for the study has been searched for and gathered continuously through the study,
leading to observation during a long period of time. However, the given time frame for the thesis did
not allow a more extensive study. When it has been possible however, multiple visits and
complementary interviews have been made to the different areas studied.
Control of the participants, meaning that for example during interviews, the interviewees get the
chance of ensuring that the information they provided was interpreted correctly by the interviewer.
This has been performed through sending the notes from the interviews back to the interviewee to
control the correctness of the generated answers and if necessary give feedback.
By horizontal evaluation and critique is meant that other persons outside of the research group
comments upon and evaluates the emerging results. In this study this kind of evaluation and critique
has been performed both by the assigners at VTEC as well as the mentor at Chalmers.
A participated approach, meaning that persons who are taking part in the project or research should
participate throughout the emerging project, has been used in this study. That has been done
through that the persons that are affected by the technology intelligence framework were
interviewed and continuously asked for input to generate answers and involve these in the future
framework and process at VTEC. This has been facilitated through spending a great deal of the time
working with the project at VTEC’s premises. All involved persons in the study have also been invited
to a workshop which can also be seen as a participating approach.
2.5.2 External Validity External validity deals with to what extent the research can be generalized, and also whether or not
the results concur with previous research performed in the area (Denscombe, 1998). Qualitative case
studies usually have high internal validity but the generalization is more difficult to motivate, since
the reason for choosing case studies normally is to study a situation or an event in depth (Merriam,
1994; Yin, 1994). When it is not an option to conduct multiple case studies, the generalization of the
results depends on that a redefinition of the generalization principles is made so they reflect the
point of departure or prerequisites that the qualitative research rests upon (Merriam, 1994). To
achieve this, researchers have to provide a detailed description of the context in which the study was
performed. Consequently it may be difficult to draw any general conclusion based on this study even
though a few small‐scale cases studies were conducted, but since extensive case descriptions has
been made, a wide information base will be available to use as comparison in other studies.
24
3 Theoretical Framework The theoretical framework is a product of an extensive literature review in the search of theory in
relation to technology monitoring which was developed in order to describe the theoretical basis used
for this thesis and to help answering the research questions. It contains five different parts which are
later on used for being able to support a proposed applicable framework, presented in Chapter 0. The
chapter starts out with explaining the basic theoretical foundation of technology monitoring in 3.1.
The remainder of the chapter includes aspects of technology monitoring that we believe is of
importance to support a potential framework. Section 3.2 describes how a technology and its
development could be defined, followed by how one could assess a technology in 3.3. In section 3.4
the concept of technology indicators is presented, and subsequent to that, section 3.5 describes how
the information gathered in the technology monitoring process should be communicated.
3.1 Monitoring of External Technologies ”To anticipate innovation, the political, social, and other factors influencing its progress must be
systematically monitored”
(Bright, 1970, p. 62)
One of the biggest challenges when managing technical innovation is to anticipate the impact and
direction of technological change (Utterback & Brown, 1972). One way of forecasting the future
would be to account for all important uncertainties and relationships and develop consistent
forecasts using simulation and other analytical tools. However, in many cases such an approach
would take too much time and resources for a company. Therefore, there is another way of
managing this contingent uncertainty in technology development. That is to observe the
technological change in a systematic way, which could be done through technology monitoring.
Many other authors besides Utterback & Brown have defined technology monitoring as a systematic
way of characterizing and following technology trends. Porter defines it as the task of “cataloguing,
characterizing, and interpreting technology development activities” (Porter A. , 2005, p. 18).
Lichtenthaler uses the definition of routine tracking of designated science and technology topics of
interest to detect trends (Lichtenthaler, 2006).
The technology monitoring approach to technology intelligence was though first defined by James
Bright. According to Bright’s definition, technology monitoring is not just scanning and gathering
data, but includes four activities (Bright, 1970, p. 64):
1. Searching the environment for signals that may be forerunners of significant technological
change.
2. Identifying the possible consequences of the signals (assuming that these signals are not
false and the trends that they suggest persist).
3. Choosing the parameters, policies, events, and decisions that should be observed and
followed to verify the true speed and direction of technology and the effects of employing it.
4. Presenting the data from the foregoing steps in a timely and appropriate manner for
management's use in decisions about the organization's reaction.
25
The approach of using “signals”, or indicators, for identifying technological change is also
recommended by Utterback & Brown (1972). Utterback & Brown state that monitoring technological
development using signals involves two main activities: (1) identifying "signals" of change in
emergent stages of a technology, and (2) gathering information on appropriate trends and
parameters that help determine the development rate and the potential impact the technology will
have on the company’s business (Utterback & Brown, 1972). This approach is related to the
argument provided by Abernathy & Utterback that the rate of technological advance is a function of
the effort put into the development of the technology, which could be described using the S‐curve
model, further introduced in 3.2 (Abernathy & Utterback, 1978). Hence, if the efforts put in could be
measured, that could signal technological development. The signals, or trends of objective metrics,
could thus be used to inform intuition of business managers when taking strategic decision relating
to technologies, to make technology strategy decisions less subjective and dependent on personal
views of managers (Brockley, 2004).
When monitoring a technology it is not very important to capture an exact snapshot of the
technology landscape, which is also more or less impossible. Rather, the value from monitoring a
technology becomes evident when the current status of the signals is compared to previous
checkpoints. That is when you start seeing patterns emerging and the momentum of the
development could be understood (Brockley, 2004). This is also emphasized by Day, Schoemaker &
Gunther, who state that technology forecasting should not be done by looking at a fixed point and
projecting the future, but by looking for signals of momentum building up around a technology in the
recent past (Day, Schoemaker, & Gunther, 2000).
3.1.1 The Importance of Systematic Monitoring of External Technologies The importance of monitoring the external technology landscape to identify potential threats and
opportunities for a company has been emphasized by a number of authors. Brockley concludes that
scanning and monitoring can and should be used to effectively develop an objective, simple, and
descriptive view of technology emergence that captures the activity, momentum and viability of
emerging technologies over time (Brockley, 2004). Rohrbeck states that it is essential to closely
monitor developments in the core technologies of the company in combination with scanning for
new technologies that may have disruptive potential, since one of the main elements of
technological capability is the knowledge of the relevant developments and trends (Rohrbeck R. ,
2007). Ernst, on the other hand, argue that the establishment of a technology monitoring system is a
cornerstone of technology management, as it makes it possible for a company to anticipate changes
within its competitive environment in a timely manner (Ernst, 1998).
One of the most used arguments for why technology monitoring is such an important task of
company is that if it is not done, the risk of not identifying technological developments in time is too
big. Veugelers, Bury & Viaene, argue that smart organizations do not wait for change to happen but
actively monitor and take advantage of changing environments and new innovations, while Bright
clearly states that “the folly of ignoring technological advances is readily apparent” (Veugelers, Bury,
& Viaene, 2010; Bright, 1970, p. 62).
According to Watts & Porter’s, “The cornerstone for innovation forecasting is monitoring”, they argue
that the technological developments that are happening now indicate future technological change
and that monitoring of the target technology and related technologies together with the relevant
26
contextual influences is the most important part to conduct effective technology forecasting (Watts
& Porter, 1997, p. 28). Hence, by monitoring technological developments a company gets better
prepared for forecasting what will happen in the short‐term and long‐term future.
Trott also adds another perspective to the importance of monitoring external technological advances
when arguing that the process of searching for and acquiring technical information is necessary for
companies to maintain their knowledge base, which in turn is important for the dynamic capabilities
of the firm (Trott, 2008). The dynamic capabilities defines the firm’s opportunities to follow new
technological trajectories, why monitoring of what new possible paths becomes key for the
technology strategy of the firm.
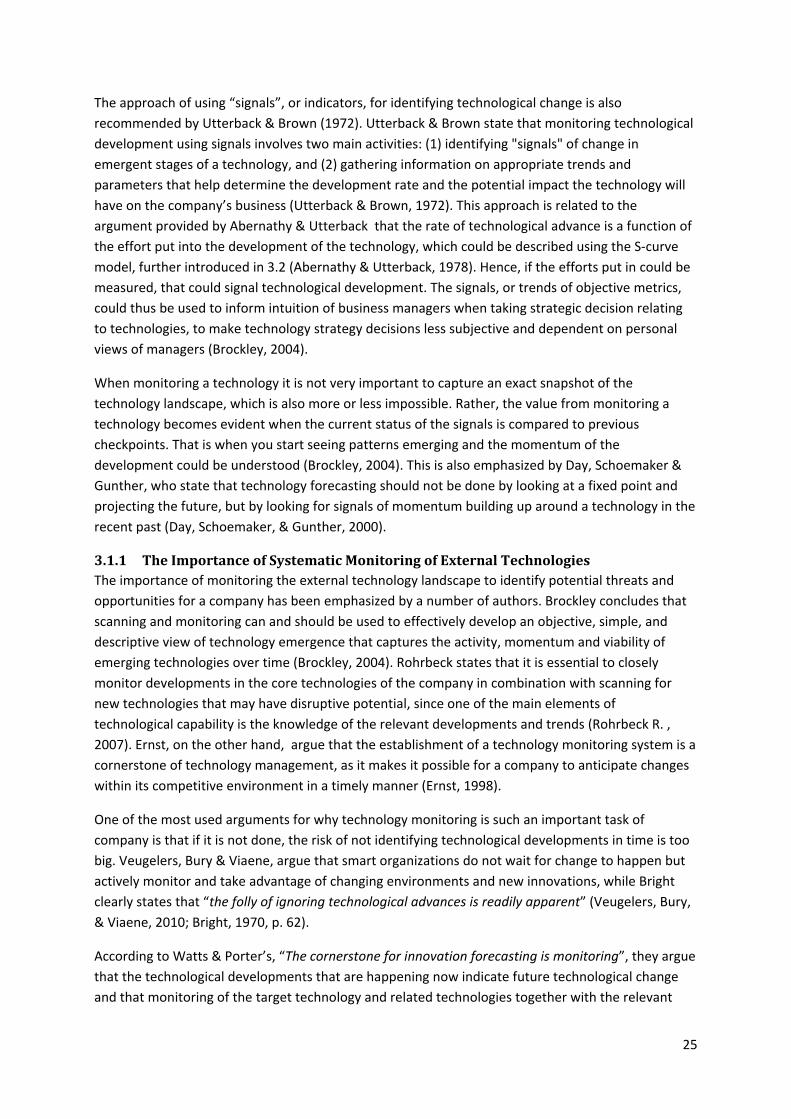
3.1.2 Monitoring in Relation to Other Technology Intelligence Activities Lichtenthaler describes technology monitoring as a directed, inside‐out, perspective, which needs to
be complemented by an outside‐in perspective, so called scanning (Lichtenthaler, 2006). The outside‐
in perspective is searching for trend information connected to technologies currently not known to
the company. The inside‐out perspective, on the other hand, focuses on acquiring information on
known technologies which could be either internal or external to the company, see Figure 3
(Lichtenthaler, 2006).
Figure 3: Perspectives of technology intelligence
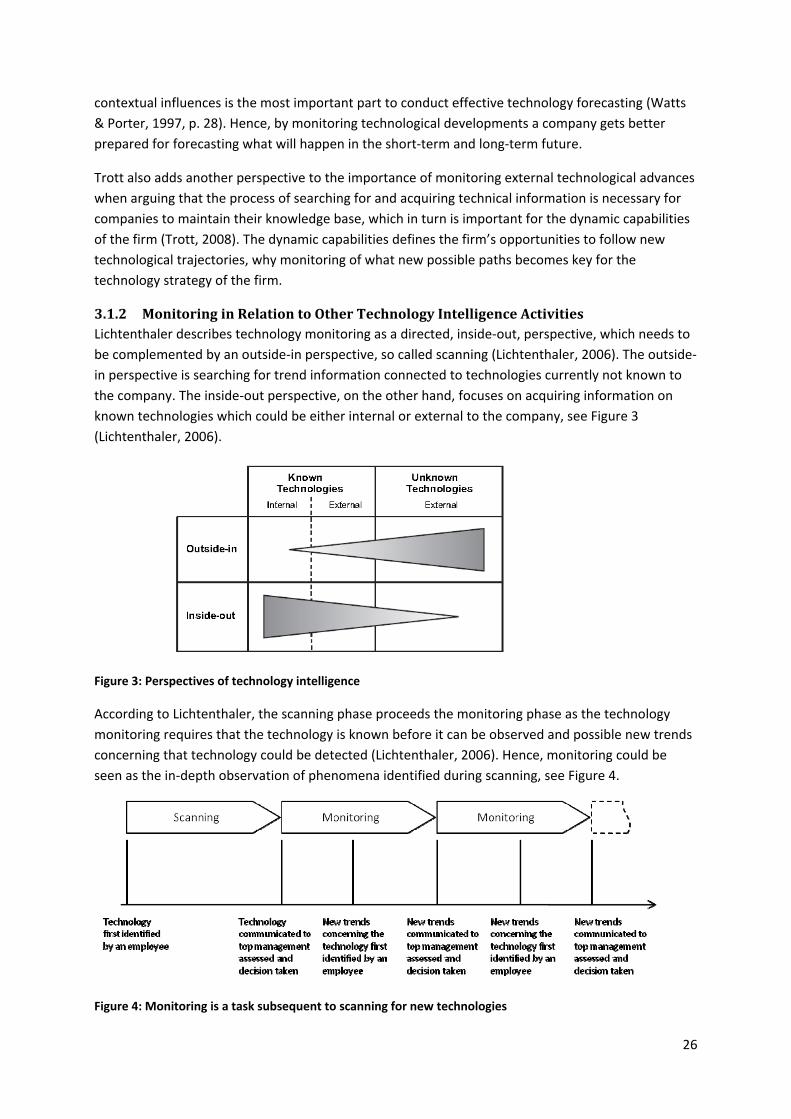
According to Lichtenthaler, the scanning phase proceeds the monitoring phase as the technology
monitoring requires that the technology is known before it can be observed and possible new trends
concerning that technology could be detected (Lichtenthaler, 2006). Hence, monitoring could be
seen as the in‐depth observation of phenomena identified during scanning, see Figure 4.
Figure 4: Monitoring is a task subsequent to scanning for new technologies
27
Lichtenthaler also distinguishes between active and passive monitoring (Lichtenthaler, 2004). Passive
monitoring could be done when the internal technology and application knowledge is high by e.g. a
research group as part of their tasks. On the contrary, active monitoring should be done if a company
decides not to start a project around or invest in a technology that was identified in the scanning
phase, but the technology still is considered interesting for the company’s future business. The
monitoring function should in this case be performed by an active monitoring team made up by
people from the R&D organization. Without an active monitoring, there is a risk of reacting too late
to significant trends concerning the technology (Lichtenthaler, 2004).
3.1.3 Disposition of the Theoretical Framework In order to build the proposed technology monitoring framework with the advantages described
above, there are certain elements that we have identified through literature and through our
previous studies at ICM as necessary for a systematic approach to technology monitoring. These will
be the basis for the rest of the theoretical framework chapter.
As we see it, a fundamental element for technology monitoring is the definition of a technology and
technological development. Most technology intelligence literature does not recognize this issue but
rather focuses on the development of tools, processes and methods. However, in order to get into
depth with how to analyze technologies we see these definitions as something that deserves specific
attention. The connections between these methods, and an ability to choose the appropriate
method in a specific situation, are missing and there is clearly a lack of description of when to use
what method and why to use it. Therefore, we have chosen to include literature traditionally not
seen as technology intelligence literature to build a solid theoretical foundation around it. Thus,
chapter 3.2 is dedicated to build a theoretical fundament on the topic and dealing with sub‐issues
like how to define and delimit what a technology is.
Building on the theoretical fundament discussed above, there are certain crucial steps that we see
that one needs to follow in order to conduct a monitoring process that in a systematic way uses
technology indicators. Once one can define a technology, one needs to figure out what aspects of the
technology development that is important and how the technology should be related to the overall
technology strategy of the firm. In chapter 3.3 we introduce concepts and model of how a
technology should be assessed and in relation to what in the monitoring process.
Once the technology has been properly defined and it is clear in relation to what it should be
assessed, we discuss one of the core elements of this thesis, the technology indicators. In chapter
3.4, we introduce and discuss the concept of technology indicators, i.e. how to actually measure the
characteristics and development of the technology.
Finally, we see communication as a critical step in the monitoring process. Communication is directly
related to the impact that the potential insights of the monitored technologies could have and so
interlinked with the rest of the process so that we have dedicated chapter 3.5 to it.
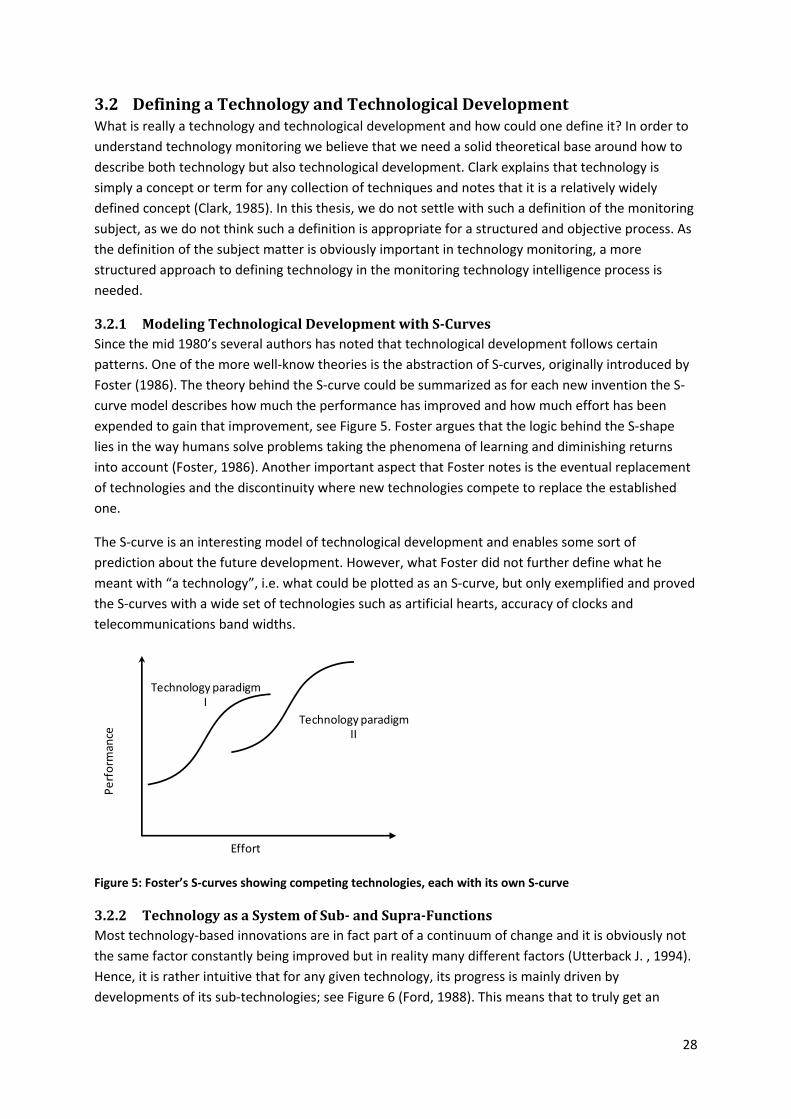
28
3.2 Defining a Technology and Technological Development What is really a technology and technological development and how could one define it? In order to
understand technology monitoring we believe that we need a solid theoretical base around how to
describe both technology but also technological development. Clark explains that technology is
simply a concept or term for any collection of techniques and notes that it is a relatively widely
defined concept (Clark, 1985). In this thesis, we do not settle with such a definition of the monitoring
subject, as we do not think such a definition is appropriate for a structured and objective process. As
the definition of the subject matter is obviously important in technology monitoring, a more
structured approach to defining technology in the monitoring technology intelligence process is
needed.
3.2.1 Modeling Technological Development with SCurves Since the mid 1980’s several authors has noted that technological development follows certain
patterns. One of the more well‐know theories is the abstraction of S‐curves, originally introduced by
Foster (1986). The theory behind the S‐curve could be summarized as for each new invention the S‐
curve model describes how much the performance has improved and how much effort has been
expended to gain that improvement, see Figure 5. Foster argues that the logic behind the S‐shape
lies in the way humans solve problems taking the phenomena of learning and diminishing returns
into account (Foster, 1986). Another important aspect that Foster notes is the eventual replacement
of technologies and the discontinuity where new technologies compete to replace the established
one.
The S‐curve is an interesting model of technological development and enables some sort of
prediction about the future development. However, what Foster did not further define what he
meant with “a technology”, i.e. what could be plotted as an S‐curve, but only exemplified and proved
the S‐curves with a wide set of technologies such as artificial hearts, accuracy of clocks and
telecommunications band widths.
Figure 5: Foster’s S‐curves showing competing technologies, each with its own S‐curve
3.2.2 Technology as a System of Sub and SupraFunctions Most technology‐based innovations are in fact part of a continuum of change and it is obviously not
the same factor constantly being improved but in reality many different factors (Utterback J. , 1994).
Hence, it is rather intuitive that for any given technology, its progress is mainly driven by
developments of its sub‐technologies; see Figure 6 (Ford, 1988). This means that to truly get an
Effort
Perform
ance
Technology paradigm I
Technology paradigm II
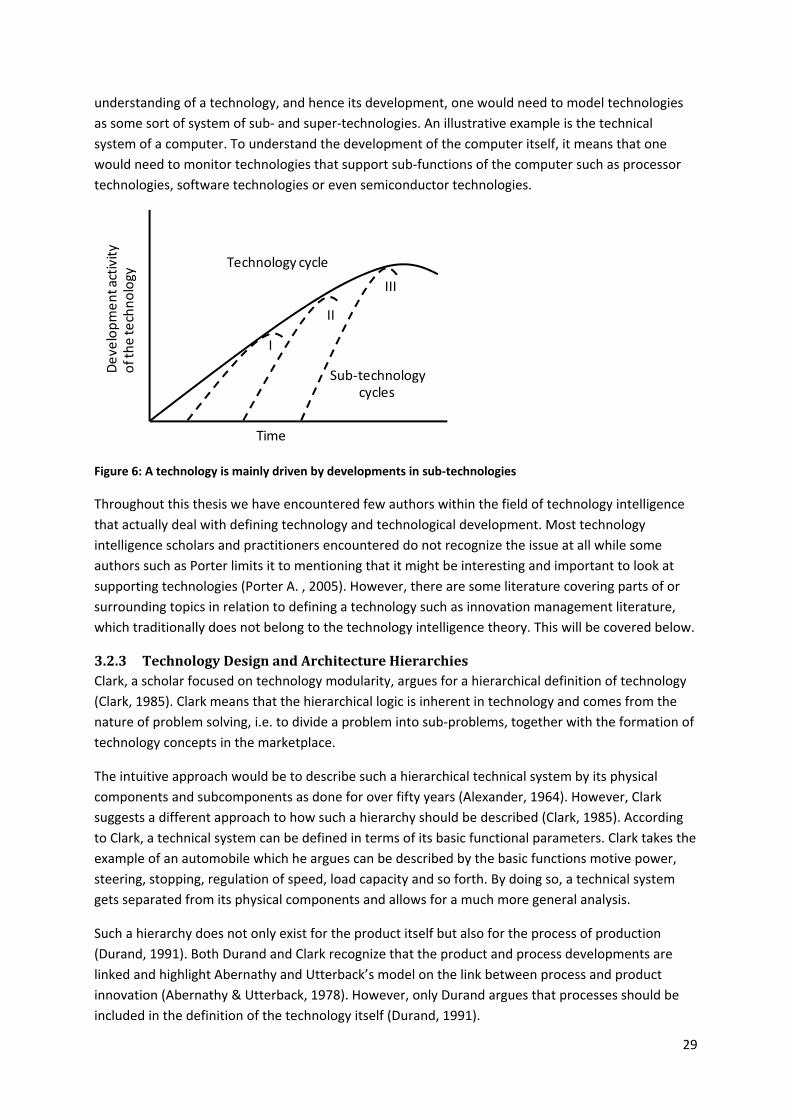
29
understanding of a technology, and hence its development, one would need to model technologies
as some sort of system of sub‐ and super‐technologies. An illustrative example is the technical
system of a computer. To understand the development of the computer itself, it means that one
would need to monitor technologies that support sub‐functions of the computer such as processor
technologies, software technologies or even semiconductor technologies.
Figure 6: A technology is mainly driven by developments in sub‐technologies
Throughout this thesis we have encountered few authors within the field of technology intelligence
that actually deal with defining technology and technological development. Most technology
intelligence scholars and practitioners encountered do not recognize the issue at all while some
authors such as Porter limits it to mentioning that it might be interesting and important to look at
supporting technologies (Porter A. , 2005). However, there are some literature covering parts of or
surrounding topics in relation to defining a technology such as innovation management literature,
which traditionally does not belong to the technology intelligence theory. This will be covered below.
3.2.3 Technology Design and Architecture Hierarchies Clark, a scholar focused on technology modularity, argues for a hierarchical definition of technology
(Clark, 1985). Clark means that the hierarchical logic is inherent in technology and comes from the
nature of problem solving, i.e. to divide a problem into sub‐problems, together with the formation of
technology concepts in the marketplace.
The intuitive approach would be to describe such a hierarchical technical system by its physical
components and subcomponents as done for over fifty years (Alexander, 1964). However, Clark
suggests a different approach to how such a hierarchy should be described (Clark, 1985). According
to Clark, a technical system can be defined in terms of its basic functional parameters. Clark takes the
example of an automobile which he argues can be described by the basic functions motive power,
steering, stopping, regulation of speed, load capacity and so forth. By doing so, a technical system
gets separated from its physical components and allows for a much more general analysis.
Such a hierarchy does not only exist for the product itself but also for the process of production
(Durand, 1991). Both Durand and Clark recognize that the product and process developments are
linked and highlight Abernathy and Utterback’s model on the link between process and product
innovation (Abernathy & Utterback, 1978). However, only Durand argues that processes should be
included in the definition of the technology itself (Durand, 1991).
Time
Development activity
of the technology
Sub‐technology cycles
I
II
III
Technology cycle
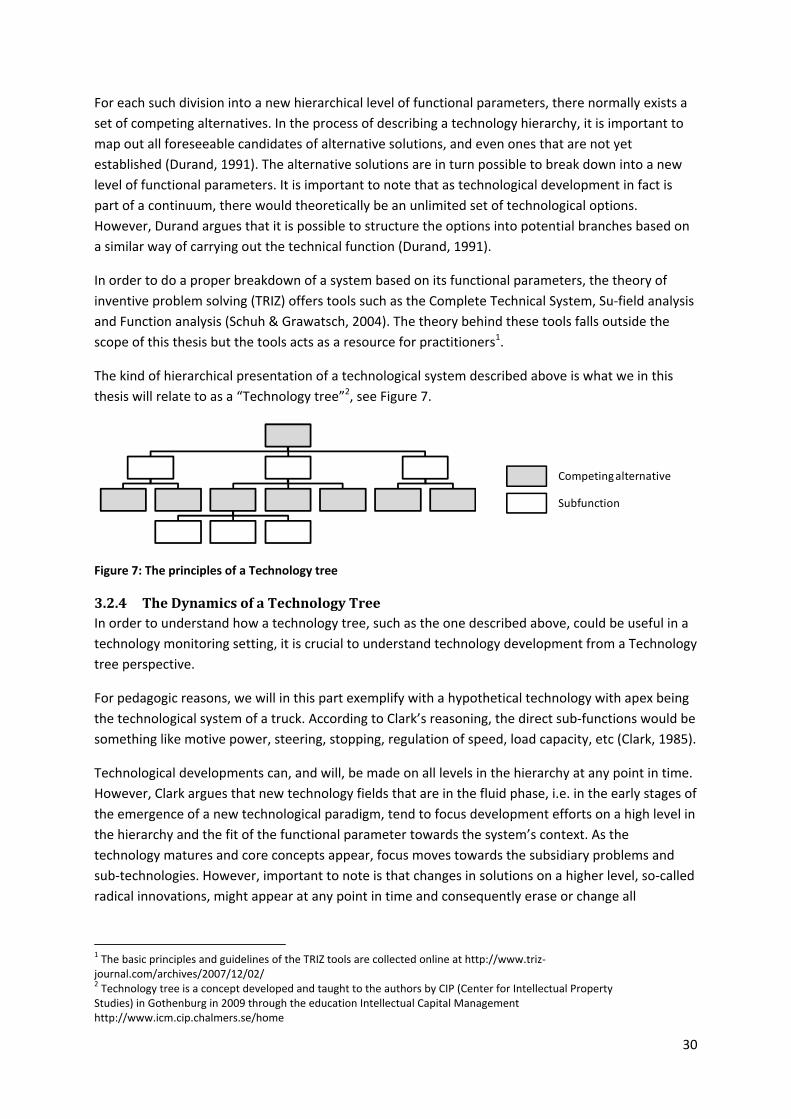
30
For each such division into a new hierarchical level of functional parameters, there normally exists a
set of competing alternatives. In the process of describing a technology hierarchy, it is important to
map out all foreseeable candidates of alternative solutions, and even ones that are not yet
established (Durand, 1991). The alternative solutions are in turn possible to break down into a new
level of functional parameters. It is important to note that as technological development in fact is
part of a continuum, there would theoretically be an unlimited set of technological options.
However, Durand argues that it is possible to structure the options into potential branches based on
a similar way of carrying out the technical function (Durand, 1991).
In order to do a proper breakdown of a system based on its functional parameters, the theory of
inventive problem solving (TRIZ) offers tools such as the Complete Technical System, Su‐field analysis
and Function analysis (Schuh & Grawatsch, 2004). The theory behind these tools falls outside the
scope of this thesis but the tools acts as a resource for practitioners1.
The kind of hierarchical presentation of a technological system described above is what we in this
thesis will relate to as a “Technology tree”2, see Figure 7.
Figure 7: The principles of a Technology tree
3.2.4 The Dynamics of a Technology Tree In order to understand how a technology tree, such as the one described above, could be useful in a
technology monitoring setting, it is crucial to understand technology development from a Technology
tree perspective.
For pedagogic reasons, we will in this part exemplify with a hypothetical technology with apex being
the technological system of a truck. According to Clark’s reasoning, the direct sub‐functions would be
something like motive power, steering, stopping, regulation of speed, load capacity, etc (Clark, 1985).
Technological developments can, and will, be made on all levels in the hierarchy at any point in time.
However, Clark argues that new technology fields that are in the fluid phase, i.e. in the early stages of
the emergence of a new technological paradigm, tend to focus development efforts on a high level in
the hierarchy and the fit of the functional parameter towards the system’s context. As the
technology matures and core concepts appear, focus moves towards the subsidiary problems and
sub‐technologies. However, important to note is that changes in solutions on a higher level, so‐called
radical innovations, might appear at any point in time and consequently erase or change all
1 The basic principles and guidelines of the TRIZ tools are collected online at http://www.triz‐journal.com/archives/2007/12/02/ 2 Technology tree is a concept developed and taught to the authors by CIP (Center for Intellectual Property Studies) in Gothenburg in 2009 through the education Intellectual Capital Management http://www.icm.cip.chalmers.se/home
Competing alternative
Subfunction
31
underlying subsidiary levels (Clark, 1985). Below, we will describe the inception of a technology tree
and some of the most important dynamics of it.
3.2.4.1 Scientific Breakthrough Creates New Technology Paradigms A technology paradigm, i.e. a technology tree, is often initiated by major scientific breakthroughs,
such as the transistor. Such technological breakthroughs are generally followed by a period of highly
uncertain R&D in which firms experiment with the best way of to exploit the opportunities it creates,
e.g. after the automobile was invented in the 1920s, cars and trucks were built with gasoline, electric
and steam engines with steering wheels or tillers and with wooden or metal bodies (Abernathy &
Utterback, 1978). These periods is what Utterback relates to as the fluid phase and leads to a search
for and the establishment of a “normal configuration”, i.e. a set of distinct functions that together
constitute the form of the invention and the beginning of a dominant design (McEvily &
Chakravarthy, 2002; Abernathy & Utterback, 1978; Utterback J. , 1994).
3.2.4.2 A Dominant Design Emerges A dominant design is what Henderson & Clark argue is “characterized both by a set of core design
concepts that correspond to the major functions performed by the product and that are embodied in
components and by a product architecture that defines the ways in which these components are
integrated” (Henderson & Clark, 1990, p. 14). Furthermore, it often emerges in an early maturity
phase of a technology in a response to the opportunity to obtain economies of scale. For a
technology tree, the emergence of a dominant design means that the main functionalities of the
system are set but also that some of the important technology options are preceding.
As an example, a dominant design of an automotive vehicle encompasses not only the fact that it
uses a gasoline engine to provide motive force but also that it is connected to the wheels through a
transmission and a powertrain, and was mounted on a frame rather than on the axles. A dominant
design incorporates a range of basic choices about the design that are not revisited in every
subsequent design. Once the dominant automobile design had been accepted, engineers did not
reevaluate the decision to use a gasoline engine each time they developed a new design. Once any
dominant design is established, the sub‐components are refined and elaborated, and progress takes
the shape of improvements in the components within the framework of a stable architecture
(Henderson & Clark, 1990). In other words, from a technology tree perspective, a dominant design
might mean that competing alternatives are forgotten and that a given alternative might be taken for
granted.
3.2.4.3 After the Fluid Phase; Design Changes and Technology Development Once the normal configuration and a first dominant design has been set, the functions comprising
the normal configuration can be seen and presented as a design hierarchy and a first Technology
tree. From that point, design changes and improvements of various kinds are present. Henderson &
Clark have identified four types of design change that describes new technological knowledge, here
presented in decreasing magnitude of technological improvement (Henderson & Clark, 1990).
Radical Innovation
A radical innovation is a change in a core component or most probably at the top of a technology
hierarchy. Consequently it impacts, erase or change all underlying subsidiary levels (Clark, 1985). It is
important to notice that the top level function is an option in itself, e.g. that a truck could be
replaced with a train since the function is transport. Following the event of a radical innovation, a
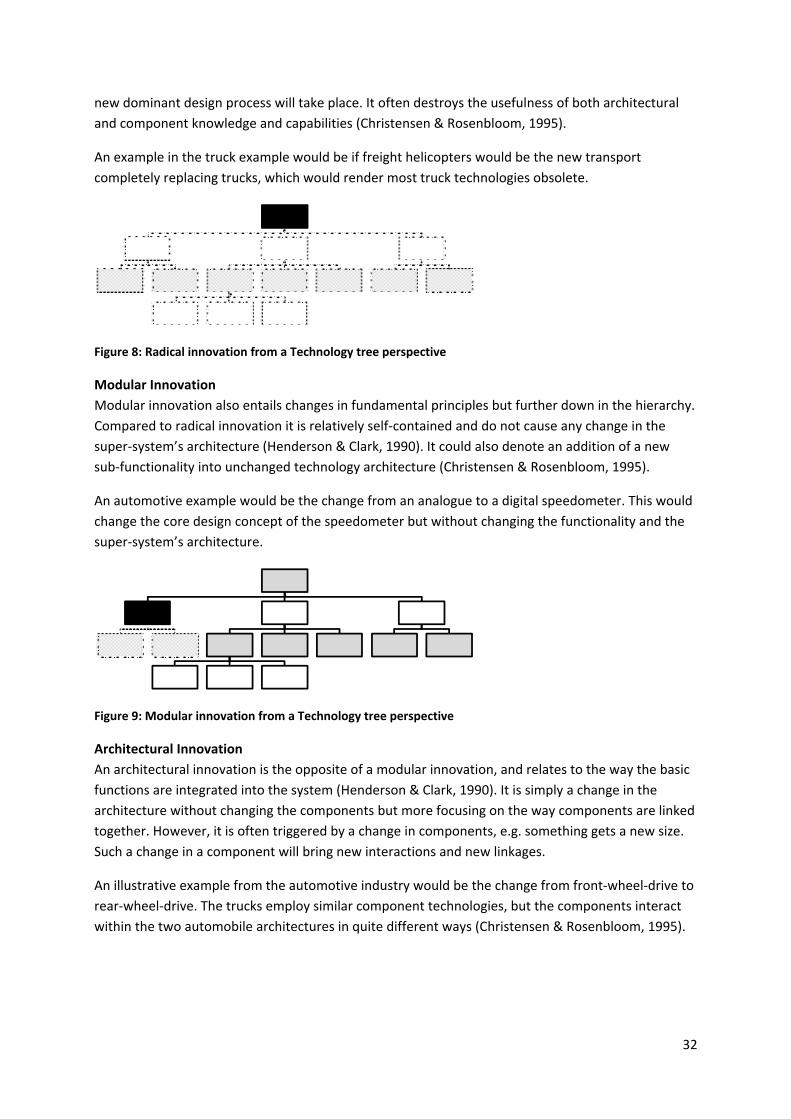
32
new dominant design process will take place. It often destroys the usefulness of both architectural
and component knowledge and capabilities (Christensen & Rosenbloom, 1995).
An example in the truck example would be if freight helicopters would be the new transport
completely replacing trucks, which would render most truck technologies obsolete.
Figure 8: Radical innovation from a Technology tree perspective
Modular Innovation
Modular innovation also entails changes in fundamental principles but further down in the hierarchy.
Compared to radical innovation it is relatively self‐contained and do not cause any change in the
super‐system’s architecture (Henderson & Clark, 1990). It could also denote an addition of a new
sub‐functionality into unchanged technology architecture (Christensen & Rosenbloom, 1995).
An automotive example would be the change from an analogue to a digital speedometer. This would
change the core design concept of the speedometer but without changing the functionality and the
super‐system’s architecture.
Figure 9: Modular innovation from a Technology tree perspective
Architectural Innovation
An architectural innovation is the opposite of a modular innovation, and relates to the way the basic
functions are integrated into the system (Henderson & Clark, 1990). It is simply a change in the
architecture without changing the components but more focusing on the way components are linked
together. However, it is often triggered by a change in components, e.g. something gets a new size.
Such a change in a component will bring new interactions and new linkages.
An illustrative example from the automotive industry would be the change from front‐wheel‐drive to
rear‐wheel‐drive. The trucks employ similar component technologies, but the components interact
within the two automobile architectures in quite different ways (Christensen & Rosenbloom, 1995).
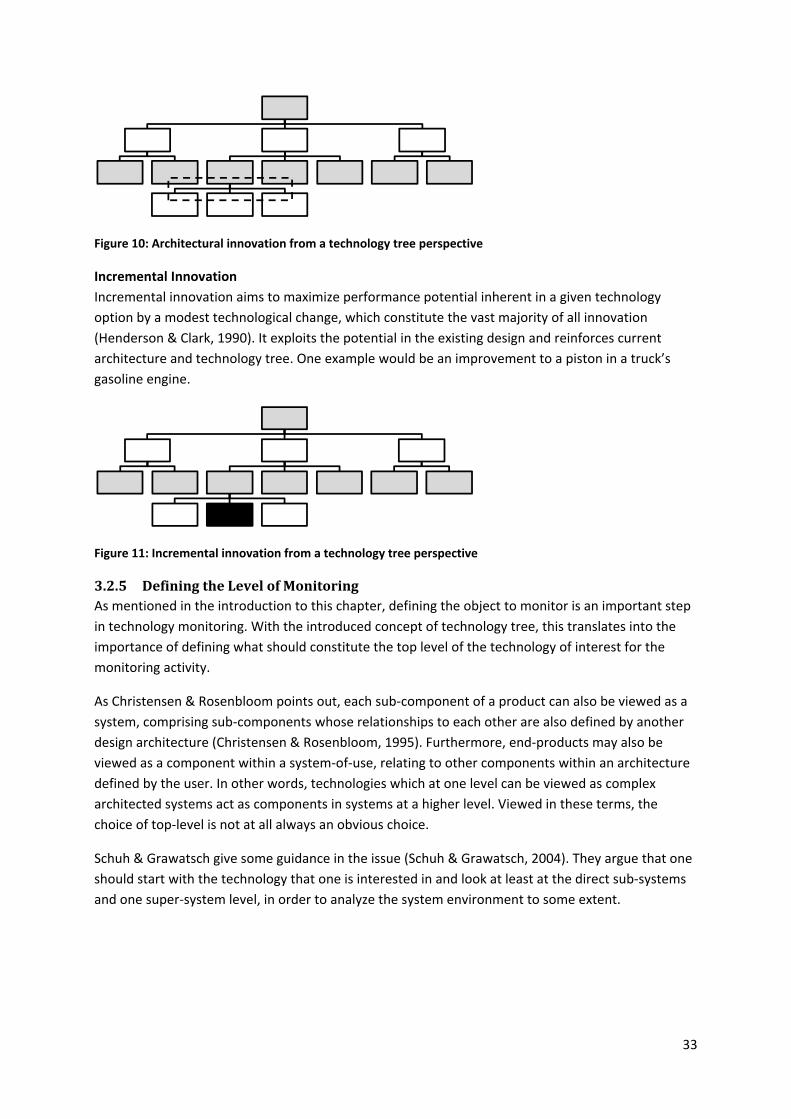
33
Figure 10: Architectural innovation from a technology tree perspective
Incremental Innovation
Incremental innovation aims to maximize performance potential inherent in a given technology
option by a modest technological change, which constitute the vast majority of all innovation
(Henderson & Clark, 1990). It exploits the potential in the existing design and reinforces current
architecture and technology tree. One example would be an improvement to a piston in a truck’s
gasoline engine.
Figure 11: Incremental innovation from a technology tree perspective
3.2.5 Defining the Level of Monitoring As mentioned in the introduction to this chapter, defining the object to monitor is an important step
in technology monitoring. With the introduced concept of technology tree, this translates into the
importance of defining what should constitute the top level of the technology of interest for the
monitoring activity.
As Christensen & Rosenbloom points out, each sub‐component of a product can also be viewed as a
system, comprising sub‐components whose relationships to each other are also defined by another
design architecture (Christensen & Rosenbloom, 1995). Furthermore, end‐products may also be
viewed as a component within a system‐of‐use, relating to other components within an architecture
defined by the user. In other words, technologies which at one level can be viewed as complex
architected systems act as components in systems at a higher level. Viewed in these terms, the
choice of top‐level is not at all always an obvious choice.
Schuh & Grawatsch give some guidance in the issue (Schuh & Grawatsch, 2004). They argue that one
should start with the technology that one is interested in and look at least at the direct sub‐systems
and one super‐system level, in order to analyze the system environment to some extent.
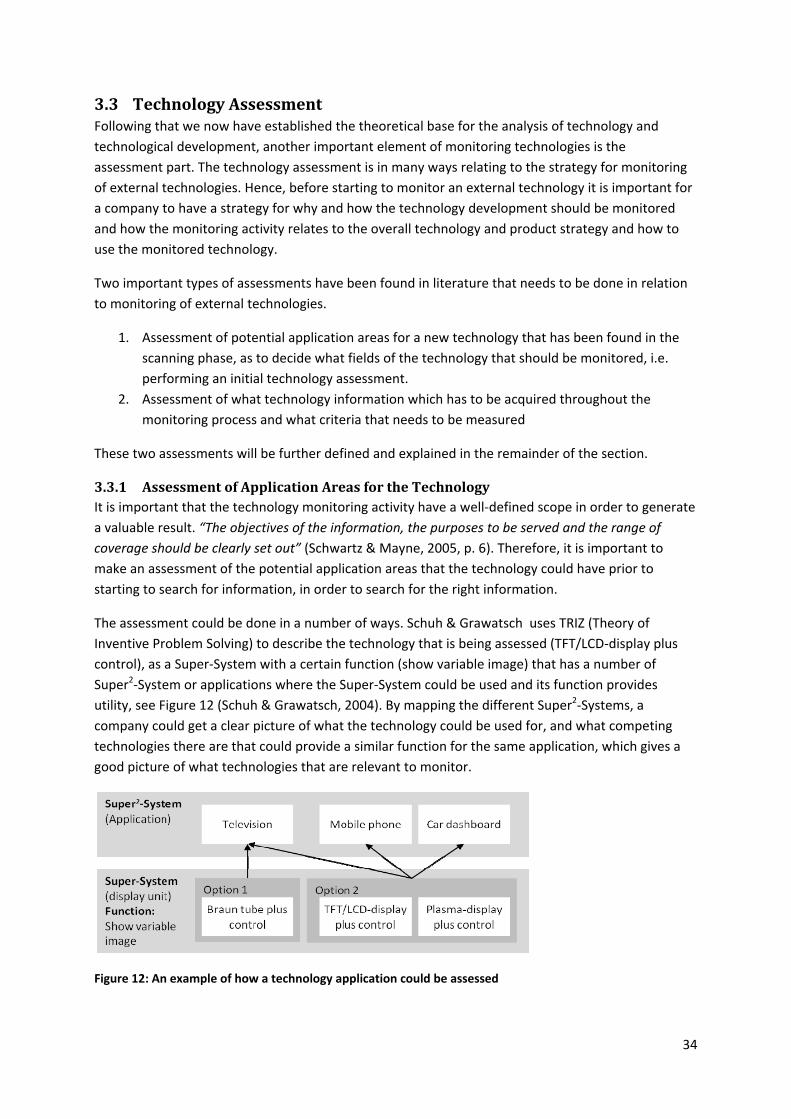
34
3.3 Technology Assessment Following that we now have established the theoretical base for the analysis of technology and
technological development, another important element of monitoring technologies is the
assessment part. The technology assessment is in many ways relating to the strategy for monitoring
of external technologies. Hence, before starting to monitor an external technology it is important for
a company to have a strategy for why and how the technology development should be monitored
and how the monitoring activity relates to the overall technology and product strategy and how to
use the monitored technology.
Two important types of assessments have been found in literature that needs to be done in relation
to monitoring of external technologies.
1. Assessment of potential application areas for a new technology that has been found in the
scanning phase, as to decide what fields of the technology that should be monitored, i.e.
performing an initial technology assessment.
2. Assessment of what technology information which has to be acquired throughout the
monitoring process and what criteria that needs to be measured
These two assessments will be further defined and explained in the remainder of the section.
3.3.1 Assessment of Application Areas for the Technology It is important that the technology monitoring activity have a well‐defined scope in order to generate
a valuable result. “The objectives of the information, the purposes to be served and the range of
coverage should be clearly set out” (Schwartz & Mayne, 2005, p. 6). Therefore, it is important to
make an assessment of the potential application areas that the technology could have prior to
starting to search for information, in order to search for the right information.
The assessment could be done in a number of ways. Schuh & Grawatsch uses TRIZ (Theory of
Inventive Problem Solving) to describe the technology that is being assessed (TFT/LCD‐display plus
control), as a Super‐System with a certain function (show variable image) that has a number of
Super2‐System or applications where the Super‐System could be used and its function provides
utility, see Figure 12 (Schuh & Grawatsch, 2004). By mapping the different Super2‐Systems, a
company could get a clear picture of what the technology could be used for, and what competing
technologies there are that could provide a similar function for the same application, which gives a
good picture of what technologies that are relevant to monitor.
Figure 12: An example of how a technology application could be assessed
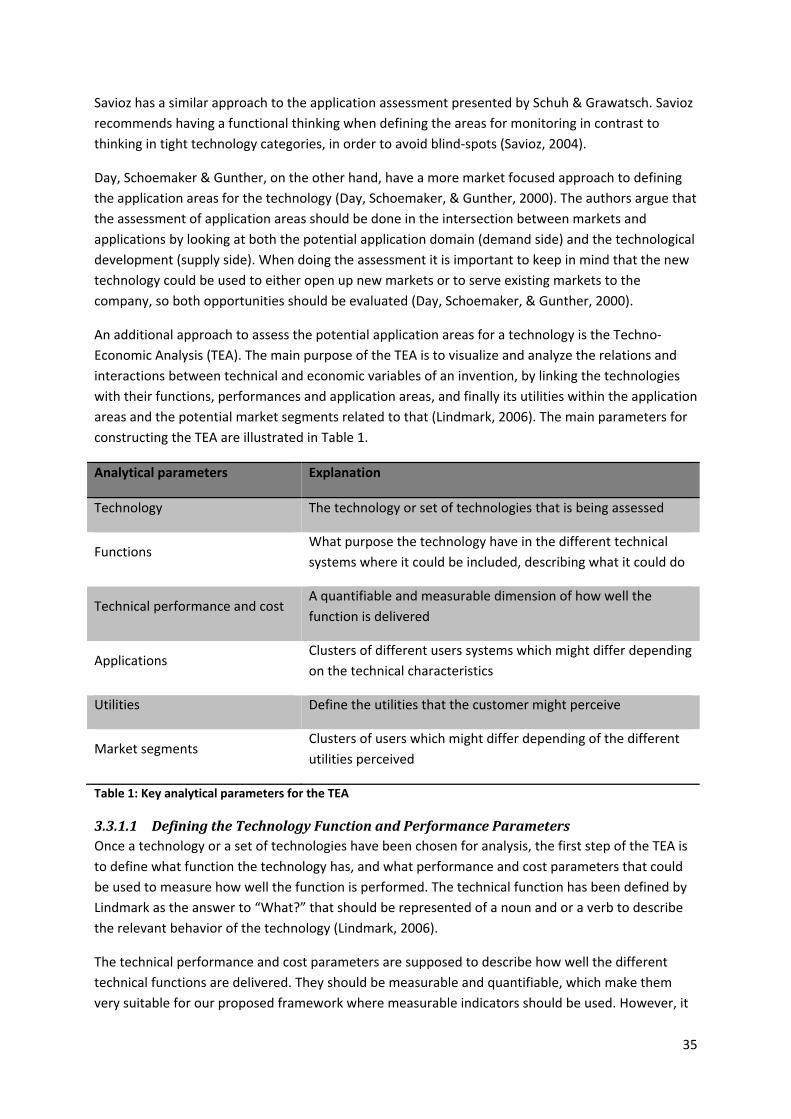
35
Savioz has a similar approach to the application assessment presented by Schuh & Grawatsch. Savioz
recommends having a functional thinking when defining the areas for monitoring in contrast to
thinking in tight technology categories, in order to avoid blind‐spots (Savioz, 2004).
Day, Schoemaker & Gunther, on the other hand, have a more market focused approach to defining
the application areas for the technology (Day, Schoemaker, & Gunther, 2000). The authors argue that
the assessment of application areas should be done in the intersection between markets and
applications by looking at both the potential application domain (demand side) and the technological
development (supply side). When doing the assessment it is important to keep in mind that the new
technology could be used to either open up new markets or to serve existing markets to the
company, so both opportunities should be evaluated (Day, Schoemaker, & Gunther, 2000).
An additional approach to assess the potential application areas for a technology is the Techno‐
Economic Analysis (TEA). The main purpose of the TEA is to visualize and analyze the relations and
interactions between technical and economic variables of an invention, by linking the technologies
with their functions, performances and application areas, and finally its utilities within the application
areas and the potential market segments related to that (Lindmark, 2006). The main parameters for
constructing the TEA are illustrated in Table 1.
Analytical parameters Explanation
Technology The technology or set of technologies that is being assessed
Functions What purpose the technology have in the different technical
systems where it could be included, describing what it could do
Technical performance and cost A quantifiable and measurable dimension of how well the
function is delivered
Applications Clusters of different users systems which might differ depending
on the technical characteristics
Utilities Define the utilities that the customer might perceive
Market segments Clusters of users which might differ depending of the different
utilities perceived
Table 1: Key analytical parameters for the TEA
3.3.1.1 Defining the Technology Function and Performance Parameters Once a technology or a set of technologies have been chosen for analysis, the first step of the TEA is
to define what function the technology has, and what performance and cost parameters that could
be used to measure how well the function is performed. The technical function has been defined by
Lindmark as the answer to “What?” that should be represented of a noun and or a verb to describe
the relevant behavior of the technology (Lindmark, 2006).
The technical performance and cost parameters are supposed to describe how well the different
technical functions are delivered. They should be measurable and quantifiable, which make them
very suitable for our proposed framework where measurable indicators should be used. However, it
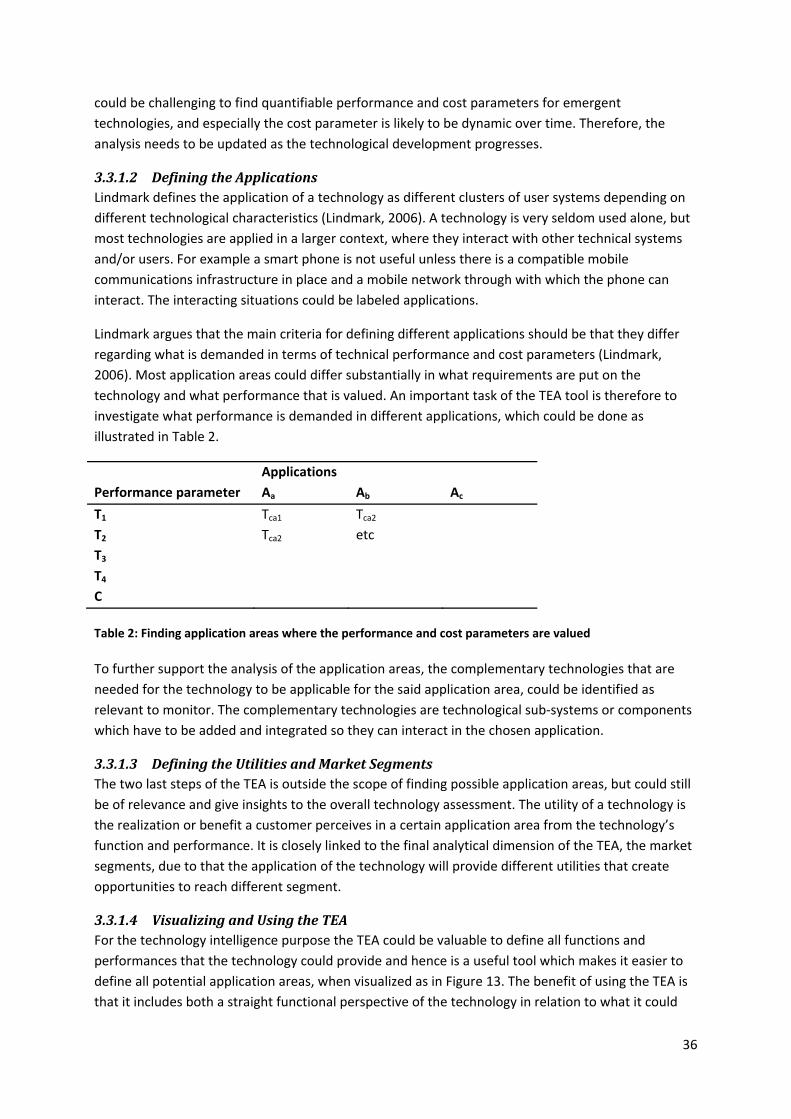
36
could be challenging to find quantifiable performance and cost parameters for emergent
technologies, and especially the cost parameter is likely to be dynamic over time. Therefore, the
analysis needs to be updated as the technological development progresses.
3.3.1.2 Defining the Applications Lindmark defines the application of a technology as different clusters of user systems depending on
different technological characteristics (Lindmark, 2006). A technology is very seldom used alone, but
most technologies are applied in a larger context, where they interact with other technical systems
and/or users. For example a smart phone is not useful unless there is a compatible mobile
communications infrastructure in place and a mobile network through with which the phone can
interact. The interacting situations could be labeled applications.
Lindmark argues that the main criteria for defining different applications should be that they differ
regarding what is demanded in terms of technical performance and cost parameters (Lindmark,
2006). Most application areas could differ substantially in what requirements are put on the
technology and what performance that is valued. An important task of the TEA tool is therefore to
investigate what performance is demanded in different applications, which could be done as
illustrated in Table 2.
Performance parameter
Applications
Aa
Ab
Ac
T1 Tca1 Tca2
T2 Tca2 etc
T3
T4
C
Table 2: Finding application areas where the performance and cost parameters are valued
To further support the analysis of the application areas, the complementary technologies that are
needed for the technology to be applicable for the said application area, could be identified as
relevant to monitor. The complementary technologies are technological sub‐systems or components
which have to be added and integrated so they can interact in the chosen application.
3.3.1.3 Defining the Utilities and Market Segments The two last steps of the TEA is outside the scope of finding possible application areas, but could still
be of relevance and give insights to the overall technology assessment. The utility of a technology is
the realization or benefit a customer perceives in a certain application area from the technology’s
function and performance. It is closely linked to the final analytical dimension of the TEA, the market
segments, due to that the application of the technology will provide different utilities that create
opportunities to reach different segment.
3.3.1.4 Visualizing and Using the TEA For the technology intelligence purpose the TEA could be valuable to define all functions and
performances that the technology could provide and hence is a useful tool which makes it easier to
define all potential application areas, when visualized as in Figure 13. The benefit of using the TEA is
that it includes both a straight functional perspective of the technology in relation to what it could
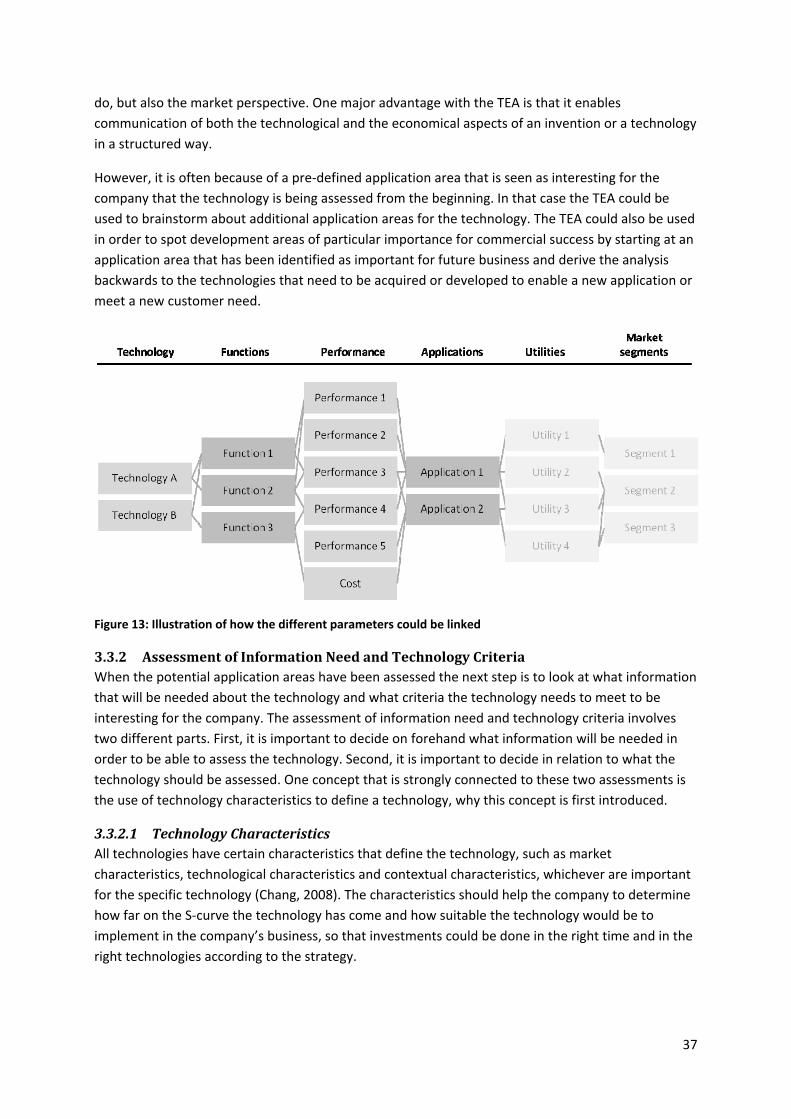
37
do, but also the market perspective. One major advantage with the TEA is that it enables
communication of both the technological and the economical aspects of an invention or a technology
in a structured way.
However, it is often because of a pre‐defined application area that is seen as interesting for the
company that the technology is being assessed from the beginning. In that case the TEA could be
used to brainstorm about additional application areas for the technology. The TEA could also be used
in order to spot development areas of particular importance for commercial success by starting at an
application area that has been identified as important for future business and derive the analysis
backwards to the technologies that need to be acquired or developed to enable a new application or
meet a new customer need.
Figure 13: Illustration of how the different parameters could be linked
3.3.2 Assessment of Information Need and Technology Criteria When the potential application areas have been assessed the next step is to look at what information
that will be needed about the technology and what criteria the technology needs to meet to be
interesting for the company. The assessment of information need and technology criteria involves
two different parts. First, it is important to decide on forehand what information will be needed in
order to be able to assess the technology. Second, it is important to decide in relation to what the
technology should be assessed. One concept that is strongly connected to these two assessments is
the use of technology characteristics to define a technology, why this concept is first introduced.
3.3.2.1 Technology Characteristics All technologies have certain characteristics that define the technology, such as market
characteristics, technological characteristics and contextual characteristics, whichever are important
for the specific technology (Chang, 2008). The characteristics should help the company to determine
how far on the S‐curve the technology has come and how suitable the technology would be to
implement in the company’s business, so that investments could be done in the right time and in the
right technologies according to the strategy.
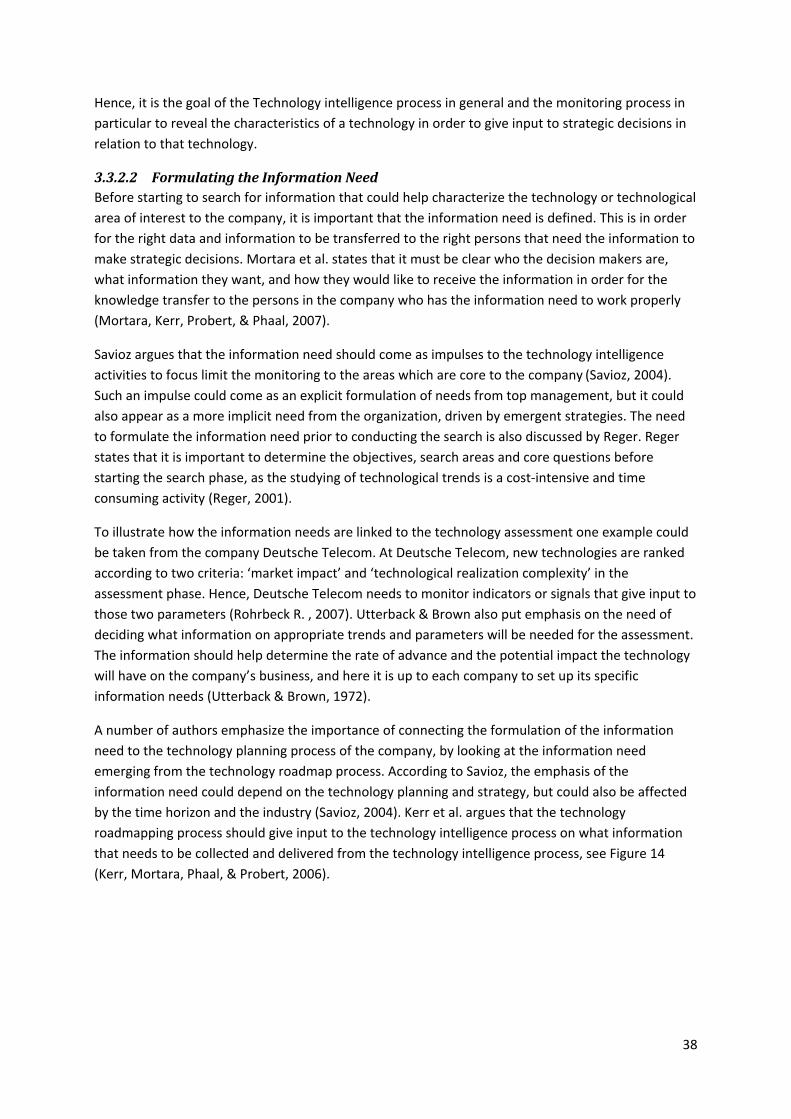
38
Hence, it is the goal of the Technology intelligence process in general and the monitoring process in
particular to reveal the characteristics of a technology in order to give input to strategic decisions in
relation to that technology.
3.3.2.2 Formulating the Information Need Before starting to search for information that could help characterize the technology or technological
area of interest to the company, it is important that the information need is defined. This is in order
for the right data and information to be transferred to the right persons that need the information to
make strategic decisions. Mortara et al. states that it must be clear who the decision makers are,
what information they want, and how they would like to receive the information in order for the
knowledge transfer to the persons in the company who has the information need to work properly
(Mortara, Kerr, Probert, & Phaal, 2007).
Savioz argues that the information need should come as impulses to the technology intelligence
activities to focus limit the monitoring to the areas which are core to the company (Savioz, 2004).
Such an impulse could come as an explicit formulation of needs from top management, but it could
also appear as a more implicit need from the organization, driven by emergent strategies. The need
to formulate the information need prior to conducting the search is also discussed by Reger. Reger
states that it is important to determine the objectives, search areas and core questions before
starting the search phase, as the studying of technological trends is a cost‐intensive and time
consuming activity (Reger, 2001).
To illustrate how the information needs are linked to the technology assessment one example could
be taken from the company Deutsche Telecom. At Deutsche Telecom, new technologies are ranked
according to two criteria: ‘market impact’ and ‘technological realization complexity’ in the
assessment phase. Hence, Deutsche Telecom needs to monitor indicators or signals that give input to
those two parameters (Rohrbeck R. , 2007). Utterback & Brown also put emphasis on the need of
deciding what information on appropriate trends and parameters will be needed for the assessment.
The information should help determine the rate of advance and the potential impact the technology
will have on the company’s business, and here it is up to each company to set up its specific
information needs (Utterback & Brown, 1972).
A number of authors emphasize the importance of connecting the formulation of the information
need to the technology planning process of the company, by looking at the information need
emerging from the technology roadmap process. According to Savioz, the emphasis of the
information need could depend on the technology planning and strategy, but could also be affected
by the time horizon and the industry (Savioz, 2004). Kerr et al. argues that the technology
roadmapping process should give input to the technology intelligence process on what information
that needs to be collected and delivered from the technology intelligence process, see Figure 14
(Kerr, Mortara, Phaal, & Probert, 2006).
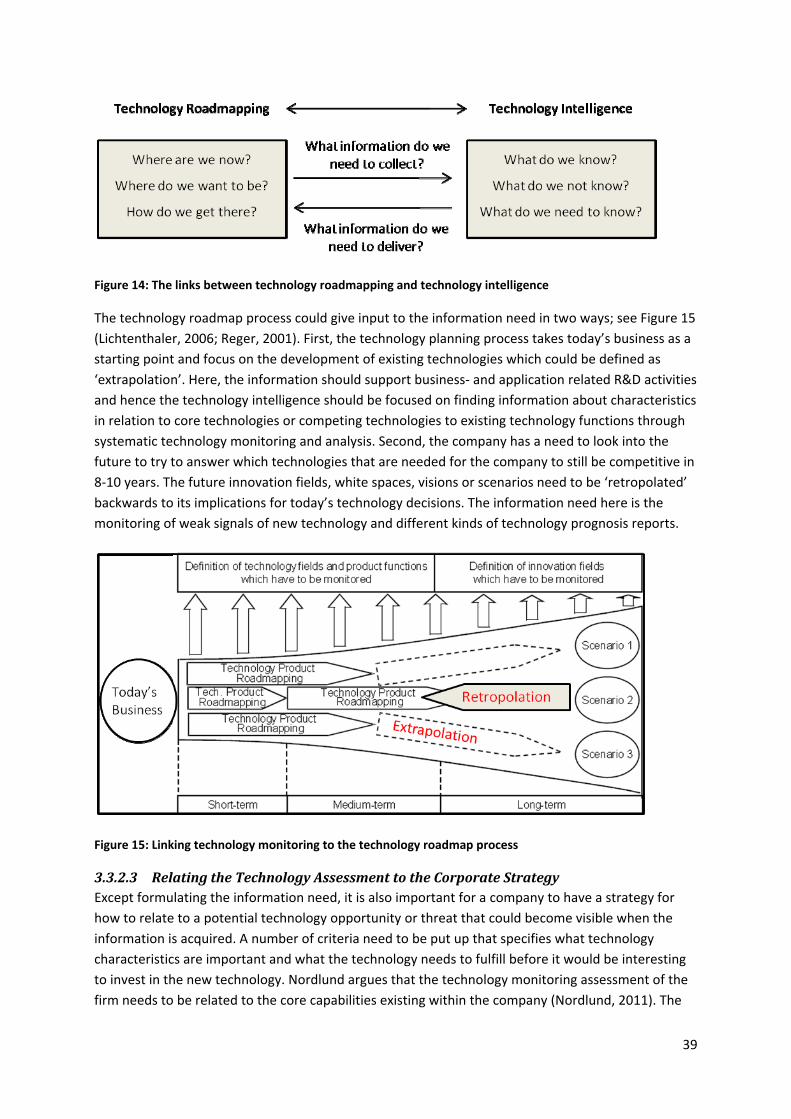
39
Figure 14: The links between technology roadmapping and technology intelligence
The technology roadmap process could give input to the information need in two ways; see Figure 15
(Lichtenthaler, 2006; Reger, 2001). First, the technology planning process takes today’s business as a
starting point and focus on the development of existing technologies which could be defined as
‘extrapolation’. Here, the information should support business‐ and application related R&D activities
and hence the technology intelligence should be focused on finding information about characteristics
in relation to core technologies or competing technologies to existing technology functions through
systematic technology monitoring and analysis. Second, the company has a need to look into the
future to try to answer which technologies that are needed for the company to still be competitive in
8‐10 years. The future innovation fields, white spaces, visions or scenarios need to be ‘retropolated’
backwards to its implications for today’s technology decisions. The information need here is the
monitoring of weak signals of new technology and different kinds of technology prognosis reports.
Figure 15: Linking technology monitoring to the technology roadmap process
3.3.2.3 Relating the Technology Assessment to the Corporate Strategy Except formulating the information need, it is also important for a company to have a strategy for
how to relate to a potential technology opportunity or threat that could become visible when the
information is acquired. A number of criteria need to be put up that specifies what technology
characteristics are important and what the technology needs to fulfill before it would be interesting
to invest in the new technology. Nordlund argues that the technology monitoring assessment of the
firm needs to be related to the core capabilities existing within the company (Nordlund, 2011). The
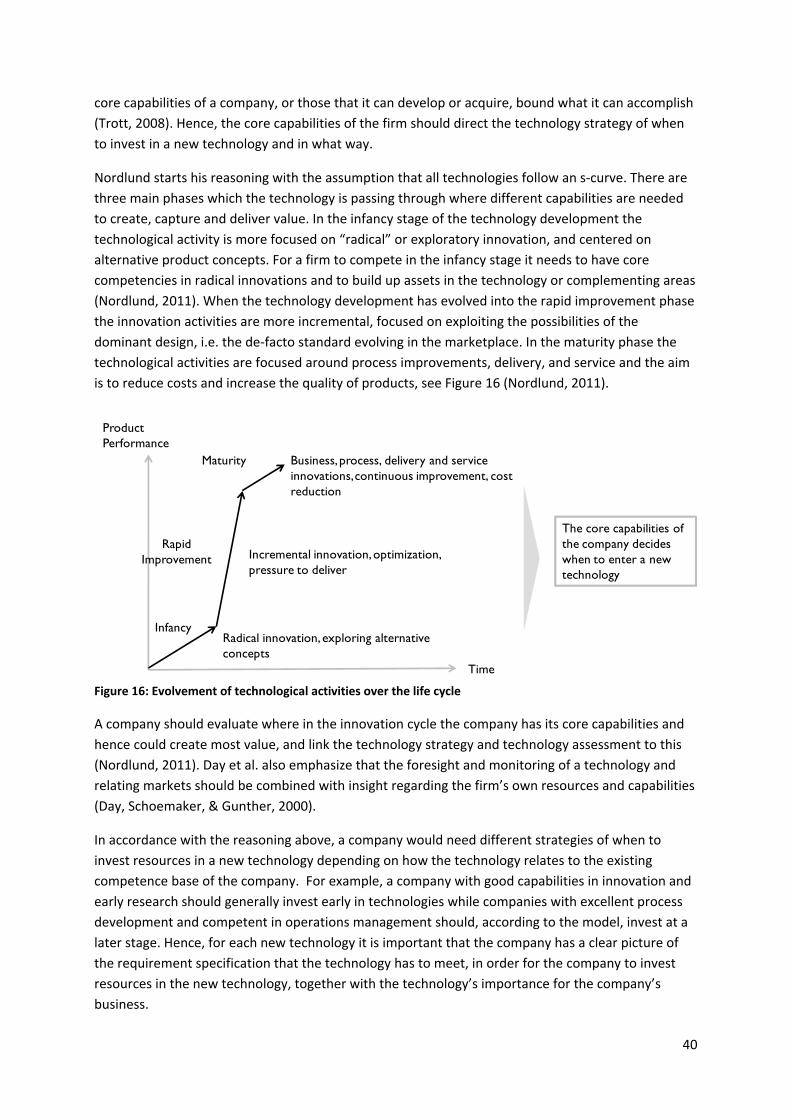
40
core capabilities of a company, or those that it can develop or acquire, bound what it can accomplish
(Trott, 2008). Hence, the core capabilities of the firm should direct the technology strategy of when
to invest in a new technology and in what way.
Nordlund starts his reasoning with the assumption that all technologies follow an s‐curve. There are
three main phases which the technology is passing through where different capabilities are needed
to create, capture and deliver value. In the infancy stage of the technology development the
technological activity is more focused on “radical” or exploratory innovation, and centered on
alternative product concepts. For a firm to compete in the infancy stage it needs to have core
competencies in radical innovations and to build up assets in the technology or complementing areas
(Nordlund, 2011). When the technology development has evolved into the rapid improvement phase
the innovation activities are more incremental, focused on exploiting the possibilities of the
dominant design, i.e. the de‐facto standard evolving in the marketplace. In the maturity phase the
technological activities are focused around process improvements, delivery, and service and the aim
is to reduce costs and increase the quality of products, see Figure 16 (Nordlund, 2011).
Figure 16: Evolvement of technological activities over the life cycle
A company should evaluate where in the innovation cycle the company has its core capabilities and
hence could create most value, and link the technology strategy and technology assessment to this
(Nordlund, 2011). Day et al. also emphasize that the foresight and monitoring of a technology and
relating markets should be combined with insight regarding the firm’s own resources and capabilities
(Day, Schoemaker, & Gunther, 2000).
In accordance with the reasoning above, a company would need different strategies of when to
invest resources in a new technology depending on how the technology relates to the existing
competence base of the company. For example, a company with good capabilities in innovation and
early research should generally invest early in technologies while companies with excellent process
development and competent in operations management should, according to the model, invest at a
later stage. Hence, for each new technology it is important that the company has a clear picture of
the requirement specification that the technology has to meet, in order for the company to invest
resources in the new technology, together with the technology’s importance for the company’s
business.
Time
Product Performance
Infancy
Rapid Improvement
Maturity
Radical innovation, exploring alternative concepts
Incremental innovation, optimization, pressure to deliver
Business, process, delivery and service innovations, continuous improvement, cost reduction
The core capabilities of the company decides when to enter a new technology
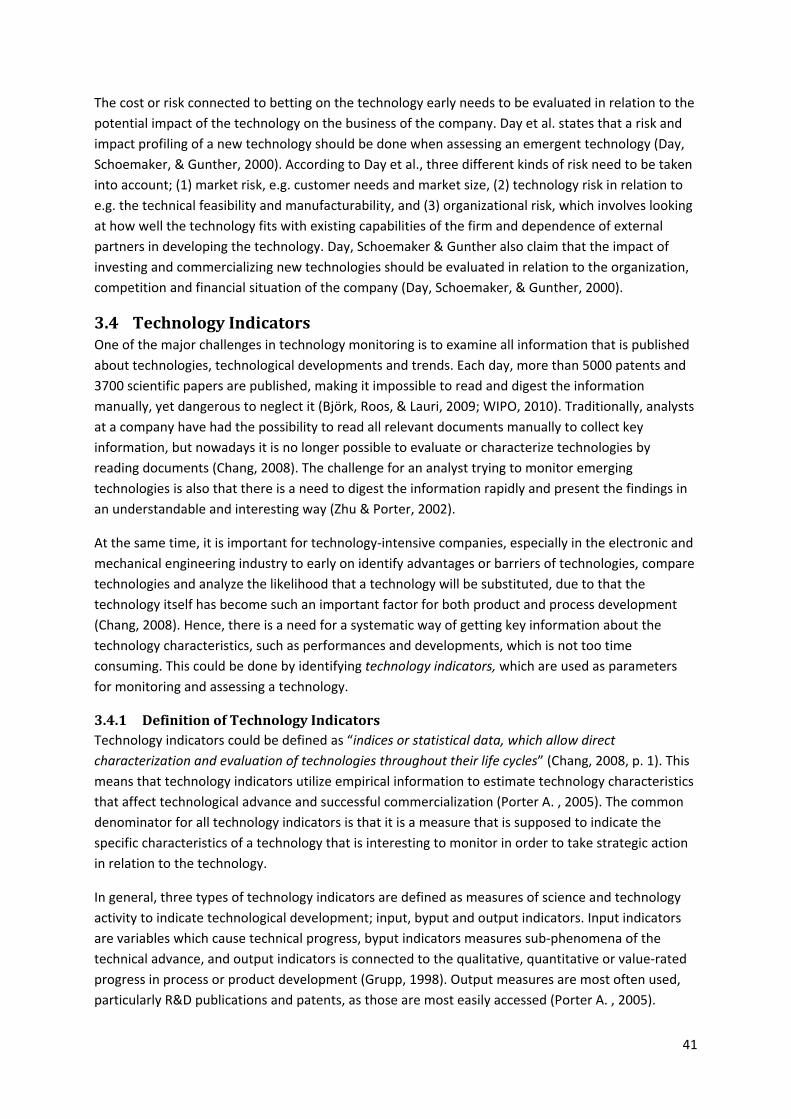
41
The cost or risk connected to betting on the technology early needs to be evaluated in relation to the
potential impact of the technology on the business of the company. Day et al. states that a risk and
impact profiling of a new technology should be done when assessing an emergent technology (Day,
Schoemaker, & Gunther, 2000). According to Day et al., three different kinds of risk need to be taken
into account; (1) market risk, e.g. customer needs and market size, (2) technology risk in relation to
e.g. the technical feasibility and manufacturability, and (3) organizational risk, which involves looking
at how well the technology fits with existing capabilities of the firm and dependence of external
partners in developing the technology. Day, Schoemaker & Gunther also claim that the impact of
investing and commercializing new technologies should be evaluated in relation to the organization,
competition and financial situation of the company (Day, Schoemaker, & Gunther, 2000).
3.4 Technology Indicators One of the major challenges in technology monitoring is to examine all information that is published
about technologies, technological developments and trends. Each day, more than 5000 patents and
3700 scientific papers are published, making it impossible to read and digest the information
manually, yet dangerous to neglect it (Björk, Roos, & Lauri, 2009; WIPO, 2010). Traditionally, analysts
at a company have had the possibility to read all relevant documents manually to collect key
information, but nowadays it is no longer possible to evaluate or characterize technologies by
reading documents (Chang, 2008). The challenge for an analyst trying to monitor emerging
technologies is also that there is a need to digest the information rapidly and present the findings in
an understandable and interesting way (Zhu & Porter, 2002).
At the same time, it is important for technology‐intensive companies, especially in the electronic and
mechanical engineering industry to early on identify advantages or barriers of technologies, compare
technologies and analyze the likelihood that a technology will be substituted, due to that the
technology itself has become such an important factor for both product and process development
(Chang, 2008). Hence, there is a need for a systematic way of getting key information about the
technology characteristics, such as performances and developments, which is not too time
consuming. This could be done by identifying technology indicators, which are used as parameters
for monitoring and assessing a technology.
3.4.1 Definition of Technology Indicators Technology indicators could be defined as “indices or statistical data, which allow direct
characterization and evaluation of technologies throughout their life cycles” (Chang, 2008, p. 1). This
means that technology indicators utilize empirical information to estimate technology characteristics
that affect technological advance and successful commercialization (Porter A. , 2005). The common
denominator for all technology indicators is that it is a measure that is supposed to indicate the
specific characteristics of a technology that is interesting to monitor in order to take strategic action
in relation to the technology.
In general, three types of technology indicators are defined as measures of science and technology
activity to indicate technological development; input, byput and output indicators. Input indicators
are variables which cause technical progress, byput indicators measures sub‐phenomena of the
technical advance, and output indicators is connected to the qualitative, quantitative or value‐rated
progress in process or product development (Grupp, 1998). Output measures are most often used,
particularly R&D publications and patents, as those are most easily accessed (Porter A. , 2005).
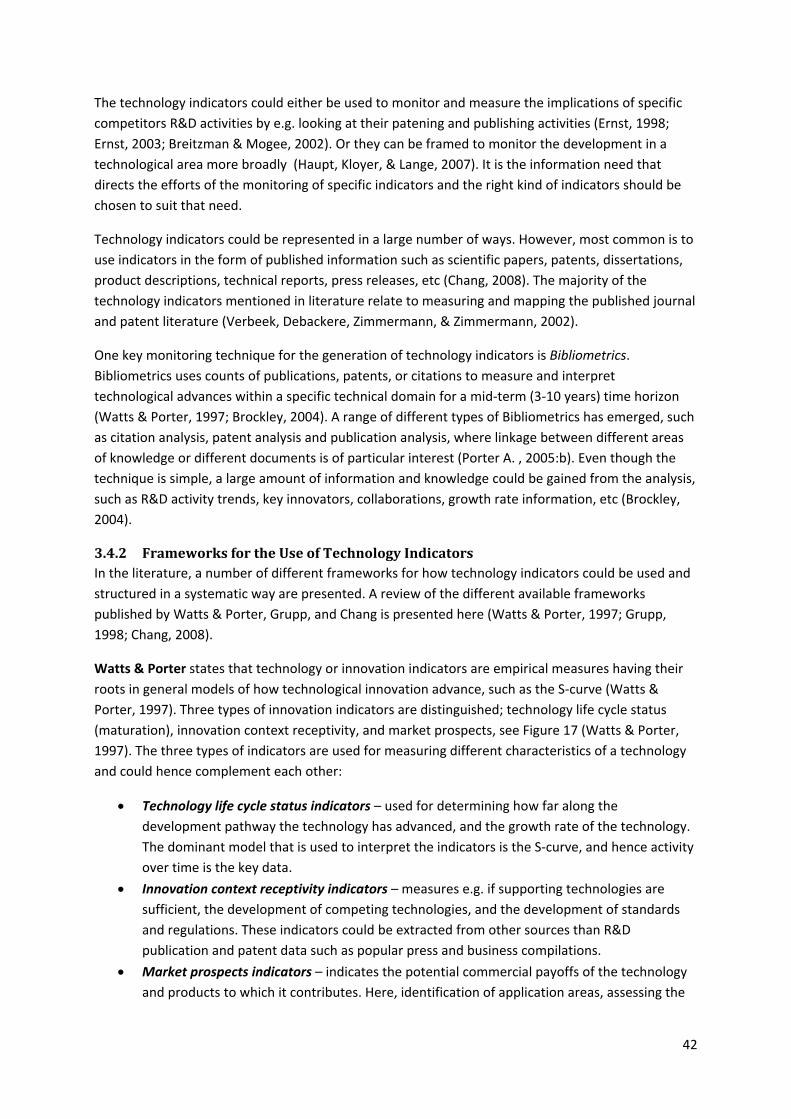
42
The technology indicators could either be used to monitor and measure the implications of specific
competitors R&D activities by e.g. looking at their patening and publishing activities (Ernst, 1998;
Ernst, 2003; Breitzman & Mogee, 2002). Or they can be framed to monitor the development in a
technological area more broadly (Haupt, Kloyer, & Lange, 2007). It is the information need that
directs the efforts of the monitoring of specific indicators and the right kind of indicators should be
chosen to suit that need.
Technology indicators could be represented in a large number of ways. However, most common is to
use indicators in the form of published information such as scientific papers, patents, dissertations,
product descriptions, technical reports, press releases, etc (Chang, 2008). The majority of the
technology indicators mentioned in literature relate to measuring and mapping the published journal
and patent literature (Verbeek, Debackere, Zimmermann, & Zimmermann, 2002).
One key monitoring technique for the generation of technology indicators is Bibliometrics.
Bibliometrics uses counts of publications, patents, or citations to measure and interpret
technological advances within a specific technical domain for a mid‐term (3‐10 years) time horizon
(Watts & Porter, 1997; Brockley, 2004). A range of different types of Bibliometrics has emerged, such
as citation analysis, patent analysis and publication analysis, where linkage between different areas
of knowledge or different documents is of particular interest (Porter A. , 2005:b). Even though the
technique is simple, a large amount of information and knowledge could be gained from the analysis,
such as R&D activity trends, key innovators, collaborations, growth rate information, etc (Brockley,
2004).
3.4.2 Frameworks for the Use of Technology Indicators In the literature, a number of different frameworks for how technology indicators could be used and
structured in a systematic way are presented. A review of the different available frameworks
published by Watts & Porter, Grupp, and Chang is presented here (Watts & Porter, 1997; Grupp,
1998; Chang, 2008).
Watts & Porter states that technology or innovation indicators are empirical measures having their
roots in general models of how technological innovation advance, such as the S‐curve (Watts &
Porter, 1997). Three types of innovation indicators are distinguished; technology life cycle status
(maturation), innovation context receptivity, and market prospects, see Figure 17 (Watts & Porter,
1997). The three types of indicators are used for measuring different characteristics of a technology
and could hence complement each other:
Technology life cycle status indicators – used for determining how far along the
development pathway the technology has advanced, and the growth rate of the technology.
The dominant model that is used to interpret the indicators is the S‐curve, and hence activity
over time is the key data.
Innovation context receptivity indicators – measures e.g. if supporting technologies are
sufficient, the development of competing technologies, and the development of standards
and regulations. These indicators could be extracted from other sources than R&D
publication and patent data such as popular press and business compilations.
Market prospects indicators – indicates the potential commercial payoffs of the technology
and products to which it contributes. Here, identification of application areas, assessing the
43
IP and market strength of competitors and spreading of commercial activity are important
factors to look at.
Figure 17: Watts and Porter’s framework for technology indicators
The framework developed by Watts & Porter includes around 200 technology indicators that could help
help answer, what Watts & Porter call, 39 MOT (Management of Technology) questions which should be
be used for different kinds of technology issues (Porter A. , 2005). The framework is not exhaustive, but it
but it suggests a number of indicators that could be used to answer each question. To show the principle of
principle of the framework, one question together with its indicators is illustrated in Table 3: Extract from
Watts & Porter's framework for technology indicators
.
MOT question Measures & innovation indicators
8. How bright are the development prospects for
this technology?
Scorecard measures for rapid overview of
multiple technologies
Consider separate metrics for emerging vs.
developed technologies
Research activity over time (publications;
patents)
“Evolutionary potential” – Radar charts (adapt
from Mann’s TRIZ dimensions to suit patent and
publication data in this technological domain)
Indicators of “spreading interests” – no. of
organizations of various types engaged, and rate
of change
“Spreading word” – no. of distinct sources
publishing on this technology – trend over time
Research teaming – compare team size (no. of
coauthors) vs. other technologies (more teaming
is a positive indicator)
Table 3: Extract from Watts & Porter's framework for technology indicators
Since technology indicators should always be measured with a purpose, it is of importance that the
right indicators are chosen depending on what technology characteristics that are important for the
specific technology. But one should not just settle down and be satisfied with the indicators that
were chosen initially. Through the experience that is gained when using the indicators, the favored
indicators to help answer these questions would evolve by looking at what information that really
adds value to decision‐making (Porter A. , 2005).
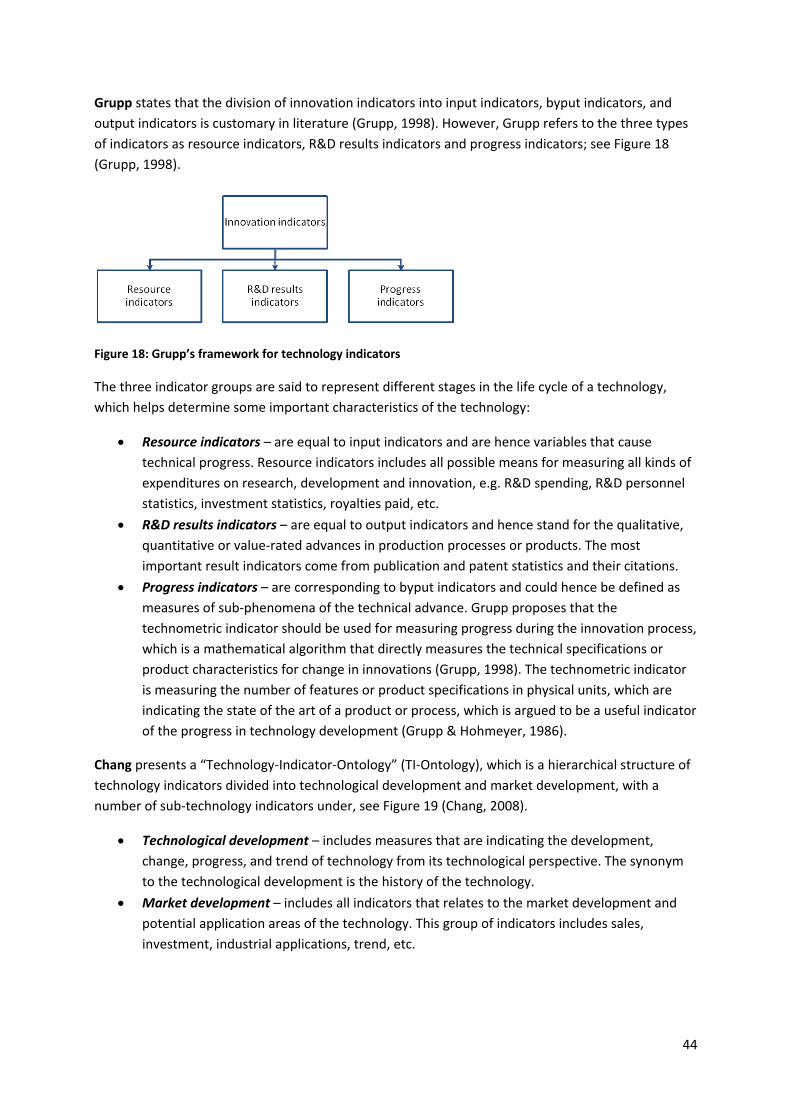
44
Grupp states that the division of innovation indicators into input indicators, byput indicators, and
output indicators is customary in literature (Grupp, 1998). However, Grupp refers to the three types
of indicators as resource indicators, R&D results indicators and progress indicators; see Figure 18
(Grupp, 1998).
Figure 18: Grupp’s framework for technology indicators
The three indicator groups are said to represent different stages in the life cycle of a technology,
which helps determine some important characteristics of the technology:
Resource indicators – are equal to input indicators and are hence variables that cause
technical progress. Resource indicators includes all possible means for measuring all kinds of
expenditures on research, development and innovation, e.g. R&D spending, R&D personnel
statistics, investment statistics, royalties paid, etc.
R&D results indicators – are equal to output indicators and hence stand for the qualitative,
quantitative or value‐rated advances in production processes or products. The most
important result indicators come from publication and patent statistics and their citations.
Progress indicators – are corresponding to byput indicators and could hence be defined as
measures of sub‐phenomena of the technical advance. Grupp proposes that the
technometric indicator should be used for measuring progress during the innovation process,
which is a mathematical algorithm that directly measures the technical specifications or
product characteristics for change in innovations (Grupp, 1998). The technometric indicator
is measuring the number of features or product specifications in physical units, which are
indicating the state of the art of a product or process, which is argued to be a useful indicator
of the progress in technology development (Grupp & Hohmeyer, 1986).
Chang presents a “Technology‐Indicator‐Ontology” (TI‐Ontology), which is a hierarchical structure of
technology indicators divided into technological development and market development, with a
number of sub‐technology indicators under, see Figure 19 (Chang, 2008).
Technological development – includes measures that are indicating the development,
change, progress, and trend of technology from its technological perspective. The synonym
to the technological development is the history of the technology.
Market development – includes all indicators that relates to the market development and
potential application areas of the technology. This group of indicators includes sales,
investment, industrial applications, trend, etc.
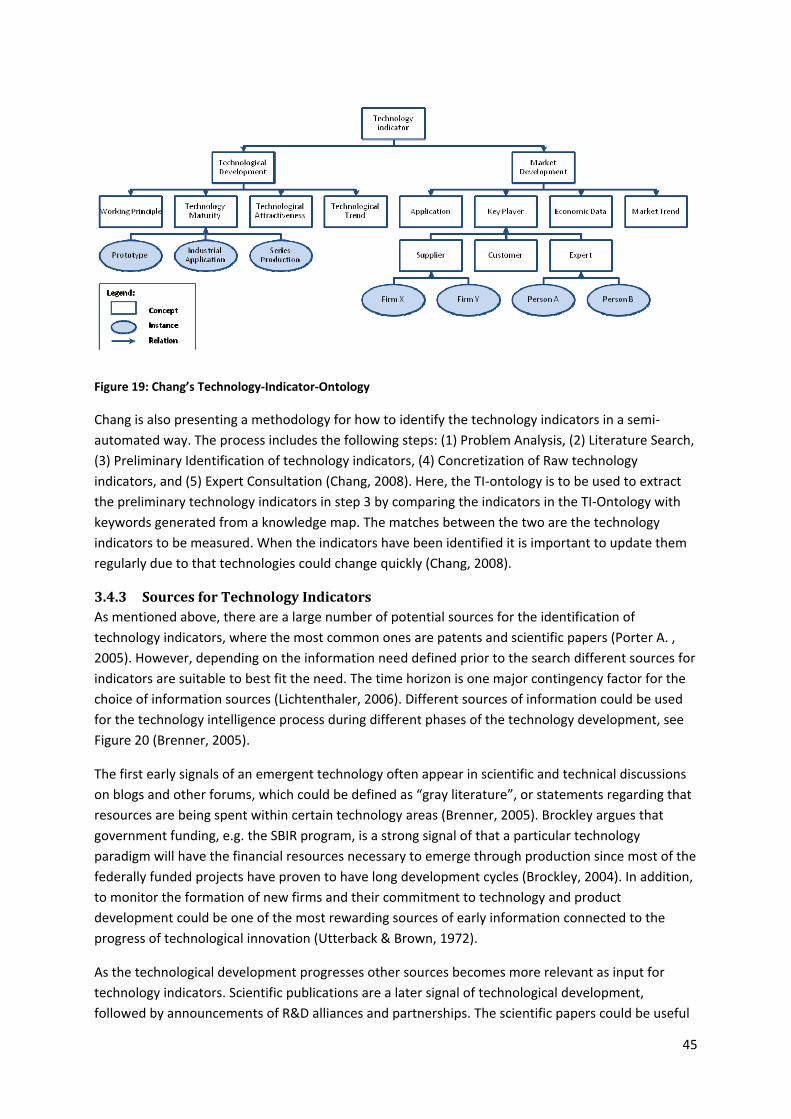
45
Figure 19: Chang’s Technology‐Indicator‐Ontology
Chang is also presenting a methodology for how to identify the technology indicators in a semi‐
automated way. The process includes the following steps: (1) Problem Analysis, (2) Literature Search,
(3) Preliminary Identification of technology indicators, (4) Concretization of Raw technology
indicators, and (5) Expert Consultation (Chang, 2008). Here, the TI‐ontology is to be used to extract
the preliminary technology indicators in step 3 by comparing the indicators in the TI‐Ontology with
keywords generated from a knowledge map. The matches between the two are the technology
indicators to be measured. When the indicators have been identified it is important to update them
regularly due to that technologies could change quickly (Chang, 2008).
3.4.3 Sources for Technology Indicators As mentioned above, there are a large number of potential sources for the identification of
technology indicators, where the most common ones are patents and scientific papers (Porter A. ,
2005). However, depending on the information need defined prior to the search different sources for
indicators are suitable to best fit the need. The time horizon is one major contingency factor for the
choice of information sources (Lichtenthaler, 2006). Different sources of information could be used
for the technology intelligence process during different phases of the technology development, see
Figure 20 (Brenner, 2005).
The first early signals of an emergent technology often appear in scientific and technical discussions
on blogs and other forums, which could be defined as “gray literature”, or statements regarding that
resources are being spent within certain technology areas (Brenner, 2005). Brockley argues that
government funding, e.g. the SBIR program, is a strong signal of that a particular technology
paradigm will have the financial resources necessary to emerge through production since most of the
federally funded projects have proven to have long development cycles (Brockley, 2004). In addition,
to monitor the formation of new firms and their commitment to technology and product
development could be one of the most rewarding sources of early information connected to the
progress of technological innovation (Utterback & Brown, 1972).
As the technological development progresses other sources becomes more relevant as input for
technology indicators. Scientific publications are a later signal of technological development,
followed by announcements of R&D alliances and partnerships. The scientific papers could be useful
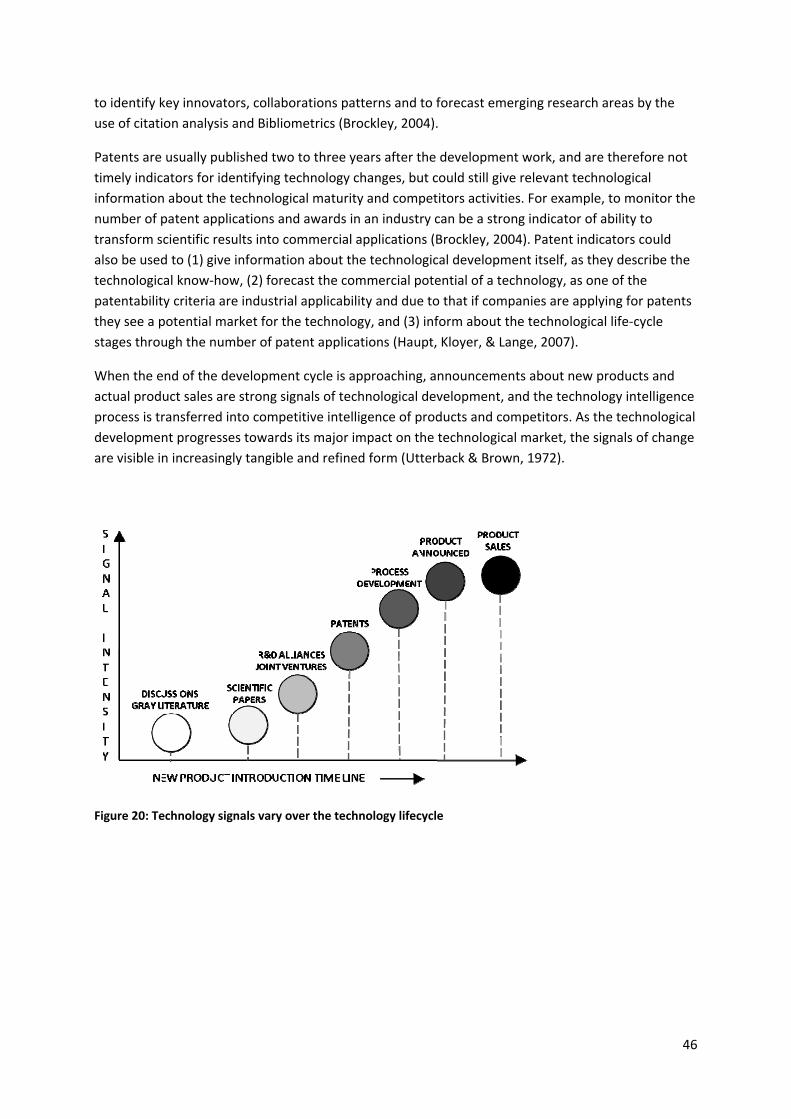
46
to identify key innovators, collaborations patterns and to forecast emerging research areas by the
use of citation analysis and Bibliometrics (Brockley, 2004).
Patents are usually published two to three years after the development work, and are therefore not
timely indicators for identifying technology changes, but could still give relevant technological
information about the technological maturity and competitors activities. For example, to monitor the
number of patent applications and awards in an industry can be a strong indicator of ability to
transform scientific results into commercial applications (Brockley, 2004). Patent indicators could
also be used to (1) give information about the technological development itself, as they describe the
technological know‐how, (2) forecast the commercial potential of a technology, as one of the
patentability criteria are industrial applicability and due to that if companies are applying for patents
they see a potential market for the technology, and (3) inform about the technological life‐cycle
stages through the number of patent applications (Haupt, Kloyer, & Lange, 2007).
When the end of the development cycle is approaching, announcements about new products and
actual product sales are strong signals of technological development, and the technology intelligence
process is transferred into competitive intelligence of products and competitors. As the technological
development progresses towards its major impact on the technological market, the signals of change
are visible in increasingly tangible and refined form (Utterback & Brown, 1972).
Figure 20: Technology signals vary over the technology lifecycle
47
3.5 Communicating Indication Monitoring “To know and not to do is not to know”
‐Lao Tzu, Chinese Taoist philosopher 600BC
3.5.1 Importance of Communication One should not forget that the main underlying reason to perform any kind of technology
intelligence activities is by definition to support decision making. As the activities normally not are
carried out by the persons taking the decisions, the dissemination and visualization of the insights
becomes crucial. Furthermore, in most conceptual models of technology intelligence, dissemination
is highlighted as an important step (Lichtenthaler; Kerr, Mortara, Phaal, & Probert, 2006). In other
words, if the intelligence stays in the hand of the searcher, it is needless to say that it does not really
create any value for anyone.
Accordingly, one could argue that it is an as important issue to present the information in an intuitive
and useful manner as it is to gather the data. However, as Brockley points out, there are several
challenges inherent in this (Brockley, 2004). First of all, technology intelligence in general, but
monitoring with indicators in particular, is all about complex relationships that might be hard to
communicate in an effective manner. Secondly, there are a lot of parameters and perspectives to
include. Thirdly, everyone will have different stakes, e.g. the CEO, CTO and technology specialist, and
one single presentation or communication format is not likely to meet the needs of all users.
All those aggravating factors lead to two main risks (Brockley, 2004). On the one hand we have
oversimplification and a risk of losing the richness and subtle differences of the data. One the other
hand, we have the risk of over‐elaboration by creating elaborate presentations schemes. Then, there
is a risk of losing the effectiveness of communication and losing the intuitive understanding of the
message through extensive explanation or learning about how to read indicator models,. All in all,
communicating monitoring intelligence is a lot about balancing these two risks (Brockley, 2004).
3.5.2 Several Stakeholders As noted, the users of the intelligence vary from time to time. For example, on the one side of the
scale we have the senior management who need the intelligence on an high aggregation level and
with a strong focus on business impact, opportunities and threats (Rohrbeck R. J., 2006). On the
other side of the scale, we have the technical specialist that might want keep up with the detailed
developments in his or her field. Consequently, technology intelligence communication would need
to be able to address a wide set of stakeholders. This puts a lot of pressure on the adaptability of the
technical complexity of the communication, which hence depends on the role that the monitoring
activities have within the organization (Rohrbeck R. J., 2006).
3.5.3 Main Content in Monitoring The obvious core in monitoring is to track indicators over time. As Porter points out, monitoring
makes most sense when it is repeated over time as that makes it easier to detect trends (Porter A. ,
2005). With the data gathered from indicators in Technology monitoring, it is easy to use a wide
variety of graphical representations. However, one needs to balance the use of numbers, pictures
and words to best deliver the message to the customers. In general, multiple indicators for a given
characteristic give a more complete picture (Porter A. , 2005).
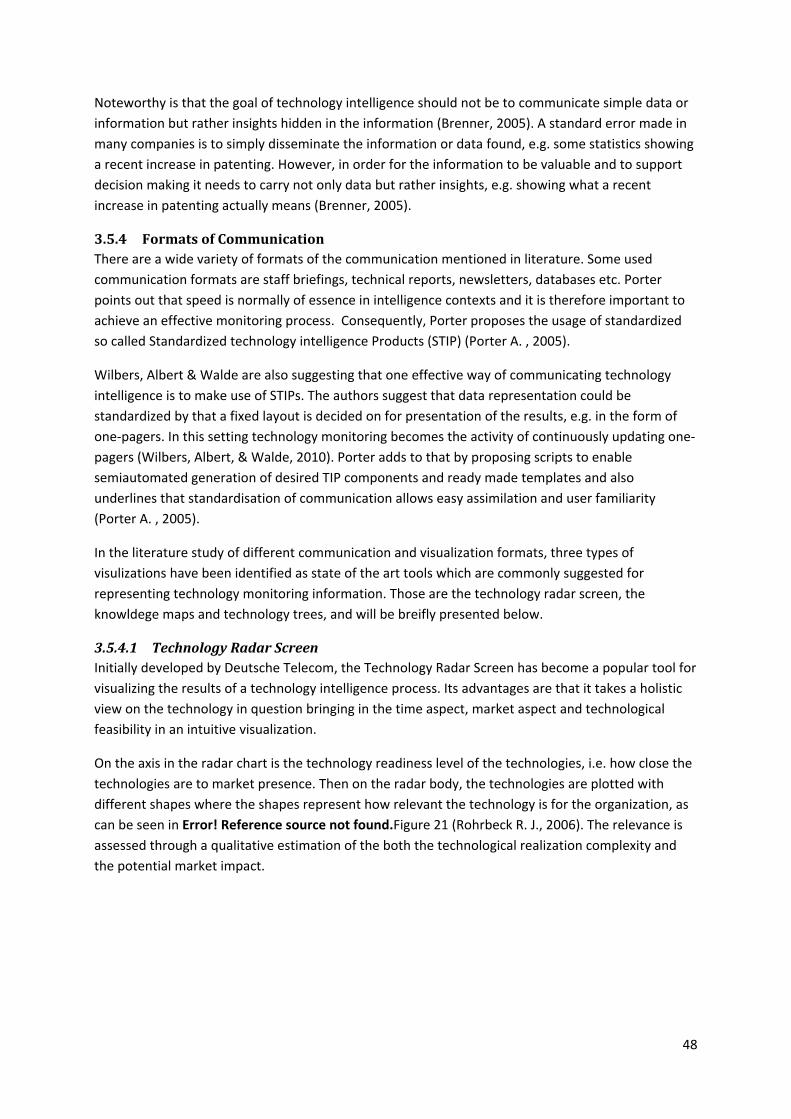
48
Noteworthy is that the goal of technology intelligence should not be to communicate simple data or
information but rather insights hidden in the information (Brenner, 2005). A standard error made in
many companies is to simply disseminate the information or data found, e.g. some statistics showing
a recent increase in patenting. However, in order for the information to be valuable and to support
decision making it needs to carry not only data but rather insights, e.g. showing what a recent
increase in patenting actually means (Brenner, 2005).
3.5.4 Formats of Communication There are a wide variety of formats of the communication mentioned in literature. Some used
communication formats are staff briefings, technical reports, newsletters, databases etc. Porter
points out that speed is normally of essence in intelligence contexts and it is therefore important to
achieve an effective monitoring process. Consequently, Porter proposes the usage of standardized
so called Standardized technology intelligence Products (STIP) (Porter A. , 2005).
Wilbers, Albert & Walde are also suggesting that one effective way of communicating technology
intelligence is to make use of STIPs. The authors suggest that data representation could be
standardized by that a fixed layout is decided on for presentation of the results, e.g. in the form of
one‐pagers. In this setting technology monitoring becomes the activity of continuously updating one‐
pagers (Wilbers, Albert, & Walde, 2010). Porter adds to that by proposing scripts to enable
semiautomated generation of desired TIP components and ready made templates and also
underlines that standardisation of communication allows easy assimilation and user familiarity
(Porter A. , 2005).
In the literature study of different communication and visualization formats, three types of
visulizations have been identified as state of the art tools which are commonly suggested for
representing technology monitoring information. Those are the technology radar screen, the
knowldege maps and technology trees, and will be breifly presented below.
3.5.4.1 Technology Radar Screen Initially developed by Deutsche Telecom, the Technology Radar Screen has become a popular tool for
visualizing the results of a technology intelligence process. Its advantages are that it takes a holistic
view on the technology in question bringing in the time aspect, market aspect and technological
feasibility in an intuitive visualization.
On the axis in the radar chart is the technology readiness level of the technologies, i.e. how close the
technologies are to market presence. Then on the radar body, the technologies are plotted with
different shapes where the shapes represent how relevant the technology is for the organization, as
can be seen in Error! Reference source not found.Figure 21 (Rohrbeck R. J., 2006). The relevance is
assessed through a qualitative estimation of the both the technological realization complexity and
the potential market impact.
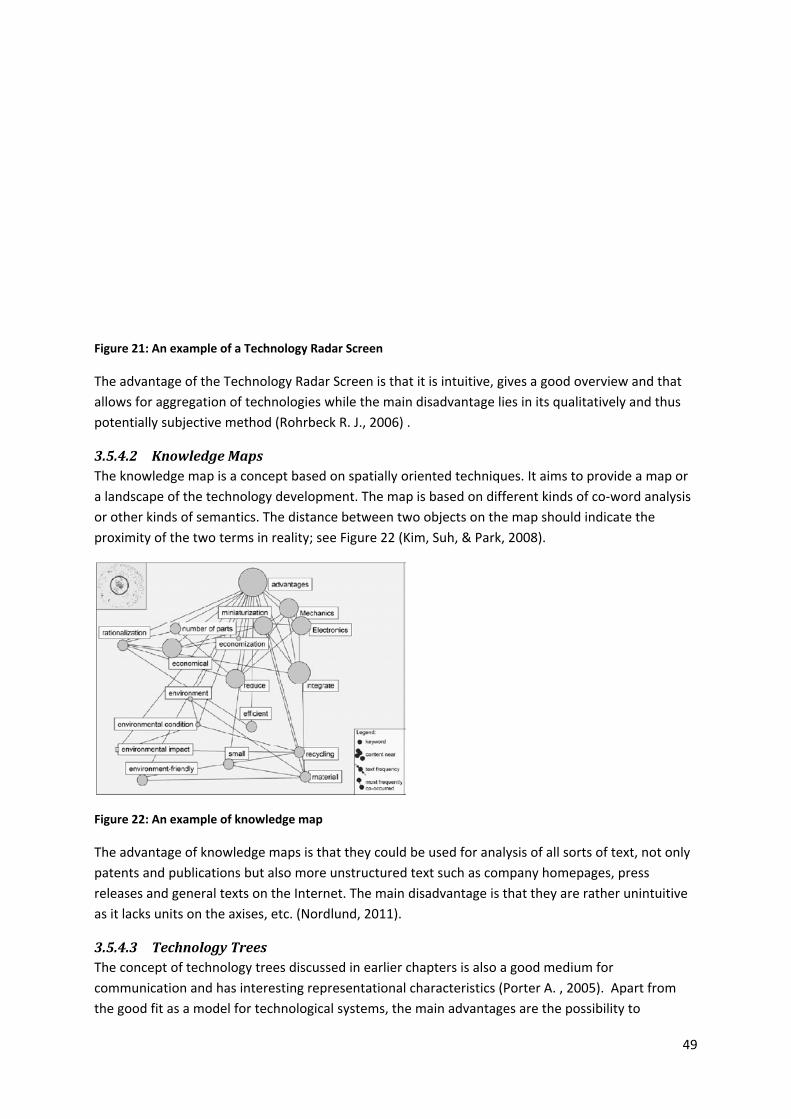
49
Figure 21: An example of a Technology Radar Screen
The advantage of the Technology Radar Screen is that it is intuitive, gives a good overview and that
allows for aggregation of technologies while the main disadvantage lies in its qualitatively and thus
potentially subjective method (Rohrbeck R. J., 2006) .
3.5.4.2 Knowledge Maps The knowledge map is a concept based on spatially oriented techniques. It aims to provide a map or
a landscape of the technology development. The map is based on different kinds of co‐word analysis
or other kinds of semantics. The distance between two objects on the map should indicate the
proximity of the two terms in reality; see Figure 22 (Kim, Suh, & Park, 2008).
Figure 22: An example of knowledge map
The advantage of knowledge maps is that they could be used for analysis of all sorts of text, not only
patents and publications but also more unstructured text such as company homepages, press
releases and general texts on the Internet. The main disadvantage is that they are rather unintuitive
as it lacks units on the axises, etc. (Nordlund, 2011).
3.5.4.3 Technology Trees The concept of technology trees discussed in earlier chapters is also a good medium for
communication and has interesting representational characteristics (Porter A. , 2005). Apart from
the good fit as a model for technological systems, the main advantages are the possibility to
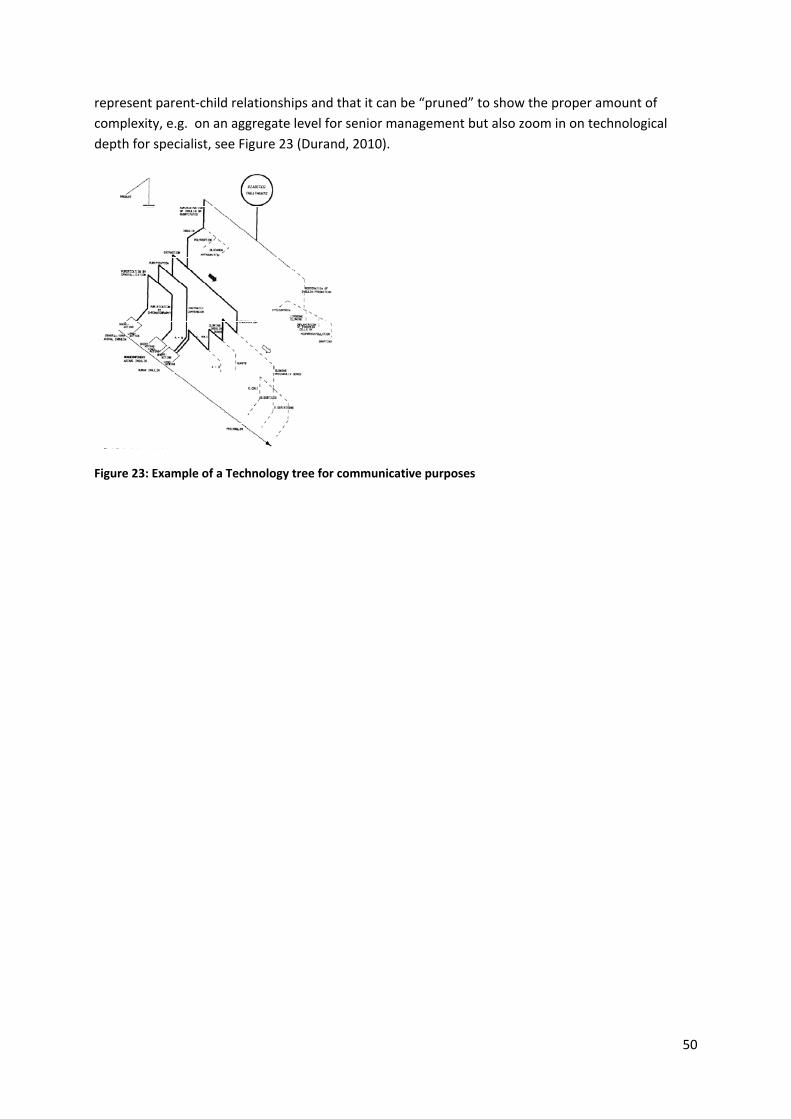
50
represent parent‐child relationships and that it can be “pruned” to show the proper amount of
complexity, e.g. on an aggregate level for senior management but also zoom in on technological
depth for specialist, see Figure 23 (Durand, 2010).
Figure 23: Example of a Technology tree for communicative purposes
51
4 Small Scale Case Studies This section consists of description from the three small‐scale case studies performed at three
technology‐intensive large Swedish companies. The small‐scale case studies were done in order to get
an understanding of what is currently done in industry in relation to technology intelligence, and for
each of the companies their organization is described, together with how they conduct technology
monitoring and how technology intelligence information is communicated. Company A is described in
section 4.1, Company B in section 4.2, followed by Company C in section 4.3.
The scope of the case study was not limited to technology monitoring only but spans the whole
spectra of technology intelligence. The purpose behind this was to get a broad understanding of how
Intelligence activities is carried out but also to learn about how monitoring fits into its larger context
of technology intelligence.
4.1 Company A Company A is a global research‐based company within the pharmaceutical and biomedicine industry
with an R&D budget of more than $4 billion per year. Within the pharmaceutical industry in general,
technology intelligence is of major importance due to that most innovations are driven by science in
universities and start‐ups, which are often later acquired by the pharmaceutical companies. Since it is
only the first one to market with a new drug who has the chance to get return on the investment,
technology intelligence capabilities are crucial (Lichtenthaler, 2006). Hence, competitors, universities
and start‐ups are monitored very systematically, which is also the case for Company A. In the case
study a Competitive Intelligence Manager was interviewed, working in one of the research units with
coordinating the intelligence activities.
4.1.1 Organization Company A has an organization for Competitive (Technology) Intelligence which could be seen as
being very similar to what the other two companies in the case study call technology intelligence. For
Company A, Competitive Intelligence is almost identical to technology intelligence since one
company is often developing one single technology in form of e.g. a protein. The Competitive
Intelligence is organized both in form of a global central intelligence group, but also in networks
spread out in the organization, see Figure 24.
52
Figure 24: Organization of Company A's technology intelligence
The technology intelligence processes are carried out on three levels in the organization:
1. Research Function supporting drug development projects. This Research Function is a global
unit with the purpose of discovering enabling science outside of the company, and supplying
the different research units with technology knowledge in areas where they are lacking
competence. The central Research Function is also responsible for monitoring technology
development and to take in what Company A needs in terms of capabilities and technologies.
2. Business Technology Scouts. The Business Technology Scouts are supposed to work with in‐
licensing and acquisitions of external technologies and companies. In this role they are
expected to meet with a large number of start‐up companies, SMEs and universities to find
out more about their technologies and technological developments. The scouts are reporting
to the central Research Function and to the Strategic Partnering Business Development
group at Company A.
3. Competitive Intelligence Manager and Research Technology Scouts in the Research Units.
Each research unit has a Competitive Intelligence Manager (CI Manager) that is coordinating
the technology intelligence activities within that unit. The responsibility of the CI Manager is
to monitor what the competitors are doing as well as new things happening outside of the
company that could imply an opportunity or threat for the company. Company A has no line
organization or specific group working with technology intelligence at the research unit level,
but instead the CI Manager get the people together that are required to solve a specific task,
such as researchers, regulatory actors and scouts in a network‐based organization. The
Research Technology Scouts has the main responsibility for spotting emerging technologies
as they know the technology field best, and generally have large networks of knowledgeable
people outside the company. For example, Company A has strong connections to some
universities through personal contacts and some strategic partnerships.
At the Research Unit level, two types of Intelligence activities are performed by the CI Manager. One
is technology intelligence on demand from the development projects, and the other one is
continuous monitoring of technological development taking place outside of the firm within the area
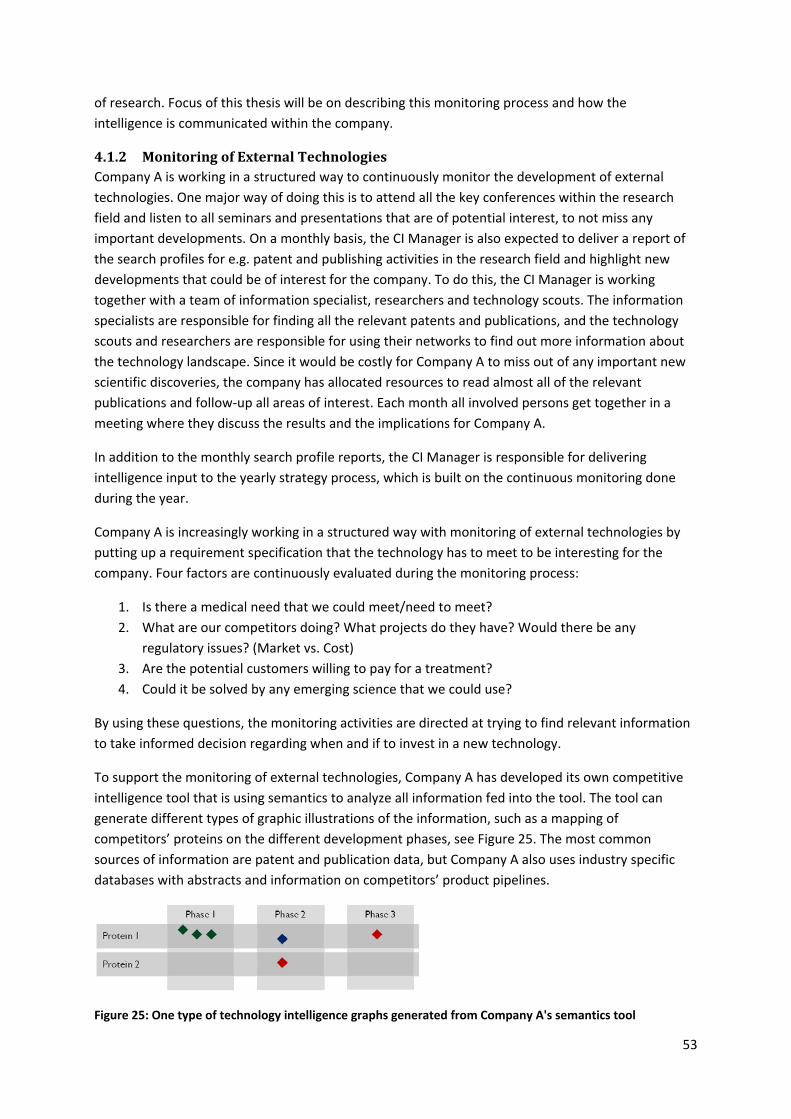
53
of research. Focus of this thesis will be on describing this monitoring process and how the
intelligence is communicated within the company.
4.1.2 Monitoring of External Technologies Company A is working in a structured way to continuously monitor the development of external
technologies. One major way of doing this is to attend all the key conferences within the research
field and listen to all seminars and presentations that are of potential interest, to not miss any
important developments. On a monthly basis, the CI Manager is also expected to deliver a report of
the search profiles for e.g. patent and publishing activities in the research field and highlight new
developments that could be of interest for the company. To do this, the CI Manager is working
together with a team of information specialist, researchers and technology scouts. The information
specialists are responsible for finding all the relevant patents and publications, and the technology
scouts and researchers are responsible for using their networks to find out more information about
the technology landscape. Since it would be costly for Company A to miss out of any important new
scientific discoveries, the company has allocated resources to read almost all of the relevant
publications and follow‐up all areas of interest. Each month all involved persons get together in a
meeting where they discuss the results and the implications for Company A.
In addition to the monthly search profile reports, the CI Manager is responsible for delivering
intelligence input to the yearly strategy process, which is built on the continuous monitoring done
during the year.
Company A is increasingly working in a structured way with monitoring of external technologies by
putting up a requirement specification that the technology has to meet to be interesting for the
company. Four factors are continuously evaluated during the monitoring process:
1. Is there a medical need that we could meet/need to meet?
2. What are our competitors doing? What projects do they have? Would there be any
regulatory issues? (Market vs. Cost)
3. Are the potential customers willing to pay for a treatment?
4. Could it be solved by any emerging science that we could use?
By using these questions, the monitoring activities are directed at trying to find relevant information
to take informed decision regarding when and if to invest in a new technology.
To support the monitoring of external technologies, Company A has developed its own competitive
intelligence tool that is using semantics to analyze all information fed into the tool. The tool can
generate different types of graphic illustrations of the information, such as a mapping of
competitors’ proteins on the different development phases, see Figure 25. The most common
sources of information are patent and publication data, but Company A also uses industry specific
databases with abstracts and information on competitors’ product pipelines.
Figure 25: One type of technology intelligence graphs generated from Company A's semantics tool
54
Company A is not using technology indicators in a structured way as a basis for the technology
intelligence activities. However, if an area of research is found that is considered interesting they
could zoom in on it and check e.g. patent developments over time. Also, some factors are monitored,
such as phase III close downs (indicating that the drug or protein was not successful in large scale
tests) as well as the speed that a technology passes through the different phases (indicating that the
technology is likely to be successful).
4.1.3 Communicating Intelligence The competitive technology intelligence is mainly communicated through written reports in the
company, but also orally through presentations for management. As an output of each monthly
search profile meeting described above a written report is compiled in a Word‐format document that
is spread to a number of persons in the company. The report has a structured format with certain set
headlines, and links to sources are often included if the reader wants to find out more. As the
intelligence information is communicated upwards in the company, the information is aggregated by
choosing the most relevant parts from each report. The decision on whether to invest in a new
technology is taken on different levels in the organization depending on the size of the investment.
4.2 Company B Company B is a global provider of telecommunications equipment and related services and
accordingly acts in a very technology‐intensive industry. The company has one of the industry’s
strongest patent portfolios in the industry and has many employees working with research and
development to create new breakthrough technology. In general, the telecommunications
equipment industry is market‐driven and fast‐moving industry and there is a close connection
between technological and market development, which is reflected by the importance of technology
product roadmaps and scenario analyses performed by the companies (Lichtenthaler, Technology
intelligence: identification of technological opportunities and threats by firms, 2006). It is also of
great importance for companies in this industry to monitor the changing techno‐economic
importance of different technologies to see which technologies are likely to become standard in
order to invest in the right technologies in the right time.
4.2.1 Organization Company B has a matrix organization with a number of Group Functions spanning across the four
business units that are responsible for Company B’s business. The Group Functions support by driving
operational excellence and optimizing common processes, tools and the organization. Of these group
functions it is the Technology & Portfolio Management that is responsible for the future product and
technology portfolio. This is where the technology intelligence Manager (TI Manager) is placed.
Company B has a totally network‐based organization of its technology intelligence where the TI
Manager is coordinating the TI activities through a network of technology champions spread out in
the organization, and a large number of experts in the research organization. The champions are
using their internal and external sub‐networks to keep themselves updated. The TI network is
focusing on a number of potentially disruptive technology areas defined by the directors of the
company and is responsible for acquiring information about new trends and opportunities and
delivering intelligence and trend reports across the organization.
55
Figure 26: Organization of Company B's technology intelligence
4.2.2 Monitoring of External Technologies “The mission of the technology intelligence network is to help the company sustaining technology
leadership by describing trends and new emerging technologies, taking an outside‐in view on
identifying technologies and trends that can affect the company’s performance” TI Manager, Company B
The monitoring of external technologies is performed at two different levels in Company B. The
central TI network is focusing on technologies with disruptive potential that are not directly tied to
the company’s core business. Further out in the organization, mainly in the Business Units, there are
people who are responsible for monitoring technologies that are closer to the business of the
company, and which are directly related to the current technology and product development
projects. In addition, Company B has a number of technology experts in the research and product
development organization that are authorities also outside of the company. Part of their
employment is to monitor the development within their field of expertise and be a resource to the
whole company.
The company has no specified way of putting up requirement specifications for the technology areas
that are being monitored other than that the technology should have the potential to have
substantial influence on the business of the company. The technology could be assessed by people
from e.g. Business Development in the different Business Units, by Common Components, or it could
be evaluated by the Innovation Board. The Innovation Board has the function of evaluating new
business proposals, possibly based on new technologies, and deciding if it is interesting to look
further into. Depending on how interesting the technology seems, the technology could either be
placed on the scouting list of one of the technology champions and is hence continuously monitored,
or a separate project could be started up to evaluate the technology further and assess its potential.
Since the technology intelligence network is integrated with the company’s technology and product
development, a close collaboration and understanding of the technology roadmap and future
strategy is enabled, making the technology intelligence efforts even more valuable for the company.
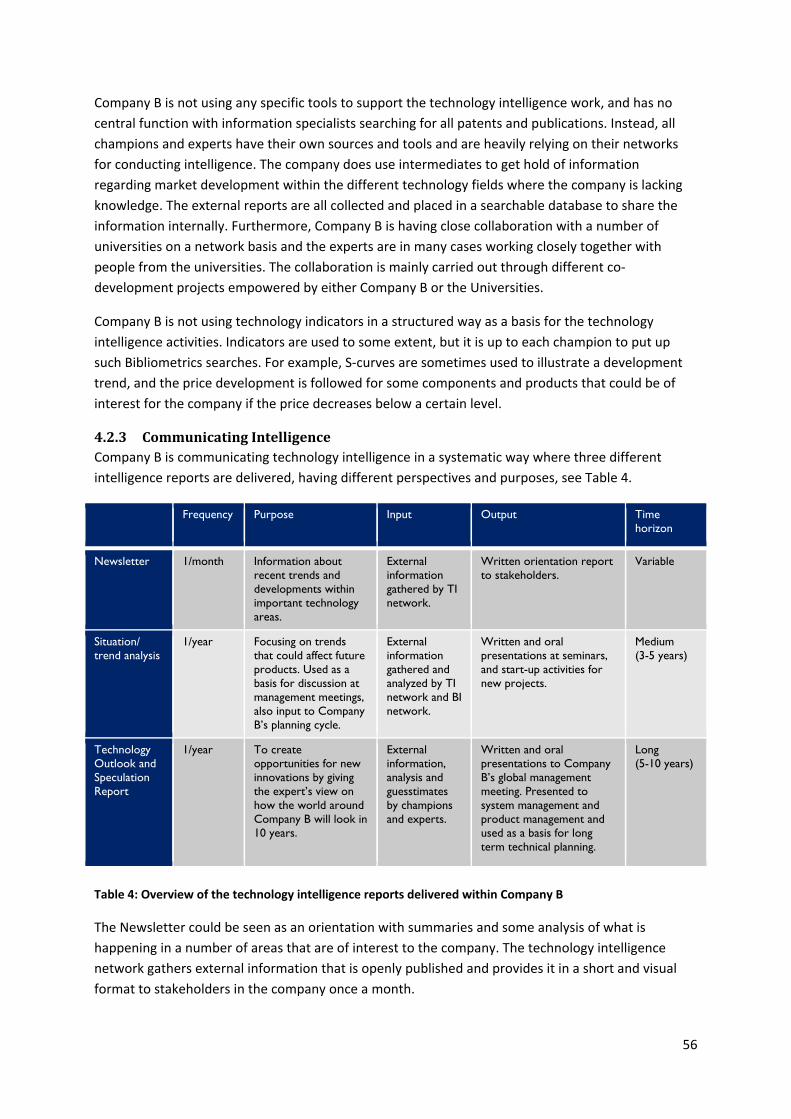
56
Company B is not using any specific tools to support the technology intelligence work, and has no
central function with information specialists searching for all patents and publications. Instead, all
champions and experts have their own sources and tools and are heavily relying on their networks
for conducting intelligence. The company does use intermediates to get hold of information
regarding market development within the different technology fields where the company is lacking
knowledge. The external reports are all collected and placed in a searchable database to share the
information internally. Furthermore, Company B is having close collaboration with a number of
universities on a network basis and the experts are in many cases working closely together with
people from the universities. The collaboration is mainly carried out through different co‐
development projects empowered by either Company B or the Universities.
Company B is not using technology indicators in a structured way as a basis for the technology
intelligence activities. Indicators are used to some extent, but it is up to each champion to put up
such Bibliometrics searches. For example, S‐curves are sometimes used to illustrate a development
trend, and the price development is followed for some components and products that could be of
interest for the company if the price decreases below a certain level.
4.2.3 Communicating Intelligence Company B is communicating technology intelligence in a systematic way where three different
intelligence reports are delivered, having different perspectives and purposes, see Table 4.
Frequency Purpose Input Output Time horizon
Newsletter 1/month Information about recent trends and developments within important technology areas.
External information gathered by TI network.
Written orientation report to stakeholders.
Variable
Situation/ trend analysis
1/year Focusing on trends that could affect future products. Used as a basis for discussion at management meetings, also input to Company B’s planning cycle.
External information gathered and analyzed by TI network and BI network.
Written and oral presentations at seminars, and start-up activities for new projects.
Medium (3-5 years)
Technology Outlook and Speculation Report
1/year To create opportunities for new innovations by giving the expert’s view on how the world around Company B will look in 10 years.
External information, analysis and guesstimates by champions and experts.
Written and oral presentations to Company B’s global management meeting. Presented to system management and product management and used as a basis for long term technical planning.
Long (5-10 years)
Table 4: Overview of the technology intelligence reports delivered within Company B
The Newsletter could be seen as an orientation with summaries and some analysis of what is
happening in a number of areas that are of interest to the company. The technology intelligence
network gathers external information that is openly published and provides it in a short and visual
format to stakeholders in the company once a month.
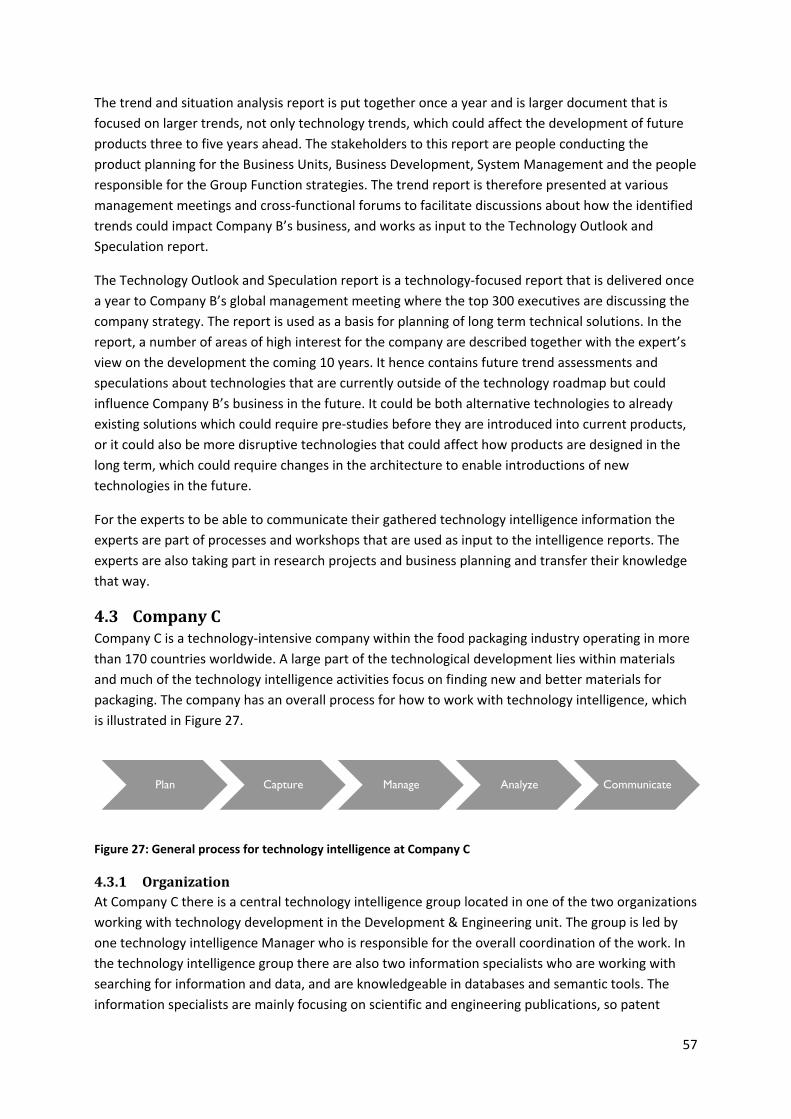
57
The trend and situation analysis report is put together once a year and is larger document that is
focused on larger trends, not only technology trends, which could affect the development of future
products three to five years ahead. The stakeholders to this report are people conducting the
product planning for the Business Units, Business Development, System Management and the people
responsible for the Group Function strategies. The trend report is therefore presented at various
management meetings and cross‐functional forums to facilitate discussions about how the identified
trends could impact Company B’s business, and works as input to the Technology Outlook and
Speculation report.
The Technology Outlook and Speculation report is a technology‐focused report that is delivered once
a year to Company B’s global management meeting where the top 300 executives are discussing the
company strategy. The report is used as a basis for planning of long term technical solutions. In the
report, a number of areas of high interest for the company are described together with the expert’s
view on the development the coming 10 years. It hence contains future trend assessments and
speculations about technologies that are currently outside of the technology roadmap but could
influence Company B’s business in the future. It could be both alternative technologies to already
existing solutions which could require pre‐studies before they are introduced into current products,
or it could also be more disruptive technologies that could affect how products are designed in the
long term, which could require changes in the architecture to enable introductions of new
technologies in the future.
For the experts to be able to communicate their gathered technology intelligence information the
experts are part of processes and workshops that are used as input to the intelligence reports. The
experts are also taking part in research projects and business planning and transfer their knowledge
that way.
4.3 Company C Company C is a technology‐intensive company within the food packaging industry operating in more
than 170 countries worldwide. A large part of the technological development lies within materials
and much of the technology intelligence activities focus on finding new and better materials for
packaging. The company has an overall process for how to work with technology intelligence, which
is illustrated in Figure 27.
Figure 27: General process for technology intelligence at Company C
4.3.1 Organization At Company C there is a central technology intelligence group located in one of the two organizations
working with technology development in the Development & Engineering unit. The group is led by
one technology intelligence Manager who is responsible for the overall coordination of the work. In
the technology intelligence group there are also two information specialists who are working with
searching for information and data, and are knowledgeable in databases and semantic tools. The
information specialists are mainly focusing on scientific and engineering publications, so patent
Plan Capture Manage Analyze Communicate
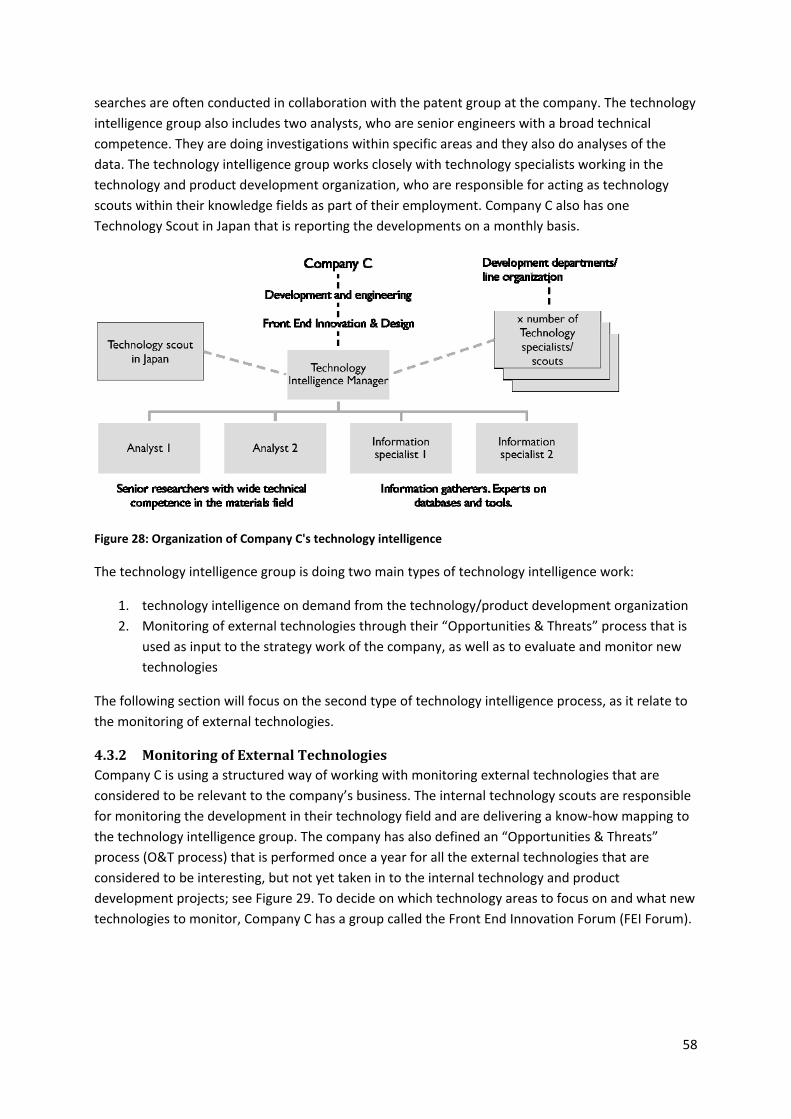
58
searches are often conducted in collaboration with the patent group at the company. The technology
intelligence group also includes two analysts, who are senior engineers with a broad technical
competence. They are doing investigations within specific areas and they also do analyses of the
data. The technology intelligence group works closely with technology specialists working in the
technology and product development organization, who are responsible for acting as technology
scouts within their knowledge fields as part of their employment. Company C also has one
Technology Scout in Japan that is reporting the developments on a monthly basis.
Figure 28: Organization of Company C's technology intelligence
The technology intelligence group is doing two main types of technology intelligence work:
1. technology intelligence on demand from the technology/product development organization
2. Monitoring of external technologies through their “Opportunities & Threats” process that is
used as input to the strategy work of the company, as well as to evaluate and monitor new
technologies
The following section will focus on the second type of technology intelligence process, as it relate to
the monitoring of external technologies.
4.3.2 Monitoring of External Technologies Company C is using a structured way of working with monitoring external technologies that are
considered to be relevant to the company’s business. The internal technology scouts are responsible
for monitoring the development in their technology field and are delivering a know‐how mapping to
the technology intelligence group. The company has also defined an “Opportunities & Threats”
process (O&T process) that is performed once a year for all the external technologies that are
considered to be interesting, but not yet taken in to the internal technology and product
development projects; see Figure 29. To decide on which technology areas to focus on and what new
technologies to monitor, Company C has a group called the Front End Innovation Forum (FEI Forum).
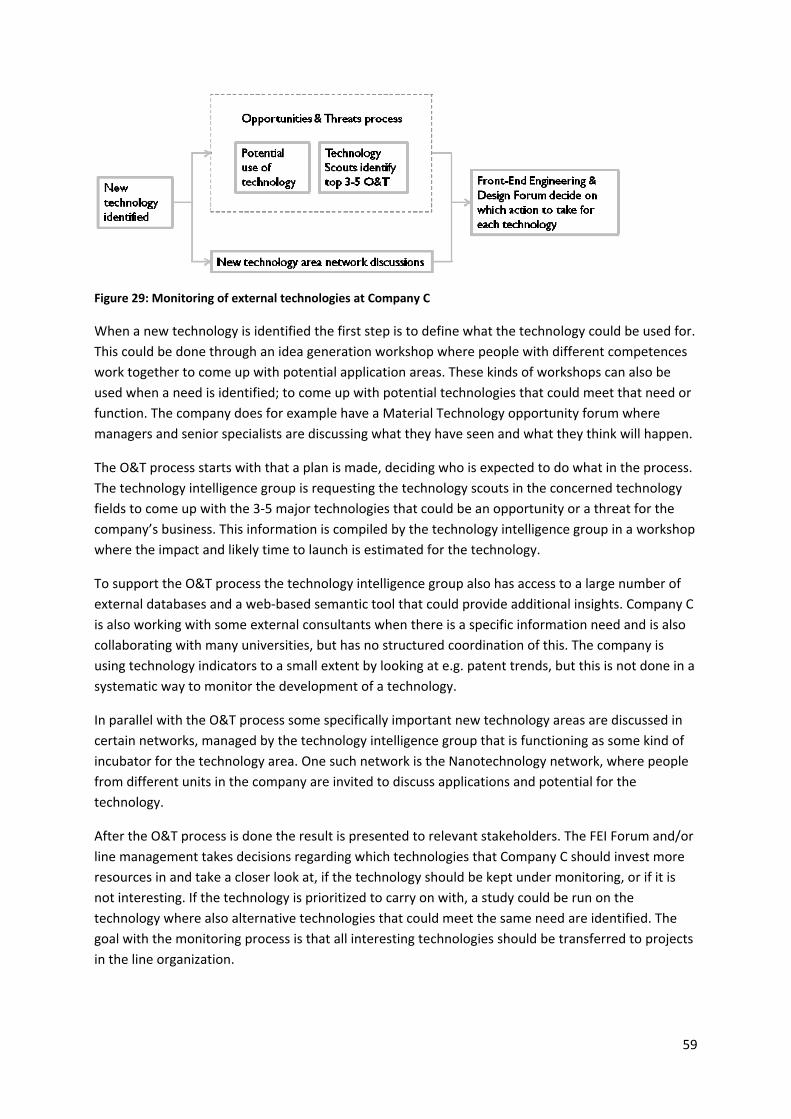
59
Figure 29: Monitoring of external technologies at Company C
When a new technology is identified the first step is to define what the technology could be used for.
This could be done through an idea generation workshop where people with different competences
work together to come up with potential application areas. These kinds of workshops can also be
used when a need is identified; to come up with potential technologies that could meet that need or
function. The company does for example have a Material Technology opportunity forum where
managers and senior specialists are discussing what they have seen and what they think will happen.
The O&T process starts with that a plan is made, deciding who is expected to do what in the process.
The technology intelligence group is requesting the technology scouts in the concerned technology
fields to come up with the 3‐5 major technologies that could be an opportunity or a threat for the
company’s business. This information is compiled by the technology intelligence group in a workshop
where the impact and likely time to launch is estimated for the technology.
To support the O&T process the technology intelligence group also has access to a large number of
external databases and a web‐based semantic tool that could provide additional insights. Company C
is also working with some external consultants when there is a specific information need and is also
collaborating with many universities, but has no structured coordination of this. The company is
using technology indicators to a small extent by looking at e.g. patent trends, but this is not done in a
systematic way to monitor the development of a technology.
In parallel with the O&T process some specifically important new technology areas are discussed in
certain networks, managed by the technology intelligence group that is functioning as some kind of
incubator for the technology area. One such network is the Nanotechnology network, where people
from different units in the company are invited to discuss applications and potential for the
technology.
After the O&T process is done the result is presented to relevant stakeholders. The FEI Forum and/or
line management takes decisions regarding which technologies that Company C should invest more
resources in and take a closer look at, if the technology should be kept under monitoring, or if it is
not interesting. If the technology is prioritized to carry on with, a study could be run on the
technology where also alternative technologies that could meet the same need are identified. The
goal with the monitoring process is that all interesting technologies should be transferred to projects
in the line organization.
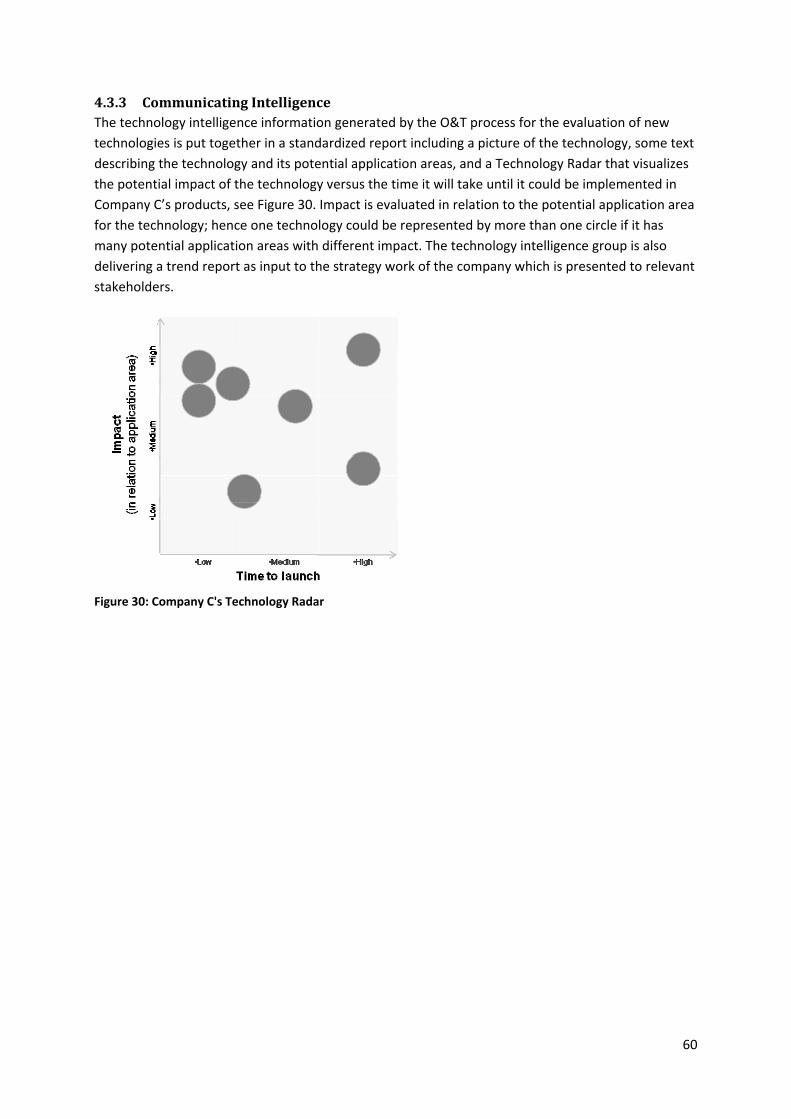
60
4.3.3 Communicating Intelligence The technology intelligence information generated by the O&T process for the evaluation of new
technologies is put together in a standardized report including a picture of the technology, some text
describing the technology and its potential application areas, and a Technology Radar that visualizes
the potential impact of the technology versus the time it will take until it could be implemented in
Company C’s products, see Figure 30. Impact is evaluated in relation to the potential application area
for the technology; hence one technology could be represented by more than one circle if it has
many potential application areas with different impact. The technology intelligence group is also
delivering a trend report as input to the strategy work of the company which is presented to relevant
stakeholders.
Figure 30: Company C's Technology Radar
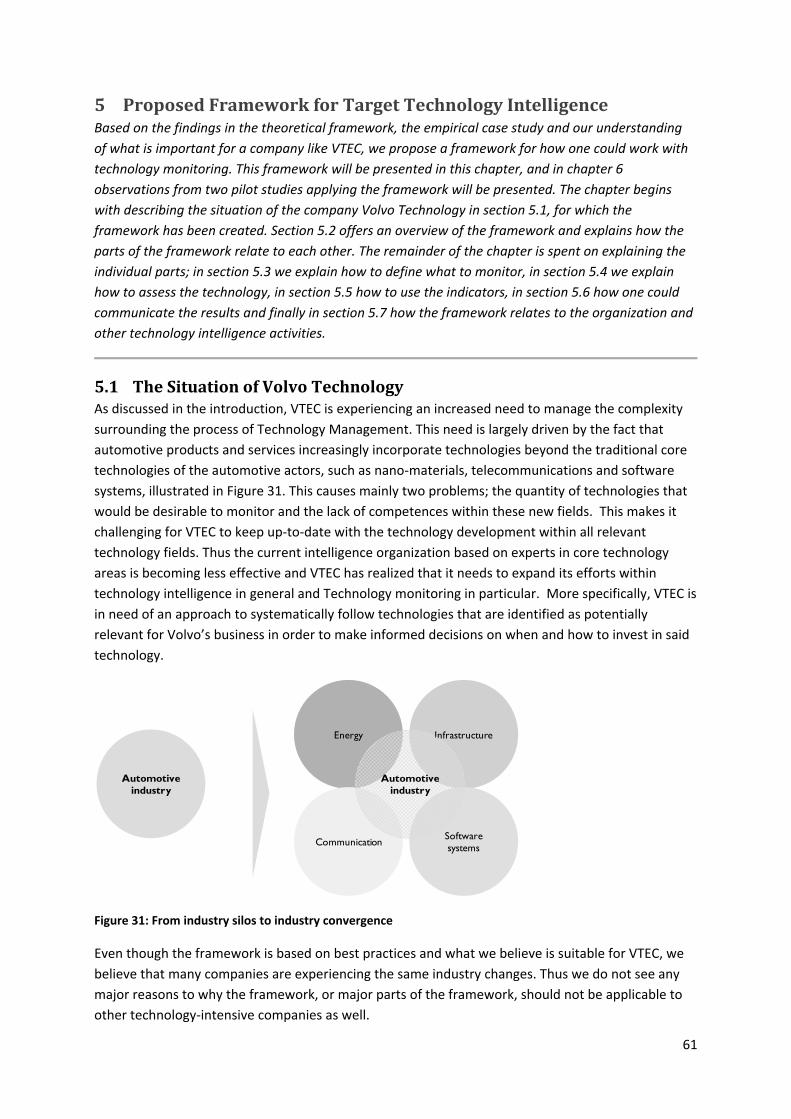
61
5 Proposed Framework for Target Technology Intelligence Based on the findings in the theoretical framework, the empirical case study and our understanding
of what is important for a company like VTEC, we propose a framework for how one could work with
technology monitoring. This framework will be presented in this chapter, and in chapter 6
observations from two pilot studies applying the framework will be presented. The chapter begins
with describing the situation of the company Volvo Technology in section 5.1, for which the
framework has been created. Section 5.2 offers an overview of the framework and explains how the
parts of the framework relate to each other. The remainder of the chapter is spent on explaining the
individual parts; in section 5.3 we explain how to define what to monitor, in section 5.4 we explain
how to assess the technology, in section 5.5 how to use the indicators, in section 5.6 how one could
communicate the results and finally in section 5.7 how the framework relates to the organization and
other technology intelligence activities.
5.1 The Situation of Volvo Technology As discussed in the introduction, VTEC is experiencing an increased need to manage the complexity
surrounding the process of Technology Management. This need is largely driven by the fact that
automotive products and services increasingly incorporate technologies beyond the traditional core
technologies of the automotive actors, such as nano‐materials, telecommunications and software
systems, illustrated in Figure 31. This causes mainly two problems; the quantity of technologies that
would be desirable to monitor and the lack of competences within these new fields. This makes it
challenging for VTEC to keep up‐to‐date with the technology development within all relevant
technology fields. Thus the current intelligence organization based on experts in core technology
areas is becoming less effective and VTEC has realized that it needs to expand its efforts within
technology intelligence in general and Technology monitoring in particular. More specifically, VTEC is
in need of an approach to systematically follow technologies that are identified as potentially
relevant for Volvo’s business in order to make informed decisions on when and how to invest in said
technology.
Figure 31: From industry silos to industry convergence
Even though the framework is based on best practices and what we believe is suitable for VTEC, we
believe that many companies are experiencing the same industry changes. Thus we do not see any
major reasons to why the framework, or major parts of the framework, should not be applicable to
other technology‐intensive companies as well.
Infrastructure
Automotive industry
Energy
CommunicationSoftware systems
Automotive industry
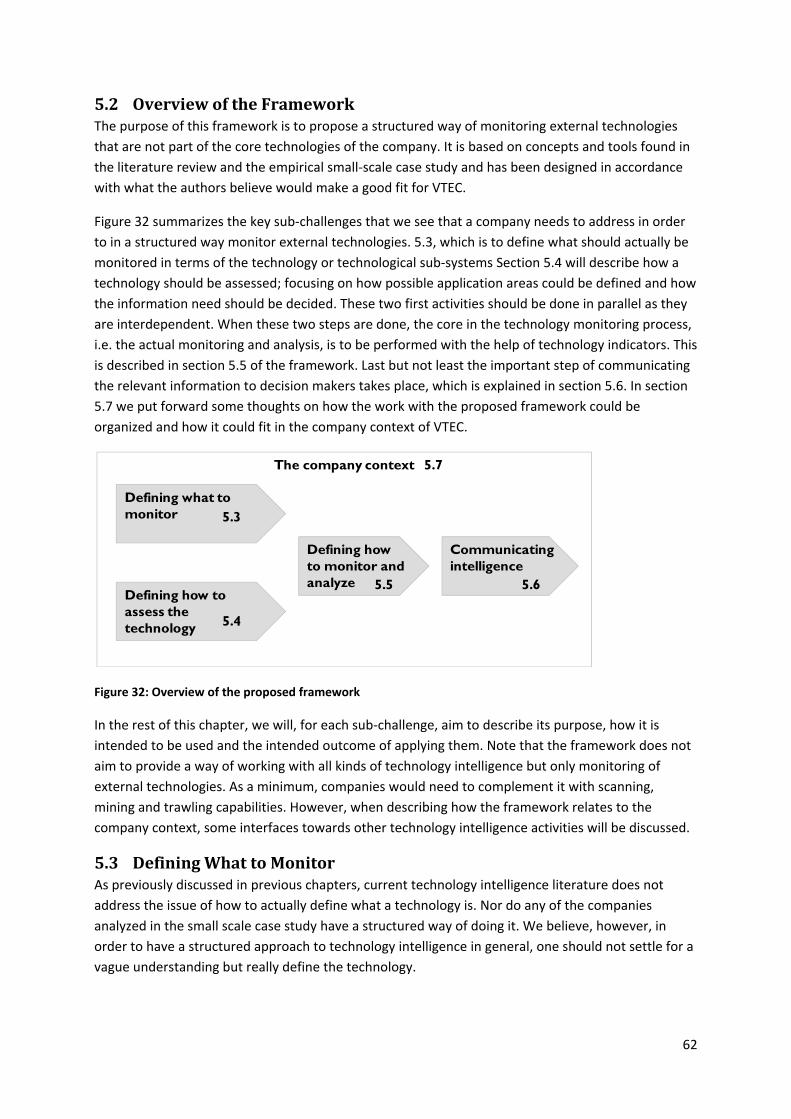
62
5.2 Overview of the Framework The purpose of this framework is to propose a structured way of monitoring external technologies
that are not part of the core technologies of the company. It is based on concepts and tools found in
the literature review and the empirical small‐scale case study and has been designed in accordance
with what the authors believe would make a good fit for VTEC.
Figure 32 summarizes the key sub‐challenges that we see that a company needs to address in order
to in a structured way monitor external technologies. 5.3, which is to define what should actually be
monitored in terms of the technology or technological sub‐systems Section 5.4 will describe how a
technology should be assessed; focusing on how possible application areas could be defined and how
the information need should be decided. These two first activities should be done in parallel as they
are interdependent. When these two steps are done, the core in the technology monitoring process,
i.e. the actual monitoring and analysis, is to be performed with the help of technology indicators. This
is described in section 5.5 of the framework. Last but not least the important step of communicating
the relevant information to decision makers takes place, which is explained in section 5.6. In section
5.7 we put forward some thoughts on how the work with the proposed framework could be
organized and how it could fit in the company context of VTEC.
Figure 32: Overview of the proposed framework
In the rest of this chapter, we will, for each sub‐challenge, aim to describe its purpose, how it is
intended to be used and the intended outcome of applying them. Note that the framework does not
aim to provide a way of working with all kinds of technology intelligence but only monitoring of
external technologies. As a minimum, companies would need to complement it with scanning,
mining and trawling capabilities. However, when describing how the framework relates to the
company context, some interfaces towards other technology intelligence activities will be discussed.
5.3 Defining What to Monitor As previously discussed in previous chapters, current technology intelligence literature does not
address the issue of how to actually define what a technology is. Nor do any of the companies
analyzed in the small scale case study have a structured way of doing it. We believe, however, in
order to have a structured approach to technology intelligence in general, one should not settle for a
vague understanding but really define the technology.
Defining what to monitor
Defining how to assess the technology
The company context
Defining how to monitor and analyze
Communicating intelligence
5.3
5.4
5.5 5.6
5.7
63
We believe there are at least three main advantages of defining what the target for the monitoring
activity is in a structured way. First of all, it is important is to establish a common frame for analysis,
which enables consistent and detailed analysis of the technology characteristics on many levels. It is
important to have clarity as one would otherwise risk getting inconsistencies and communication
problems. By having a common frame for analysis it also becomes easier to delimit what to monitor
and decide where the focus should be.
Secondly, we believe that it is important to define the technology in order to get a good
understanding and overview of what the technology context looks like. By breaking down the
technology into a technology tree, the knowledge about the technology increases substantially due
to that one is forced to understand its important functions and components. This is useful when
defining the important characteristics and indicators to use, and when the analysis of the technology
area from the gathered information.
Third, one of the underlying logics behind mapping technologies in defined hierarchies is the
phenomena of sub‐cycles to the s‐curves described earlier. With sub‐cycles is meant that the
development of a given technology is in fact driven by improvements in sub‐technologies with s‐
curves of its own. Therefore it is neither optimal nor feasible to talk about and analyze technologies
only on one level.
Therefore, we propose to hierarchically define the technology in a technology tree as Clark proposes,
and use it for technology monitoring purposes (Clark, 1985). The remainder of this chapter will
describe how such a technology tree could be used for technology monitoring. Just to note, we
believe a technology tree is not only relevant for technology monitoring per se, but such a
framework is very valuable also for example mapping internal knowledge, developing technology
strategies and also for technology scanning, i.e. finding new technologies as options on various
levels.
5.3.1 Constructing a Technology Tree This chapter proposes one way of constructing a complete and exhaustive technology tree of the
knowledge and technology fields that should be done in relation to each application area. We
propose that the tree construction is led by someone with good insight into the technology tree
methodology with support from technology domain experts.
5.3.1.1 ReadUp on the Technology Area The first step in the construction process would be to get a general understanding of the technology
area. Good sources for getting acquainted with a technology are non‐fiction books and articles, and
encyclopedias such as Wikipedia. It is important to strive for a conceptual, function‐oriented
understanding of the structure rather than a component oriented understanding.
5.3.1.2 Defining the Top Level of the Technology Tree One of the most important steps in the creation process is the definition of the apex in the
technology tree. The reason behind this is that technology development can be very relative, i.e. a
radical innovation in one system can be a modular innovation on another, higher level. For example,
for a car stereo manufacturer, the shift from analogue cassette bands to digital CD’s was a radical
innovation but for a truck manufacturer it would only constitute a modular innovation. Therefore, it
is important to think about the level of the apex as it sets the perspective for the whole analysis.
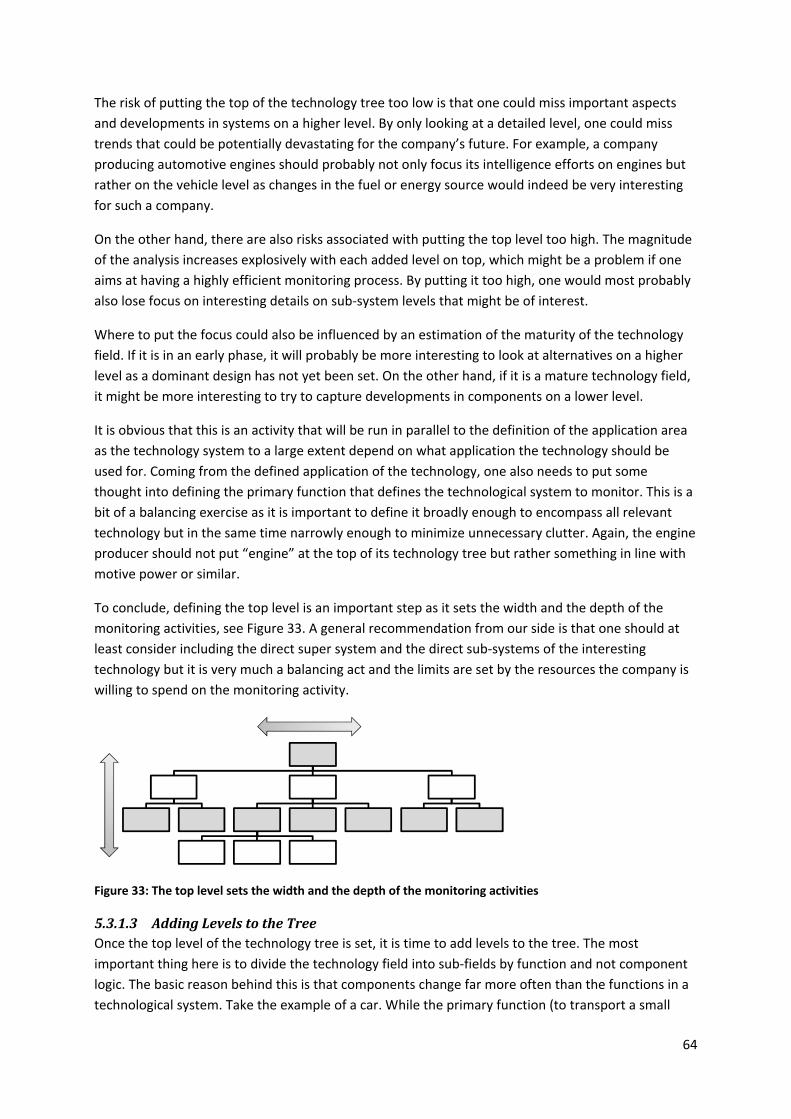
64
The risk of putting the top of the technology tree too low is that one could miss important aspects
and developments in systems on a higher level. By only looking at a detailed level, one could miss
trends that could be potentially devastating for the company’s future. For example, a company
producing automotive engines should probably not only focus its intelligence efforts on engines but
rather on the vehicle level as changes in the fuel or energy source would indeed be very interesting
for such a company.
On the other hand, there are also risks associated with putting the top level too high. The magnitude
of the analysis increases explosively with each added level on top, which might be a problem if one
aims at having a highly efficient monitoring process. By putting it too high, one would most probably
also lose focus on interesting details on sub‐system levels that might be of interest.
Where to put the focus could also be influenced by an estimation of the maturity of the technology
field. If it is in an early phase, it will probably be more interesting to look at alternatives on a higher
level as a dominant design has not yet been set. On the other hand, if it is a mature technology field,
it might be more interesting to try to capture developments in components on a lower level.
It is obvious that this is an activity that will be run in parallel to the definition of the application area
as the technology system to a large extent depend on what application the technology should be
used for. Coming from the defined application of the technology, one also needs to put some
thought into defining the primary function that defines the technological system to monitor. This is a
bit of a balancing exercise as it is important to define it broadly enough to encompass all relevant
technology but in the same time narrowly enough to minimize unnecessary clutter. Again, the engine
producer should not put “engine” at the top of its technology tree but rather something in line with
motive power or similar.
To conclude, defining the top level is an important step as it sets the width and the depth of the
monitoring activities, see Figure 33. A general recommendation from our side is that one should at
least consider including the direct super system and the direct sub‐systems of the interesting
technology but it is very much a balancing act and the limits are set by the resources the company is
willing to spend on the monitoring activity.
Figure 33: The top level sets the width and the depth of the monitoring activities
5.3.1.3 Adding Levels to the Tree Once the top level of the technology tree is set, it is time to add levels to the tree. The most
important thing here is to divide the technology field into sub‐fields by function and not component
logic. The basic reason behind this is that components change far more often than the functions in a
technological system. Take the example of a car. While the primary function (to transport a small
65
group of individuals) and even the direct sub‐functions (motive power, steering, stopping, load
capacity etc.) have remained steady over the years, there has been intense development and change
in components. Also, by using a functional logic, a technical system gets separated from its physical
components and allows for a much more general analysis. Technologies often come from outside an
industry and exchange current components by providing the same function in a better or cheaper
way. Such technologies can indeed be source of disruption and therefore it is important not be
locked into a strict product component thinking, but rather see the technology as a system of
functions.
After each division into sub‐functions it is important to consider competing alternatives for each such
sub‐function. We would argue that it is essential to explicitly do this; especially for mature
technologies as the dominant design might have led to that one takes a technology option for
granted and not even considering the other alternatives. The alternative technologies might then in
turn be broken down further into its sub‐functions.
We propose that one iterate this procedure and work downwards from the top until a satisfactory
level of detail is reached. Once a first draft is finished, it could be a good idea to also work upwards
from the bottom, making sure that everything adds up correctly, and that all fields in the technology
tree are mutually exclusive.
It is important to see the technology tree as something unfinished that needs to be updated
continuously. The basic functional needs might not change but the options of fulfilling those needs
most certainly will change over a technology paradigm. Therefore it is important to revise and touch‐
up the created tree and try to find irregularities such as new technological options to a function. This
could preferably be done in the process of mapping information in the technology tree, since it is
then easy to discover if some of the found information does not match with any of the placeholders
in the tree. In that case one has to evaluate whether the information is relevant or not, and if it is
relevant for the technology in question, the technology tree has to be updated to suit the new
hierarchical logic.
5.3.2 Limitations of a Technology Tree Even though we see that the technology trees is in many ways an excellent tool in monitoring
technology development, there are some limitations to what it can do. First of all, it might be hard to
use it for very immature technologies which are in the so called fluid phase. This phase is by
definition characterized by uncertainty about how the design of the technological system will look
like. Therefore, what function to include and what options to consider will be a very hard task for
such technologies.
A second limitation that we see is technological interdependences, i.e. the extent to which
components, sub‐systems, systems and process related technologies interact and affect each other.
As pointed out by Yakob & Tell, a hierarchical approach works best if the technological
interdependence is of low importance to the system performance (Yakob & Tell, 2007). If it is not of
low importance, the complexity becomes unmanageable as one would need to manually keep track
of all such dependencies and consequently it becomes hard to correctly aggregate technology fields
with technology trees. One thus would need a more flexible approach.
66
5.4 How to Assess a Technology The initial assessment of a new technology is important for the success of the technology monitoring
process. It is here that the stage is set for the continuous work by that the potential application areas
for the technology and the information need is defined. By defining how the technology should be
assessed, it becomes clear who the decision makers are, what information they want, and how they
would like to receive the information in forehand. Hence, the likelihood that the result of the
monitoring activity is useful to the persons that need the information to make strategic decisions is
increased.
The initial technology assessment could be divided into two major activities, as described in the
theoretical framework; defining the application area and defining the information need.
5.4.1 Defining the Application Area for the Technology To define what potential application areas one see for a new technology is fundamental in the initial
assessment. That is because the application area determines what competing technologies and sub‐
technologies that need to be monitored since they often depend on in what context the technology
is going to be used. Without any set application area the monitoring process just becomes a search
for the sake of searching.
Based on the learning made from both literature and the small‐scale case studies we suggest that the
assessment of application areas should be done in a cross‐functional workshop setting, where people
with different competences work together to come up with potential application areas for a new
identified technology. Persons to invite to such a workshop could be researchers, technology experts
and technology scouts, and people from technology and product development management. If there
is already a suitable group in the line organization or a research group with competence within the
field it is of great help to also involves them in the assessment of potential application areas. The
purpose of the workshop should be to generate and evaluate ideas for applications, and to decide
what application areas are consider interesting to look further into.
However, in the context of VTEC and the other companies in the small‐scale case study, the potential
application area for a technology is often given from the context of how the technology is found in
the initial stage. Instead, the need for new technologies is often driven by a technology pull from
future customer and product needs which have been identified as important to satisfy. In those cases
the workshops could be used to come up with potential technologies that could meet that need or
function, as in the case of Company C.
We propose that the Techno‐Economic Analysis (TEA), presented in 3.3.1 should be used as a tool for
the assessment of potential application areas, as a supporting means for the workshops. By following
the different steps in the analysis, the TEA could be used to map, visualize and thereafter analyze the
relations and interactions between technical and economic variables of an invention or technology
(Lindmark, 2006). We suggest that the TEA is done in a creative brainstorming way where all
workshop participants get to come with input on functions, performance parameters and application
areas for a certain technology, or for a technological system. The TEA tool could also be used to find
out what additional technologies will be needed to support a certain technology for a decided
application area, by moving backwards in the analysis from application to technology.
67
5.4.2 Defining the Information Need In parallel with deciding on what application areas to evaluate for a new technology it is also of utter
importance to put up a requirement specification for what the technology needs to fulfill in order for
VTEC to invest resources in it, and what information that is needed to support that. This means that
one need to explicitly define what information is important for the technology in question, and that
way set the scope of the information search.
We propose that the person or group that has the responsibility to search for information to support
the technology monitoring should have a meeting with the one that has the information need as a
starting point. At that meeting the application areas and the requirement specification should be
discussed and decided upon, and the technology characteristics that are important for the
requirement specification should be defined. The technology characteristics are what the technology
indicators are supposed to indicate in relation to a technology. Hence, when the technology
characteristics that are of relevance for future decisions have been defined, it is also suggested that
the technology indicators that are to be used are set at the meeting. A list of potential indicators is
presented in Table 5 that could be used as input.
The information need should also be driven by the context of the technology. If the technology is
related to a core technology area of VTEC there already exists competence within the field and the
R&D team working with relating technologies is probably following the technology field in detail. In
those cases, what Lichtenthaler calls passive monitoring, the use for monitoring with help of
technology indicators could be less useful than in the case of active monitoring of new external
technologies (Lichtenthaler, 2004). The importance of the technology area to the company’s business
is also affecting what information is needed since the company needs to take different positions in
relation to different technologies. In core technology areas of the company it is important for the
company to be positioned as leading in the field with an early position in the technology domain,
which puts certain requirements on the information need to find early signals of change. This could
be to find the “gray literature” and early publications and patents. For more peripheral technology
areas other information, such as cost of the technology, could be one of the most important factors
to monitor, which is an indicator that appears later in the technology development.
It is important to spend the monitoring resources and focus the information gathering to the
technologies that are considered most interesting to the company. For external technologies there is
no need to spend a lot of resources on technologies that are not expected to influence the business
of VTEC in any major way. Therefore, we propose that one base requirement from the technology
assessment phase should be that the technology should have the potential to have substantial
influence on the business of the company, which equals the way Company B is evaluating whether to
monitor technologies.
One tool that could be used internally to have a common picture of what technologies are most
important to monitor and what information is needed to fill the knowledge gaps of decision makers
is to develop a technology watch‐list, as illustrated in Figure 34. It is a summary of what areas that
should be monitored for developments by the intelligence gatherers of the company, arranged by
technology platforms, e.g. power train, audio, security systems, etc. For each technology platform
the following questions should be considered (Mortara, Kerr, Probert, & Phaal, 2007):
Which new or disruptive technologies are likely to affect our business?
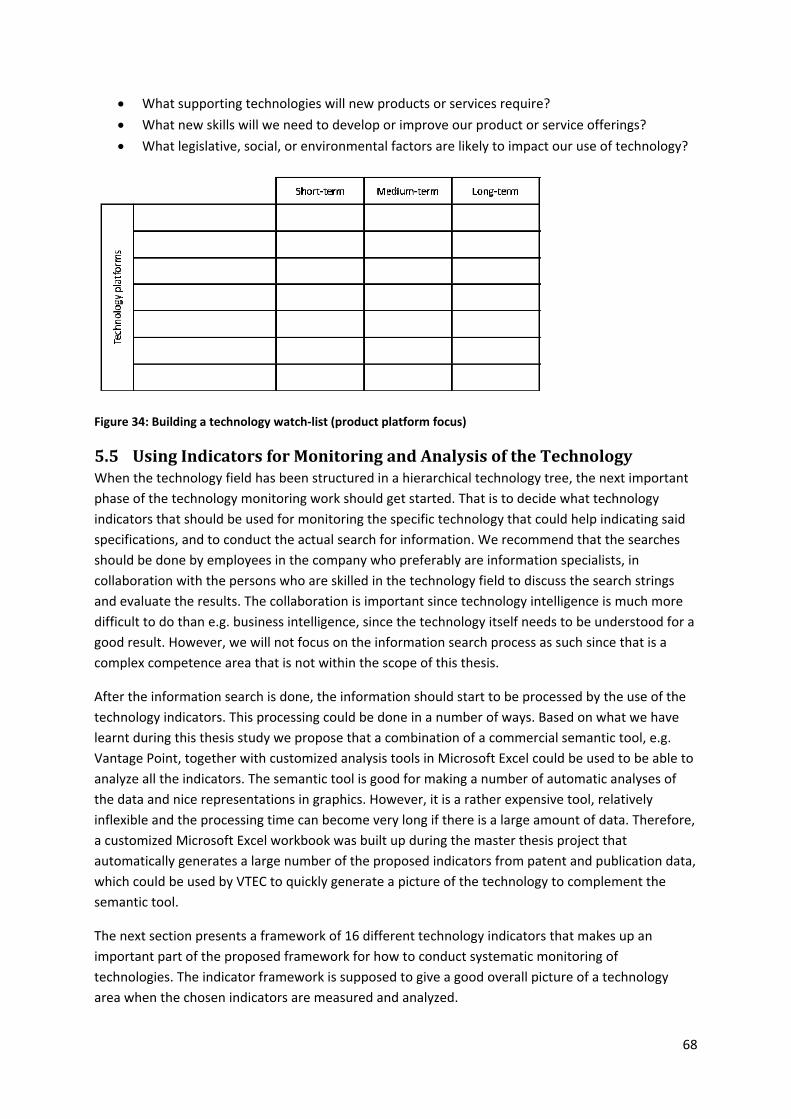
68
What supporting technologies will new products or services require?
What new skills will we need to develop or improve our product or service offerings?
What legislative, social, or environmental factors are likely to impact our use of technology?
Figure 34: Building a technology watch‐list (product platform focus)
5.5 Using Indicators for Monitoring and Analysis of the Technology When the technology field has been structured in a hierarchical technology tree, the next important
phase of the technology monitoring work should get started. That is to decide what technology
indicators that should be used for monitoring the specific technology that could help indicating said
specifications, and to conduct the actual search for information. We recommend that the searches
should be done by employees in the company who preferably are information specialists, in
collaboration with the persons who are skilled in the technology field to discuss the search strings
and evaluate the results. The collaboration is important since technology intelligence is much more
difficult to do than e.g. business intelligence, since the technology itself needs to be understood for a
good result. However, we will not focus on the information search process as such since that is a
complex competence area that is not within the scope of this thesis.
After the information search is done, the information should start to be processed by the use of the
technology indicators. This processing could be done in a number of ways. Based on what we have
learnt during this thesis study we propose that a combination of a commercial semantic tool, e.g.
Vantage Point, together with customized analysis tools in Microsoft Excel could be used to be able to
analyze all the indicators. The semantic tool is good for making a number of automatic analyses of
the data and nice representations in graphics. However, it is a rather expensive tool, relatively
inflexible and the processing time can become very long if there is a large amount of data. Therefore,
a customized Microsoft Excel workbook was built up during the master thesis project that
automatically generates a large number of the proposed indicators from patent and publication data,
which could be used by VTEC to quickly generate a picture of the technology to complement the
semantic tool.
The next section presents a framework of 16 different technology indicators that makes up an
important part of the proposed framework for how to conduct systematic monitoring of
technologies. The indicator framework is supposed to give a good overall picture of a technology
area when the chosen indicators are measured and analyzed.
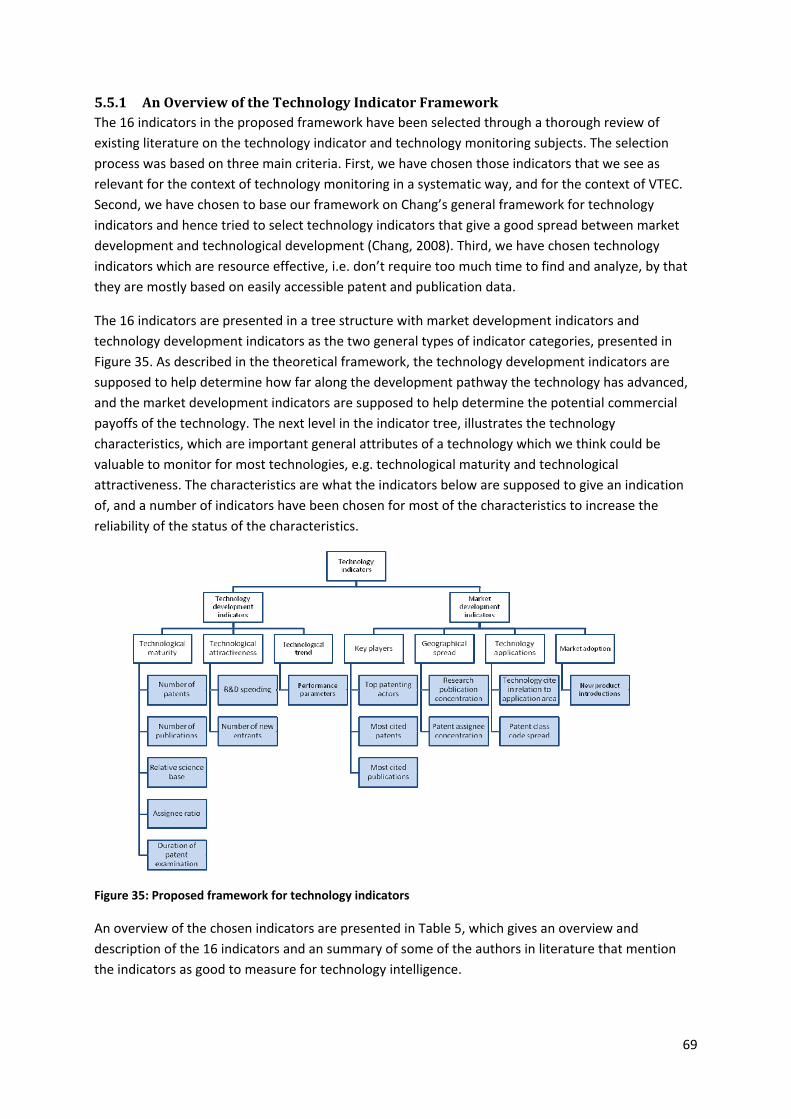
69
5.5.1 An Overview of the Technology Indicator Framework The 16 indicators in the proposed framework have been selected through a thorough review of
existing literature on the technology indicator and technology monitoring subjects. The selection
process was based on three main criteria. First, we have chosen those indicators that we see as
relevant for the context of technology monitoring in a systematic way, and for the context of VTEC.
Second, we have chosen to base our framework on Chang’s general framework for technology
indicators and hence tried to select technology indicators that give a good spread between market
development and technological development (Chang, 2008). Third, we have chosen technology
indicators which are resource effective, i.e. don’t require too much time to find and analyze, by that
they are mostly based on easily accessible patent and publication data.
The 16 indicators are presented in a tree structure with market development indicators and
technology development indicators as the two general types of indicator categories, presented in
Figure 35. As described in the theoretical framework, the technology development indicators are
supposed to help determine how far along the development pathway the technology has advanced,
and the market development indicators are supposed to help determine the potential commercial
payoffs of the technology. The next level in the indicator tree, illustrates the technology
characteristics, which are important general attributes of a technology which we think could be
valuable to monitor for most technologies, e.g. technological maturity and technological
attractiveness. The characteristics are what the indicators below are supposed to give an indication
of, and a number of indicators have been chosen for most of the characteristics to increase the
reliability of the status of the characteristics.
Figure 35: Proposed framework for technology indicators
An overview of the chosen indicators are presented in Table 5, which gives an overview and
description of the 16 indicators and an summary of some of the authors in literature that mention
the indicators as good to measure for technology intelligence.
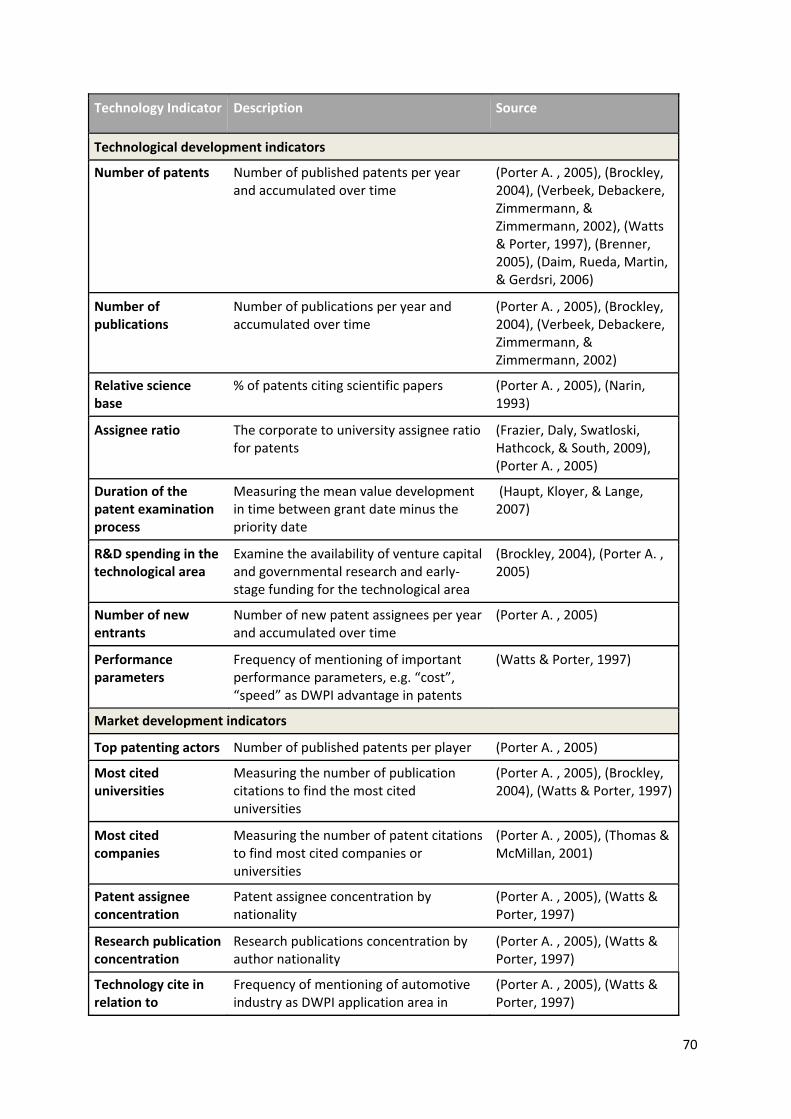
70
Technology Indicator Description Source
Technological development indicators
Number of patents Number of published patents per year and accumulated over time
(Porter A. , 2005), (Brockley, 2004), (Verbeek, Debackere, Zimmermann, & Zimmermann, 2002), (Watts & Porter, 1997), (Brenner, 2005), (Daim, Rueda, Martin, & Gerdsri, 2006)
Number of publications
Number of publications per year and accumulated over time
(Porter A. , 2005), (Brockley, 2004), (Verbeek, Debackere, Zimmermann, & Zimmermann, 2002)
Relative science base
% of patents citing scientific papers (Porter A. , 2005), (Narin, 1993)
Assignee ratio The corporate to university assignee ratio for patents
(Frazier, Daly, Swatloski, Hathcock, & South, 2009), (Porter A. , 2005)
Duration of the patent examination process
Measuring the mean value development in time between grant date minus the priority date
(Haupt, Kloyer, & Lange, 2007)
R&D spending in the technological area
Examine the availability of venture capital and governmental research and early‐stage funding for the technological area
(Brockley, 2004), (Porter A. , 2005)
Number of new entrants
Number of new patent assignees per year and accumulated over time
(Porter A. , 2005)
Performance parameters
Frequency of mentioning of important performance parameters, e.g. “cost”, “speed” as DWPI advantage in patents
(Watts & Porter, 1997)
Market development indicators
Top patenting actors Number of published patents per player (Porter A. , 2005)
Most cited universities
Measuring the number of publication citations to find the most cited universities
(Porter A. , 2005), (Brockley, 2004), (Watts & Porter, 1997)
Most cited companies
Measuring the number of patent citations to find most cited companies or universities
(Porter A. , 2005), (Thomas & McMillan, 2001)
Patent assignee concentration
Patent assignee concentration by nationality
(Porter A. , 2005), (Watts & Porter, 1997)
Research publication concentration
Research publications concentration by author nationality
(Porter A. , 2005), (Watts & Porter, 1997)
Technology cite in relation to
Frequency of mentioning of automotive industry as DWPI application area in
(Porter A. , 2005), (Watts & Porter, 1997)
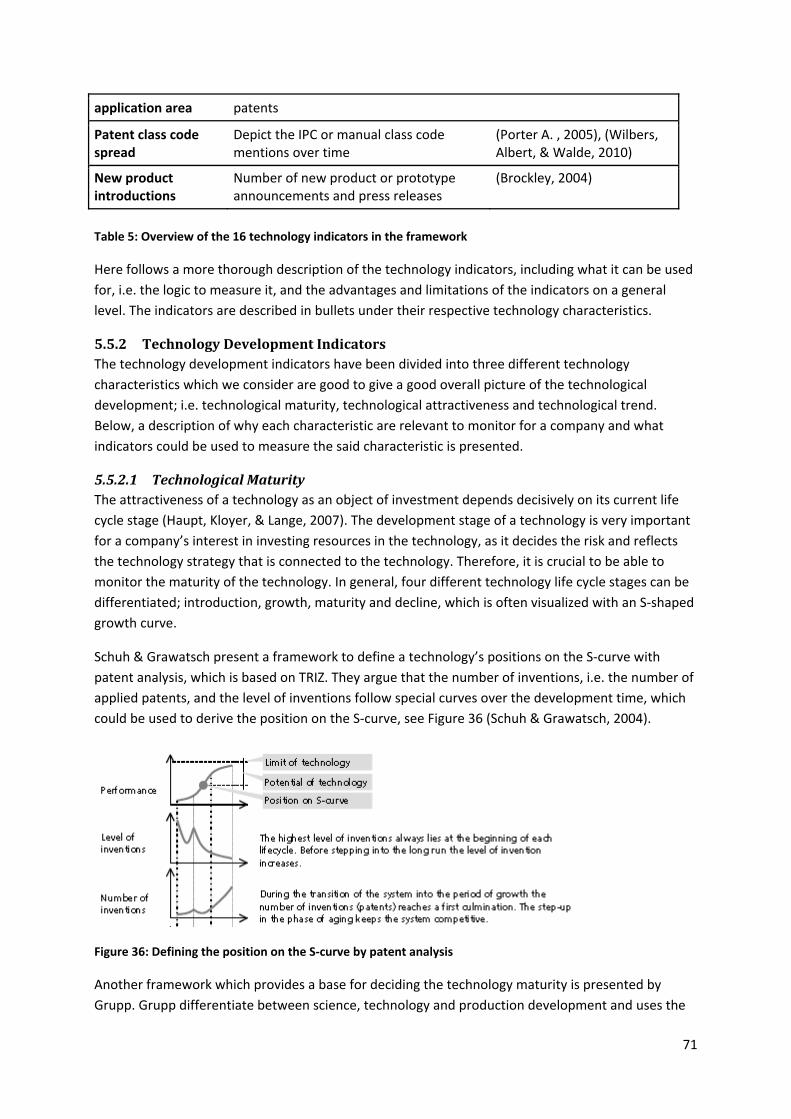
71
application area patents
Patent class code spread
Depict the IPC or manual class code mentions over time
(Porter A. , 2005), (Wilbers, Albert, & Walde, 2010)
New product introductions
Number of new product or prototype announcements and press releases
(Brockley, 2004)
Table 5: Overview of the 16 technology indicators in the framework
Here follows a more thorough description of the technology indicators, including what it can be used
for, i.e. the logic to measure it, and the advantages and limitations of the indicators on a general
level. The indicators are described in bullets under their respective technology characteristics.
5.5.2 Technology Development Indicators The technology development indicators have been divided into three different technology
characteristics which we consider are good to give a good overall picture of the technological
development; i.e. technological maturity, technological attractiveness and technological trend.
Below, a description of why each characteristic are relevant to monitor for a company and what
indicators could be used to measure the said characteristic is presented.
5.5.2.1 Technological Maturity The attractiveness of a technology as an object of investment depends decisively on its current life
cycle stage (Haupt, Kloyer, & Lange, 2007). The development stage of a technology is very important
for a company’s interest in investing resources in the technology, as it decides the risk and reflects
the technology strategy that is connected to the technology. Therefore, it is crucial to be able to
monitor the maturity of the technology. In general, four different technology life cycle stages can be
differentiated; introduction, growth, maturity and decline, which is often visualized with an S‐shaped
growth curve.
Schuh & Grawatsch present a framework to define a technology’s positions on the S‐curve with
patent analysis, which is based on TRIZ. They argue that the number of inventions, i.e. the number of
applied patents, and the level of inventions follow special curves over the development time, which
could be used to derive the position on the S‐curve, see Figure 36 (Schuh & Grawatsch, 2004).
Figure 36: Defining the position on the S‐curve by patent analysis
Another framework which provides a base for deciding the technology maturity is presented by
Grupp. Grupp differentiate between science, technology and production development and uses the
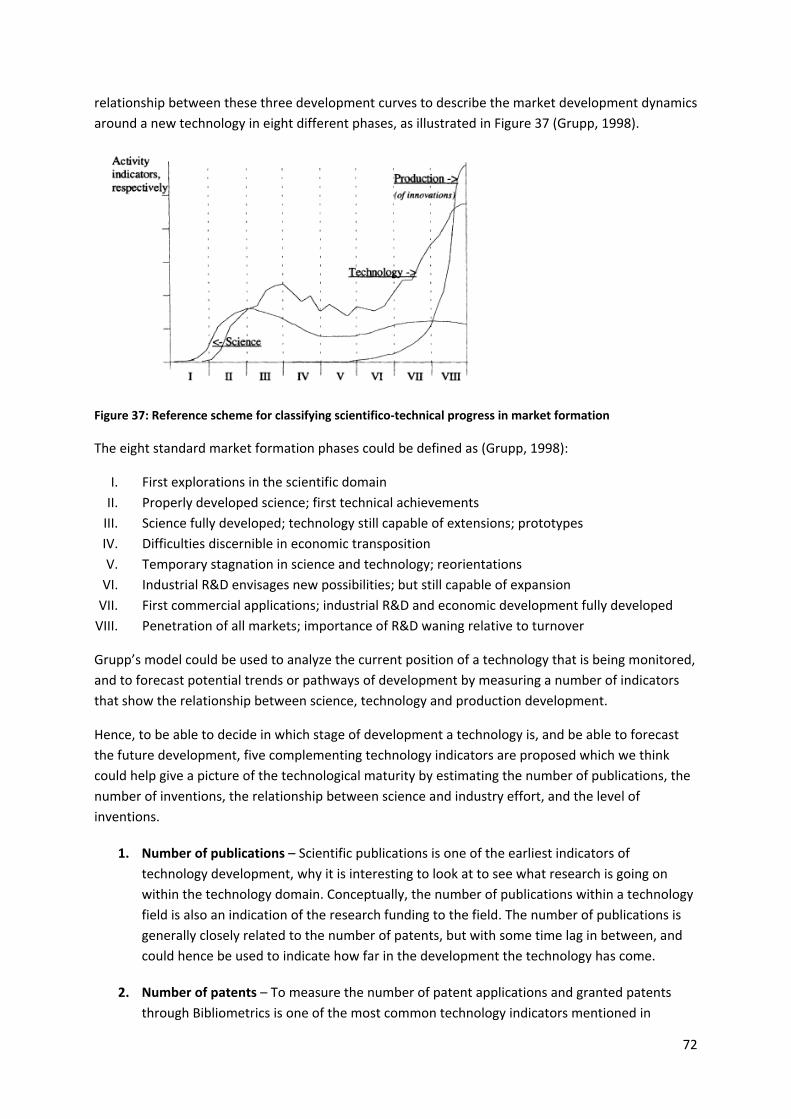
72
relationship between these three development curves to describe the market development dynamics
around a new technology in eight different phases, as illustrated in Figure 37 (Grupp, 1998).
Figure 37: Reference scheme for classifying scientifico‐technical progress in market formation
The eight standard market formation phases could be defined as (Grupp, 1998):
I. First explorations in the scientific domain
II. Properly developed science; first technical achievements
III. Science fully developed; technology still capable of extensions; prototypes
IV. Difficulties discernible in economic transposition
V. Temporary stagnation in science and technology; reorientations
VI. Industrial R&D envisages new possibilities; but still capable of expansion
VII. First commercial applications; industrial R&D and economic development fully developed
VIII. Penetration of all markets; importance of R&D waning relative to turnover
Grupp’s model could be used to analyze the current position of a technology that is being monitored,
and to forecast potential trends or pathways of development by measuring a number of indicators
that show the relationship between science, technology and production development.
Hence, to be able to decide in which stage of development a technology is, and be able to forecast
the future development, five complementing technology indicators are proposed which we think
could help give a picture of the technological maturity by estimating the number of publications, the
number of inventions, the relationship between science and industry effort, and the level of
inventions.
1. Number of publications – Scientific publications is one of the earliest indicators of
technology development, why it is interesting to look at to see what research is going on
within the technology domain. Conceptually, the number of publications within a technology
field is also an indication of the research funding to the field. The number of publications is
generally closely related to the number of patents, but with some time lag in between, and
could hence be used to indicate how far in the development the technology has come.
2. Number of patents – To measure the number of patent applications and granted patents
through Bibliometrics is one of the most common technology indicators mentioned in
73
literature, and it is a well‐known and easy approach to look at technology life cycles (Haupt,
Kloyer, & Lange, 2007). The growth of patents for any technology usually follows a similar
trend following an s‐shaped growth, where the number of issued patents is limited in the
early stages of a technology, followed by a fast‐growing phase until a plateau is reached as
can be seen in Error! Reference source not found. (Daim, Rueda, Martin, & Gerdsri, 2006).
Hence, the number of patents is a very good indicator for the number of inventions and thus
to see how far in the development stage the technology has come. Also, the number of
patents is seen as a strong indicator of the ability to transform scientific results into
applications and to see which parts of a technology field that is driving the development.
However, the value of monitoring the patenting activity will vary with the industry and
technology market, since some technology markets rely on other means of protection, such
as trade secrets or copyrights and the patent indicator does not give the current view of
scientific activity due to 18 months time lag for patent applications to become publicly
available.
3. Relative science base – This technology indicator is supposed to give an indication of how
mature the technology is by looking at what is driving the technology development. The
linkage to science measures whether the technology builds upon cutting‐edge scientific
research, or if it is driven by industry (Thomas & McMillan, 2001). If a majority of all patent
applications are citing scientific papers, the science base is large which tells that most of the
technological development is still driven by universities. As the technology matures the
science base decreases.
4. Assignee ratio – The assignee ratio is a similar indicator as the relative science base, but
differs in that the assignee ratio more look at what kind of actors that are patenting, instead
of citing. The ratio between corporate and university assignees for patents is supposed to
give an indication of when the technology is achieving commercial interest and viability.
5. Duration of patent examination – This technology indicator is suggested by Haupt et al. to
be one of the best indicators for the life cycle stage of a technology by that the indicator
mean value differs significantly between the different life cycle stages (Haupt, Kloyer, &
Lange, 2007). The underlying logic is that the patent examination process duration is long at
the beginning of a technological development since the applicants formulate broad claims
and since the examiners still lack the specific experience concerning the new technology.
After a shorter examination process during the growth stage the average duration increases
again in the maturity stage due to that the applications have to be compared to a higher
technological prior art standard. Hence, the logic to measure this indicator is that it could
indicate the life cycle stage of a technology by being able to indicate both stage transitions,
introduction to growth and growth to maturity. However, as noted by Nordlund there are a
number of factors that could influence the patent examination time, such as overall
workload for the patent examiners, patent office and the speed of individual examiners, so it
is important to use averages of rather extensive data sets over time to be able to draw
conclusions from this indicator (Nordlund, 2011).
74
5.5.2.2 Technological Attractiveness The technological attractiveness is an interesting characteristic to look at to see how bright the
development prospects are for the technological area and how competitive it is. Here, we have
chosen to include two technology indicators which we have found to be good measures of the
attractiveness of the technology from VTEC’s perspective.
6. R&D spending – The R&D spending indicator is a measure that examines the availability of
venture capital, governmental research and early‐stage funding for the technological area.
The logic to measure this indicator is that the level of investments indicates the
attractiveness and the competitiveness in the technology area. According to Brockley, most
of the federally funded projects have rather long development cycles, so the governmental
funding is a strong indicator of that the technological standard will have resources to reach
the production phase (Brockley, 2004). There are a large number of different governmental
funding programs both in Sweden where VTEC is acting, and in other countries. For VTEC, it is
highly relevant to monitor the amount of money invested in the technology area from e.g.
Vinnova, Tillväxtverket, Almi, Innovationsbron and Industrifonden. Also, we propose that one
should monitor the investments from the small business innovation research (SBIR) program
in the US. SBIR has funded many start‐ups in the US that have seen tremendous commercial
success (Brockley, 2004). We also propose that the amounts of money invested from venture
capital in the technology should be observed. This could be done by monitoring venture
capital databases. Kaplan, Sensoy, & Strömberg have studied how well venture capital
databases reflect actual investments by looking at the VentureOne and Venture Economics
databases. Their conclusion is that the databases provide unbiased, but noisy measures of
financing amounts and their valuations (Kaplan, Sensoy, & Strömberg, 2002).
7. Number of new entrants – This indicator measures the number of patents with new
assignees per year in relation to a specific technology field, which also indicates the
attractiveness and the competitiveness of the technology and how bright the development
prospects are for the technology. The logic is that the more new entrants that join a certain
technology alternative, the more likely the technology is to become a dominant design.
5.5.2.3 Technological Trend The technological trend characteristic is useful to decide what the technological development is
focusing on. Here, we propose a technology indicator that uses the Derwent3 classification of patent
data.
8. Performance parameters – This indicator is one that could be varied between what
performance parameters that are interesting to focus on for the specific technology, e.g.
cost, speed, durability, environmental friendliness, etc. To measure the indicator one look for
the chosen word in the DWPI advantage field4 and count how many times it is mentioned per
year. The DWPI field could be seen as a relative objective evaluation of what the patent is
claiming, hence this indicator could be a good measure of what the actors patenting in the
field are focusing their efforts on.
3 The Derwent Patents Index – a database containing patent applications from the world’s major patent issuing authorities including independent description and classification of the patents. 4 A field where DWPI independently try to estimate the advantage of the invention in relation to prior art
75
5.5.3 Market Development Indicators The market development indicators are relevant to monitor to get a picture of what the market
prospects are for the technology, which actors that a company acting in the technology field needs to
relate to, and what potential applications there are for the technology. Four technology
characteristics are presented below which gives an overview of the market development.
5.5.3.1 Key Players The key players within a technological field could be interesting from a number of perspectives,
depending on what technology strategy that the company has within that specific technology. If it is
a core technology area for the company, identification of key players is of value to find key
researchers or inventors for potential hiring or consultancy services and to see what other actors that
one need to relate to when innovating. If the technology strategy is to invest in the technology at a
later stage, the key players are relevant to find potential licensors of technology, potential
acquisition targets, etc. Three technology indicators have been identified that could measure the key
player characteristic.
9. Top patenting actors – This indicator indicates the leading companies in the technology area,
which gives a picture where there could be potential for licensing or acquiring small
companies with important intellectual property rights. This information needs to be given for
all patents, and could be seen as an objective measure for who the key players are.
10. Most cited actors – The most cited actors indicate the leading patenting actors in the
technology area. However, there is a risk inherent in this indicator that older patents get a
large number of citations just because they have existed for a long time. This could be
overcome by applying the methodology of the Current Impact Index (CII). The CII measures
how often the previous 5 years of a company’s patents are cited by patents issued within the
most recent year (Thomas & McMillan, 2001). Or a weighted average index could be applied
so that older patents with many citations are ranked lower than newer patents.
11. Most cited universities – To measure the number of citations for all publications is indicating
the leading publishing actors in the technology area. The logic behind this is that the more
important a publication is for the research field, the more other researchers will relate to
that research in coming publications. Therefore, to examine the most‐cited authors is a
strong indicator of leaders in the field (Watts & Porter, 1997). However, given the same logic
as for the patent citations it could be good to weight the indicator so that also new
important publications become visible.
5.5.3.2 Geographical Spread The geographical spread is interesting to monitor for a technology to see what global opportunities
there are for the technology and which countries that are driving the development. Two indicators
are presented here which gives a clear picture of where the development is taking place.
12. Patent assignee concentration – The patent assignee concentration indicator shows where
the people or companies are from who are stated as assignees on patents. This gives a good
indication of where the key innovators are from and hence in what parts of the world that
the technological development is driven.
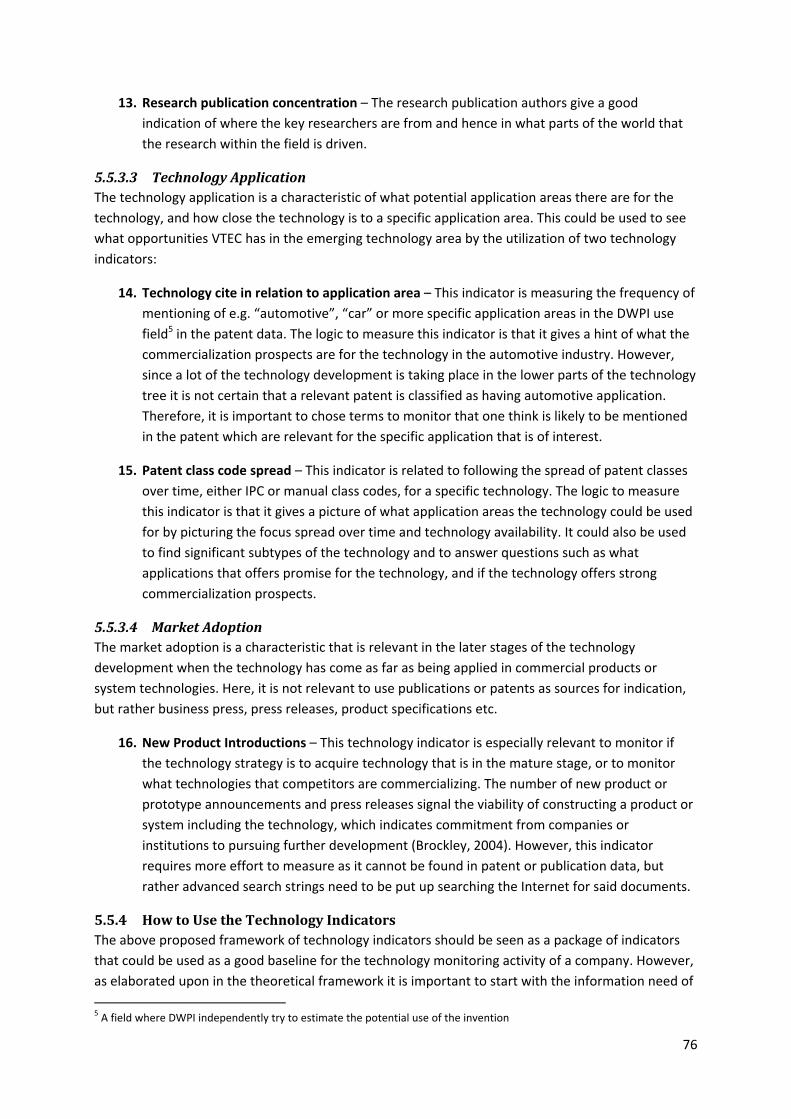
76
13. Research publication concentration – The research publication authors give a good
indication of where the key researchers are from and hence in what parts of the world that
the research within the field is driven.
5.5.3.3 Technology Application The technology application is a characteristic of what potential application areas there are for the
technology, and how close the technology is to a specific application area. This could be used to see
what opportunities VTEC has in the emerging technology area by the utilization of two technology
indicators:
14. Technology cite in relation to application area – This indicator is measuring the frequency of
mentioning of e.g. “automotive”, “car” or more specific application areas in the DWPI use
field5 in the patent data. The logic to measure this indicator is that it gives a hint of what the
commercialization prospects are for the technology in the automotive industry. However,
since a lot of the technology development is taking place in the lower parts of the technology
tree it is not certain that a relevant patent is classified as having automotive application.
Therefore, it is important to chose terms to monitor that one think is likely to be mentioned
in the patent which are relevant for the specific application that is of interest.
15. Patent class code spread – This indicator is related to following the spread of patent classes
over time, either IPC or manual class codes, for a specific technology. The logic to measure
this indicator is that it gives a picture of what application areas the technology could be used
for by picturing the focus spread over time and technology availability. It could also be used
to find significant subtypes of the technology and to answer questions such as what
applications that offers promise for the technology, and if the technology offers strong
commercialization prospects.
5.5.3.4 Market Adoption The market adoption is a characteristic that is relevant in the later stages of the technology
development when the technology has come as far as being applied in commercial products or
system technologies. Here, it is not relevant to use publications or patents as sources for indication,
but rather business press, press releases, product specifications etc.
16. New Product Introductions – This technology indicator is especially relevant to monitor if
the technology strategy is to acquire technology that is in the mature stage, or to monitor
what technologies that competitors are commercializing. The number of new product or
prototype announcements and press releases signal the viability of constructing a product or
system including the technology, which indicates commitment from companies or
institutions to pursuing further development (Brockley, 2004). However, this indicator
requires more effort to measure as it cannot be found in patent or publication data, but
rather advanced search strings need to be put up searching the Internet for said documents.
5.5.4 How to Use the Technology Indicators The above proposed framework of technology indicators should be seen as a package of indicators
that could be used as a good baseline for the technology monitoring activity of a company. However,
as elaborated upon in the theoretical framework it is important to start with the information need of
5 A field where DWPI independently try to estimate the potential use of the invention
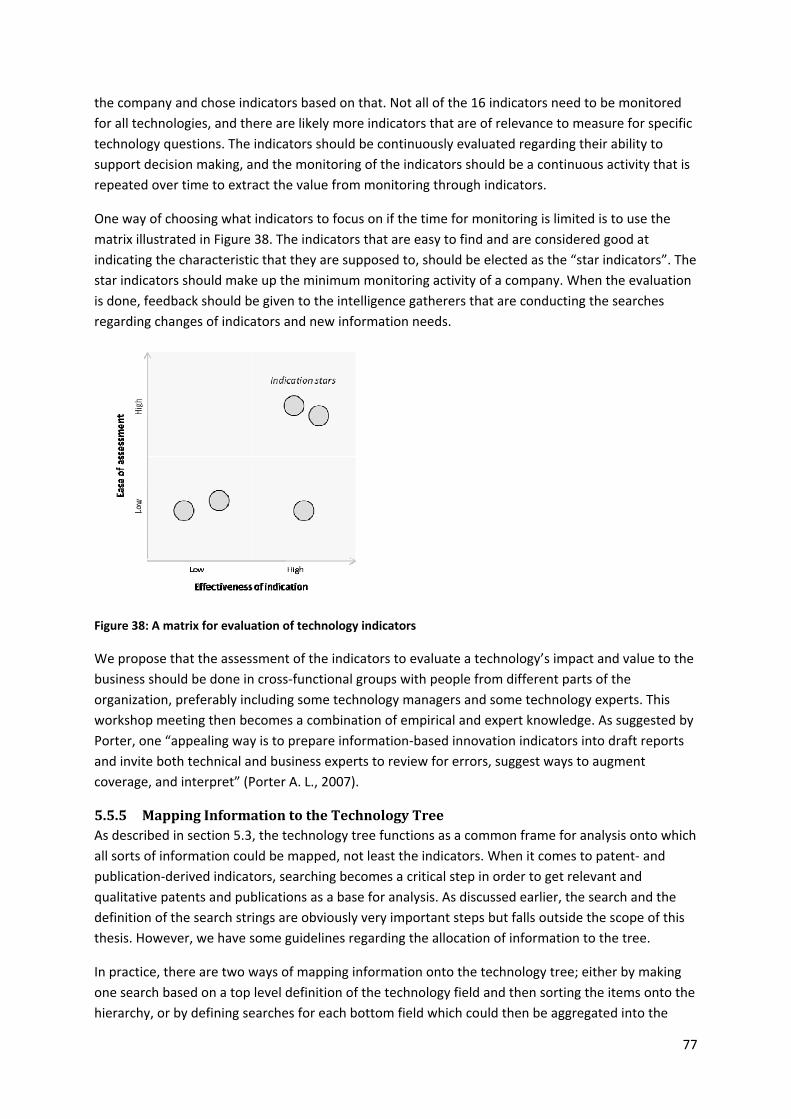
77
the company and chose indicators based on that. Not all of the 16 indicators need to be monitored
for all technologies, and there are likely more indicators that are of relevance to measure for specific
technology questions. The indicators should be continuously evaluated regarding their ability to
support decision making, and the monitoring of the indicators should be a continuous activity that is
repeated over time to extract the value from monitoring through indicators.
One way of choosing what indicators to focus on if the time for monitoring is limited is to use the
matrix illustrated in Figure 38. The indicators that are easy to find and are considered good at
indicating the characteristic that they are supposed to, should be elected as the “star indicators”. The
star indicators should make up the minimum monitoring activity of a company. When the evaluation
is done, feedback should be given to the intelligence gatherers that are conducting the searches
regarding changes of indicators and new information needs.
Figure 38: A matrix for evaluation of technology indicators
We propose that the assessment of the indicators to evaluate a technology’s impact and value to the
business should be done in cross‐functional groups with people from different parts of the
organization, preferably including some technology managers and some technology experts. This
workshop meeting then becomes a combination of empirical and expert knowledge. As suggested by
Porter, one “appealing way is to prepare information‐based innovation indicators into draft reports
and invite both technical and business experts to review for errors, suggest ways to augment
coverage, and interpret” (Porter A. L., 2007).
5.5.5 Mapping Information to the Technology Tree As described in section 5.3, the technology tree functions as a common frame for analysis onto which
all sorts of information could be mapped, not least the indicators. When it comes to patent‐ and
publication‐derived indicators, searching becomes a critical step in order to get relevant and
qualitative patents and publications as a base for analysis. As discussed earlier, the search and the
definition of the search strings are obviously very important steps but falls outside the scope of this
thesis. However, we have some guidelines regarding the allocation of information to the tree.
In practice, there are two ways of mapping information onto the technology tree; either by making
one search based on a top level definition of the technology field and then sorting the items onto the
hierarchy, or by defining searches for each bottom field which could then be aggregated into the
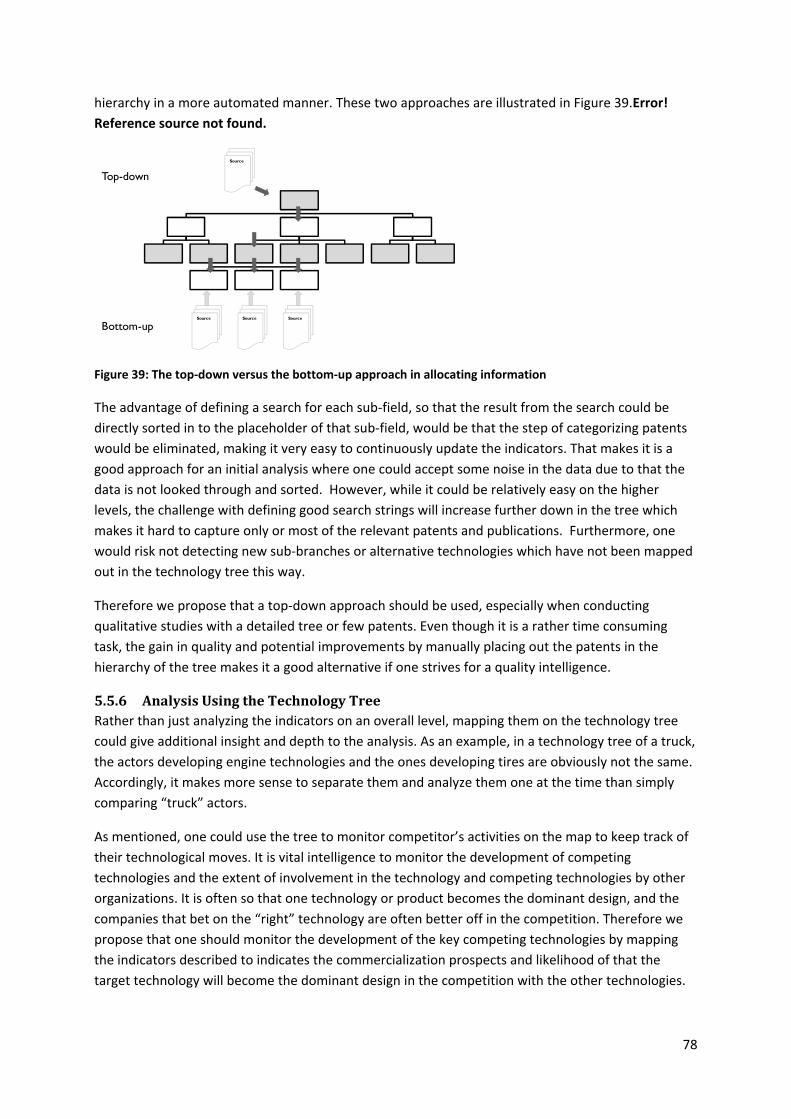
78
hierarchy in a more automated manner. These two approaches are illustrated in Figure 39.Error!
Reference source not found.
Figure 39: The top‐down versus the bottom‐up approach in allocating information
The advantage of defining a search for each sub‐field, so that the result from the search could be
directly sorted in to the placeholder of that sub‐field, would be that the step of categorizing patents
would be eliminated, making it very easy to continuously update the indicators. That makes it is a
good approach for an initial analysis where one could accept some noise in the data due to that the
data is not looked through and sorted. However, while it could be relatively easy on the higher
levels, the challenge with defining good search strings will increase further down in the tree which
makes it hard to capture only or most of the relevant patents and publications. Furthermore, one
would risk not detecting new sub‐branches or alternative technologies which have not been mapped
out in the technology tree this way.
Therefore we propose that a top‐down approach should be used, especially when conducting
qualitative studies with a detailed tree or few patents. Even though it is a rather time consuming
task, the gain in quality and potential improvements by manually placing out the patents in the
hierarchy of the tree makes it a good alternative if one strives for a quality intelligence.
5.5.6 Analysis Using the Technology Tree Rather than just analyzing the indicators on an overall level, mapping them on the technology tree
could give additional insight and depth to the analysis. As an example, in a technology tree of a truck,
the actors developing engine technologies and the ones developing tires are obviously not the same.
Accordingly, it makes more sense to separate them and analyze them one at the time than simply
comparing “truck” actors.
As mentioned, one could use the tree to monitor competitor’s activities on the map to keep track of
their technological moves. It is vital intelligence to monitor the development of competing
technologies and the extent of involvement in the technology and competing technologies by other
organizations. It is often so that one technology or product becomes the dominant design, and the
companies that bet on the “right” technology are often better off in the competition. Therefore we
propose that one should monitor the development of the key competing technologies by mapping
the indicators described to indicates the commercialization prospects and likelihood of that the
target technology will become the dominant design in the competition with the other technologies.
Source Source Source
Source
Bottom-up
Top-down
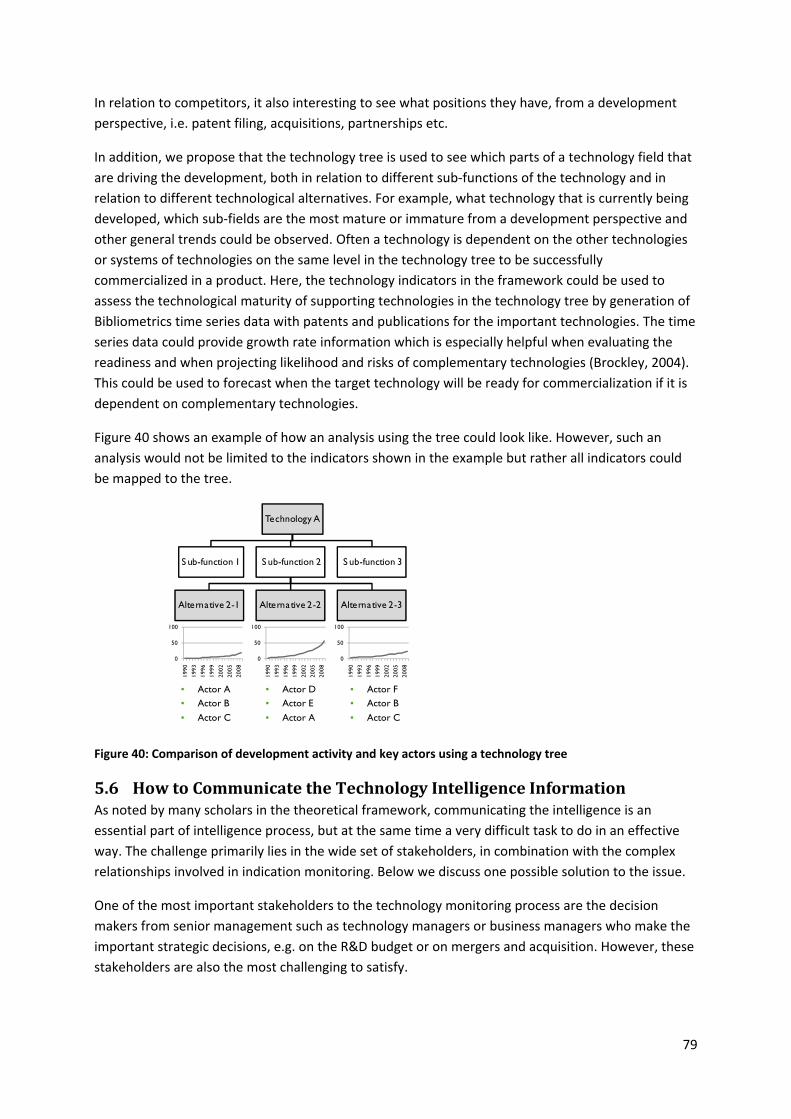
79
In relation to competitors, it also interesting to see what positions they have, from a development
perspective, i.e. patent filing, acquisitions, partnerships etc.
In addition, we propose that the technology tree is used to see which parts of a technology field that
are driving the development, both in relation to different sub‐functions of the technology and in
relation to different technological alternatives. For example, what technology that is currently being
developed, which sub‐fields are the most mature or immature from a development perspective and
other general trends could be observed. Often a technology is dependent on the other technologies
or systems of technologies on the same level in the technology tree to be successfully
commercialized in a product. Here, the technology indicators in the framework could be used to
assess the technological maturity of supporting technologies in the technology tree by generation of
Bibliometrics time series data with patents and publications for the important technologies. The time
series data could provide growth rate information which is especially helpful when evaluating the
readiness and when projecting likelihood and risks of complementary technologies (Brockley, 2004).
This could be used to forecast when the target technology will be ready for commercialization if it is
dependent on complementary technologies.
Figure 40 shows an example of how an analysis using the tree could look like. However, such an
analysis would not be limited to the indicators shown in the example but rather all indicators could
be mapped to the tree.
Figure 40: Comparison of development activity and key actors using a technology tree
5.6 How to Communicate the Technology Intelligence Information As noted by many scholars in the theoretical framework, communicating the intelligence is an
essential part of intelligence process, but at the same time a very difficult task to do in an effective
way. The challenge primarily lies in the wide set of stakeholders, in combination with the complex
relationships involved in indication monitoring. Below we discuss one possible solution to the issue.
One of the most important stakeholders to the technology monitoring process are the decision
makers from senior management such as technology managers or business managers who make the
important strategic decisions, e.g. on the R&D budget or on mergers and acquisition. However, these
stakeholders are also the most challenging to satisfy.
• Actor A• Actor B
• Actor C
Technology A
S ub-function 1 S ub-function 2
Alternative 2-1 Alternative 2-2 Alternative 2-3
S ub-function 3
0
50
100
1990
1993
1996
1999
2002
2005
2008
0
50
100
1990
1993
1996
1999
2002
2005
2008
0
50
100
1990
1993
1996
1999
2002
2005
2008
• Actor F• Actor B
• Actor C
• Actor D• Actor E
• Actor A
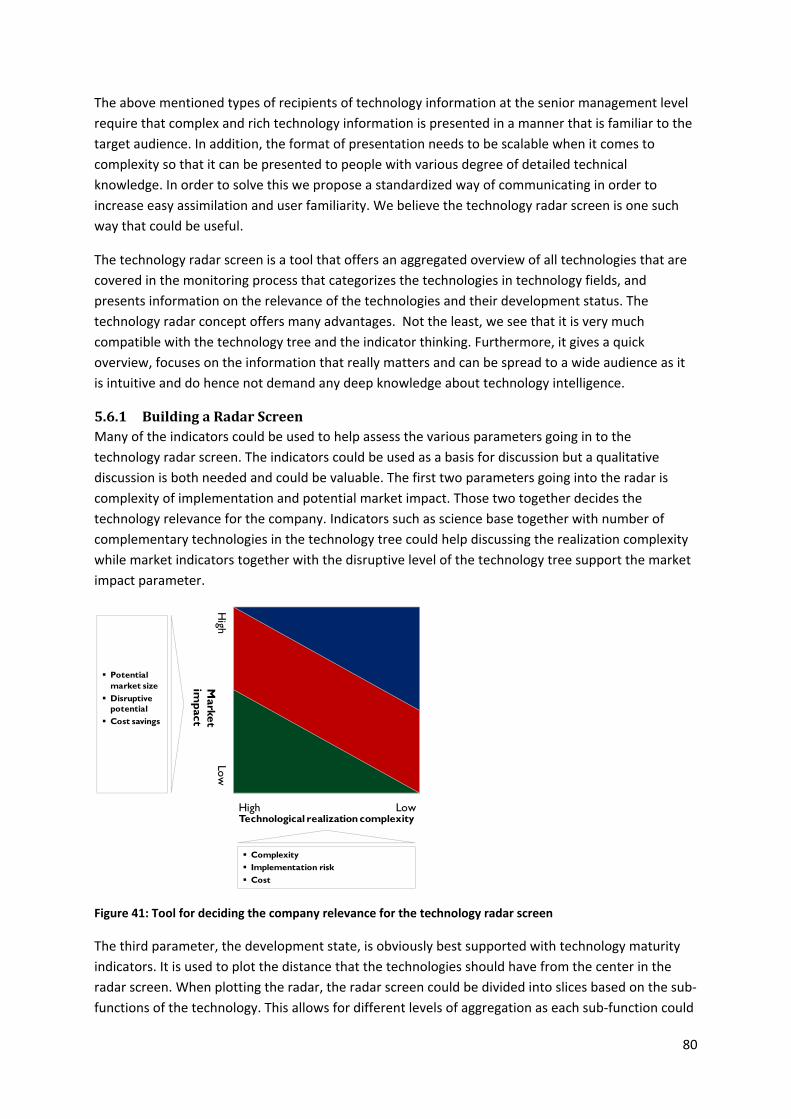
80
The above mentioned types of recipients of technology information at the senior management level
require that complex and rich technology information is presented in a manner that is familiar to the
target audience. In addition, the format of presentation needs to be scalable when it comes to
complexity so that it can be presented to people with various degree of detailed technical
knowledge. In order to solve this we propose a standardized way of communicating in order to
increase easy assimilation and user familiarity. We believe the technology radar screen is one such
way that could be useful.
The technology radar screen is a tool that offers an aggregated overview of all technologies that are
covered in the monitoring process that categorizes the technologies in technology fields, and
presents information on the relevance of the technologies and their development status. The
technology radar concept offers many advantages. Not the least, we see that it is very much
compatible with the technology tree and the indicator thinking. Furthermore, it gives a quick
overview, focuses on the information that really matters and can be spread to a wide audience as it
is intuitive and do hence not demand any deep knowledge about technology intelligence.
5.6.1 Building a Radar Screen Many of the indicators could be used to help assess the various parameters going in to the
technology radar screen. The indicators could be used as a basis for discussion but a qualitative
discussion is both needed and could be valuable. The first two parameters going into the radar is
complexity of implementation and potential market impact. Those two together decides the
technology relevance for the company. Indicators such as science base together with number of
complementary technologies in the technology tree could help discussing the realization complexity
while market indicators together with the disruptive level of the technology tree support the market
impact parameter.
Figure 41: Tool for deciding the company relevance for the technology radar screen
The third parameter, the development state, is obviously best supported with technology maturity
indicators. It is used to plot the distance that the technologies should have from the center in the
radar screen. When plotting the radar, the radar screen could be divided into slices based on the sub‐
functions of the technology. This allows for different levels of aggregation as each sub‐function could
High
LowM
arket im
pact
High LowTechnological realization complexity
Potential market size
Disruptive potential
Cost savings
Complexity Implementation risk Cost
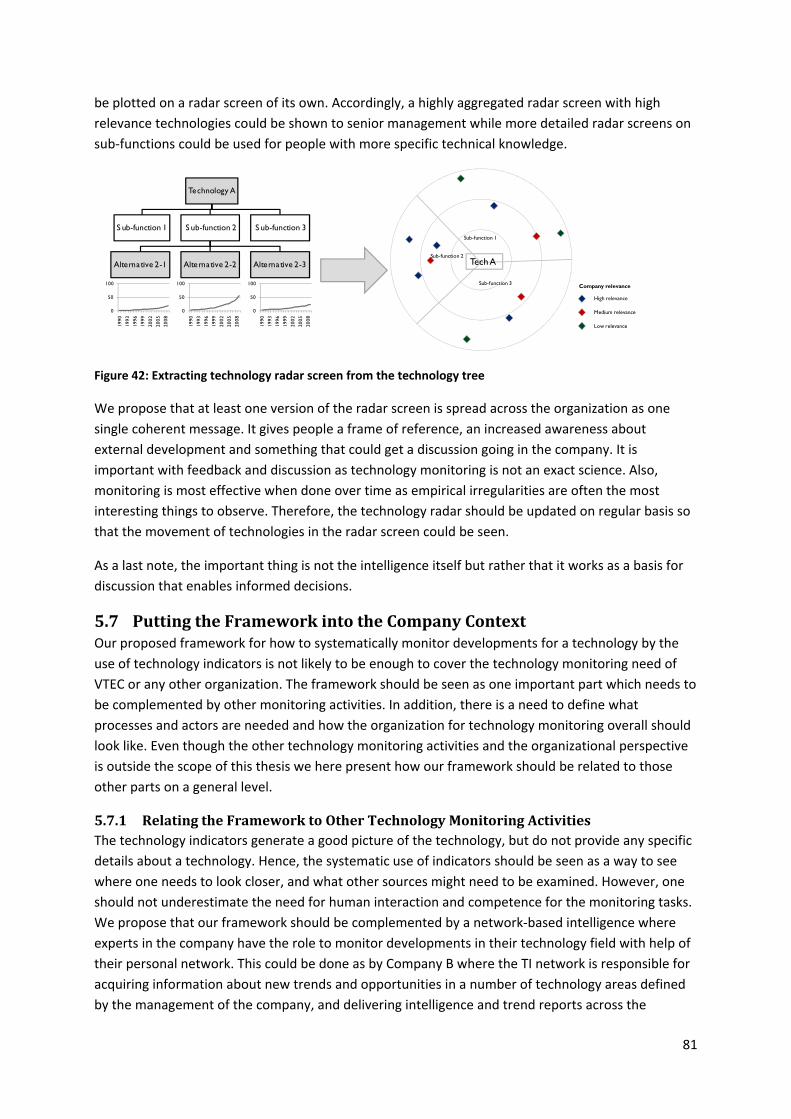
81
be plotted on a radar screen of its own. Accordingly, a highly aggregated radar screen with high
relevance technologies could be shown to senior management while more detailed radar screens on
sub‐functions could be used for people with more specific technical knowledge.
Figure 42: Extracting technology radar screen from the technology tree
We propose that at least one version of the radar screen is spread across the organization as one
single coherent message. It gives people a frame of reference, an increased awareness about
external development and something that could get a discussion going in the company. It is
important with feedback and discussion as technology monitoring is not an exact science. Also,
monitoring is most effective when done over time as empirical irregularities are often the most
interesting things to observe. Therefore, the technology radar should be updated on regular basis so
that the movement of technologies in the radar screen could be seen.
As a last note, the important thing is not the intelligence itself but rather that it works as a basis for
discussion that enables informed decisions.
5.7 Putting the Framework into the Company Context Our proposed framework for how to systematically monitor developments for a technology by the
use of technology indicators is not likely to be enough to cover the technology monitoring need of
VTEC or any other organization. The framework should be seen as one important part which needs to
be complemented by other monitoring activities. In addition, there is a need to define what
processes and actors are needed and how the organization for technology monitoring overall should
look like. Even though the other technology monitoring activities and the organizational perspective
is outside the scope of this thesis we here present how our framework should be related to those
other parts on a general level.
5.7.1 Relating the Framework to Other Technology Monitoring Activities The technology indicators generate a good picture of the technology, but do not provide any specific
details about a technology. Hence, the systematic use of indicators should be seen as a way to see
where one needs to look closer, and what other sources might need to be examined. However, one
should not underestimate the need for human interaction and competence for the monitoring tasks.
We propose that our framework should be complemented by a network‐based intelligence where
experts in the company have the role to monitor developments in their technology field with help of
their personal network. This could be done as by Company B where the TI network is responsible for
acquiring information about new trends and opportunities in a number of technology areas defined
by the management of the company, and delivering intelligence and trend reports across the
Tech A
Sub-function 1
Sub-function 2
Sub-function 3
High relevance
Medium relevance
Low relevance
Technology A
S ub-function 1 S ub-function 2
Alternative 2-1 Alternative 2-2 Alternative 2-3
S ub-function 3
0
50
100
1990
1993
1996
1999
2002
2005
2008
0
50
100
1990
1993
1996
1999
2002
2005
2008
0
50
100
1990
1993
1996
1999
2002
2005
2008
Company relevance
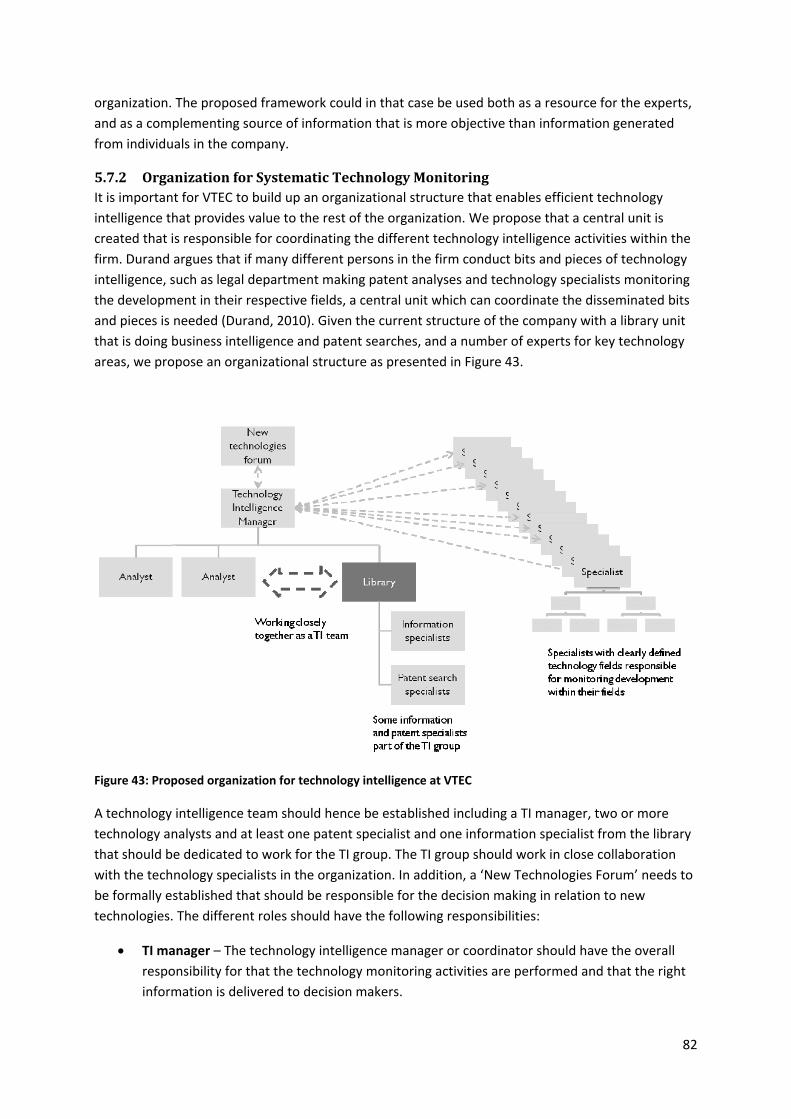
82
organization. The proposed framework could in that case be used both as a resource for the experts,
and as a complementing source of information that is more objective than information generated
from individuals in the company.
5.7.2 Organization for Systematic Technology Monitoring It is important for VTEC to build up an organizational structure that enables efficient technology
intelligence that provides value to the rest of the organization. We propose that a central unit is
created that is responsible for coordinating the different technology intelligence activities within the
firm. Durand argues that if many different persons in the firm conduct bits and pieces of technology
intelligence, such as legal department making patent analyses and technology specialists monitoring
the development in their respective fields, a central unit which can coordinate the disseminated bits
and pieces is needed (Durand, 2010). Given the current structure of the company with a library unit
that is doing business intelligence and patent searches, and a number of experts for key technology
areas, we propose an organizational structure as presented in Figure 43.
Figure 43: Proposed organization for technology intelligence at VTEC
A technology intelligence team should hence be established including a TI manager, two or more
technology analysts and at least one patent specialist and one information specialist from the library
that should be dedicated to work for the TI group. The TI group should work in close collaboration
with the technology specialists in the organization. In addition, a ‘New Technologies Forum’ needs to
be formally established that should be responsible for the decision making in relation to new
technologies. The different roles should have the following responsibilities:
TI manager – The technology intelligence manager or coordinator should have the overall
responsibility for that the technology monitoring activities are performed and that the right
information is delivered to decision makers.
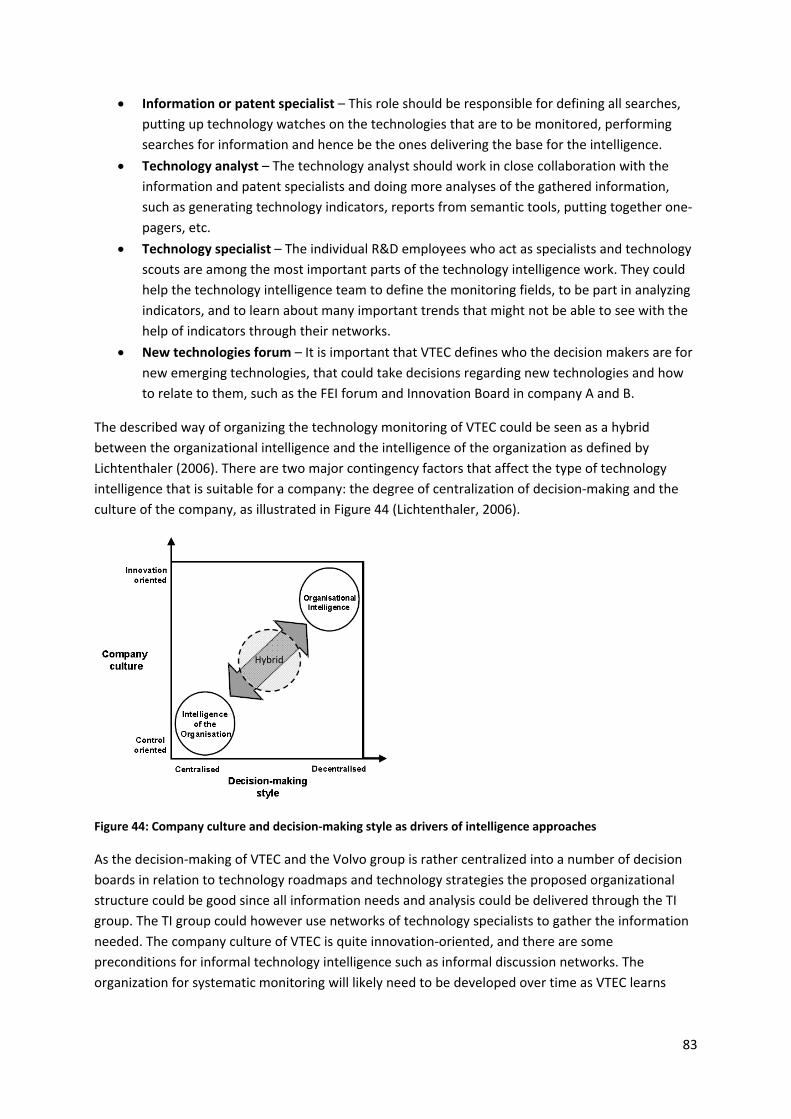
83
Information or patent specialist – This role should be responsible for defining all searches,
putting up technology watches on the technologies that are to be monitored, performing
searches for information and hence be the ones delivering the base for the intelligence.
Technology analyst – The technology analyst should work in close collaboration with the
information and patent specialists and doing more analyses of the gathered information,
such as generating technology indicators, reports from semantic tools, putting together one‐
pagers, etc.
Technology specialist – The individual R&D employees who act as specialists and technology
scouts are among the most important parts of the technology intelligence work. They could
help the technology intelligence team to define the monitoring fields, to be part in analyzing
indicators, and to learn about many important trends that might not be able to see with the
help of indicators through their networks.
New technologies forum – It is important that VTEC defines who the decision makers are for
new emerging technologies, that could take decisions regarding new technologies and how
to relate to them, such as the FEI forum and Innovation Board in company A and B.
The described way of organizing the technology monitoring of VTEC could be seen as a hybrid
between the organizational intelligence and the intelligence of the organization as defined by
Lichtenthaler (2006). There are two major contingency factors that affect the type of technology
intelligence that is suitable for a company: the degree of centralization of decision‐making and the
culture of the company, as illustrated in Figure 44 (Lichtenthaler, 2006).
Figure 44: Company culture and decision‐making style as drivers of intelligence approaches
As the decision‐making of VTEC and the Volvo group is rather centralized into a number of decision
boards in relation to technology roadmaps and technology strategies the proposed organizational
structure could be good since all information needs and analysis could be delivered through the TI
group. The TI group could however use networks of technology specialists to gather the information
needed. The company culture of VTEC is quite innovation‐oriented, and there are some
preconditions for informal technology intelligence such as informal discussion networks. The
organization for systematic monitoring will likely need to be developed over time as VTEC learns
Hybrid

84
more about how the different suggested processes work out and how the communication and
decision making could be done in the best way.
85
6 Observations and Discussion In this chapter we discuss the results and the lessons we learnt during two pilot projects at VTEC
where we applied our proposed framework on two prospective technology areas for VTEC.
Furthermore, we discuss to what extent our framework has the potential of improving technology
intelligence performance in technology intensive organizations. This part also aims to determine
whether or not the set out purpose has been reached and that the research questions have been
answered. The chapter starts with a general discussion of what we have learnt during the course of
this project in section 6.1. Thereafter follows a description of the pilot studies in section 6.2 and finally
a discussion in relation to the research questions is presented in section 6.3.
6.1 General Discussion During the course of this thesis, one of the more, for us, surprising findings is that companies seem to
be rather unsophisticated and informal in their approach to technology monitoring. Companies are
to a large extent relying on initiatives of individuals in the firm to keep track of what is happening in
the technological landscape surrounding them. This finding is supporting Brockley’s conclusion from
her study on technology monitoring in companies (Brockley, 2004). To cite her work: “In spite of
recommendation of vast literature spanning three decades, companies are hesitant to implement
formal data gathering, analysis and dissemination processes and typically rely instead, on the
initiatives of individuals within the firm, expensive consultants, or industry analyst reports.” (Brockley,
2004, p. 6). We believe that this is in many ways an accurate description of what we have seen during
our studies of the companies involved in this thesis, even though some of the companies in the case
study are increasingly structuring their approach. This gives us reason to believe that more
technology‐intensive companies are in the same situation, where a more structured approach to
technology monitoring is needed.
All in all, we believe that monitoring techniques in general and indicators in particular provide
objective information and are easy to use. The list of advantages that could be reached by
successfully monitoring external technology development could be made long, but here we present
some of the most important advantages:
Improved early warning of international developments and trends within technology fields
To assess the attractiveness of technologies, especially new technologies posing a threat or a
new opportunity for the existing business.
Better understanding of opportunities for technical collaboration with external organizations
and to evaluate potential partners, especially customers and suppliers but also competitors
To feed input to the company’s R&D strategy and R&D agenda
For these reasons and many more, external technology data must be understood as a strategic
information source, which contributes with important information to the effective and efficient
management of technology. We would argue that companies successfully leveraging this source to
decision makers, for example by the use of indicators, gain competitive advantages. Our hypothesis
going into this thesis was that technological information is underused in many organizations.
Throughout our study we have realized that most companies do not structurally work with
harvesting the enormous amount of information available but rather rely on individuals and/or
external consultancies. Hence, extracting relevant information, for example by the use of indicators,
86
would lead to a direct information advantage in relation to competitors. Even though most indicators
are based on publicly available information, they provide additional insights by the structured
visualization of the data. Therefore, we argue that working with technology indicators offers an
advantage in relation to companies instead relying on individuals and other sources of subjective
information.
6.2 Pilot Projects In order to validate the framework more than on a conceptual level, we tested the framework for
two technologies that were in the interest of our host company to look further into, and understand
what opportunities and threats that those technologies could imply. The goal of this exercise was not
to perform the best possible analysis of the two areas, but rather to demonstrate and experiment
with what additional insights one could really achieve in applying the proposed framework. In
addition, we wanted to be able to evaluate the applicability and identify possible limitations of the
framework.
Each step of the proposed framework was gone through in accordance with the framework and
searches for information was done with help from the information specialists at VTEC. The results
from applying the framework were presented to a group of people involving both technology
specialists and technology managers. That gave us further insights into how the framework could be
applied and its limitations. However, no quantitative and more systematic evaluation has been done
of the framework. That is largely dependent on that the result of doing technology monitoring with
indicators could not be evaluated after just one instance, but a continuous monitoring by measuring
the indicators needs to be done for a thorough evaluation to be made. Therefore, it is important to
note that the testing of the framework conducted in these two pilot projects is not in any way a full
and absolute evaluation of the framework. In order to make such an evaluation, a longer time span
and a proper evaluation of the true characteristics of the technologies would have been needed.
Instead, our own observations, experiences and comments from VTEC form the basis of this chapter.
6.3 Discussion in Relation to the Research Questions In this sub‐chapter follows a discussion of how we answered the research questions, including a
description of what we learnt about the proposed framework by applying it during two pilot projects
at VTEC and what we learnt from the feedback from the technology intelligence stakeholders at
VTEC.
6.3.1 Definition of the Technologies Our first research question related to how one could define what to monitor. As described in section
5.3 we propose that technologies that are to be monitored should properly be defined by using
technology trees. The advantages of making such a hierarchical break‐down of a technology field is
foremost the establishment of a common frame for analysis, which enables consistent and detailed
analysis of the technology characteristics on many levels. Furthermore, we also propose a concrete
methodology for building such a technology tree.
Proper definitions of technology and technological development have partly been disregarded in
traditional technology intelligence literature. We think that with our proposed techniques, we have
not only raised an important issue but also proposed one way of actively working with it.
87
One of the most important lessons learned in the pilot study when defining the technologies and
building the technology trees was that even though the technology tree is conceptually very easy to
grasp, it is very difficult to build one perfect technology tree as it often exist a series of possible sub‐
levels, definitions of functions etc. In the end, it is a balancing exercise where one needs to balance
the need of having a narrow well‐defined scope and the need of having a widely defined scope so
that unexpected technology development is captured. One should always keep the information need
in mind and only break down the technology tree to such a level that it helps in giving relevant
information about the technology development.
A recommendation would be to make the building of the tree an iterative process where feedback is
iteratively given by technical experts while the actual building would be done by someone with good
insight into the technology tree methodology. As a minor note, we also realized that it is very useful
to conduct the building of the technology tree in flexible software as the building process is an
iterative process where it could become very difficult and time demanding to make changes.
Especially as even for a seemingly trivial technology, the trees become easily rather large.
Lastly, the technology tree concept was well appreciated during the presentation of our pilot studies
both as an analytical and a communicative tool. All participants clearly saw the benefit of using the
technology tree to get a better overview of the technology development on different levels, and to
see which actors are focusing where. Hence, this at least partly validated our hypothesis of its
usefulness.
6.3.2 Assessment of the Technologies Our second research question related to how one could go about defining how a technology should
be assessed. As described in section 5.4, we propose two activities answering to this need; defining
the application area and defining the information need. Defining the application area is important as
the technology to be monitored need to be assessed in relation to something. For identifying
relevant application areas of the technology to be monitored we propose cross‐functional workshops
supported by TEA analyses.
A reflection concerning the choice of application area for technologies is that in the context of VTEC
and the other companies in the small‐scale case study, the potential application area for a
technology was often given. We realized that most technologies are often identified as a result of a
search for a solution to a certain problem or a future need, i.e. in a technology pull manner. This
would make the search for application area abundant and this step could be skipped. Never the less,
the methods suggested in the framework could always be used to validate and find alternative
application areas, or to assess what other complementary technologies that needs to be developed
for a certain application.
The importance of defining clearly what the goal of the monitoring activity is something we learnt
when testing the framework. If not done properly, the scope of the analysis becomes unmanageable
and it becomes very hard to measure if the search was successful or not. We experienced this with
one of our technology areas which were in a very early stage with various possible application areas.
Before we went about narrowing it down to one clear application area, we had great problems in
defining the scope of the monitoring activities which could have led to problems in later steps such
as building the technology tree, choosing indicators and communicating relevant findings. Therefore
88
we asked the person who were interested in the technology to define one main application area of
interest before we continued with the monitoring activities.
Defining the information need should be driven by the context of the technology and should be a
discussion between decision makers, search specialist and technology experts to define what
characteristics are the important for each specific technology. The technology characteristics that
are important for the requirement specification should be defined together with what technology
indicators should be measured for each characteristic. By properly doing so, the information search is
facilitated and could be done much more effectively and less time could be spent trying to reveal
irrelevant characteristics.
6.3.3 The Technology Indicators Our third research question related to how indicators can be used to satisfy the information need. As
we describe in section 5.5, we propose a framework of 16 different technology indicators which are
supposed to give a good overall picture of a technology area when the chosen indicators are
measured and analyzed. By plotting the indicators over time, insights into the development and
technological trends that could make up opportunities and threats for a firm could be identified.
Furthermore, we proposed mapping the indicator on the technology tree in order to give additional
insight and depth to the analysis.
In our studies of technology intelligence literature few reviews or listings of technology indicators has
been made, and specifically guidelines of how to navigate the wide set of technology indicators,
which are individually well described in literature. We think our proposed framework gives such an
overview. However, the proposed framework for how to systematically monitor developments for a
technology by the use of technology indicators is not likely to be enough to cover the technology
monitoring need of VTEC and needs to be complemented by individual monitoring activities and
networking.
Within the scope of this thesis we were not able to do a proper evaluation of the indicators, as that
would have required a validation of each indicator by for example by performing extensive testing of
the actual performance of the technologies. Rather the usefulness was evaluated based on the
comments from VTEC and our own experience in using the indicators.
During the pilot studies we noted that performing good searches is indeed a crucial part in extracting
relevant information from indicators. With irrelevant input, from e.g. patents, one will only be able
to extract irrelevant information from the indicators. Thus, we see risks in not putting enough effort
into defining good search criteria and would propose using experts for this. Here, the technology tree
had an unexpected, secondary effect as the tree actually helped in the search process.
Another reflection is that the indicators differ in their suitability for different technologies and
different situations. We noted that some of the indicators are general but some are more relevant
for a certain groups of technologies. For example when it comes to the indicator Performance
Parameter it is important to figure out what the key drivers are for a specific technology, e.g. cost,
speed, weight etc. Another example would be that one should add more product related indicators
when or if one see that a technology is mature through the technology maturity indicators. Such,
more product‐oriented indicators are product sales or indicators of how many companies that are
using the technology or not the least starting to look for next generation of technology.
89
In general, the indicators gave good input on where to zoom in and do further analysis. We conclude
that a key purpose with the indicators should be to detect unexpected results and irregularities
which probably lead to new insight.
6.3.4 Communication Our forth and last research question related to how to interpret and visualize the indicators in order
to disseminate the information to decision makers. As described in section 5.6, we propose a
consistent use of the technology radar screen to in order to increase easy assimilation and user
familiarity of the often complex technology information. We also explain how the technology tree
and the indicators supports the creation of such a radar screen.
The presentation and visualization of the technology indicators has been identified as a crucial step
in the technology monitoring since that sets the stage for what information is given to decision
makers. For our presentation, we used development and key players to illustrate how one could map
indicators onto the technology tree. Based on the discussion with VTEC, more indicators could be
interesting to map towards the tree, such as number of new entrants. This would help to examine in
even more detail where the development activities are focused the most. When presenting key
players for the technologies in the pilot study, we gave an overview of the most influential actors
within the technology fields. It was noted from VTEC that it would have also been interesting to sort
out automotive‐related actors, such as suppliers or competitors, in each of the technological sub‐
fields. We simply agree that such an indicator would be interesting and also feasible by simply listing
all such actors and filtered our results through said list.
This part of the framework was only put through a limited testing as the pilot projects were kept
within a small group of people where all were relatively knowledgeable about the technology areas.
What we did note was that when presenting the indicators it is important to not only present the
result of the indicator but also to give an explanation of what the indicator aims to indicate and its
implications. As a note, all indicators were presented in a graph showing its development over the
last 10 years, which very much helped to give a feeling of the direction of the indicator. The
technology radar screen was only presented conceptually but was very much appreciated and seen
as a useful tool to disseminate technology monitoring information to a wider audience.
6.3.5 Comments on Result in Relation to Research Questions On an academic level, previous technology monitoring literature tends to focus on specific methods,
tools or system. We think that we have, in some aspects, added another perspective on technology
intelligence in relation to previous literature by proposing a more analytical framework to conduct
technology monitoring in an objective and systematic way. To conclude, we think that we have, with
our proposed framework, both answered our research questions and added knowledge and insight
to the field of technology monitoring.
90
7 Final Conclusions In this final chapter we discuss the results on a higher level and the applicability of our proposed
framework on a larger scale in section 7.1, followed by some last words in section 7.2. Finally, some
potential further research suggestions are presented in section 7.3.
7.1 Generalization and Applicability of our Framework The proposed framework in this thesis was developed in collaboration with VTEC, which operates in
the automotive industry, and hence the framework is aimed to fit the needs of VTEC or similar
companies. There are definitely reasons to believe that other industries would partly require a
different sort of framework, especially firms which do not operate in manufacturing industries, like
life‐science or software companies. For example, how important external technology development is
for the business and thus what activities and how much resources to spend on technology
intelligence depends on the company and the industry, and are factors that alter the way companies
in different industries work with technology intelligence. Nevertheless, it is our belief that the core
concepts and principles would be valid in other industries as well without any major modifications.
We want to explicitly mention that the proposed framework does not in any way completely satisfy
the technology intelligence need in a company. The framework should be seen as one important part
of technology monitoring which needs to be complemented by other monitoring activities. The
technology indicators generate a good overall picture of the technology, but do not provide any
specific details about a technology since they are only giving indications of different technology
characteristics. Hence, the systematic use of indicators should be seen as a way to see where one
needs to look closer, and what other sources might need to be examined. As a minimum, the
proposed framework would need to be complemented with scanning, mining and trawling
capabilities.
7.2 Final Words To summarize, the purpose of this thesis was to investigate how technology indicators can be used to
systematically monitor developments in a given technology field, and propose steps toward an
applicable framework. With an extensive theoretical foundation, a successful small‐scale case study
and an insightful pilot study with positive comments from our host company, we believe that our
proposed framework for monitoring with indicators serves as a valid proposal of such a framework.
We see it as challenging but possible to implement such an approach on a larger scale and believe it
would contribute to a better understanding of the external technology development.
As a final note we would like to state that the technology indicators, as with any other indicators, are
not perfect, neither technically or conceptually. However, the technology indicators could be used to
inform intuition of business managers when taking strategic decision relating to technologies. It
certainly seems clear that in the lack of better approaches, and with the alternative of relying on
subjective assessment of individuals, a company using technology indicators to extract intelligence
from the increasingly massive information flow of today’s business world, is much more likely to
take the correct decisions and prosper in the technology‐rich years to come.
91
7.3 Suggestions for Further Research A number of interesting areas have, during the process of this thesis, been identified for possible
further research. Below, we present a sample of the ones we find most interesting.
Perform a quantitative evaluation of the indicators by measuring indicators versus real
development. It would be very interesting to make a study on one, or several indicators to
investigate how well they reveal the characteristics of a given technology. Only then, could
one completely evaluate and assess the impact of using technology indicators.
IT systems to support the information heavy process. When performing technology
monitoring, it is inevitable having to face the challenge with the large information loads
related to technology monitoring. To make our proposed framework work efficiently in
company, it would be valuable to design an IT system that could handle the information in a
structured way, e.g. storing patens, calculating indicators and keeping track of information
mapped to a technology tree. We also see potential in automating parts of the framework to
further increase efficiency in the monitoring process.
Testing and evaluation of the framework in other industries. As the proposed framework
was develop in collaboration with, and for the automotive industry, it would be interesting to
make similar pilot studies in other industries. In particular, software and life science
industries would be interesting were different product logics and thus design hierarchies and
information needs are present.
92
8 Bibliography Abernathy, J. W., & Utterback, J. M. (1978). Patterns of industrial innovation. Technology Review, Vol.
80, No. 7 , 40‐47.
Alexander, C. (1964). Notes on the synthesis of form. Cambridge: Harvard University Press.
Andersen, H. (1994). Vetenskapsteori och metodlära ‐ En Introduktion. Lund: Studentlitteratur.
Björk, B.‐C., Roos, A., & Lauri, M. (2009). "Scientific journal publishing: yearly volume and open access
availability" Information Research, 14(1) paper 391. [Available from 12 January, 2009 at
http://InformationR.net/ir/14‐1/paper391.html].
Breitzman, A. F., & Mogee, M. E. (2002). The many applications of patent analysis. Journal of
Information Science, 28 (3) , 187‐205.
Brenner, M. (2005). Technology Intelligence at Air Products: Leveraging Analysis and Collection
Techniques. Competitive Intelligence Magazine, vol 8, no 3 .
Bright, J. R. (1970). Evaluating signals of technological change. Harvard Business Review 48, 1 , 62‐70.
Brockley, E. M. (2004). Emerging Technology Intelligence: Scanning and Monitoring for Strategic
Planning. Cambridge: Massachusetts Institute of Technology.
Bryman, A., & Bell, E. (2007). Business research methods. New York: Oxford University Press Inc.
Chang, H. (2008). A Methodology for the Identification of Technology Indicators.
Chesbrough, H. W. (2003). Open Innovation: The New Imperative for Creating and Profiting from
Technology.
Christensen, C. M., & Rosenbloom, R. S. (1995). Explaining the attacker's advantage: technological
paradigms, organizational dynamics, and the value network. Research Policy , 233‐257.
Clark, K. B. (1985). The interaction of design hierarchies and market concepts in technological
evolution. Research Policy, Vol 14, Iss 5 , 235‐251.
Daim, T. U., Rueda, G., Martin, H., & Gerdsri, P. (2006). Forecasting emerging technologies: Use of
bibliometrics and patent analysis. Technological Forecasting & Social Change 73 , 981‐1012.
Day, G. S., Schoemaker, P. J., & Gunther, R. E. (2000). Wharton on Managing Emerging Technologies.
New Jersey: John Wiley & Sons, Inc.
Denscombe, M. (1998). The good research guide – for small scale projects. Maidenhead, Philadelphia:
Open University Press.
Durand, T. (1991). Dual technological trees: Assessing the intensity and strategic significance of
technological change. Research Policy, Vol 21 , 361‐380.
Durand, T. (2010). Technology Intelligence. In V. K. Narayanan, & G. C. O'Connor, Encyclopedia of
Technology and Innovation Management (pp. 25‐36).
93
Eriksson, L. T., & Wiedersheim‐Paul, F. (2001). Att utreda, forska och rapportera. Malmö: Liber
Ekonomi.
Ernst, H. (2003). Patent information for strategic technology management. World Patent Information
25 , 233–242.
Ernst, H. (1998). Patent portfolios for strategic R&D planning. Journal of Engineering and Technology
Management, 15 , 279‐308.
Ford, D. (1988). Develop Your Technology Strategy. Long Range Planning, Vol. 11, No. 5 , 85‐95.
Foster, R. (1986). The s‐curve: A new forecasting tool. In R. Foster, Innovation ‐ The attacker's
advantage (pp. 88‐111).
Frazier, R. M., Daly, D. T., Swatloski, R. P., Hathcock, K. W., & South, C. R. (2009). Recent Progress in
Graphene‐Related Nanotechnologies. Recent Patents on Nanotechnology, Vol 3, No 3 , 164‐176.
Garson, G. D. (2002). Guide to Writing Empirical Papers, Theses, and Dissertations. Raleigh, North
Carolina: Marcel Dekker, Inc.
Grupp, H. (1998). Foundations of the economics of innovation: theory, measurement, and practice.
Cheltenham, UK : Edward Elgar Publishing Ltd.
Grupp, H., & Hohmeyer, O. (1986). A Technometric Model for the Assessment of Technological
Standards and Their Application to Selected Technology‐Intensive Products. Technological
Forecasting and Social Change, 30 , 123‐137.
Haupt, R., Kloyer, M., & Lange, M. (2007). Patent indicators for the technology life cycle
development. Research Policy, 36 , 387‐398.
Henderson, R. M., & Clark, K. B. (1990). Architectural innovation: The reconfiguration of existing
product technologies and the failure of established firms. Administrative Science Quarterly , 9‐30.
Holme, M., & Solvang, B. K. (1997). Forskningsmetodik – om kvalitativa och kvantitativa metoder.
Lund: Studentlitteratur, 2nd edition.
Kaplan, S. N., Sensoy, B. A., & Strömberg, P. (2002). How well do venture capital databases reflect
actual investments? Available at SSRN: http://ssrn.com/abstract=939073.
Kasanen, E., Lukka, K., & Siitonen, A. (1993). The Constructive Approach in Management Accounting
Research. Journal of Management Accounting Research. 5 , 241‐264.
Kerr, C., Mortara, L., Phaal, R., & Probert, D. (2006). A conceptual model for technology intelligence.
Int. J. Technology Intelligence and Planning, Vol. 2, No. 1 , 73.
Kim, Y. G., Suh, J. H., & Park, S. C. (2008). Visualization of patent analysis for emerging technology.
Expert Systems with Applications , 1804‐1812.
Kärkkäinen, M. (2005). Forwarder Independent Tracking Systems: Problem Description and Solution
Design Proposal. Doctoral Dissertation, Helsinki University of Technology.
94
Lang, H. C., & Mueller, M. (1997). Technology Intelligence: Identifying and Evaluating New
Technologies. Innovation in Technology Management ‐ The Key to Global Leadership (p. 218). PICMET
'97: Portland International Conference on Management and Technology.
Lantz, A. (2007). Intervjumetodik. Lund: Studentlitteratur.
Lichtenthaler, E. (2004). Technological change and the technology intelligence process: a case study.
Journal of Engineering and Technology Management, 21 , 331‐348.
Lichtenthaler, E. (2006). Technology intelligence: identification of technological opportunities and
threats by firms. Internation Journal of Technology Intelligence and Planning, Vol. 2, No. 3 , 289‐323.
Lindmark, S. (2006). Techno‐economic analysis – an introduction [compendium]. Gothenburg:
Chalmers University of Technology.
McEvily, S. K., & Chakravarthy, B. (2002). The persistence of knowledge‐based advantage: an
empirical test for product performance and technological knowledge. Strategic Management Journal
, 285–305.
Merriam, S. B. (1994). Fallstudien som forskningsmetodik. Lund: Studentlitteratur AB.
Mortara, L., Kerr, C., Phaal, R., & Probert, D. (2009). A toolbox of elements to build Technology
Intelligence systems. Int. J. Technology Management, Vol. 47 , 322.
Mortara, L., Kerr, C., Probert, D., & Phaal, R. (2007). Technology Intelligence: Identifying threats and
opportunities from new technologies. Cambridge: University of Cambridge Institute for
Manufacturing.
Narin, F. (1993). Technology Indicators and Corporate Strategy. Review of Business, Vol. 14 .
Nordlund, M. (2011, 04 07). Strategic Technology Intelligence. (A. Nyberg, & S. Palmgren,
Interviewers)
Patel, R., & Davidson, B. (2003). Forskningsmetodikens grunder. Lund: Studentlitteratur, 3rd edition.
Patton, M. (2002). Qualitative research and evaluation methods. Thousand Oaks, CA: Sage
Publications, Inc.
Petrusson, U. (2004). Intellectual Property & Entrepreneurship: Creating Wealth in an Intellectual
Value Chain.
Porter, A. L. (2007). Tech Mining to Drive Open Innovation. Proceedings of the First International
Conference on Technology Innovation, Risk Management and Supply Chain Management (pp. 1‐13).
Beijing: Universe Academic Press, Toronto.
Porter, A. (2005:b). QTIP: Quick technology intelligence processes. Technological Forecasting & Social
Change, 72 , 1070‐1081.
Porter, A. (2005). Tech mining: exploiting new technologies for competitive advantage.
95
Reger, G. (2001). Technology Foresight in Companies: From an Indicator to a Network and Process
Perspective. Technology Analysis & Strategic Management, Volume 13, Issue 4 , 533 ‐ 553.
Rohrbeck, R. J. (2006). The Technology Radar ‐ an Instrument of Technology Intelligence and
Innovation Strategy. The 3rd IEEE International Conference on Management of Innovation and
Technology, (pp. 978‐983). Singapore.
Rohrbeck, R. (2007). Technology Scouting – a case study on the Deutsche Telekom Laboratories.
ISPIM‐Asia 2007 conference (p. 14). New Delhi: Munich Personal RePEc Archive.
Savioz, P. (2004). Technology intelligence: concept design and implementation in technology‐based
SMEs. New York: Palgrave Macmillan.
Schuh, G., & Grawatsch, M. (2004). TRIZ‐based Technology Intelligence. 13th International
Conference on Management of Technology. Washington DC & Miami: International Association for
Management of Technology.
Schwartz, R., & Mayne, J. (2005). Assuring the quality of evaluative information: theory and practice.
Evaluation and Program Planning, Vol 28, No 1 , 1‐14.
Thomas, P., & McMillan, S. G. (2001). Using science and technology indicators to manage R&D as a
business. Engineering Management Journal, Vol. 13 No. 3 , 9‐14.
Trott, P. (2008). Innovation Management and New Product Development, 4th Edition. Harlow:
Financial Times/Prentice Hall.
Utterback, J. M., & Brown, J. W. (1972). Profiles of the future: Monitoring for Technological
Opportunities. Business Horizons 15 , 5‐15.
Utterback, J. (1994). Mastering the dynamics of innovation. Boston: Harvard Business Press.
Watts, R. J., & Porter, A. L. (1997). Innovation Forecasting. Technological Forecasting and Social
Change, 56 , 25‐47.
Verbeek, A., Debackere, K., Zimmermann, L., & Zimmermann, E. (2002). Measuring progress and
evolution in science and technology ‐ I: The multiple uses of bibliometric indicators. International
Journal of Management Reviews, volume 4 issue 2 , 179‐211.
Veugelers, M., Bury, J., & Viaene, S. (2010). Linking technology intelligence to open innovation.
Technological Forecasting & Social Change, 77 , 335‐343.
Wilbers, W., Albert, T., & Walde, P. (2010). Upscaling the Technology Intelligence process. Int. J.
Technology Intelligence and Planning, Vol. 6, No. 2 , 185‐203.
WIPO. (2010). "World Intellectual Property Indicators". Available at
http://www.wipo.int/ipstats/en/statistics/patents.
Yakob, R., & Tell, F. (2007). Managing near decomposability in complex platform development
projects. Int. J. Technology Intelligence and Planning , 387‐407.
Yin, R. K. (1994). Case Study Research – Design and Methods. USA, CA: Sage cop. Thousand Oaks.
96
Zhu, D., & Porter, A. L. (2002). Automated extraction and visualization of information for
technological intelligence and forecasting. Technological Forecasting and Social Change, 69 , 495–
506.
97
9 Appendix 1 – Interview Template for Small Scale Case Studies 1. How does Company X work with technology intelligence?
a. What different types of technology intelligence are you using?
b. How does the overall organization look like? Who are you reporting to?
c. How does the overall process look like?
d. What questions are you using technology intelligence to answer?
2. Describe your role as technology intelligence Manager
3. How does Company X work with systematically monitoring and evaluating external
technologies that have been identified as relevant to the company?
a. How does the organization look for this?
b. What different roles do you have?
c. Who owns the responsibility for monitoring the development within one technology
field?
d. How do you define the technology field that is going to be monitored?
e. How do you decide how a technology should be assessed and in relation to what
(e.g. a specific product type, a specific application area, or many areas in parallel)?
i. How is the requirement specification made?
ii. Is there any automated process?
iii. How do you assess what potential the technology has for the company?
f. What technology indicators are you using?
i. How do you decide what indicators that should be used?
ii. What factors affect the choice of indicators?
g. How do you measure the indicators?
h. What sources of information are you using and in what way? E.g. how are you
searching for unstructured text on the Internet, how are patents used?
i. What tools are you using for monitoring of technologies?
i. Programs
ii. IT systems
4. How does the work differ between monitoring the development for new external
technologies, which are not part of Company X’s existing product or technology portfolio,
and monitoring technologies that are already a part of the technology portfolio?
5. Does Company X have any external actors that you collaborate with?
6. Har AstraZeneca några externa aktörer som ni samarbetar med?
a. Universities
b. Information consultants
c. Other actors
7. How does Company X work with communicating the information from the technology
intelligence process to decision makers?
a. Who are the decision makers and what decisions are based on the information
coming from the technology intelligence process?
b. What information is communicated?
c. In what way is the information documented and communicated?
d. How often is information communicated?
8. What is the vision for your work with technology intelligence?
98
a. What are the major challenges facing Company X in your way of working with
technology intelligence at the current stage?
b. How do you think that it could be improved?