Embed Size (px)
Citation preview

Using iMapInvasives Custom Query Tools
iMapInvasives includes a custom query tool for searching observation records. There are two versions of the custom query tool:
1) The Map Query Tool is accessible on the map screen from the My iMapInvasives page and allows users to display specific
observations on the map depending on a particular region or species of interest. Users can also display assessments,
surveys, and treatments, depending on user level. This is a reduced version of the tool as it only displays results on the map.
2) The Custom Observation Query Tool is accessible from the My iMapInvasives page and allows users to display query
results on the map, in a table, or in a report. This is the full query tool, providing search options for specific observations,
common invasive species, early detection, and approaching region. (The Custom Observation Query option is also available
by clicking on the Configure Query button under the Invasive Species tab on the map screen).

Let’s get started by first discussing the Map Query Tool.
To open the map query tool, click on View the Map from the My iMapInvasives page.

Once the map page opens, locate the search bar (map query tool) near the top of the page.
Using the search bar, you can query observations by entering a particular species name
(common or scientific name), location name or specific address, or record ID#.
Notice the three buttons located to the right of the search bar. Use these tools in conjunction with the map query tool:
1. The magnifying glass is used to begin a search after entering in your query criteria.
2. The circular arrow is used to refresh the screen and begin a new search.
(A new search cannot be made without first refreshing the screen.)
3. The miniature magnifying glass on a square allows you to zoom into a particular area of the map for a more
detailed view. To do this, hold down the shift key while clicking and dragging the mouse over the area of interest.
(You can also zoom in and out on the map by using the “+” and “-” buttons on the left side of the map).

Take note of the toolbar on the left side of the map screen (see previous page).
The following is an overview of the functions found in this toolbar.
Zoom to the selected county
Zoom to coordinate Quic
k Z
oo
m
Quer
y O
bse
rvat
ion
by S
pec
ies
Select to clear active query
Select to open custom observation query window
Current query criteria
Spec
ies
Dis
trib
uti
on
Select category
Select common name
OR
Select scientific name
Learn more about a selected species
Show species distribution by county -
Hide species distribution by clicking “Hide”
Legend shows distribution information
Select record type
Enter record ID#
Show record, zoom to record, clear record from selection
Qu
ery b
y
Typ
e &
ID
#
Sel
ect
Bas
e L
ayer
Invas
ive
Spec
ies
Obse
rvat
ion
Lay
ers
Invas
ive
Spec
ies
Ad
van
ced
Lay
ers
Map
Over
lay L
ayer
s
Select base layer
Turn layer on/off
Change layer opacity
May layer symbology

Search by Species
In the following example, I want to know the locations of all confirmed observations submitted for Dreissena polymorpha
(zebra mussel) to date. To do this, I’ll type in the common or scientific name of the species in the search bar and click the
magnifying glass button to query the map. The results appear on the map in the form of red circles with numbers inside.
The red circles and numbers represent the number of confirmed observations for zebra mussels in a
different areas of the state. By having the number of observations listed this way, the map is less
cluttered and more information about the observations is visible to the user.

Now I want to zoom into a particular area and learn more about the observations listed there.
Using the miniature magnifying glass (3rd
button), I click and drag a box over the red circle with the
number 47 inside (see previous map). Here’s what the map will look like after zooming in:
As you can see, the circle with the number 47 has disappeared, but in its place are three other circles. If you
add the numbers in each circle together (31+13+3), the total is 47. As you can see, by zooming in to a
particular area of the map, I have “broken down” the initial amount of observations shown (47) to a smaller
amount, providing more detail on the specific location of each observation.
Also while on this page, take note of the small map in the corner.
This shows the area of the state that I am currently zoomed in to.

To learn more about the observations represented by each red circle, click on one of the circles to bring up an informational
table as shown below. In this example, I clicked on the circle with the number 3 inside. The associated table provides me
with information about each of the three records including the scientific name, the observer’s organization (if any), and the
county where the observation was made. The table also provides each observation’s unique ID#. By clicking on one of
these ID#’s, I can view the entire record associated with the observation.

Search by Location
In the following example, I want to know if any confirmed observations have been submitted in or near
Presque Isle State Park. To find this out, I type “Presque Isle State Park” into the search bar and click the
magnifying glass to search my query. The map then zooms to the state park; however, I don’t see any red circles
on the map. In order to know if any confirmed observations are located here, I need to check the box next to
“Combined” in the left-side toolbar. (Combined data includes partner data, confirmed data, and data from USGS-
NAS). Now I can see there are many confirmed observation points in and nearby Presque Isle State Park.
Keep in mind that when querying by location, there are several ways to search including entering a
specific address, county, town, state game lands/state forest, river/lake/pond, etc.

Search all Observations
In the following example, I want to see all the confirmed and unconfirmed observations in iMap to date.
To do so, I’ll check the box next to “Combined” and “Unconfirmed” (and not perform any specific query in the
search box). In this case, the “Confirmed” box does not need to be checked because the “Combined” data already
includes the confirmed data as well as partner data and USGS-NAS data. Notice the resultant red circles
(combined data) and one yellow circle on the map with the number 2 inside. This yellow circle represents two
unconfirmed observations that have not yet been reviewed and confirmed by the state administrator.

Search by ID#
In the following example, I want to find a specific observation on the map. To do this, I’ll type in the observation ID# I’m
looking for (PA-329U) into the search bar and begin my query. After clicking on the magnifying glass to search my ID#, the
map displays the selected observation by zooming in very close to the observation location. To learn more about this
observation, I can click on the red observation circle to bring up a table of basic information, as seen below. By clicking on the
observation ID# in the table, I can see the entire observation record.

Search for Invasive Species Details
In the following example, I want to see if any assessments have been submitted for invasive animal species. To begin this
query, I’ll scroll down along the menu on the left side of the page and select Assessments – Animals under the Invasive
Species Details section. The map then displays several small yellow areas, each representing a separate animal assessment.
Keep in mind that depending on the base layer you have selected, it may be very difficult to see the yellow polygons appear on
the map. For this example, I’ve selected the “Google Aerials” base layer, and I have no problem viewing the yellow areas. By
hovering over one of the yellow polygons, the assessment ID will appear, as seen below. By clicking on it, I can then view a
brief description of the assessment and click on the associated hyperlink to see the full assessment record.
This type of query is restricted based on an account holder’s user level (any level below a 3 will not be able to perform this
query). User level 3 can search assessment data, user level 4 can search assessment and survey data, and user level 7 can
search assessment, survey, and treatment data. Any level above 7 will also be able to perform this query type.

Now let’s talk about the Custom Observation Query Tool. This tool is similar to the Map Query Tool,
but with more options for choosing a query type and the presentation of query results.
Open this tool from the My iMapInvasives page under the Query and Reports section.
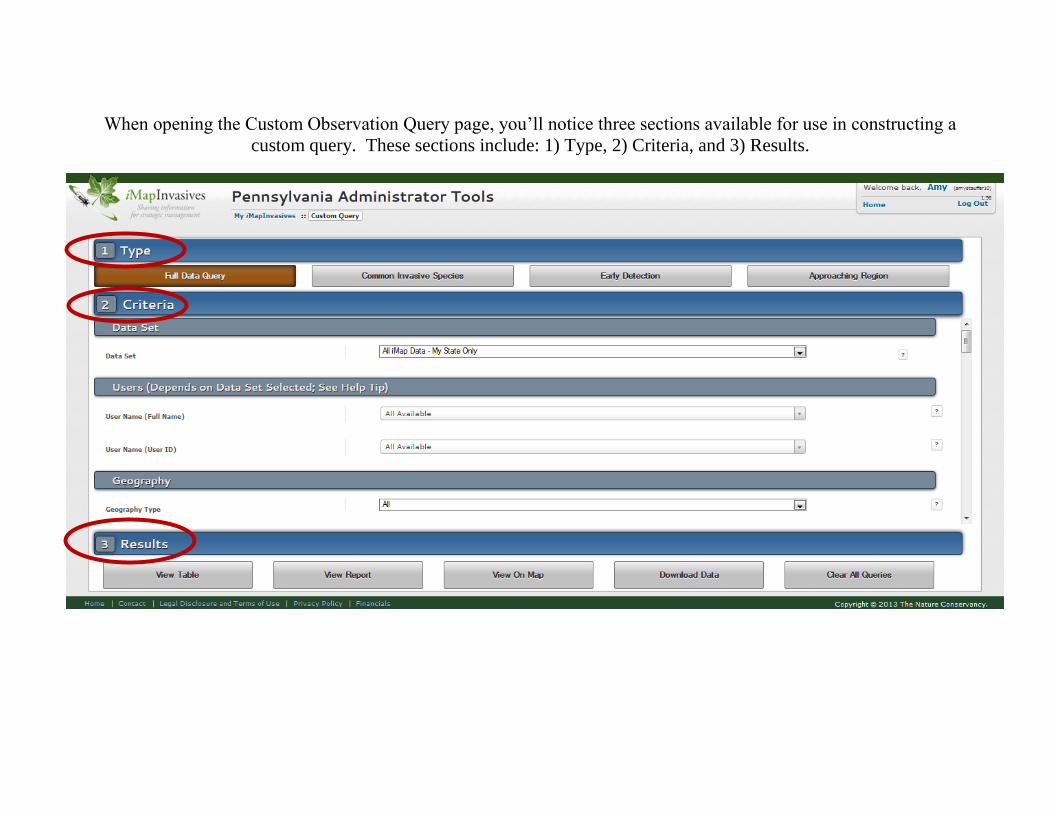
When opening the Custom Observation Query page, you’ll notice three sections available for use in constructing a
custom query. These sections include: 1) Type, 2) Criteria, and 3) Results.

In the Type section, the default query is the “Full Data Query”. This query will provide results for all records
that match your query parameters. This is the only query type that allows results to be shown in a table, a report,
or on the map, and is the most powerful query option. The other three query types only provide a summary
report and have much more restricted query options. We’ll go over the other three query types as we go along.

To begin a Full Data Query, select information from the drop-down fields located in the Criteria section.
All drop-down fields are optional. If you do not choose anything from the drop-downs and proceed to the Results
section at the bottom, your query will simply return all confirmed observation records in the chosen Results format.

To build your query, you may choose one or several of the available fields listed in the Criteria section.
The following is a brief description of each criterion available:
Data Set: Choose to limit the query results to:
All iMap Data – My State Only
All iMap Data – Including Other States
Data I Have Entered
Data I Am Observer For
Geography Type & Value: Limit to a certain geography (e.g. County, Coordinate, Waterbody, etc.), and choose a
buffer distance if desired.
Species: Choose a specific species or genus. (You will first need to choose the species type (Animal, Insect, Plant)
using the radio buttons, then choose the species from the drop-down list.
Species Type: View observations for a specific type of species (e.g. Terrestrial Animal, Aquatic Plant, etc.)
Kingdom: Search by Plantae or Animalia.
Date Observed Range: Choose a start and end observation date for your results.
Organization: View observations submitted by a particular organization.
Project: If you are a member of any projects, you can limit the results to one of your projects with this drop-down.
Data Status: Limit search results to:
Confirmed - Observations that have been entered online and have been accepted by the iMap data administrator.
Unconfirmed - Observations that have been entered online and are waiting to be confirmed.
Partner data - Bulk upload data from iMap partner organizations, assumed to be quality data.
CAPS - Cooperative Agricultural Pest Survey – not yet part of PA iMap.
NAS – Nonindigenous Aquatic Species data from the U.S. Geological Survey – not yet part of PA iMap.
Data Entry Date Range: Enter a data range for when an observation was entered into iMap. If you want to specify
a single day, ensure that the start and end date are the same.

Once you have chosen the parameter(s) for your query, select a format from the Results section to display your
query results in. Options available include viewing results in a table, a report, or on the map.
Choose View Table to view results in a table of observations that match your search. You can then click on a
record in the table to view the full observation record.
Choose View Report to produce a summary report of the matching observations. The report shows observations
per species, the county where the observation was made, and the organization(s) reporting these observations.
You will not have access to the full observation record from the report.
Choose View on Map to bring up the map screen and display the matching observations. You can then click on
the circles shown on the map to pull up the associated observation ID# for those species. By clicking on a specific
observation ID#, you’ll be able to see the full observation record.
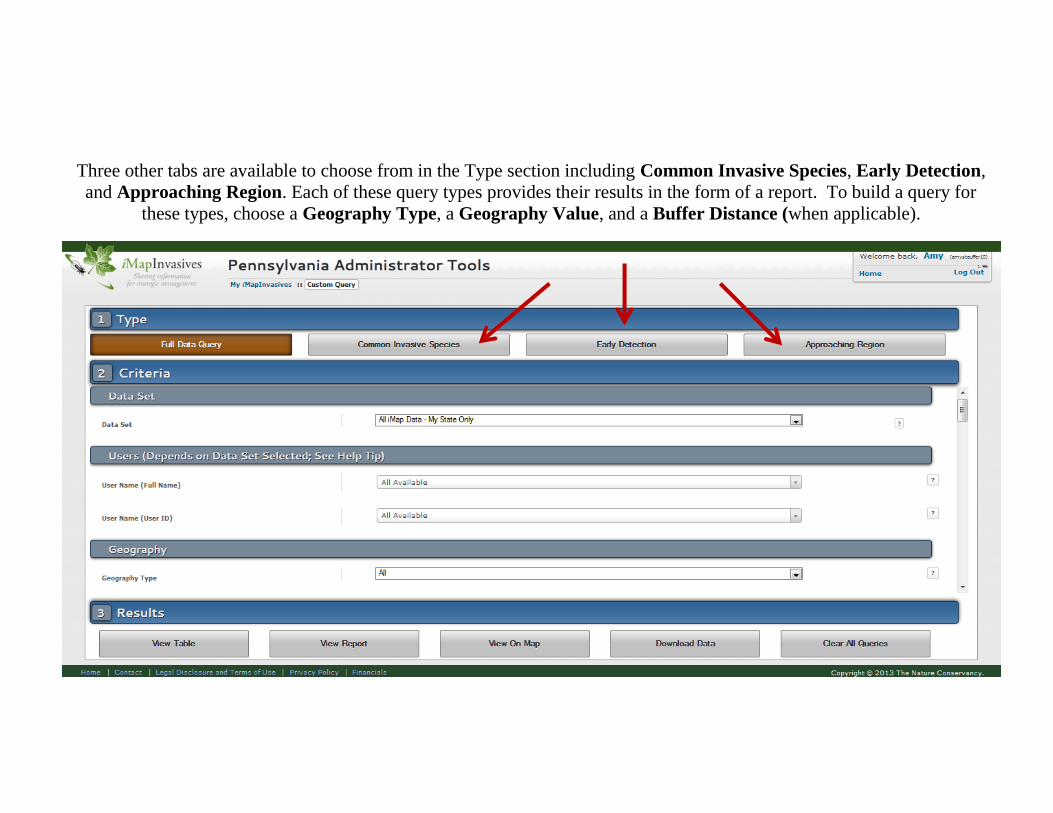
Three other tabs are available to choose from in the Type section including Common Invasive Species, Early Detection,
and Approaching Region. Each of these query types provides their results in the form of a report. To build a query for
these types, choose a Geography Type, a Geography Value, and a Buffer Distance (when applicable).

The Common Species query allows a user to generate a quick list of common invasive species that have been
reported in a chosen geography. For example, a user can generate a report of common invasive species found in
Centre County, or in the Quehanna Wild Area under the Conservation Lands category. Common species are
designated by the state iMap data administrator and are generally known to occur in a majority of Pennsylvania counties.
To see what species are currently designated as “common” in iMap, run a Common Species query without providing a
specific geometry – just open the query and click “View Report”. You can view the list of common species in the
Species section of the report, or click the “View Quick Summary Report” link at the top of the report page to generate
a simpler list of these species. (The following page provides the associated screenshot for this description.)

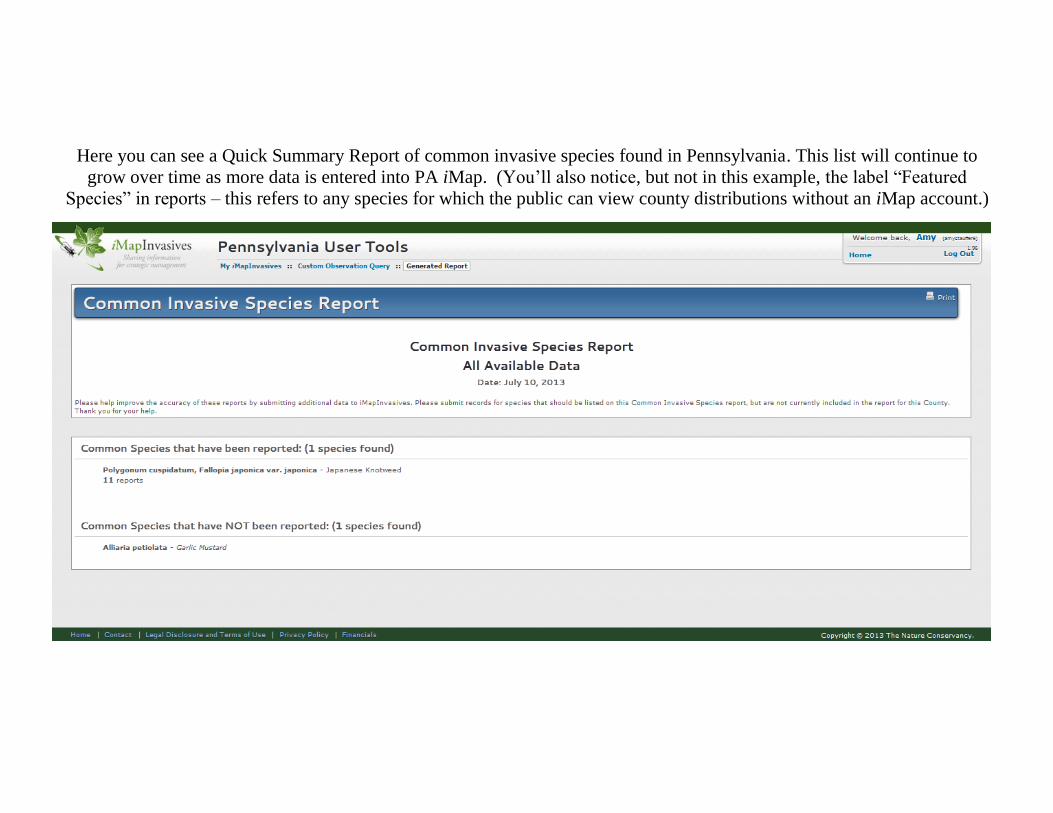
Here you can see a Quick Summary Report of common invasive species found in Pennsylvania. This list will continue to
grow over time as more data is entered into PA iMap. (You’ll also notice, but not in this example, the label “Featured
Species” in reports – this refers to any species for which the public can view county distributions without an iMap account.)

Early Detection queries will show species that have 3 or less observations submitted for a chosen geography.
The intent of this query is to provide a list of species that have begun to show up in an area of interest but have
not yet become established. Once a geography is chosen (e.g. county, conservation lands, waterbody), you can
also provide a buffer distance. For example, if you give a buffer distance of 3200 meters, your results will show
species that have 3 or less observations that are either intersecting or within 3200 meters of the area of interest.
To view the results of your query, click the View Report tab.
Keep in mind that there may be some species that might appear to be Early Detection Rapid Response (EDRR)
candidates simply because they have not been reported on much in iMap. Let this reminder serve as encouragement
for you to enter observations into iMap for these species to put them over the EDRR threshold.
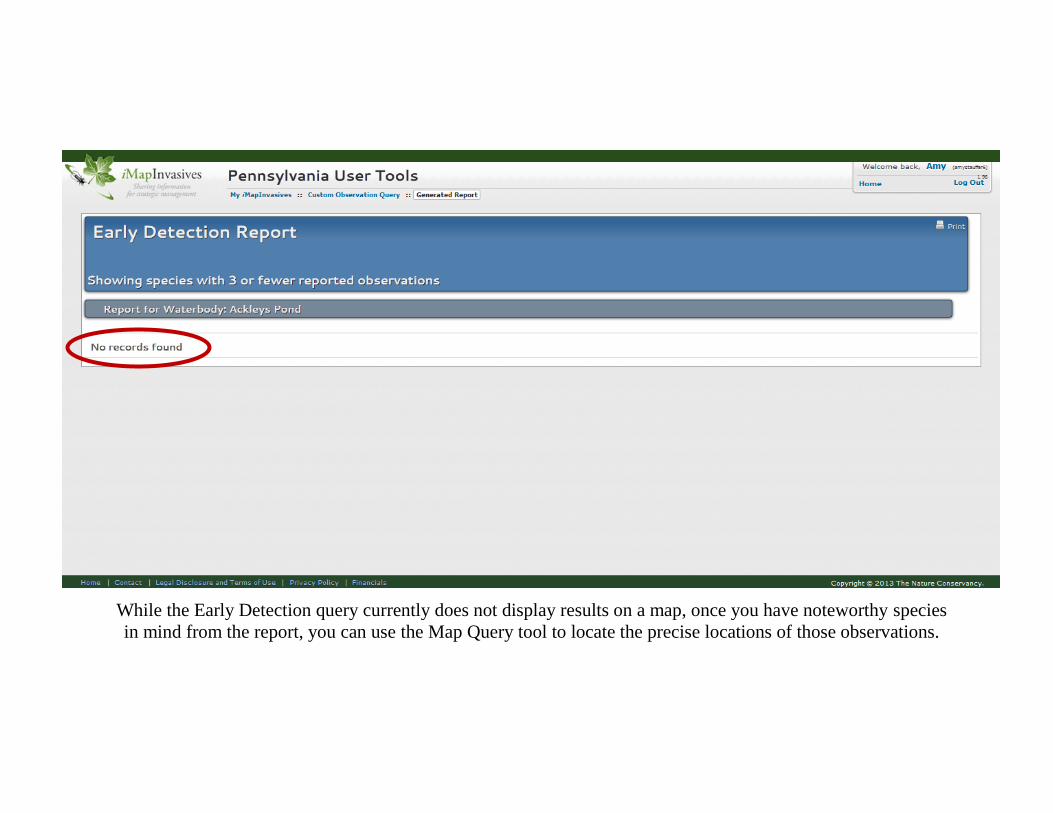
While the Early Detection query currently does not display results on a map, once you have noteworthy species
in mind from the report, you can use the Map Query tool to locate the precise locations of those observations.
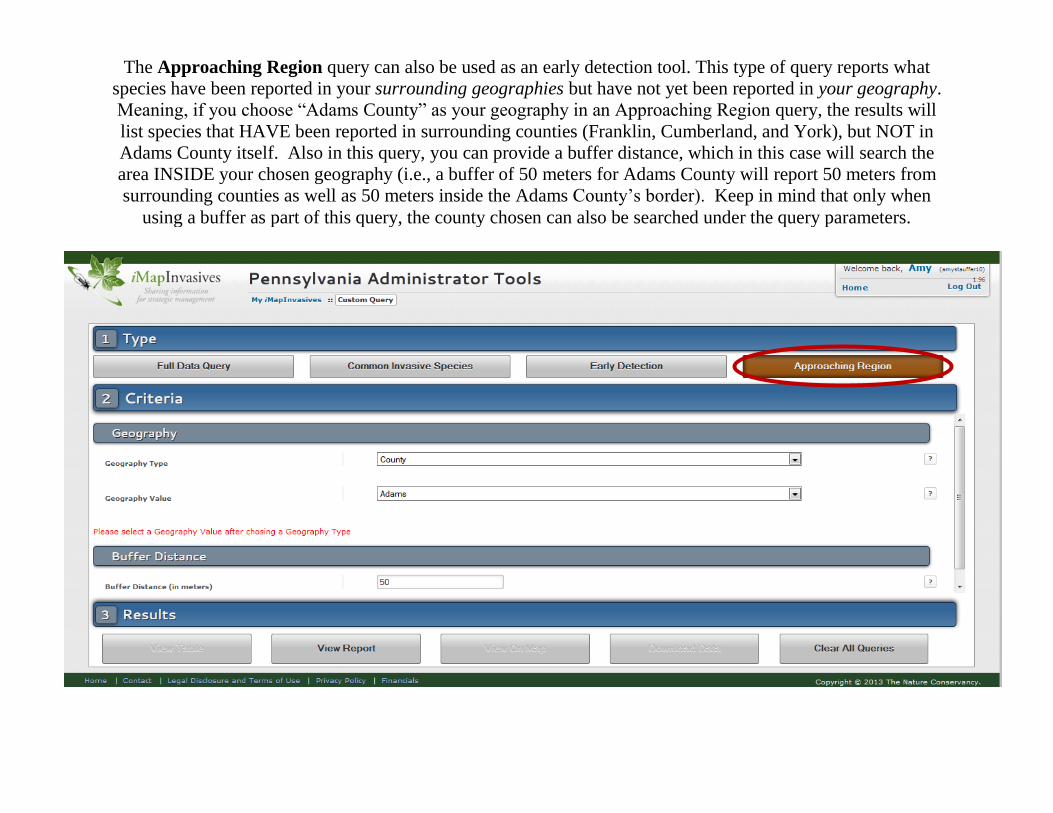
The Approaching Region query can also be used as an early detection tool. This type of query reports what
species have been reported in your surrounding geographies but have not yet been reported in your geography.
Meaning, if you choose “Adams County” as your geography in an Approaching Region query, the results will
list species that HAVE been reported in surrounding counties (Franklin, Cumberland, and York), but NOT in
Adams County itself. Also in this query, you can provide a buffer distance, which in this case will search the
area INSIDE your chosen geography (i.e., a buffer of 50 meters for Adams County will report 50 meters from
surrounding counties as well as 50 meters inside the Adams County’s border). Keep in mind that only when
using a buffer as part of this query, the county chosen can also be searched under the query parameters.

Below is an example of an Approaching Region query set up to identify any species that fall within a 50
meter distance of a specific set of GPS coordinates (Latitude = 41.9889, Longitude = -79.131). To view
the results of this query, click on the View Report tab.

In the Approaching Region report shown here, you can view any observations that fit the search criteria
listed above. In this example, there is one observation being displayed, showing which county the
observation was located in and the observer’s organization he/she represents. Other information, such as
a project, may be shown here depending on the observation(s) being displayed.

By clicking on the View Quick Summary Report link (see previous page), you’ll be able
to see a more concise version of the Approaching Region Report results, as shown here.