Embed Size (px)
Citation preview

Using hubs and authorities to characterize international to characterize international
relations
Michael Friedman and Richard Stoll and Devika Subramanian
Rice University
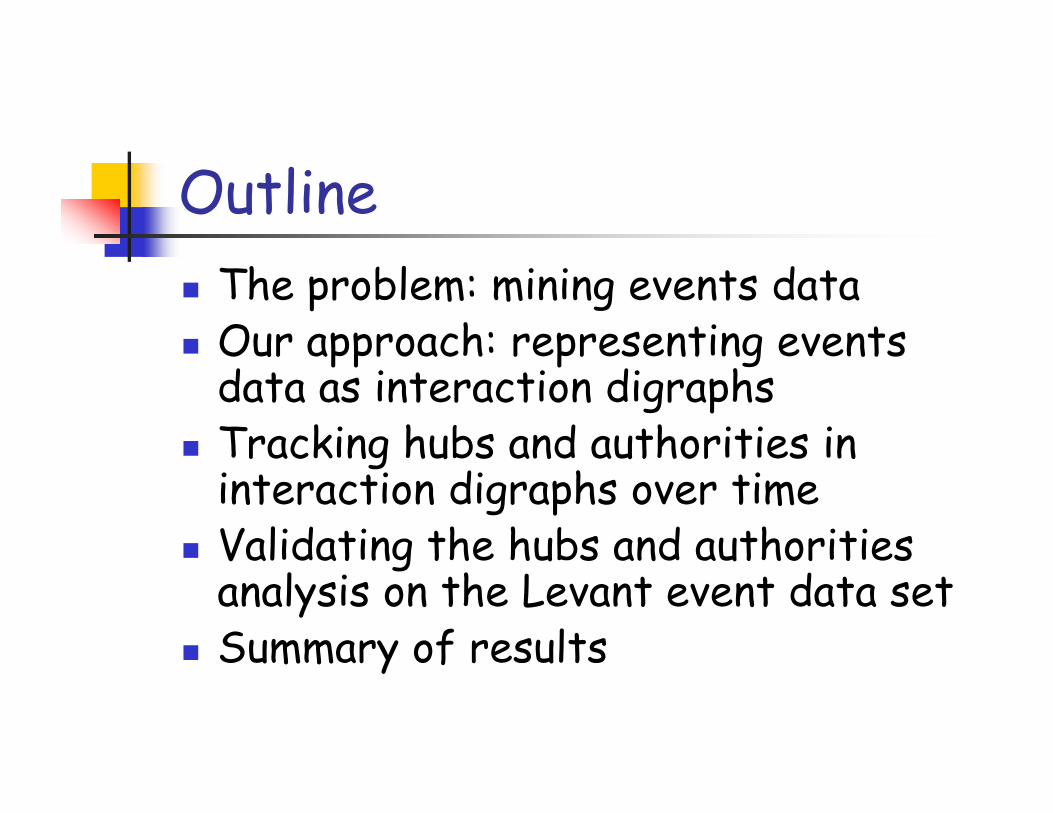
OutlineThe problem: mining events data Our approach: representing events Our approach representing events data as interaction digraphsTracking hubs and authorities in rack ng hubs and author t es n interaction digraphs over timeValidating the hubs and authorities Val dat ng the hu s and author t es analysis on the Levant event data setSummary of resultsummary f r u t

Events dataDate Actor Target Weis Code Wies event Goldstein scale
790415 ARB ISR 223 (MIL ENGAGEMENT) -10790415 EGY AFD 194 (HALT NEGOTIATION) -3.8790415 PALPL ISR 223 (MIL ENGAGEMENT) 10790415 PALPL ISR 223 (MIL ENGAGEMENT) -10790415 UNK ISR 223 (MIL ENGAGEMENT) -10790415 ISR EGY 31 (MEET) 1790415 EGY ISR 31 (MEET) 1790415 ISRMIL PAL 223 (MIL ENGAGEMENT) -10790415 PALPL JOR 223 (MIL ENGAGEMENT) 10790415 PALPL JOR 223 (MIL ENGAGEMENT) -10790415 EGY AFD 193 (CUT AID) -5.6790415 IRQ EGY 31 (MEET) 1790415 EGY IRQ 31 (MEET) 1790415 ARB CHR 223 (MIL ENGAGEMENT) -10790415 JOR AUS 32 (VISIT) 1 9
177 336 t f A il 1979 t O t b 2003 i L t
790415 JOR AUS 32 (VISIT) 1.9790415 UGA CHR 32 (VISIT) 1.9790415 ISRGOV ISRSET 54 (ASSURE) 2.8
177,336 events from April 1979 to October 2003 in Levantdata set (KEDS).

Mining events dataWhat can be predicted from events data?data?
Patterns in Israel-Palestine conflict (Schrodt et. al. 2004).( )Forecasting conflict in the Balkans using HMMs (Schrodt et. al. 2000).( )Early warning of conflict in S. Lebanon using HMMs (Schrodt et. al. 1997)

The approachesLearn statistical models from events data.
Example: Sequential data models such as HMMs pimplicitly build conditional probabilities of observing a particular event type or a conflict level based on history of past eventslevel based on history of past events.
Posit high-level interaction patterns and look for evidence in the events data. f
Tit-for-tat, olive branch, etc..

Problems with learning gapproaches
Overall accuracies are low (~ 50%).False positive rates are high (~ 70%)False positive rates are high (~ 70%).False negative rates are high (~ 10%).
S : F ti g C fli t i th B lk Source: Forecasting Conflict in the Balkans using Hidden Markov Models, Schrodt et. al.2000.

Problems with pattern-based papproaches
Need patterns to be defined apriori. No mechanism to create new patterns No mechanism to create new patterns directly from the data.Most patterns are deterministic not Most patterns are deterministic not stochastic.

Fundamental problems -- IEvents data is highly noisy
Noise arises from errors made by Noise arises from errors made by automated coding programs.Noise arises from “irrelevant” events, No se ar ses from rrelevant events, events that should not be included in the analysis based on context.
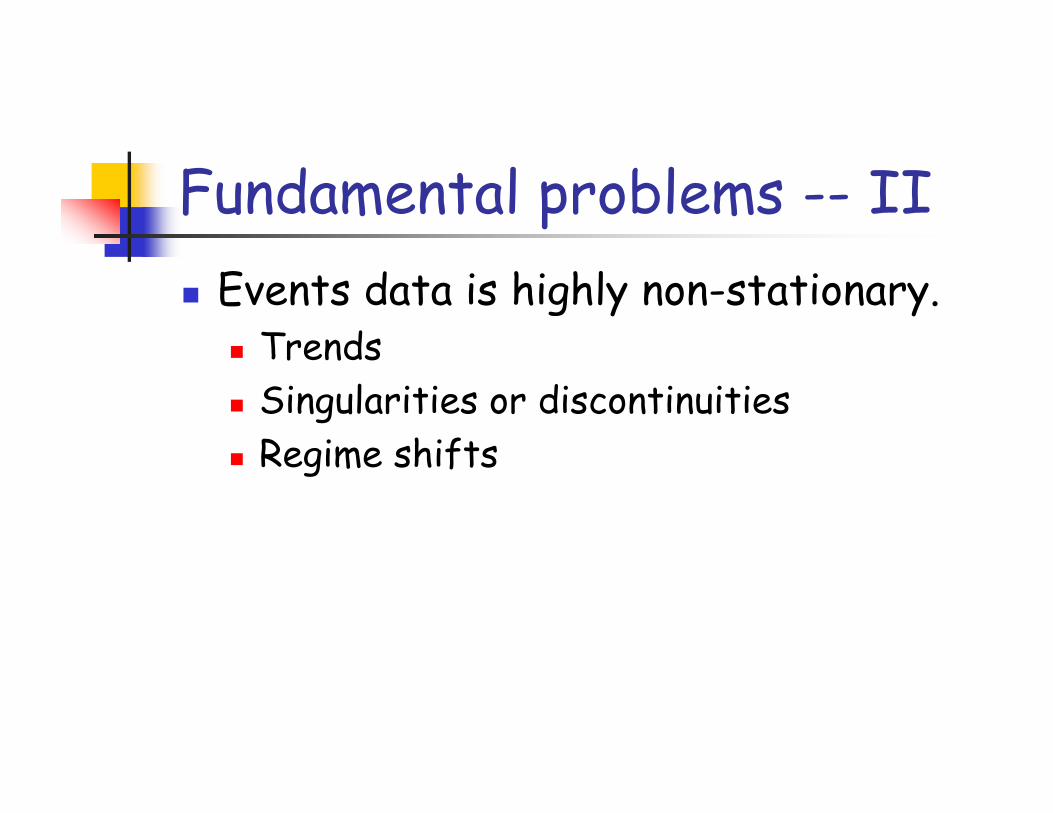
Fundamental problems -- IIEvents data is highly non-stationary.
TrendsTrendsSingularities or discontinuities Regime shiftsRegime shifts

Learning methodsHave to take these fundamental limitations in the data into account.limitations in the data into account.
Need to detect singularities.Need to extract quasi-stationary Need to extract quasi stationary segments in data for learning models.Need to handle noise (not Gaussian!).Need to handle noise (not Gaussian!).Need new validation protocols (old train + test splits of data will not work).p f )

Pattern-based methodsNeed to consider ways of extracting interactions patterns directly from data.
What are the patterns on?Generally over actors/targets/events
Thi t ti U i t l f i l This presentation: Using tools from social network analysis to understand temporal variations in key actors/targets in events variations in key actors/targets in events data.

Key representational ideaModel interactions between countries in a directed graph.in a directed graph.
Date Actor Target Weis Code Wies event Goldstein scale790415 ARB ISR 223 (MIL ENGAGEMENT) -10790415 EGY AFD 194 (HALT NEGOTIATION) -3.8790415 PALPL ISR 223 (MIL ENGAGEMENT) -10790415 UNK ISR 223 (MIL ENGAGEMENT) -10790415 ISR EGY 31 (MEET) 1
ARB ISRARB ISR
EGY UNK
AFD PALPL

Hubs and authoritiesGiven a weighted directed graph G = (V,E), with edges E over a node set V, (V,E), with edges E over a node set V, and weights A:E Real+,
A hub node is one that has edges A hub node is one that has edges directed toward “important” authority nodes.An authority node is one with edges from “important” hub nodes.

Hubs and authorities for events data
A hub node is an important initiator of events.An authority node is an important target of events.gHypothesis: Identifying hubs and authorities over a particular temporal p pchunk of events data tells us who the key actors and targets are!

The HITS algorithmComputes hub score (h) and authority score (a) for every node in a weighted score (a) for every node in a weighted digraph.Exploits mutually reinforcing Exploits mutually reinforcing relationship between hubs and authorities; and performs an iterative authorities; and performs an iterative computation to find functions h and a.

The weighted HITS algorithmInitialize and to 1 for all nodes in V.
)(0 ph )(0 pa
nodes in V.Iterate until successive h and a estimates are ‘close-enough’estimates are close-enough
)(*),()(1 qaqpwph tt+ ∑=
)(*),()(
)(),()(
11 phqpwqa
qqpp
t
Eqp
t
Eqp
+
∈→
+
∈→
∑
∑=
Eqp ∈→
Detail: h and a are length normalized after each iteration
Convergence of weighted HITSh and a converge to the eigenvalues of (wTw) and (wwT) respectively (Duan of (w w) and (ww ) respectively (Duan et. al, SODA 2004)

Handling non-stationarityPicking time granularity of analysis is key to obtaining meaningful results.
Di id d fi l ( d b d ) h b Divide data too finely (e.g., day by day)-- hubs and authorities are not statistically significant.Divide data too coarsely (e.g., aggregate two y ( g , gg gmonths of data) --- hubs and authorities analysis misses key turning points.Ideally should use another analysis to Ideally, should use another analysis to determine singularities and then decide on data aggregation scheme.In this presentation: we consider events data in In this presentation: we consider events data in chunks spanning two week intervals.

The hypothesis, againHubs and authorities will reveal key actors and targets over a given time period.We will use this information to filter irrelevant events (defined as events
h h between countries that are not hubs or authorities)W ill i l AR d l h b d We will use simple AR models on hub and authority scores to forecast hub/authority scores scores.

Analysis protocolTake Levant data from April 1979 to October 2003 and chunk into October 003 and chunk into biweeks.For each biweek compute hubs and For each biweek, compute hubs and authority scores using weighted HITSHITS.

Validation using MID dataNumber of biweeks with MIDS in Levant data: 41.For each biweek with an MID, check to see if countries participating in MID occur
( ) h d among (top 10) negative hubs and authorities for that biweek.R lt F ll b t 3 bi k h b d Result: For all but 3 biweeks, hubs and authorities analysis predicts MID participants correctlyparticipants correctly.

Validation continuedIf negative hubs and authorities are included from previous biweek, our included from previous biweek, our accuracy is 41/41!