Embed Size (px)
Citation preview
1
Using Genetic Algorithms to Design Experiments:
A Review
C. Devon Lin Department of Mathematics and Statistics, Queen’s University
Joint work with Christine M. Anderson-Cook, Michael S. Hamada, Lisa M. Moore, Randy R. Sitter
Design and Analysis of Experiments (DAE) Oct 18, 2012

2
Outline
• Background on genetic algorithms (GAs)
• Challenges of a good implementation
• Two examples
• Discussion

3
What we’re not talking about
• Theoretical foundation (Schema Theorem)
• Theoretical properties of GAs
• General issues of GAs

4
• Genetic algorithms (J. Holland, 1975) are search and optimization techniques based on Darwin’s Principle of Natural Selection.
“Select The Best, Discard The Rest”
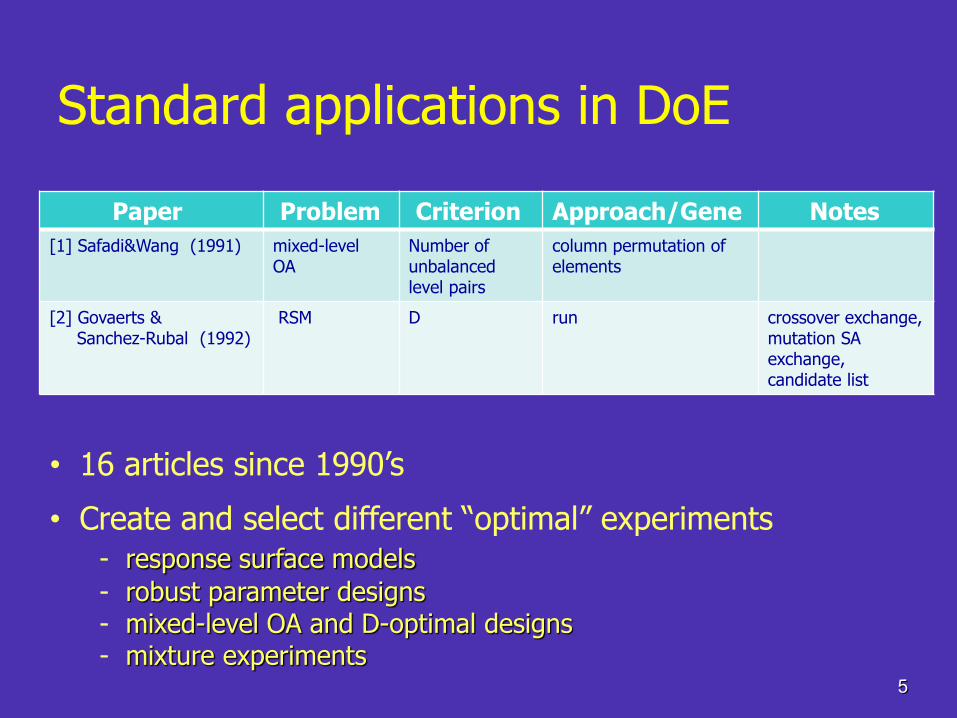
Standard applications in DoE
Paper Problem Criterion Approach/Gene Notes
[1] Safadi&Wang (1991) mixed-level OA
Number of unbalanced level pairs
column permutation of elements
[2] Govaerts & Sanchez-Rubal (1992)
RSM D run crossover exchange, mutation SA exchange, candidate list
• 16 articles since 1990’s
• Create and select different “optimal” experiments - response surface models
- robust parameter designs - mixed-level OA and D-optimal designs - mixture experiments

Specialized applications
Paper Problem Notes
[17] Cela et al. (2000) Supersaturated experiments
E(S2), n0&m0 criterion, small even run size designs, select columns from balanced 2-level columns
[18] Bashir & Simpson (2002)
Supersaturated experiments
E(S2) criterion, select subsets of columns from half-fraction of Hadamard matrix
6
• 15 articles since 1990’s
• supersaturate experiments degradation tests computer experiments assembled products follow-up design fMRI experiments multi-stage experiments microarrays
7
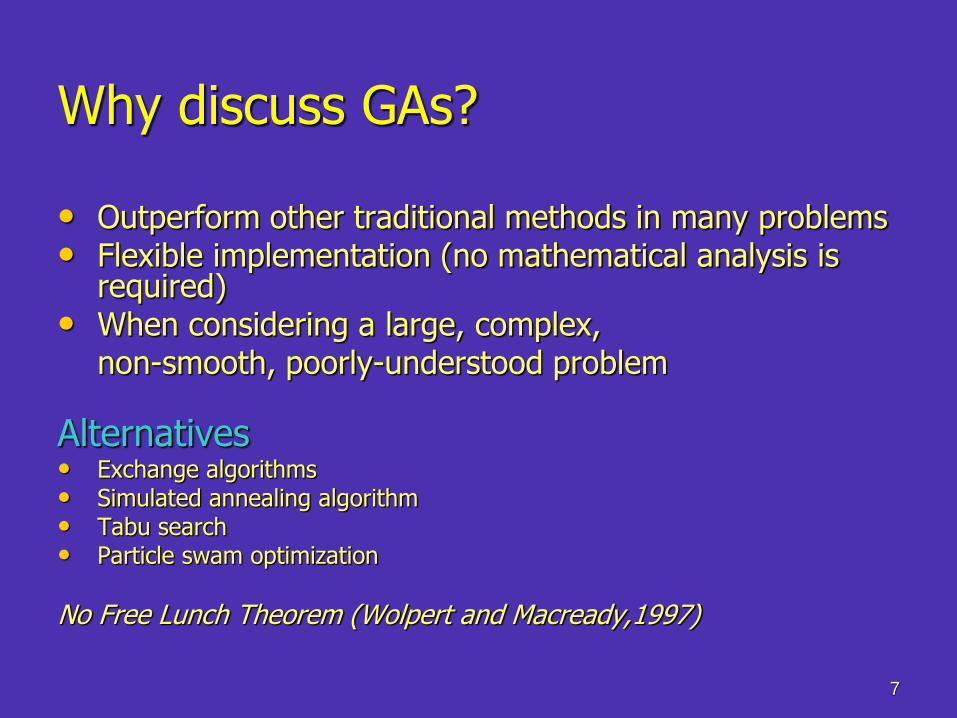
Why discuss GAs?
• Outperform other traditional methods in many problems • Flexible implementation (no mathematical analysis is
required) • When considering a large, complex, non-smooth, poorly-understood problem
Alternatives • Exchange algorithms • Simulated annealing algorithm • Tabu search • Particle swam optimization
No Free Lunch Theorem (Wolpert and Macready,1997)

8
GA algorithm
Initialize population
Evaluate fitness
Selection
Output results
Meet stopping criterion
Yes
No Crossover
Mutation
New Population

9
Key elements in implementing a GA
• Fitness function
• Representation
• Selection
• Crossover
• Mutation

10
Fitness criterion
• Problem-specific
• D,A,G-optimality, orthogonality, Bayesian EIG

11
Representation
• The chromosome represents an individual design and the genes represent runs (columns, blocks) or factor levels
• Run-based, column-based
• Should complement the criterion for
which the design is being optimized
12
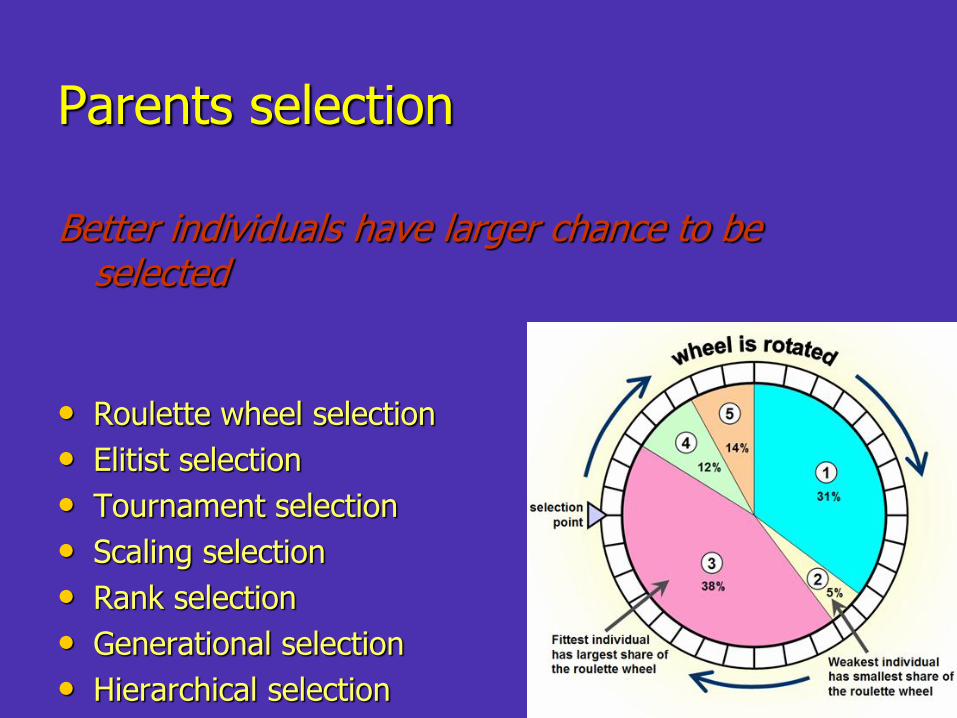
Parents selection
Better individuals have larger chance to be selected
• Roulette wheel selection
• Elitist selection
• Tournament selection
• Scaling selection
• Rank selection
• Generational selection
• Hierarchical selection

13
Crossover (for genetic diversity)
• N-point crossover
14
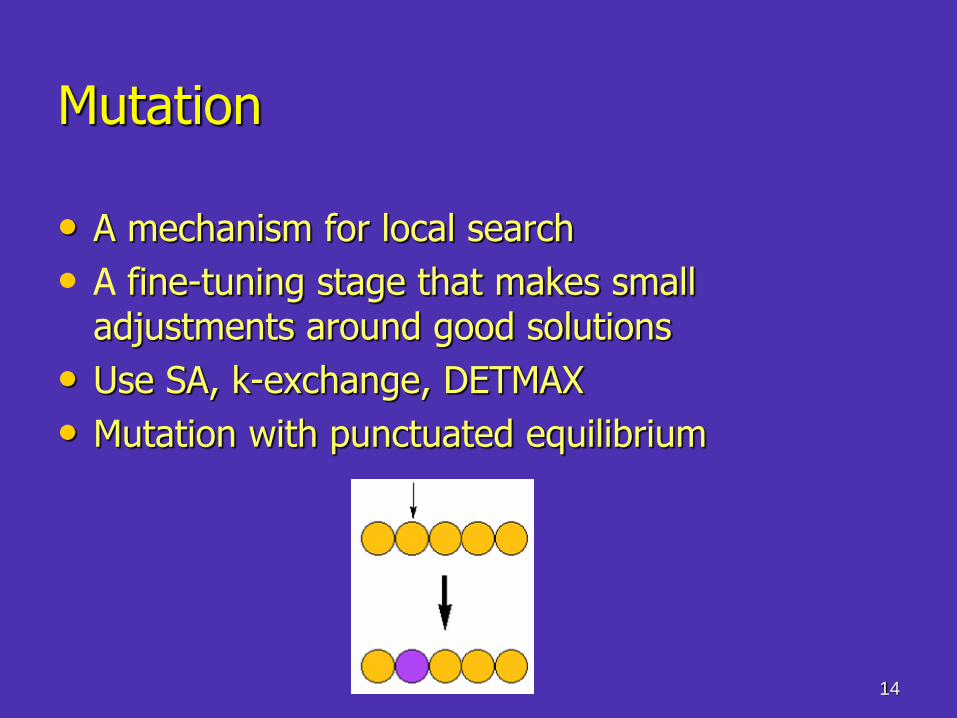
Mutation
• A mechanism for local search
• A fine-tuning stage that makes small adjustments around good solutions
• Use SA, k-exchange, DETMAX
• Mutation with punctuated equilibrium
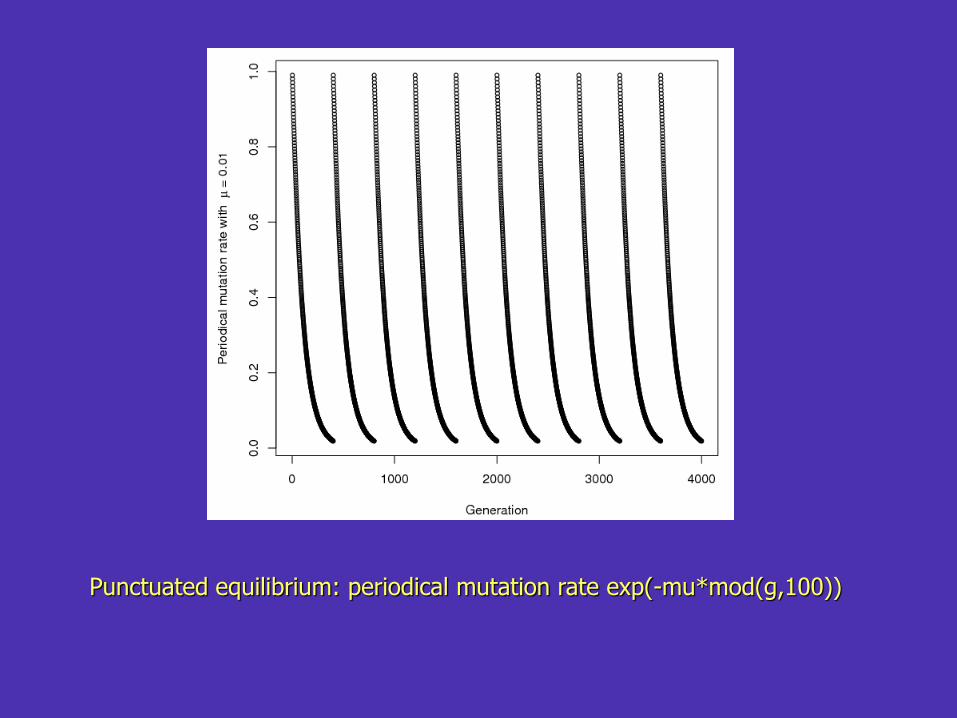
Punctuated equilibrium: periodical mutation rate exp(-mu*mod(g,100))

16
Performance
Paper
Comparison Competitors
Results
Time Efficiency
[1] NA OA(12,3^1 2^4) NA
[2] NA 9-point exact D-optimal design NA
[3] NA D(n,7^1 6^2 5^1 3^2), 25 <=n<=30 Yes
[4] MFA Similar design efficiency as MFA, but faster, no new result
Yes
• many papers show that GA’s can nearly achieve or provide modest
improvement over the known optimal design or best existing one
• most of papers address performance but only a few address
time efficiency
• not enough details to reproduce the results

17
An example from Hamada et al. (2001)
• Consider a three-factor quadratic response model
• Maximizes Bayesian expected information gain (EIG)
• Prior specification
dydXyfXyXU )(),|()],|(log[)(
100,6),,(~|),,(~ 222 RNIG
),(~,| 223
1
3
1
0 IXXXXNXy i
i
i
ji
jiiji
i
i
18
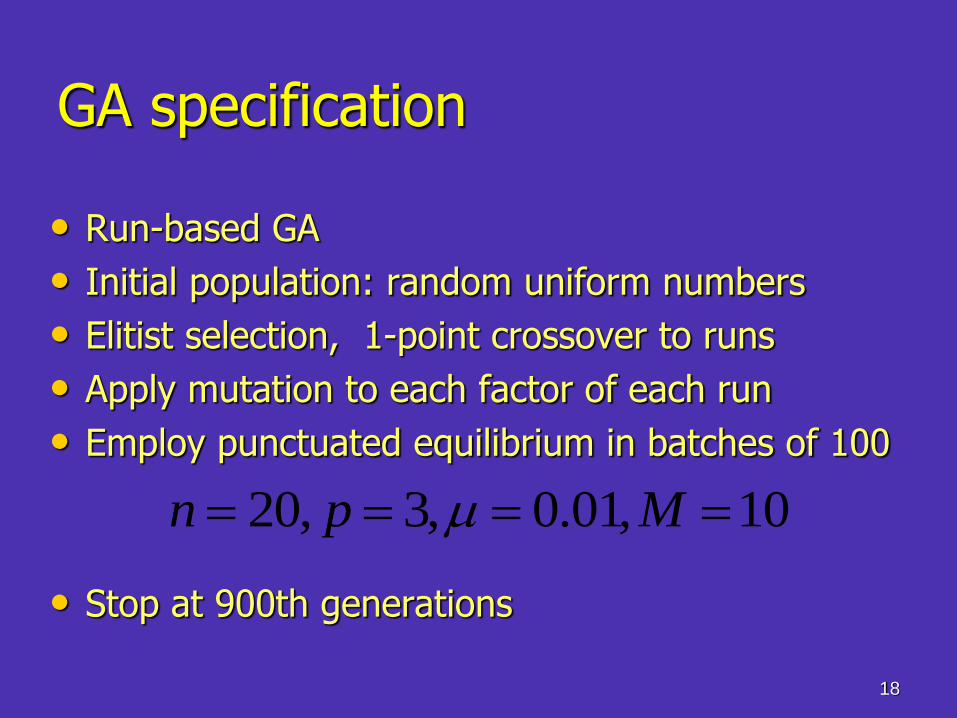
GA specification
• Run-based GA
• Initial population: random uniform numbers
• Elitist selection, 1-point crossover to runs
• Apply mutation to each factor of each run
• Employ punctuated equilibrium in batches of 100
• Stop at 900th generations
10,01.0,3,20 Mpn

19
Figure 1. EIG trace for Hamada et al. (2001) Example 3 over 900 generations
20
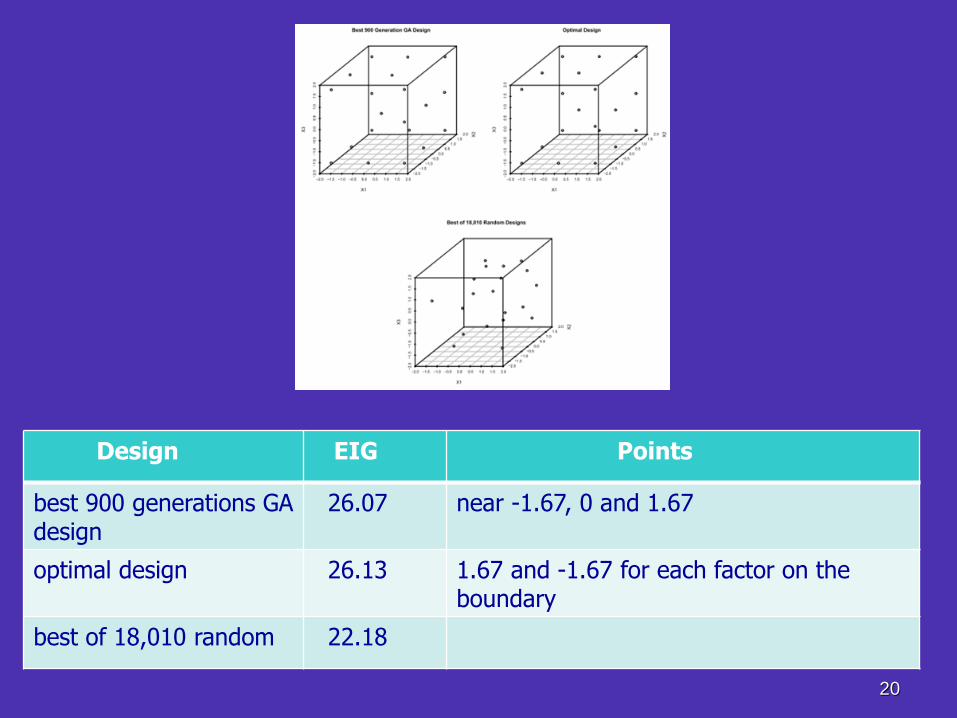
Design EIG Points
best 900 generations GA design
26.07 near -1.67, 0 and 1.67
optimal design 26.13 1.67 and -1.67 for each factor on the boundary
best of 18,010 random 22.18
21
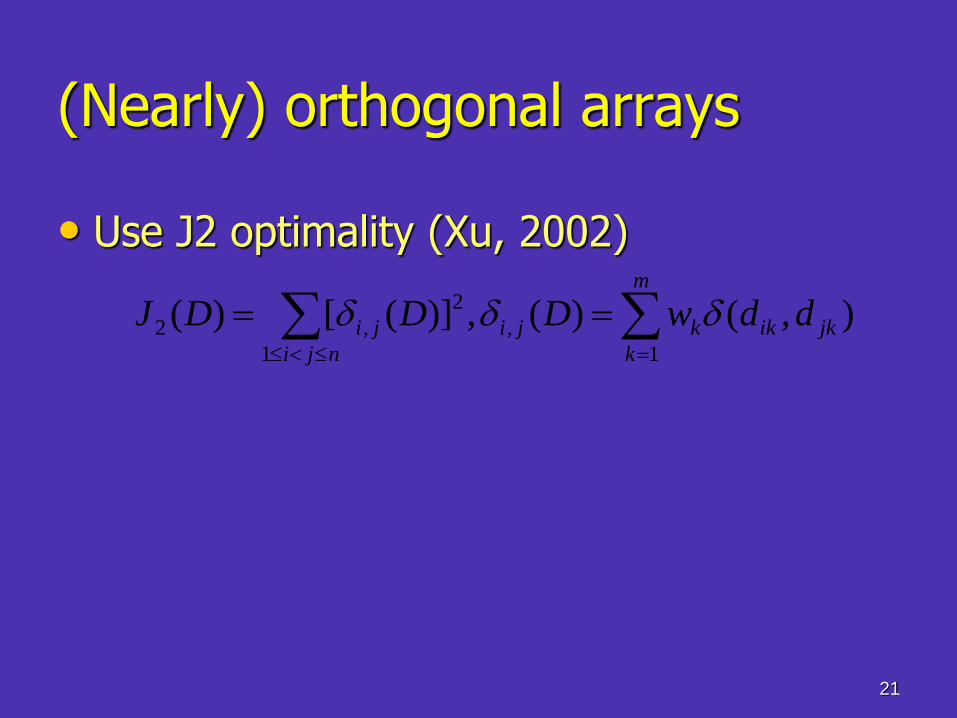
(Nearly) orthogonal arrays
• Use J2 optimality (Xu, 2002)
m
k
jkikkji
nji
ji ddwDDDJ1
,
1
2
,2 ),()(,)]([)(
Comparisons
• Row-based GA
• Row-order-based GA
• Column-based GA
• Safadi-Wang (1991)
• Xu (2002)
• Random balanced designs
• Row-order-based GA (base-s representation)
– combine the parent designs and order the combined vector
– take the rows of odd indexes and even indexes
• Apply mutation to each factor of each run
• Stop at 500th generations
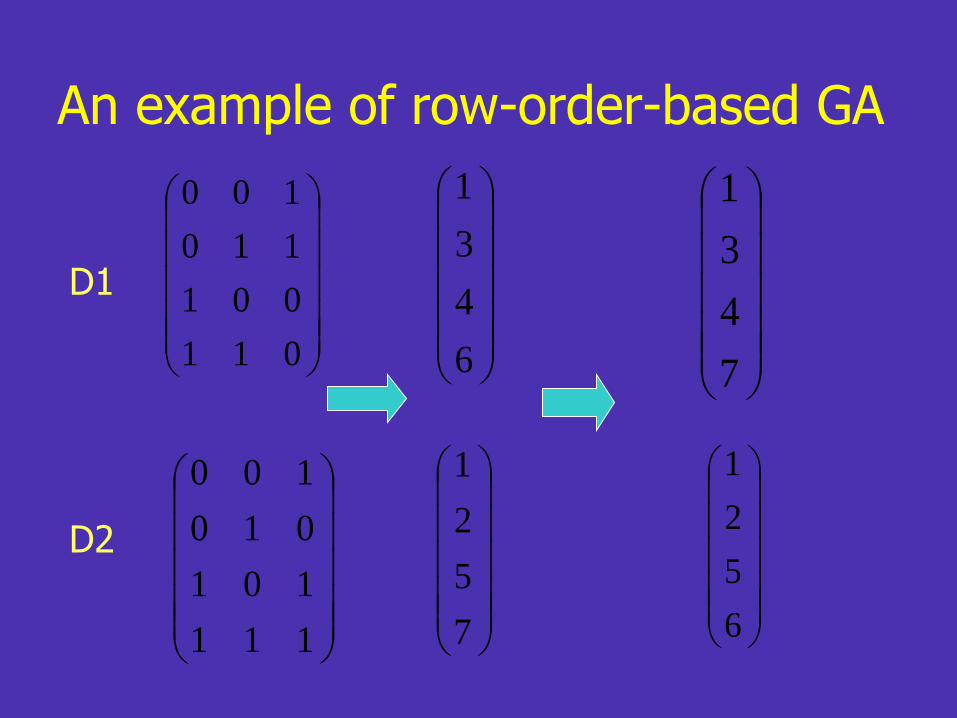
An example of row-order-based GA
D1
011
001
110
100
D2
111
101
010
100
6
4
3
1
7
5
2
1
7
4
3
1
6
5
2
1
25
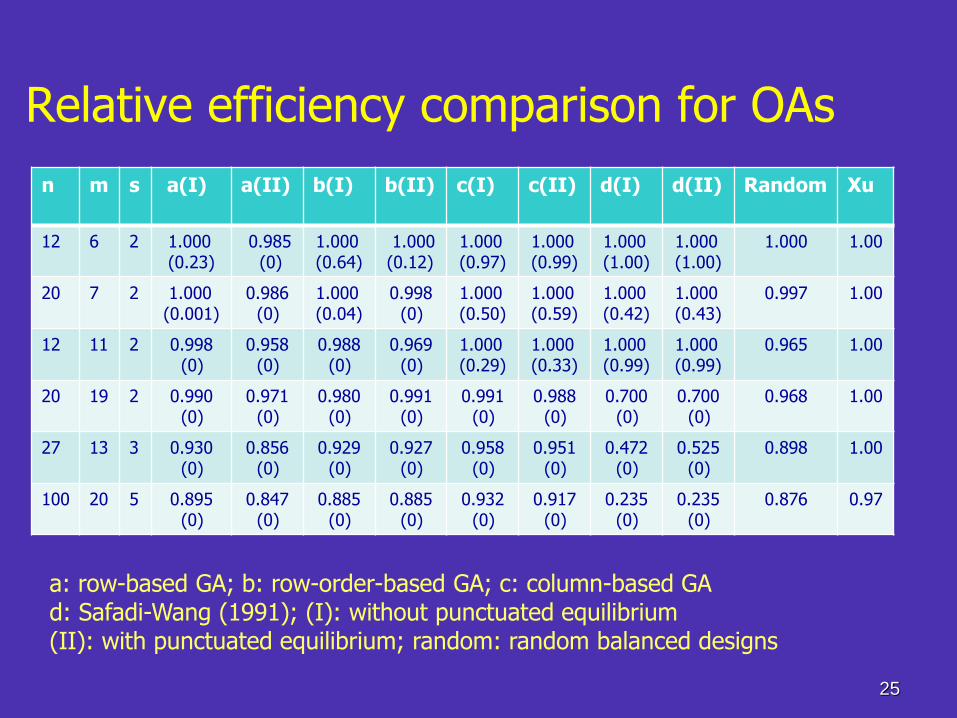
n m s a(I) a(II) b(I) b(II) c(I) c(II) d(I) d(II) Random Xu
12 6 2 1.000 (0.23)
0.985 (0)
1.000 (0.64)
1.000 (0.12)
1.000 (0.97)
1.000 (0.99)
1.000 (1.00)
1.000 (1.00)
1.000 1.00
20 7 2 1.000 (0.001)
0.986 (0)
1.000 (0.04)
0.998 (0)
1.000 (0.50)
1.000 (0.59)
1.000 (0.42)
1.000 (0.43)
0.997 1.00
12 11 2 0.998 (0)
0.958 (0)
0.988 (0)
0.969 (0)
1.000 (0.29)
1.000 (0.33)
1.000 (0.99)
1.000 (0.99)
0.965 1.00
20 19 2 0.990 (0)
0.971 (0)
0.980 (0)
0.991 (0)
0.991 (0)
0.988 (0)
0.700 (0)
0.700 (0)
0.968 1.00
27 13 3 0.930 (0)
0.856 (0)
0.929 (0)
0.927 (0)
0.958 (0)
0.951 (0)
0.472 (0)
0.525 (0)
0.898 1.00
100 20 5 0.895 (0)
0.847 (0)
0.885 (0)
0.885 (0)
0.932 (0)
0.917 (0)
0.235 (0)
0.235 (0)
0.876 0.97
Relative efficiency comparison for OAs
a: row-based GA; b: row-order-based GA; c: column-based GA d: Safadi-Wang (1991); (I): without punctuated equilibrium (II): with punctuated equilibrium; random: random balanced designs

26
Comparison for nearly OAs
n m s a(I) a(II) b(I) b(II) c(I) c(II) d(I) d(II) Random Xu
27 15 3 0.925 0.876 0.921 0.935 0.943 0.936 0.436 0.436 0.889 0.998
50 13 5 0.802 0.718 0.809 0.801 0.862 0.841 0.232 0.232 0.766 0.908
64 20 4 0.901 0.854 0.898 0.900 0.942 0.927 0.303 0.303 0.888 0.972
a: row-based GA; b: row-order-based GA; c: column-based GA d: Safadi-Wang (1991); (I): without punctuated equilibrium (II): with punctuated equilibrium; random: random balanced designs

Observations
• For the criterion, row-based and row-order-based GAs are not natural and column-based GA is more natural.
• GA is not much better than random search and performs disappointingly – so GA is not a panacea
• Xu’s is the best and Safadi-Wang does not perform well
• Crossover is more random and mutation is more systematic.
• Punctuated equilibrium does not necessarily improve the performance of GA when the number of generations is small.

28
Fig. 3: J2 of 5-level designs of 100 runs with 20 factors obtained by row-based GA, row-ordered-based GA, column-based GA without punctuated equilibrium (I) and with punctuated equilibrium (II) with the mu = 0.04

29
Elements for publications
• Details about the implementation
• Stopping rule
• Comparison of existing designs or those generated by variants of GAs and other competitors
30
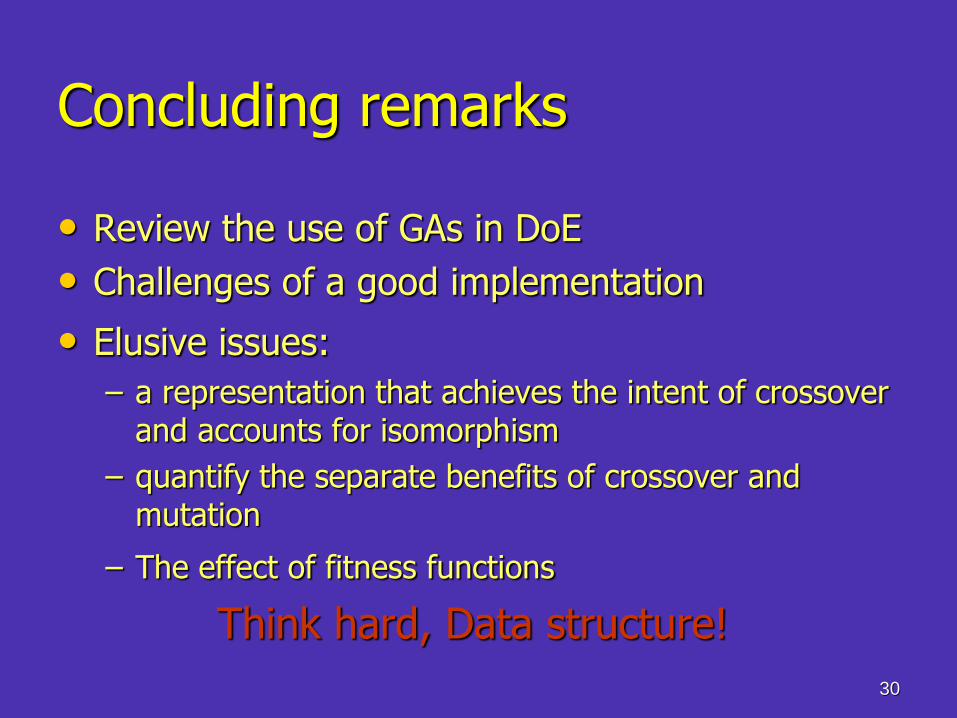
Concluding remarks
• Review the use of GAs in DoE
• Challenges of a good implementation
• Elusive issues: – a representation that achieves the intent of crossover
and accounts for isomorphism
– quantify the separate benefits of crossover and mutation
– The effect of fitness functions
Think hard, Data structure!

Thank You!

32
Fig. 4: J2 of 5-level designs of 100 runs with 20 factors obtained by row-based GA, row-ordered-based GA, column-based GA without punctuated equilibrium (I) and with punctuated equilibrium (II) with the mu = 0.01