Embed Size (px)
Citation preview

Journal of Land Use ScienceiFirst, 2011, 1–27
Using fuzzy cognitive maps to describe current system dynamics anddevelop land cover scenarios: a case study in the Brazilian Amazon
Luciana S. Solera*, Kasper Kokb, Gilberto Camaraa and Antoine Veldkampc
aEarth System Centre, National Institute for Space Research (INPE), São José dos Campos, SãoPaulo, Brazil; bDepartment of Environmental Sciences, Wageningen University, Wageningen, The
Netherlands; cFaculty of Geo-Information Science and Earth Observation (ITC), University ofTwente, Enschede, The Netherlands
(Received 14 February 2010; final version received 18 November 2010)
In this study we developed a methodology to identify and quantify the relationshipsamong determinants of land cover change using a regional case study in the BrazilianAmazon. The method is based on the application of fuzzy cognitive maps (FCMs), asemi-quantitative tool that provides a structured assessment of key feedbacks in sce-nario analysis. Novel to the application of FCMs is the use of spatial data-sets as themain input to build a cognitive map. Identification of interactions between land coverdeterminants and strengths is based on an empirical analysis of spatially explicit dataand literature review. Expert knowledge is adopted to identify the strengths and weak-nesses of the method. Potential pitfalls, such as spatial autocorrelation and scale issues,identified are intrinsic to the empirical data analysis. The outputs of the resulting FCMsare compared to the outputs of spatially explicit models under similar scenarios ofchange. The proposed method is said to be robust and reproducible when comparedwith participatory approaches, and it can endorse the consistency between demand andallocation in scenario analysis to be used in spatially explicit models.
Keywords: fuzzy cognitive maps; land cover change; interactions; scenarios; defor-estation; Brazilian Amazon
1. Introduction
The comprehension of coupled human–environment systems has been recognized as animportant issue by the land science community (Turner II, Moran, and Rindfuss 2004;Liu et al. 2007). This is particularly relevant in the context of the Brazilian Amazon, anenormous and heterogeneous region regarding social, economic and environmental factors(Perz and Walker 2002; Becker 2004; Alves 2008; Fearnside 2008b). The multi-causality ofland use and land cover dynamics required new approaches combining generic biophysicaland socio-economic data as well as human–environment conditions specific to case studies(Lambin et al. 2001). As a result, a number of land change studies have moved from rela-tively simplistic representations with a few driving forces to a more complex multi-variableunderstanding (Câmara et al. 2005; Geist et al. 2006).
Tackling the complexity of land cover change requires investigation of interactionsamong factors at different spatial and temporal scales (Veldkamp and Fresco 1996; Lambin
*Corresponding author. Email: [email protected]
ISSN 1747-423X print/ISSN 1747-4248 online© 2011 Taylor & FrancisDOI: 10.1080/1747423X.2010.542495http://www.informaworld.com

2 L.S. Soler et al.
and Geist 2003). These interactions include feedback mechanisms that are key steps tocomprehend non-linear landscape processes and their links to human decision-making(Claessens, Schoorl, Verburg, Geraedts, and Veldkamp 2009). However, inherent limi-tations of land use/land cover change frameworks to incorporate feedback mechanismsbetween human actions and environmental changes are still a challenge to modellers thatuse spatially explicit approaches (Veldkamp and Verburg 2004; Verburg 2006; Verburg,Kok, Pontius, and Veldkamp 2006; Parker, Hessl, and Davis 2008).
The implementation of feedback mechanisms has a number of constraints in both spa-tially explicit and agent-based models. Data availability and computational complexity aresome of the limitations when linking spatial variation of land use to the social structure ofdecision-making (Verburg 2006). Although multi-agent models can combine cellular- andagent-based concepts in an integrated approach, many challenges such as modelling thebehaviour of various agents and institutions remain, taking into account the complexity oftime and spatial scales in a given land use system (Parker, Manson, Janssen, Hoffmann,and Deadman 2003).
Recent studies have indicated the potential of fuzzy cognitive mapping as a proxy toolto investigate the role of feedback mechanisms in coupled human–environment systems.Cognitive maps have been useful in analysing decision-making and complex social sys-tems (Roberts 1973; Axelrod 1976; Montazemi and Conrath 1986; Carley and Palmquist1992; Cossette and Audet 1992). Kosko (1986) was the first to associate cognitive mapsto fuzzy logic by incorporating qualitative knowledge as fuzzy causal functions usinga matrix representation. Thus, a fuzzy cognitive map (FCM) is a cognitive map whererelationships among the elements derive from a given mental map, with their relativeimportance representing the magnitude of the causality of such elements. In this con-text, a FCM can play an important role in building semi-quantitative scenarios takinginto account different stakeholders’ perceptions (Kok 2009; Vliet, Kok, and Veldkamp2010).
Application of FCMs to land use science requires the interpretation of subjective infor-mation, for example, stakeholders’ perceptions or expert knowledge, into semi-quantitativedescription of variables and their interrelations (Ozesmi, U. and Ozesmi, S. 2003; Kok2009; Vliet et al. 2010). Although the semi-quantitative nature of FCMs is considered aweak point when linking them to quantitative models, the dynamic outputs of FCMs in sce-nario development can facilitate land use/land cover models by unveiling hidden feedbackmechanisms as shown by Kok (2009). Most land use/land cover change models use anexternal demand based on an economic approach of a trend extrapolation, usually yield-ing a very static and almost gradual change in demand (Milne, Aspinall, and Veldkamp2009). In reality, demand changes rather erratically due to all kinds of feedbacks in landuse systems. These feedbacks can be represented in an FCM allowing a semi-quantifiedevaluation of their role in specific demand scenarios.
In summary, considering the state of the art of current applications of FCMs in environ-mental sciences, we identify two aspects that have not received much attention in literatureand are essential to explore further:
(1) FCMs are often constructed during stakeholder workshops and therefore repre-sent the (subjective) opinion of a small group of individuals. A more objectiveand therefore reproducible method does not exist.
(2) FCMs are not linked to quantitative models, even though their semi-dynamiccharacter provides possibilities to do so.

Journal of Land Use Science 3
Taking into account these two aspects, this article addresses a new method to developFCMs. The main objective is to present and test a reproducible and robust method todevelop FCMs based on spatially explicit data in combination with the existing litera-ture. The resulting FCM is compared to an FCM constructed directly by a number ofexperts from leading institutes on spatial research in Brazil. Both products are comparedto evaluate strong and weak points of the proposed new method of building FCMs. Toaddress the second aspect, we illustrate how FCMs can be converted to land cover changescenarios.
2. FCMs in land use science
A FCM is a collection of concepts Ci that in land use science can represent the land usetypes and their determinants of change. These concepts are linked to each other by causalrelationships represented by arrows (Ci → Ci+1), as illustrated in Figure 1. Each con-cept receives an initial value a ∈ [−1, 1] that is transferred in the first step of the FCMcalculation to another concept through the relationship between them. In addition, eachrelationship is quantified by a weight, varying between 0 and 1, which is the strength of therelationship between the two given concepts (Kosko 1986).
The set of initial values of all concepts form a matrix 1 × n called state vector, wheren is the total number of concepts adopted. In addition, the causal relationships can also berepresented by an n × n matrix called adjacency matrix, where the position and magnitudeof each Ci,j element indicate, respectively, the direction of the causality and the weights
between the concepts (Ciweight−→ Cj). The iterations in a FCM consist of multiplying the state
vector by the adjacency matrix obtaining a new state vector. This step is then repeated untilthere is a quasi stabilization of the changes in the state vector. The new state vector canassume values outside the interval between –1 and 1. In the example of Figure 1, the initialstate vector is A = [1 0.5 –0.5] and after the first iteration it becomes A = [0.2 0.5 1].Once the values of elements in the state vector and in the adjacency matrix are defined,the iterations in a FCM can be implemented in different statistical packages, such asR-project and Microsoft Office Excel
®software, which were used in this study (Microsoft
Corporation 2003; R-project 2010). For further methodological details of FCMs, refer toKok (2009).
When applying FCM to land use science, the stakeholders’ perceptions and expertknowledge can be considered a strong point of the tool because of its flexibility in includingthe consensual opinion of any group during a short workshop. However, to link FCMsto spatially explicit models of land use/land cover change, a larger degree of objectivityis desired, which is attempted by the proposed method that links spatial data to FCMsdescribed in the next section.
Concept C1(land use type)
Concept C2(land determinant 1)
Concept C3(land determinant 2)
a = 0.5
a = 1
a = −0.5
0.6
0.2
1.01.0
Figure 1. Graphical representation of concepts (with state values a), their causal relationships andweights indicated by arrows in a fuzzy cognitive map.
4 L.S. Soler et al.
3. Linking FCMs to spatially explicit data
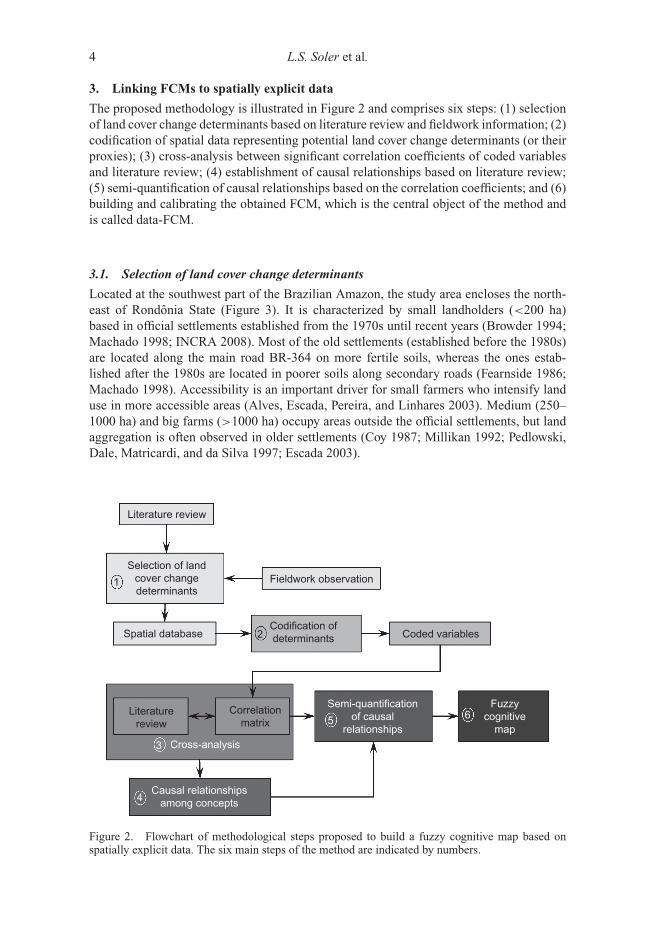
The proposed methodology is illustrated in Figure 2 and comprises six steps: (1) selectionof land cover change determinants based on literature review and fieldwork information; (2)codification of spatial data representing potential land cover change determinants (or theirproxies); (3) cross-analysis between significant correlation coefficients of coded variablesand literature review; (4) establishment of causal relationships based on literature review;(5) semi-quantification of causal relationships based on the correlation coefficients; and (6)building and calibrating the obtained FCM, which is the central object of the method andis called data-FCM.
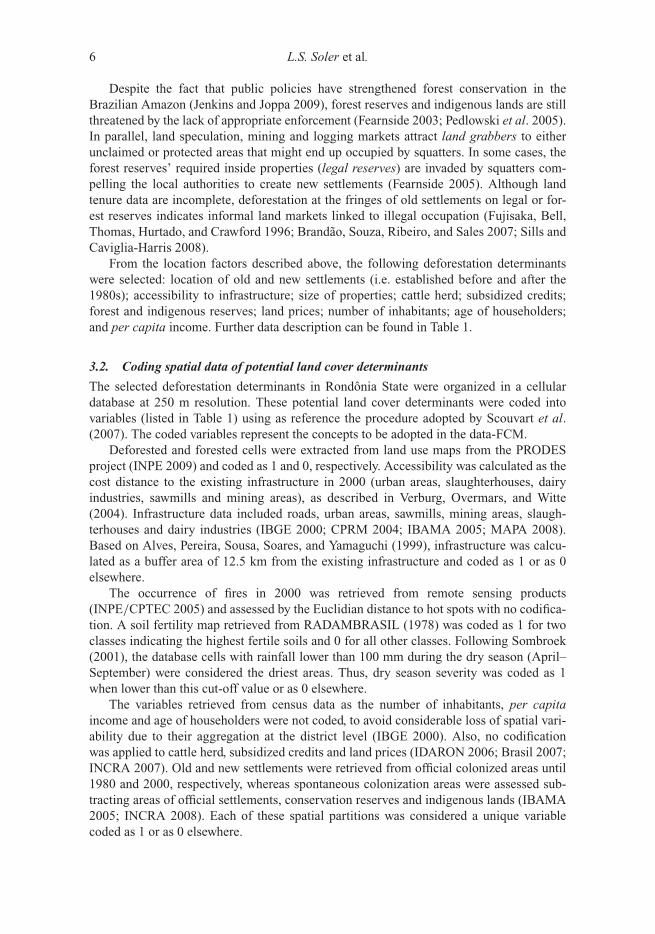
3.1. Selection of land cover change determinants
Located at the southwest part of the Brazilian Amazon, the study area encloses the north-east of Rondônia State (Figure 3). It is characterized by small landholders (<200 ha)based in official settlements established from the 1970s until recent years (Browder 1994;Machado 1998; INCRA 2008). Most of the old settlements (established before the 1980s)are located along the main road BR-364 on more fertile soils, whereas the ones estab-lished after the 1980s are located in poorer soils along secondary roads (Fearnside 1986;Machado 1998). Accessibility is an important driver for small farmers who intensify landuse in more accessible areas (Alves, Escada, Pereira, and Linhares 2003). Medium (250–1000 ha) and big farms (>1000 ha) occupy areas outside the official settlements, but landaggregation is often observed in older settlements (Coy 1987; Millikan 1992; Pedlowski,Dale, Matricardi, and da Silva 1997; Escada 2003).
Literature review
Literaturereview
Correlationmatrix
Causal relationshipsamong concepts
Semi-quantificationof causal
relationships
Selection of landcover changedeterminants
Fieldwork observation
Codification ofdeterminants Coded variables
Fuzzycognitive
mapCross-analysis
Spatial database
1
2
4
5 6
3
Figure 2. Flowchart of methodological steps proposed to build a fuzzy cognitive map based onspatially explicit data. The six main steps of the method are indicated by numbers.

Journal of Land Use Science 5
64º0'0''W 63º0'0''W 62º0'0''W
64º0'0''W 63º0'0''W 62º0'0''W
9º0'
0''S
10º0
'0''S
11º0
'0''S
Amazonas
MatoGrosso
N
0 15 30 60km
Legend
Study area extent
Towns/villages
Main cities
Main rivers
Secondary roadsMain roadsHighwaysDeforested areauntil 2006
Study area location
Figure 3. Study area extent indicating roads, rivers, urban areas and deforested areas.
Soil fertility is an important determinant when hardly any forest remnants are left(Roberts et al. 2002; Soler and Verburg 2010). Rainfall determines deforestation atthe regional scale as more pronounced dry seasons increase agro-pasture productivity(Schneider, Arima, Veríssimo, Barreto, and Souza 2000; Sombroek 2001). Thus, areaswith more consecutive dryer months are more prone to deforestation, which is directlylinked to fire occurrence (Aragão et al. 2007, 2008). Furthermore, consecutive years ofintense droughts can cause more fire events in the long term (Nepstad et al. 2001; Malhiet al. 2009).
Ranching is the predominant land use among medium and big farmers, but it can alsobe an important source of income for small landholders (Pedlowski et al. 1997; Walker,Moran, and Anselin 2000). The regional and global beef demands are pointed as the maincauses driving the increase in cattle herd in the Brazilian Amazon (Faminow 1997; Arima,Barreto, and Brito 2005). Even though government subsidies have decreased in the last twodecades, subsidized loans for pasture activities can still influence household level decisions(Moran 1993; Brasil 2007). In old settlements the ageing of householders affects labourforce availability, which can lead to an increase of pasture area and even force small farm-ers to sell their land in areas progressively dominated by large farms (Browder et al. 2008).This local dynamics can explain the stronger causality between deforestation and the num-ber of inhabitants as well as between deforestation and the per capita income rather thanpopulation density in old settlements in the northeast of Rondônia State (Soler, Escada,and Verburg 2009).
6 L.S. Soler et al.
Despite the fact that public policies have strengthened forest conservation in theBrazilian Amazon (Jenkins and Joppa 2009), forest reserves and indigenous lands are stillthreatened by the lack of appropriate enforcement (Fearnside 2003; Pedlowski et al. 2005).In parallel, land speculation, mining and logging markets attract land grabbers to eitherunclaimed or protected areas that might end up occupied by squatters. In some cases, theforest reserves’ required inside properties (legal reserves) are invaded by squatters com-pelling the local authorities to create new settlements (Fearnside 2005). Although landtenure data are incomplete, deforestation at the fringes of old settlements on legal or for-est reserves indicates informal land markets linked to illegal occupation (Fujisaka, Bell,Thomas, Hurtado, and Crawford 1996; Brandão, Souza, Ribeiro, and Sales 2007; Sills andCaviglia-Harris 2008).
From the location factors described above, the following deforestation determinantswere selected: location of old and new settlements (i.e. established before and after the1980s); accessibility to infrastructure; size of properties; cattle herd; subsidized credits;forest and indigenous reserves; land prices; number of inhabitants; age of householders;and per capita income. Further data description can be found in Table 1.
3.2. Coding spatial data of potential land cover determinants
The selected deforestation determinants in Rondônia State were organized in a cellulardatabase at 250 m resolution. These potential land cover determinants were coded intovariables (listed in Table 1) using as reference the procedure adopted by Scouvart et al.(2007). The coded variables represent the concepts to be adopted in the data-FCM.
Deforested and forested cells were extracted from land use maps from the PRODESproject (INPE 2009) and coded as 1 and 0, respectively. Accessibility was calculated as thecost distance to the existing infrastructure in 2000 (urban areas, slaughterhouses, dairyindustries, sawmills and mining areas), as described in Verburg, Overmars, and Witte(2004). Infrastructure data included roads, urban areas, sawmills, mining areas, slaugh-terhouses and dairy industries (IBGE 2000; CPRM 2004; IBAMA 2005; MAPA 2008).Based on Alves, Pereira, Sousa, Soares, and Yamaguchi (1999), infrastructure was calcu-lated as a buffer area of 12.5 km from the existing infrastructure and coded as 1 or as 0elsewhere.
The occurrence of fires in 2000 was retrieved from remote sensing products(INPE/CPTEC 2005) and assessed by the Euclidian distance to hot spots with no codifica-tion. A soil fertility map retrieved from RADAMBRASIL (1978) was coded as 1 for twoclasses indicating the highest fertile soils and 0 for all other classes. Following Sombroek(2001), the database cells with rainfall lower than 100 mm during the dry season (April–September) were considered the driest areas. Thus, dry season severity was coded as 1when lower than this cut-off value or as 0 elsewhere.
The variables retrieved from census data as the number of inhabitants, per capitaincome and age of householders were not coded, to avoid considerable loss of spatial vari-ability due to their aggregation at the district level (IBGE 2000). Also, no codificationwas applied to cattle herd, subsidized credits and land prices (IDARON 2006; Brasil 2007;INCRA 2007). Old and new settlements were retrieved from official colonized areas until1980 and 2000, respectively, whereas spontaneous colonization areas were assessed sub-tracting areas of official settlements, conservation reserves and indigenous lands (IBAMA2005; INCRA 2008). Each of these spatial partitions was considered a unique variablecoded as 1 or as 0 elsewhere.
Journal of Land Use Science 7
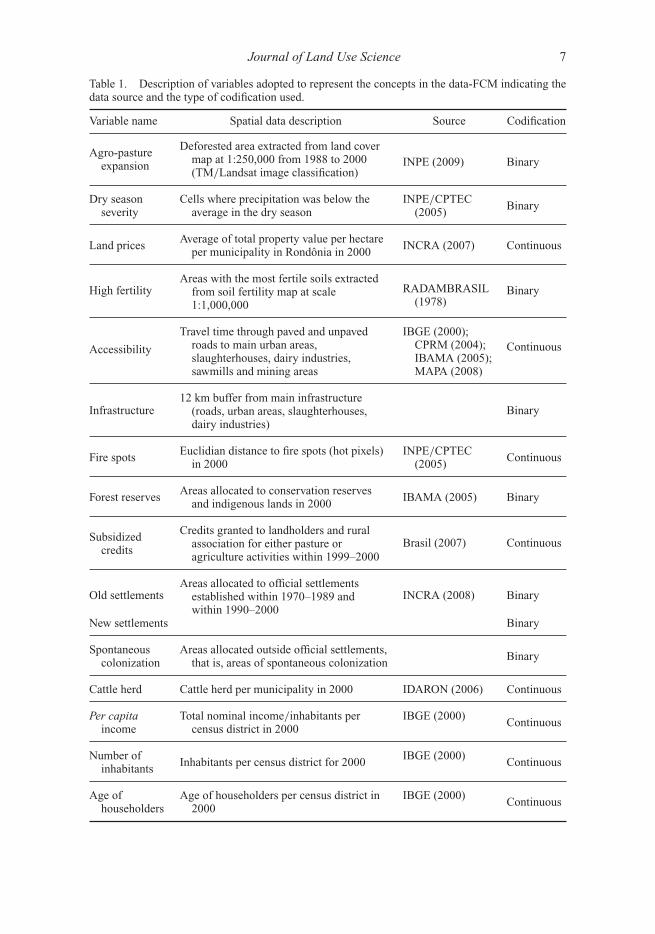
Table 1. Description of variables adopted to represent the concepts in the data-FCM indicating thedata source and the type of codification used.
Variable name Spatial data description Source Codification
Agro-pastureexpansion
Deforested area extracted from land covermap at 1:250,000 from 1988 to 2000(TM/Landsat image classification)
INPE (2009) Binary
Dry seasonseverity
Cells where precipitation was below theaverage in the dry season
INPE/CPTEC(2005)
Binary
Land pricesAverage of total property value per hectare
per municipality in Rondônia in 2000INCRA (2007) Continuous
High fertilityAreas with the most fertile soils extracted
from soil fertility map at scale1:1,000,000
RADAMBRASIL(1978)
Binary
Accessibility
Travel time through paved and unpavedroads to main urban areas,slaughterhouses, dairy industries,sawmills and mining areas
IBGE (2000);CPRM (2004);IBAMA (2005);MAPA (2008)
Continuous
Infrastructure12 km buffer from main infrastructure
(roads, urban areas, slaughterhouses,dairy industries)
Binary
Fire spotsEuclidian distance to fire spots (hot pixels)
in 2000INPE/CPTEC
(2005)Continuous
Forest reservesAreas allocated to conservation reserves
and indigenous lands in 2000IBAMA (2005) Binary
Subsidizedcredits
Credits granted to landholders and ruralassociation for either pasture oragriculture activities within 1999–2000
Brasil (2007) Continuous
Old settlementsAreas allocated to official settlements
established within 1970–1989 andwithin 1990–2000
INCRA (2008) Binary
New settlements Binary
Spontaneouscolonization
Areas allocated outside official settlements,that is, areas of spontaneous colonization
Binary
Cattle herd Cattle herd per municipality in 2000 IDARON (2006) Continuous
Per capitaincome
Total nominal income/inhabitants percensus district in 2000
IBGE (2000)Continuous
Number ofinhabitants
Inhabitants per census district for 2000IBGE (2000)
Continuous
Age ofhouseholders
Age of householders per census district in2000
IBGE (2000)Continuous
8 L.S. Soler et al.
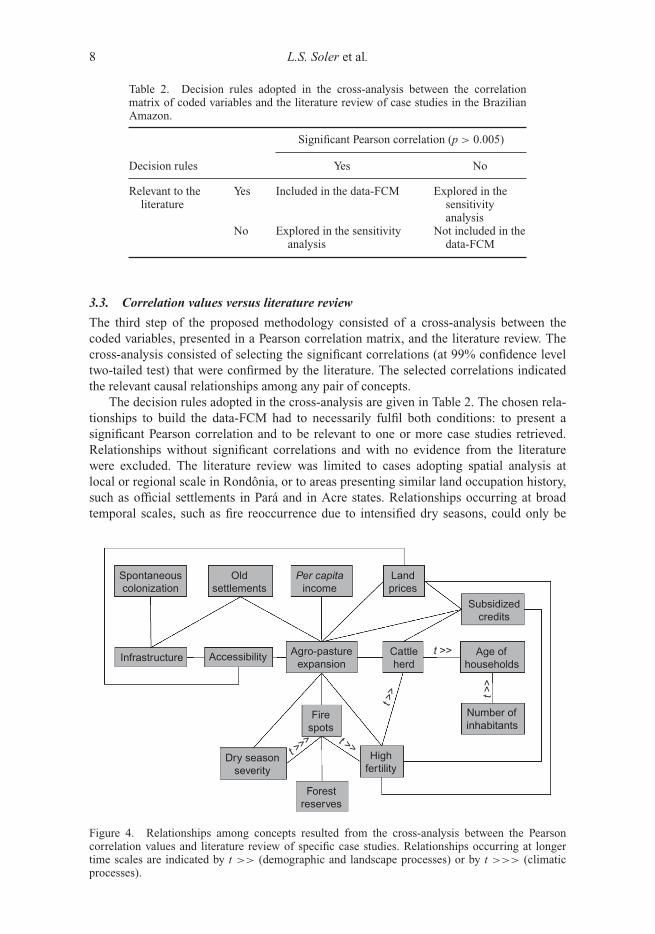
Table 2. Decision rules adopted in the cross-analysis between the correlationmatrix of coded variables and the literature review of case studies in the BrazilianAmazon.
Significant Pearson correlation (p > 0.005)
Decision rules Yes No
Relevant to theliterature
Yes Included in the data-FCM Explored in thesensitivityanalysis
No Explored in the sensitivityanalysis
Not included in thedata-FCM
3.3. Correlation values versus literature review
The third step of the proposed methodology consisted of a cross-analysis between thecoded variables, presented in a Pearson correlation matrix, and the literature review. Thecross-analysis consisted of selecting the significant correlations (at 99% confidence leveltwo-tailed test) that were confirmed by the literature. The selected correlations indicatedthe relevant causal relationships among any pair of concepts.
The decision rules adopted in the cross-analysis are given in Table 2. The chosen rela-tionships to build the data-FCM had to necessarily fulfil both conditions: to present asignificant Pearson correlation and to be relevant to one or more case studies retrieved.Relationships without significant correlations and with no evidence from the literaturewere excluded. The literature review was limited to cases adopting spatial analysis atlocal or regional scale in Rondônia, or to areas presenting similar land occupation history,such as official settlements in Pará and in Acre states. Relationships occurring at broadtemporal scales, such as fire reoccurrence due to intensified dry seasons, could only be
Spontaneouscolonization
Oldsettlements
AccessibilityInfrastructure
Dry seasonseverity
Firespots
Number ofinhabitants
Highfertility
Forestreserves
Landprices
Agro-pastureexpansion
Cattleherd
Subsidizedcredits
Age ofhouseholds
Per capitaincome
t >>
t >>t >>>
t >>
t >>
Figure 4. Relationships among concepts resulted from the cross-analysis between the Pearsoncorrelation values and literature review of specific case studies. Relationships occurring at longertime scales are indicated by t >> (demographic and landscape processes) or by t >>> (climaticprocesses).

Journal of Land Use Science 9
confirmed by case studies at the scale of the entire Amazon (for the complete list of casestudies per relationship see Appendix 1). Figure 4 illustrates the relationships selected inthe cross-analysis and used to build the data-FCM.
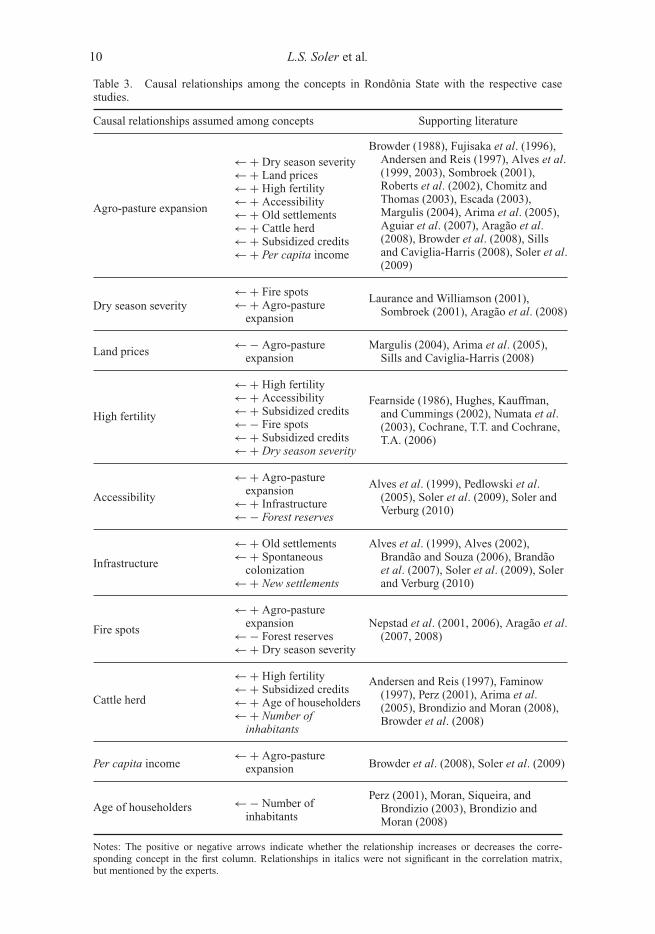
3.4. Causal relationships
Once the relationships among concepts were established in a cognitive map based on spatialdata, the next step was to determine their causality. The causality among relationships cantake opposite directions depending on the assumptions made. As a result, the directions ofthe arrows necessarily have to be derived from the literature.
Road construction and deforestation is an example of disputed causality in the BrazilianAmazon. Although some authors argue that roads are the main cause of deforestationand forest fragmentation (Laurance, Albernaz, Fearnside, Vasconcelos, and Ferreira 2004;Arima, Walker, Sales, Souza, and Perz 2008), others claim that roads play a synergic rolewith other location factors and cause less impact when appropriate enforcement is applied(Soares-Filho et al. 2004; Câmara et al. 2005; Fearnside and Graca 2006). For the caseswhere the literature was inconclusive, we argue that the most recent publications appliedto Rondônia at the regional scale represent the most significant insights. Table 3 indicatesthe directed edges (direction of the arrows) of the causal relationships identified and theirsupporting literature.
3.5. Semi-quantifying relationships
In this step the correlation matrix was used to estimate the strength of any relationship,which followed the same logic of adopting a reproducible and objective method. Similar tothe method described by Kok (2009), ranking the correlation values into an interval vari-able X ∈ [0, 1] representing the weights, we obtained the precise numeric distance betweenthe correlations. Two initial assumptions were made. First, no relationship received a valueof 1.0, indicating that a change in none of the concepts can lead to an equally strongchange of another concept. It also implies that deforestation can only be explained by a syn-ergy of several aspects (Soares-Filho et al. 2006; Aguiar, Câmara, and Escada 2007; Soleret al. 2009). Second, no significant relationships in the correlation matrix received a valueof 0.1, assuming that relationships identified in the literature had a strength of at least 0.2.
The highest and the lowest correlation values of selected relationships received valuesof 0.9 and 0.2, respectively. The correlation values in between were then classified intoa number of categories matching the exact numeric distance between 0.9 and 0.2 (seeTable 4). To be concise, the semi-quantification of relationships was assessed by rankingthe strengths of relationships where the final weights represent the relative strengths ofcausality.
3.6. Building and calibrating FCMs
The final step consisted of bringing together the structure of the relationships (Figure 4),their causality (Table 3) and weights (Table 4) into a FCM in a matrix form arranging theadjacency matrix and the state vector.
The FCM is assumed to be calibrated when it reaches the quasi stabilization, that is,when the state values of all concepts become steady. Therefore, the calibration was doneby varying the state values of specific concepts (from 0 to 1), until their stabilization aftera number of iterations. In general, the concepts chosen for the state vector calibration arethose that stabilize the system as a whole. Stabilization is also obtained by varying theeigenvalues in the adjacency matrix (from -1 to +1), which represent the self-reinforcing
10 L.S. Soler et al.
Table 3. Causal relationships among the concepts in Rondônia State with the respective casestudies.
Causal relationships assumed among concepts Supporting literature
Agro-pasture expansion
←+ Dry season severity←+ Land prices←+ High fertility←+ Accessibility←+ Old settlements←+ Cattle herd←+ Subsidized credits←+ Per capita income
Browder (1988), Fujisaka et al. (1996),Andersen and Reis (1997), Alves et al.(1999, 2003), Sombroek (2001),Roberts et al. (2002), Chomitz andThomas (2003), Escada (2003),Margulis (2004), Arima et al. (2005),Aguiar et al. (2007), Aragão et al.(2008), Browder et al. (2008), Sillsand Caviglia-Harris (2008), Soler et al.(2009)
Dry season severity←+ Fire spots←+ Agro-pasture
expansion
Laurance and Williamson (2001),Sombroek (2001), Aragão et al. (2008)
Land prices←− Agro-pasture
expansionMargulis (2004), Arima et al. (2005),
Sills and Caviglia-Harris (2008)
←+ High fertility←+ Accessibility←+ Subsidized creditsHigh fertility ←− Fire spots←+ Subsidized credits←+ Dry season severity
Fearnside (1986), Hughes, Kauffman,and Cummings (2002), Numata et al.(2003), Cochrane, T.T. and Cochrane,T.A. (2006)
Accessibility
←+ Agro-pastureexpansion←+ Infrastructure←− Forest reserves
Alves et al. (1999), Pedlowski et al.(2005), Soler et al. (2009), Soler andVerburg (2010)
Infrastructure
←+ Old settlements←+ Spontaneous
colonization←+ New settlements
Alves et al. (1999), Alves (2002),Brandão and Souza (2006), Brandãoet al. (2007), Soler et al. (2009), Solerand Verburg (2010)
Fire spots
←+ Agro-pastureexpansion←− Forest reserves←+ Dry season severity
Nepstad et al. (2001, 2006), Aragão et al.(2007, 2008)
Cattle herd
←+ High fertility←+ Subsidized credits←+ Age of householders←+ Number of
inhabitants
Andersen and Reis (1997), Faminow(1997), Perz (2001), Arima et al.(2005), Brondizio and Moran (2008),Browder et al. (2008)
Per capita income←+ Agro-pasture
expansion Browder et al. (2008), Soler et al. (2009)
Age of householders ←− Number ofinhabitants
Perz (2001), Moran, Siqueira, andBrondizio (2003), Brondizio andMoran (2008)
Notes: The positive or negative arrows indicate whether the relationship increases or decreases the corre-sponding concept in the first column. Relationships in italics were not significant in the correlation matrix,but mentioned by the experts.
Journal of Land Use Science 11
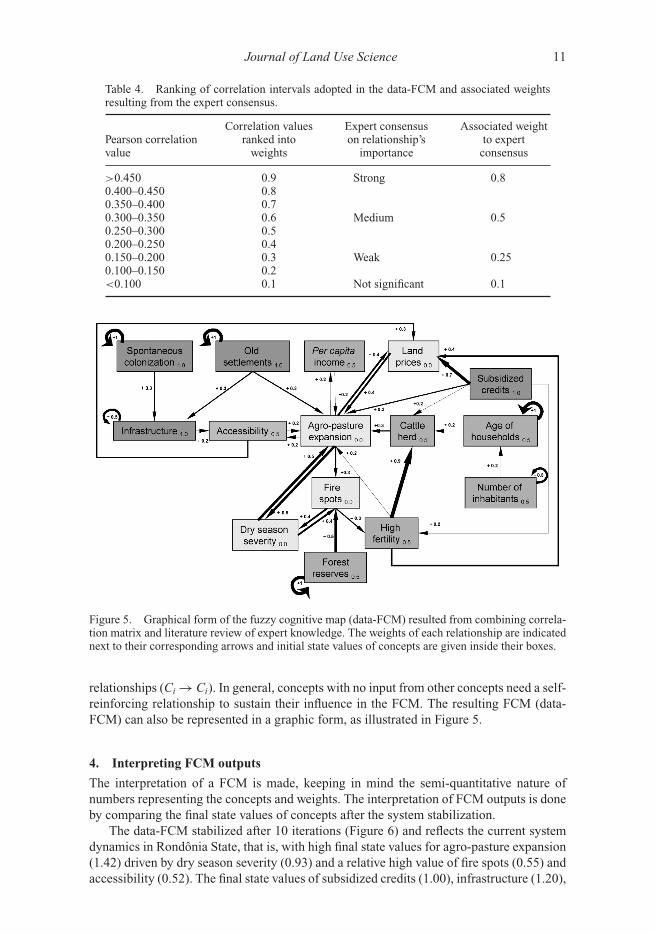
Table 4. Ranking of correlation intervals adopted in the data-FCM and associated weightsresulting from the expert consensus.
Pearson correlationvalue
Correlation valuesranked into
weights
Expert consensuson relationship’s
importance
Associated weightto expert
consensus
>0.450 0.9 Strong 0.80.400–0.450 0.80.350–0.400 0.70.300–0.350 0.6 Medium 0.50.250–0.300 0.50.200–0.250 0.40.150–0.200 0.3 Weak 0.250.100–0.150 0.2<0.100 0.1 Not significant 0.1
Figure 5. Graphical form of the fuzzy cognitive map (data-FCM) resulted from combining correla-tion matrix and literature review of expert knowledge. The weights of each relationship are indicatednext to their corresponding arrows and initial state values of concepts are given inside their boxes.
relationships (Ci→ Ci). In general, concepts with no input from other concepts need a self-reinforcing relationship to sustain their influence in the FCM. The resulting FCM (data-FCM) can also be represented in a graphic form, as illustrated in Figure 5.
4. Interpreting FCM outputs
The interpretation of a FCM is made, keeping in mind the semi-quantitative nature ofnumbers representing the concepts and weights. The interpretation of FCM outputs is doneby comparing the final state values of concepts after the system stabilization.
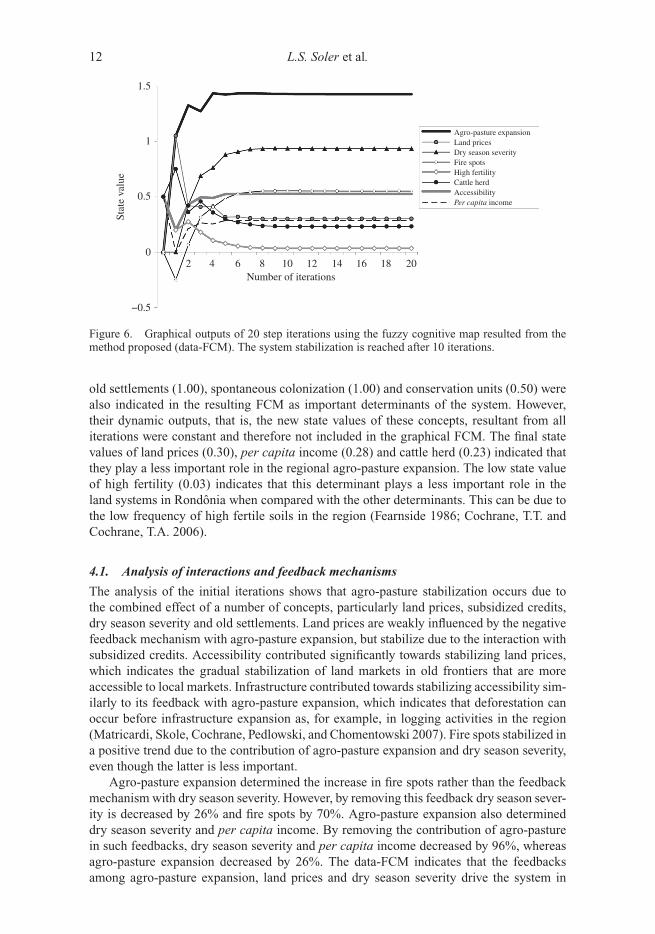
The data-FCM stabilized after 10 iterations (Figure 6) and reflects the current systemdynamics in Rondônia State, that is, with high final state values for agro-pasture expansion(1.42) driven by dry season severity (0.93) and a relative high value of fire spots (0.55) andaccessibility (0.52). The final state values of subsidized credits (1.00), infrastructure (1.20),
12 L.S. Soler et al.
1.5
1
0.5
0
−0.5
2 4 6 8 10 12 14 16 18 20Number of iterations
Stat
e va
lue
Agro-pasture expansionLand pricesDry season severityFire spotsHigh fertilityCattle herdAccessibilityPer capita income
Figure 6. Graphical outputs of 20 step iterations using the fuzzy cognitive map resulted from themethod proposed (data-FCM). The system stabilization is reached after 10 iterations.
old settlements (1.00), spontaneous colonization (1.00) and conservation units (0.50) werealso indicated in the resulting FCM as important determinants of the system. However,their dynamic outputs, that is, the new state values of these concepts, resultant from alliterations were constant and therefore not included in the graphical FCM. The final statevalues of land prices (0.30), per capita income (0.28) and cattle herd (0.23) indicated thatthey play a less important role in the regional agro-pasture expansion. The low state valueof high fertility (0.03) indicates that this determinant plays a less important role in theland systems in Rondônia when compared with the other determinants. This can be due tothe low frequency of high fertile soils in the region (Fearnside 1986; Cochrane, T.T. andCochrane, T.A. 2006).
4.1. Analysis of interactions and feedback mechanisms
The analysis of the initial iterations shows that agro-pasture stabilization occurs due tothe combined effect of a number of concepts, particularly land prices, subsidized credits,dry season severity and old settlements. Land prices are weakly influenced by the negativefeedback mechanism with agro-pasture expansion, but stabilize due to the interaction withsubsidized credits. Accessibility contributed significantly towards stabilizing land prices,which indicates the gradual stabilization of land markets in old frontiers that are moreaccessible to local markets. Infrastructure contributed towards stabilizing accessibility sim-ilarly to its feedback with agro-pasture expansion, which indicates that deforestation canoccur before infrastructure expansion as, for example, in logging activities in the region(Matricardi, Skole, Cochrane, Pedlowski, and Chomentowski 2007). Fire spots stabilized ina positive trend due to the contribution of agro-pasture expansion and dry season severity,even though the latter is less important.
Agro-pasture expansion determined the increase in fire spots rather than the feedbackmechanism with dry season severity. However, by removing this feedback dry season sever-ity is decreased by 26% and fire spots by 70%. Agro-pasture expansion also determineddry season severity and per capita income. By removing the contribution of agro-pasturein such feedbacks, dry season severity and per capita income decreased by 96%, whereasagro-pasture expansion decreased by 26%. The data-FCM indicates that the feedbacksamong agro-pasture expansion, land prices and dry season severity drive the system in

Journal of Land Use Science 13
a more significant way than the feedbacks between agro-pasture and accessibility or percapita income.
The proposed method has indicated coherent outputs regarding the relative differencesof importance of determinants of deforestation and their interactions in the case studyadopted. However, a sensitivity analysis of the main outputs of the data-FCM is done in thenext section to identify potential limitations of the method. Also, in the subsequent sectionswe develop a scenario analysis based on the data-FCM and compare the reliability of theoutputs to published results using spatially explicit models of land use/land cover change.Only then is it possible to address the conclusions about the advantage of building FCMbased on spatial data rather than on participatory approaches and endorse the consistencybetween demand and allocation in scenario analysis.
5. Incorporating expert knowledge
Although the direct link between weights and Pearson correlations is an objective proce-dure, an inherent uncertainty is present. Scale issues and inaccuracy of spatial data, as wellas spatial autocorrelation among variables, can affect correlation values (Veldkamp et al.2001, 2004; Overmars, De Koning, and Veldkamp 2003). To evaluate such uncertainties,we performed semi-structured interviews with experts to capture their interpretation of sig-nificant concepts and relationships. In total 10 experts were interviewed including land usemodellers, ecologists, agronomists, biologists and social scientists from INPE (NationalInstitute for Space Research), MPEG (Museu Paraense Emílio Goeldi) and UFRJ (FederalUniversity of Rio de Janeiro). They were selected by their relevant scientific backgroundin Amazonian deforestation studies and their influence on the policy decisions.
Using the concepts and the causal relationships adopted in the data-FCM, the inter-viewed experts were asked to rank the relative importance of each relationship (strong,medium and weak). The outcome of each interview was depicted as a FCM. Consequently,a consensual opinion from experts was obtained for each relationship and ranked intonumerical weights according to Table 4. The experts mentioned three relationships notsignificant in the correlation matrix and one relationship with supporting literature. Theserelationships were not included in the data-FCM and only considered in the sensitivity anal-ysis. Using the weights from expert consensus and the data-FCM structure, we obtained anew adapted FCM, called expert-FCM illustrated by Figure 7.
The expert-FCM stabilized after 20 iterations and the final state values of dry seasonseverity (4.65) and fire spots (4.46) indicate that these concepts are strong determinants ofagro-pasture expansion. Per capita income (2.32) and accessibility (1.81) are also impor-tant drivers of agro-pasture expansion. However, cattle herd (0.13) and land prices (-1.28)have little influence on the system, which diverges from the literature (Andersen and Reis1997; Margulis 2004; Sills and Caviglia-Harris 2008). Similar to the data-FCM, high fer-tility (-1.34) had little influence on agro-pasture expansion, even though this relationshiphad only been observed at the household level (Witcover, Vosti, Carpentier, and Gomes2006; Soler and Verburg 2010).
5.1. Spatial data versus expert knowledge
The semi-quantification of weights of relationships can be taken as the main weaknesswhen comparing two FCMs built with the same relationships, but with distinct weightsas the expert-FCM and the data-FCM. Despite that, the normalization of concepts andthe final state values can provide a partial link to qualitative outputs and facilitate thecomparison between these two FCMs. However, the concepts representing variables actingat distinct temporal scales cannot be well represented as the number of iterations in an

14 L.S. Soler et al.
6
5
4
3
2
1
0
−1
−2
Stat
e va
lue
2 4 6 8 10 12 14 16 18 20Number of iterations
Agro-pasture expansionLand pricesDry season severityFire spotsHigh fertilityCattle herdAccessibilityPer capita income
Figure 7. Graphical outputs of 20 step iterations using the fuzzy cognitive map (expert−FCM)resulted from the combination of 1) the data−FCM structure, given by the correlation matrix; and2) the strengths among relationships given by expert consensus. The system stabilization is reachedafter 20 iterations.
FCM cannot be directly translated into temporal units. Spatial and temporal issues have nosimple solution especially in a FCM representation, and they must be taken into accountwhen interpreting and comparing two FCMs.
The comparison between normalized state values of the data-FCM and the expert-FCM indicated that agro-pasture expansion, high fertility, cattle herd and forest reserveswere quite similar in both FCMs. The higher outcomes in the expert-FCM were strikingwhen compared to the data-FCM for the final state values of fire spots (166%), per capitaincome (120%) and dry season severity (92%). In contrast, significant higher state valueswere observed in the data-FCM compared to the expert-FCM for infrastructure (131%),subsidized credits (103%), land prices (72%), spontaneous colonization (103%) and oldsettlements (103%). Such differences are mostly due to the concepts acting at longer timescales (e.g. fire spots and dry season severity) in the expert-FCM, whereas in the data-FCMconcepts acting at similar spatial scales showed higher state values.
These results indicate the inherent limitations of the method, that is, the expert opiniongives higher importance to long-term variables that have a high impact on deforestation(Nepstad et al. 1999; Aragão et al. 2008) but cannot be appropriately represented in aFCM specially when built from correlation values of one single year. On the contrary, thedata-FCM seems to show higher importance for concepts acting at similar temporal andspatial scales. Although the importance of most feedback mechanisms was similar to thestabilization of both FCMs, the more evident hectic behaviour of concepts during the initialiterations in the data-FCM indicates a higher influence of feedback mechanisms than in theexpert-FCM.
5.2. Sensitivity analysis of relationships
The divergence of strengths of causal relationships between the data-FCM and the expert-FCM was evaluated. Two levels of disagreement between the two FCMs were considered:a disagreement (a mismatch within 0.2–0.4) and a strong disagreement (a mismatch≥0.5),

Journal of Land Use Science 15
as illustrated in Table 5. By adding an external concept, representing land demand or publicpolicies and by exploring the weights between this concept and the existing ones, it is pos-sible to draw conclusions about the sensitivity of the relationships. Sensitive relationshipsare assumed to cause a change of ≥0.5 in the state value of agro-pasture expansion in thedata-FCM and are indicated in the last column of Table 5.
Taking into account the 24 relationships included in the data-FCM, a total of 12 wereidentified as sensitive. Additionally, two relationships not included in the data-FCM butmentioned by the experts were also identified as sensitive. Out of 12 sensitive relationshipsin the data-FCM, 4 presented a disagreement and 5 presented a strong disagreement.
Only 20% of the relationships in the data-FCM presented a strong disagreement tothe expert-FCM, which indicates a reasonable coherence of the proposed method. All therelationships with a strong disagreement were sensitive, and they indicated that the weightswere underestimated in the data-FCM because of data limitations concerning scale issues.Although deforested cells are given in a detailed resolution of 30 m, subsidized credits andcattle herd are aggregated at the municipality level and high fertility is given at a muchcoarser scale (1:1,000,000).
The sensitive relationships with a disagreement were affected by poor data quality andspatial autocorrelation. The relationship between fire spots and high fertility was underval-ued, whereas the relationship between cattle herd and high fertility was overvalued whenusing the correlation matrix. Spatial autocorrelation between accessibility and land pricesor accessibility and forest reserves resulted in undervalued weights in the data-FCM. Thisoccurs mainly in old settlements where highly deforested areas mask the influence of mainroads.
6. Land cover change scenarios
In this section, the sensitive relationships are explored in a scenario analysis, as an exampleof application of the data-FCM. Two external concepts were added representing demandand public policies and received the initial state values of 1.0 and 0.5, respectively. Thescenarios were based on two main issues tackled with new policies by the Brazilian gov-ernment in the Amazon: land reform in confrontation to forest conservation and climatechange mitigation (Brazilian Goverment 2008, 2009).
(1) Land reform and conservation: The increase of both official settlements andspontaneous colonization is considered to- be a cause of significant deforesta-tion (Fearnside 1993; Alves et al. 2003; Brandão and Souza 2006; Ludewigs,D’antona, Brondizio, and Hetrick 2009). However, deforestation is controlled bylaw enforcement over forest reserves and indigenous lands (Nepstad et al. 2006;Soares-Filho et al. 2006). In this scenario, the influence of demand on spon-taneous colonization received a weight of 1.0, whereas the influence of publicpolicies on old settlements and on conservation reserves received 1.0 and 0.5,respectively.
(2) Climate change mitigation: We consider public policies that cut subsidies andstimulate forest conservation through environmental services rewards (Bornerand Wunder 2008; Fearnside 2008a). However, we depict a scenario with inten-sification of dry season severity as a response to climate change (Malhi et al.2009). In this scenario, the influence of demand on dry season severity receives aweight of 1.0, whereas the influence of public policies on subsidized credits andconservation reserves receives –0.5 and 1.0, respectively.

16 L.S. Soler et al.Ta
ble
5.D
egre
esof
disa
gree
men
tbet
wee
nth
ew
eigh
tsgi
ven
byth
eco
rrel
atio
nm
atri
xan
dex
pert
s’co
nsen
sus
onth
eim
port
ance
ofre
lati
onsh
ips.
Rel
atio
nshi
pC
orre
lati
onva
lue
(mod
ule)
Wei
ght
Exp
ert
cons
ensu
sR
anke
dw
eigh
tto
expe
rtco
nsen
sus
Deg
ree
ofdi
sagr
eem
ent
Sen
sitiv
ere
lati
onsh
ips
inth
eda
ta-F
CM
Agr
op↔
Dry
Sv
0.25
10.
4M
ediu
m0.
5N
odi
sagr
eem
ent
No
Agr
op↔
Lpr
i0.
242
0.4
Med
ium
0.5
No
Agr
op→
Acc
es0.
106
0.2
Wea
k0.
25N
oD
ryS
v↔
Fire
0.20
50.
4M
ediu
m0.
5N
oFo
Res→
Fire
0.29
60.
6M
ediu
m0.
5Y
esC
red→
Lpr
i0.
356
0.7
Str
ong
0.8
Yes
Hfe
rt→
Lpr
i0.
239
0.4
Med
ium
0.5
Yes
Infr
a→
Acc
es0.
128
0.3
Med
ium
0.5
Dis
agre
emen
tN
oA
grop↔
Inca
p0.
109
0.2
Med
ium
0.5
No
Hfe
rt→
Agr
op0.
128
0.2
Med
ium
0.5
No
Acc
es→
Agr
op0.
106
0.2
Med
ium
0.5
No
CH
erd→
Agr
op0.
153
0.2
Med
ium
0.5
No
Agr
op→
Fire
0.17
20.
3M
ediu
m0.
5N
oA
geH→
CH
erd
0.11
80.
2M
ediu
m0.
5N
oH
fert→
CH
erd
0.45
80.
9M
ediu
m0.
5Y
esFi
re→
Hfe
rt0.
155
0.3
Med
ium
0.5
Yes
Old
Set→
Infr
a0.
167
0.3
Med
ium
0.5
Yes
Acc
es→
Lpr
i0.
189
0.2
Med
ium
0.5
Yes
Inha
b→
Age
H0.
109
0.2
Med
ium
0.5
No
New
Set→
Infr
a0.
023
0.1
Med
ium
0.5
No
Inha
b→
CH
erd
0.08
50.
1M
ediu
m0.
5N
oD
rySv↔
Hfe
rt0.
487
0.9
Med
ium
0.5
Yes
Cre
d→
Agr
op0.
158
0.3
Str
ong
0.8
Str
ong
disa
gree
men
tY
es
Old
Set→
Agr
op0.
164
0.3
Str
ong
0.8
Yes
Cre
d→
CH
erd
0.14
0.2
Str
ong
0.8
Yes
Cre
d→
Hfe
rt0.
116
0.2
Str
ong
0.8
Yes
Spt
Col→
Infr
a0.
163
0.3
Str
ong
0.8
Yes
FoR
es→
Acc
es0.
078
0.1
Stro
ng0.
8Ye
s
Not
es:
The
sens
itiv
ere
lati
onsh
ips
are
iden
tifi
edin
the
last
colu
mn.
Agr
op,a
gro-
past
ure
expa
nsio
n;D
ryS
v,dr
yse
ason
seve
rity
;L
pri,
land
pric
es;
Cre
d,su
bsid
ized
cred
its;
Hfe
rt,
high
fert
ilit
y;A
cces
,ac
cess
ibil
ity;
Infr
a,in
fras
truc
ture
;Fi
re,
fire
spot
s;C
Her
d,ca
ttle
herd
;Fo
Res
,fo
rest
rese
rves
;O
ldS
et,
old
sett
lem
ents
;N
ewS
et,
new
sett
lem
ents
;S
ptC
ol,
spon
tane
ous
colo
niza
tion
;Inc
ap,p
erca
pita
inco
me;
Inha
b,nu
mbe
rof
inha
bita
nts;
Age
H,a
geof
hous
ehol
ders
.Rel
atio
nshi
psin
ital
icha
dno
tbee
nin
clud
edin
the
data
-FC
M,b
utw
ere
men
tion
edby
expe
rts
asre
leva
nton
es.

Journal of Land Use Science 17
Figure 8. Graphical outputs of data-FCM and expert-FCM under the two different scenariosproposed. Final state values of concepts are not normalized in the graphics.
The scenarios evaluation was made, comparing the variation of the final state values withinthe same system (data-FCM or expert-FCM) to their respective scenarios illustrated inFigure 8. Normalized state values were assessed as an attempt to compare the data-FCMand the expert-FCM.
Similar to the current situation, the expert-FCM presented higher amplitude of the finalstate values than the data-FCM for both scenarios. The land reform and conservation poli-cies scenario indicated a relevant increase on deforestation (i.e. agro-pasture expansion)for both the expert-FCM (9.70) and the data-FCM (2.68), although the latter to a smallerextent. This difference is due to a higher (indirect) contribution of spontaneous coloniza-tion to the final state value of accessibility (5.65) in the expert-FCM, in comparison tothe data-FCM (1.65). Note that neither FCM indicated a decrease on deforestation rateswith law enforcement over forest reserves, but in the data-FCM forest reserves equalizedfire spots (0.55), soil fertility (0.03) and cattle herd (0.23) to the current situation. Thisindicates a more optimistic trend of land impoverishment.
In the climate change mitigation scenario, both FCMs showed a decrease in deforesta-tion particularly because of reduced subsidies. Agro-pasture expansion in the data-FCMand in the expert-FCM was 0.86 and 1.93, respectively. Thus, the stabilization of a con-cept in a FCM does not mean its stagnation. In both systems dry season severity and firespots decreased significantly under the influence of public policies over forest reserves,
18 L.S. Soler et al.
which reflects the role of protected areas in regulating rainfall patterns (Walker et al. 2009).In addition, the data-FCM indicated a more positive scenario of high soil fertility (0.18)and cattle herd (0.11), with decreased fire spots (-0.77). This scenario suggests that agro-pasture expansion might not be directly stopped by intensified dry seasons, but they candisturb the resilience of land system and notably affect agro-pasture activities (Lauranceand Williamson 2001; Aragão et al. 2007; Malhi et al. 2009). A return to current degreeof resilience is suggested by both systems with high subsidies.
6.1. Qualitative outputs of scenario analysis
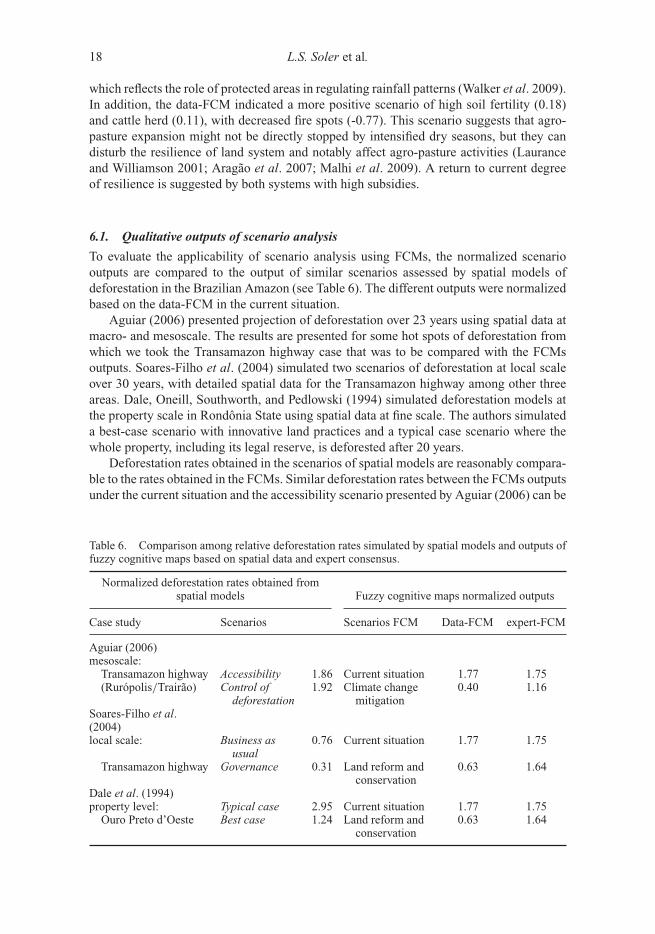
To evaluate the applicability of scenario analysis using FCMs, the normalized scenariooutputs are compared to the output of similar scenarios assessed by spatial models ofdeforestation in the Brazilian Amazon (see Table 6). The different outputs were normalizedbased on the data-FCM in the current situation.
Aguiar (2006) presented projection of deforestation over 23 years using spatial data atmacro- and mesoscale. The results are presented for some hot spots of deforestation fromwhich we took the Transamazon highway case that was to be compared with the FCMsoutputs. Soares-Filho et al. (2004) simulated two scenarios of deforestation at local scaleover 30 years, with detailed spatial data for the Transamazon highway among other threeareas. Dale, Oneill, Southworth, and Pedlowski (1994) simulated deforestation models atthe property scale in Rondônia State using spatial data at fine scale. The authors simulateda best-case scenario with innovative land practices and a typical case scenario where thewhole property, including its legal reserve, is deforested after 20 years.
Deforestation rates obtained in the scenarios of spatial models are reasonably compara-ble to the rates obtained in the FCMs. Similar deforestation rates between the FCMs outputsunder the current situation and the accessibility scenario presented by Aguiar (2006) can be
Table 6. Comparison among relative deforestation rates simulated by spatial models and outputs offuzzy cognitive maps based on spatial data and expert consensus.
Normalized deforestation rates obtained fromspatial models Fuzzy cognitive maps normalized outputs
Case study Scenarios Scenarios FCM Data-FCM expert-FCM
Aguiar (2006)mesoscale:
Transamazon highway Accessibility 1.86 Current situation 1.77 1.75(Rurópolis/Trairão) Control of
deforestation1.92 Climate change
mitigation0.40 1.16
Soares-Filho et al.(2004)local scale: Business as
usual0.76 Current situation 1.77 1.75
Transamazon highway Governance 0.31 Land reform andconservation
0.63 1.64
Dale et al. (1994)property level: Typical case 2.95 Current situation 1.77 1.75
Ouro Preto d’Oeste Best case 1.24 Land reform andconservation
0.63 1.64
Journal of Land Use Science 19
due to a higher similarity in the scenarios assumptions. Moreover, this case study adoptedspatial data and scale of analysis comparable to our case study in Rondônia State.
In the scenarios presented by Soares-Filho et al. (2004), lower deforestation rates wereobtained in comparison with both FCMs outputs, although in the data-FCM under the landreform and conservation scenario the difference was smaller. Plausible reasons are theuse of detailed fieldwork information and different assumptions in conservation policiesbetween the land reform and conservation and the governance scenario. At the propertylevel, the simulated changes by Dale et al. (1994) under the typical case scenario werealmost twofold higher than both FCMs under the current situation. Differences betweenthe best case and the land reform and conservation scenarios were relevant in the data-FCM. This incongruence at the fine spatial scale is likely due to drivers and processesacting at smaller scales than our regional case study accounts for, which might limit theexemplified application.
7. Strong and weak points of the proposed method
Reproducibility and robustness can be considered the strongest points of the proposedmethod, in comparison with participatory methods of building FCMs. The main similar-ities between the data-FCM and the expert-FCM were the equalized final state values ofagro-pasture expansion and the importance of most feedback mechanisms. Furthermore,feedback mechanisms between agro-pasture expansion and land prices and between agro-pasture expansion and dry season severity have shown coherent responses to the literature(Nepstad et al. 2001; Aragão et al. 2007; Sills and Caviglia-Harris 2008), which reinforcesthe structure based on the correlation matrix.
The weakest points of the method are arguably data and literature availability limitingthe identification of causal relationships. The semi-quantification of relationships was mostlimited by pitfalls intrinsic to empirical and multi-level data analysis such as scale issues,poor data quality and spatial autocorrelation. Processes occurring at different time scaleswere poorly captured in the correlation matrix (as the increase of fire spots with drierperiods). Feedbacks between fire spots and high fertility and between accessibility andland prices were undervalued in the data-FCM, as a result of poor data quality and spatialautocorrelation. Different data aggregation of subsidized credits and per capita income aswell as incomplete land tenure data resulted in undervalued relationships in the data-FCM.
In the scenario analysis, regional processes are better simulated in the data-FCM (e.g.soil impoverishment due to the increase on fire spots). On the contrary, the expert-FCMtranslated better processes occurring at broader scales, for instance, the role of forestreserves in rainfall patterns. Despite this, both systems indicated the high sensitivity ofconservation policies being negatively affected by the current paradigm of agrarian settle-ments and existing subsidized credits (Pedlowski et al. 2005; Pacheco 2009) and positivelyaffected when subsidies are removed. The qualitative comparison of scenarios outputsbetween spatial models and FCMs indicated that the latter provide coherent demands ofchange. Limitations lie on data availability and scale dependence of processes within thecase study adopted.
8. Conclusions
By using the data-FCM in scenario analysis, it is possible to evaluate the sensitivity ofgovernance and to assess rates of land cover change comparable to spatially explicit modeloutputs. Thus, the data-FCM can be used as a new method of scenario analysis. We argue

20 L.S. Soler et al.
that by incorporating the proposed method to spatially explicit models we endorse theconsistency between demand and allocation. In addition, we prevent the potential incon-gruence of considering divergent realities from stakeholders or too different backgroundsgiven by experts’ consensus.
The resulting FCM based on spatially explicit data has proved to be a coherent tool toassess land cover change scenarios. Even though there are no strong arguments to claim thatthe data-FCM is more suitable than the expert-FCM for scenario analysis, the data-FCMrepresents a more robust and reproducible method. The main limitations of the method liein on data and literature availability as well as spatial and temporal scaling issues whendealing with multi-level data.
Because of data-FCM limitations, expert-FCM can be claimed to be more suitable toassess more realistic scenario analyses. However, the robustness and reproducibility of thismethod are compromised as the same group of experts could suggest different strengthsand relationships according to current land system dynamics and environmental policiesagenda. Even though the expert-FCM was useful as a means to reveal spatial data limi-tations as autocorrelation, its structure mirrored the data-FCM structure and is under theinfluence of similar limitations as data availability, scaling issues and literature availability.Therefore, expert-FCM could be used as a complementary step to the proposed data-FCMto diminish data limitation issues.
AcknowledgementsThis research was funded by the Dutch National Science Foundation (NWO-WOTRO) project“Vulnerability and resilience of the Brazilian Amazon forests and human environment to changesin land use and climate”. The authors would like to thanks Dalton Valeriano, Diógenes Alves, AnaPaula Aguiar, Roberto Araújo, João Roberto dos Santos, Cláudio Almeida and Cláudio Linhares forsharing their knowledge during the interviews performed.
ReferencesAguiar, A.P.D. (2006), “Modeling Land Use Change in the Brazilian Amazon: Exploring Intra-
regional Heterogeneity,” Ph.D dissertation, National Institute for Space Research (INPE), SãoJosé dos Campos SP, Brazil.
Aguiar, A.P.D., Câmara, G., and Escada, M.I.S. (2007), “Spatial Statistical Analysis of Land-UseDeterminants in the Brazilian Amazonia: Exploring Intra-regional Heterogeneity,” EcologicalModelling, 209(2–4), 169–188.
Alves, D.S. (2002), “Space-Time Dynamics of Deforestation in Brazilian Amazonia,” InternationalJournal of Remote Sensing, 23(14), 2903–2908.
Alves, D.S. (2008), “Taking Things Public: A Contribution to Address Human Dimensions ofEnvironmental Change,” Philosophical Transactions of the Royal Society B-Biological Sciences,363(1498), 1903–1909.
Alves, D.S., Escada, M.I.S., Pereira, J.L.G., and Linhares, C.D. (2003), “Land Use Intensificationand Abandonment in Rondonia, Brazilian Amazonia,” International Journal of Remote Sensing,24(4), 899–903.
Alves, D.S., Pereira, J.L.G., Sousa, C.L.D., Soares, J.V., and Yamaguchi, F. (1999), “CharacterizingLandscape Changes in Central Rondonia Using Landsat TM Imagery,” International Journal ofRemote Sensing, 20(14), 2877–2882.
Andersen, L.E., and Reis, E.J. (1997), “Deforestation, Development and Government Policy inthe Brazilian Amazon: An Econometric Analysis,” Instituto de Pesquisa Econômica Aplicada(IPEA), 27.
Aragão, L.E.O.C., Malhi, Y., Barbier, N., Lima, A., Shimabukuro, Y., Anderson, L., and Saatchi,S. (2008), “Interactions Between Rainfall, Deforestation and Fires During Recent Years in theBrazilian Amazonia,” Philosophical Transactions of the Royal Society B-Biological Sciences,363(1498), 1779–1785.

Journal of Land Use Science 21
Aragão, L.E.O.C., Malhi, Y., Roman-Cuesta, R.M., Saatchi, S., Anderson, L.O., and Shimabukuro,Y.E. (2007), “Spatial Patterns and Fire Response of Recent Amazonian Droughts,” GeophysicalResearch Letters, 34(7).
Arima, E.Y., Barreto, P., and Brito, M. (2005), “Cattle Ranching in the Amazon: Trends andImplications for Environmental Conservation, Belém: IMAZON.
Arima, E.Y., Walker, R.T., Sales, M., Souza, C., and Perz, S.G. (2008), “The Fragmentation of Spacein the Amazon Basin: Emergent Road Networks,” Photogrammetric Engineering and RemoteSensing, 74(6), 699–709.
Axelrod, R. (1976), Structure of Decision: The Cognitive Maps of Political Elites, Princeton:Princeton University Press.
Becker, B. (2004), Amazônia: Geopolítica na virada do III milênio, Rio de Janeiro: Garamond.Borner, J., and Wunder, S. (2008), “Paying for Avoided Deforestation in the Brazilian Amazon: From
Cost Assessment to Scheme Design,” International Forestry Review, 10(3), 496–511.Brandão, A.O., and Souza, C. (2006), Deforestation in Land Reform Settlements in the Amazon.
Belém: IMAZON.Brandão, A.O., Souza, C.M., Ribeiro, J.G.F., and Sales, M.H.R. (2007), “Deforestation and unofficial
roads in the Amazon,” in XIII Brazilian Symposium of Remote Sensing, Florianópolis, Brazil, pp.2357–2364.
Brasil, (2007), Anuário estatístico do crédito rural 2000–2007. Banco Central do Brasil.Brazilian Government (2008), “Brazilian National Plan on Climate Change” Decree n◦ 6.263, 21st
November 2007, 154. Available from: http://www.brasil.gov.br/pac.Brazilian Government (2009), Provisional Measure (MP) number 458/09, implemented on 10th
February 2009. Available from: http://www.brasil.gov.br.Brondizio, E.S., and Moran, E.F. (2008), “Human Dimensions of Climate Change: The Vulnerability
of Small Farmers in the Amazon,” Philosophical Transactions of the Royal Society B-BiologicalSciences, 363(1498), 1803–1809.
Browder, J.O. (1988), “Public Policy and Deforestation in the Brazilian Amazon,” In Public Policiesand the Misuse of Forest Resources, eds. R. Repetto and M. Gillis, Cambridge: CambridgeUniversity Press, pp. 247–283.
Browder, J.O. (1994), “Surviving in Rondonia – The Dynamics of Colonist Farming Strategies inBrazil Northwest Frontier,” Studies In Comparative International Development, 29(3), 45–69.
Browder, J.O., Pedlowski, M.A., Walker, R., Wynne, R.H., Summers, P.M., Abad, A., Becerra-Cordoba, N., and Mil-Homens, J. (2008), “Revisiting Theories of Frontier Expansion in theBrazilian Amazon: A Survey of the Colonist Farming Population in Rondonia’s Post-Frontier,1992–2002,” World Development, 36(8), 1469–1492.
Câmara, G., Paula, A., Aguiar, D., Escada, M.I., Amaral, S., Carneiro, T., Monteiro, A.M.V., Araujo,R., Vieira, I., and Becker, B. (2005), “Amazonian Deforestation Models,” Science, 307(5712),1043–1044.
Carley, K., and Palmquist, M. (1992), “Extracting, Representing, and Analyzing Mental Models,”Social Forces, 70(3), 601–636.
Chomitz, K.M., and Thomas, T.S. (2003), “Determinants of Land Use in Amazonia: A Fine-ScaleSpatial Analysis,” American Journal of Agricultural Economics, 85, 1016–1028.
Claessens, L., Schoorl, J.M., Verburg, P.H., Geraedts, L., and Veldkamp, A. (2009), “ModellingInteractions and Feedback Mechanisms Between Land Use Change and Landscape Processes,”Agriculture Ecosystems & Environment, 129(1–3), 157–170.
Cochrane, T.T., and Cochrane, T.A. (2006), “Diversity of the Land Resources in the Amazonian Stateof Rondônia, Brazil,” Acta Amazonica, 36(1), 91–102.
Cossette, P., and Audet, M. (1992), “Mapping of an Idiosyncratic Schema,” Journal of ManagementStudies, 29(3), 325–347.
Coy, M. (1987), “Rondônia: frente pioneira e o programa polonoroeste. O processo de diferenciaçãosócioeconômica na periferia e os limites do planejamento público,” Tubinguen GeographischeStudien, 95, 253–270.
CPRM (2004), Carta Geológica do Brasil ao Milionésimo, folha SC-20, 1:1.000.000, Rio de Janeiro:CPRM.
Dale, V.H., Oneill, R.V., Southworth, F., and Pedlowski, M. (1994), “Modeling Effects of LandManagement in the Brazilian Settlement of Rondonia,” Conservation Biology, 8(1), 196–206.
Escada M.I.S. (2003), ‘Evolução de padrões da terra na região Centro-Norte de Rondônia’ Ph. Ddissertation, National Institute for Space Research (INPE), São José dos Campos, SP, Brazil.
22 L.S. Soler et al.
Faminow, M.D. (1997), “Spatial Economics of Local Demand for Cattle Products in AmazonDevelopment,” Agriculture Ecosystems & Environment, 62(1), 1–11.
Fearnside, P.M. (1980), “The Effect of Cattle Pasture on Soil Fertility in the Brazilian Amazon:Consequences for Beef Production Sustainatility,” Tropical Ecology, 21(1), pp. 125–137.
Fearnside, P.M. (1986), “Settlement in Rondonia and the Token Role of Science and Technology inBrazil Amazonian Development-Planning,” Interciencia, 11(5), 229–236.
Fearnside, P.M. (1993), “Deforestation in Brazilian Amazonia: The Effect of Population and LandTenure,” Ambio, 22(8), 537–545.
Fearnside, P.M. (2003), “Conservation Policy in Brazilian Amazonia: Understanding the Dilemmas,”World Development, 31(5), 757–779.
Fearnside, P.M. (2005), “Deforestation in Brazilian Amazonia: History, Rates, and Consequences,”Conservation Biology, 19(3), 680–688.
Fearnside, P.M. (2008a), “Amazon Forest Maintenance as a Source of Environmental Services,”Anais Da Academia Brasileira De Ciencias, 80(1), 101–114.
Fearnside, P.M. (2008b), “The Roles and Movements of Actors in the Deforestationof Brazilian Amazonia,” Ecology and Society, 13(1), p. 23. Available from:http://www.ecologyandsociety.org.
Fearnside, P.M., and Graca, P.M.L.D. (2006), “BR-319: Brazil’s Manaus-Porto Velho Highway andthe Potential Impact of Linking the Arc of Deforestation to Central Amazonia,” EnvironmentalManagement, 38(5), 705–716.
Fujisaka, S., Bell, W., Thomas, N., Hurtado, L., and Crawford, E. (1996), “Slash-and-burnAgriculture, Conversion to Pasture, and Deforestation in Two Brazilian Amazon Colonies,”Agriculture Ecosystems & Environment, 59(1–2), 115–130.
Geist, H., Mcconnell, W.J., Lambin, E.F., Moran, E.F., Alves, D.S., and Rudel, T. (2006), “Causesand Trajectories of Land-Use/Cover Change,” In Land-Use and Land-Cover Change: LocalProcesses and Global Impacts (1st ed.), eds. E.F. Lambin and H. Geist, Berlin: Springer,p. 222.
Hecht, S.B. (1985), “Environment Development and Poltics: Capital Accumulation and the Livestockin Easten Amazonia” World Development, 13(6), pp. 663–684.
Hughes, R.F., Kauffman, J.B., and Cummings, D.L. (2002), “Dynamics of Aboveground and SoilCarbon and Nitrogen Stocks and Cycling of Available Nitrogen Along a Land-Use Gradient inRondonia, Brazil,” Ecosystems, 5(3), 244–259.
IBAMA (2005), Online database [online]. MMA (Ministério do Meio Ambiente). Instituto Brasileirodo Meio Ambiente e dos Recursos Naturais Renováveis, Available from: http://www.ibama.gov.br.
IBGE (2000), Censo demográfico 2000. Rio de Janeiro: Instituto Brasileiro de Geografia e Estatística(IBGE).
IDARON, (2006), Fieldwork Reports of Vaccination Campaigns Against Aftosa Fever from 1999 to2006, Porto Velho: Agência de Defesa Sanitária Agrosilvopastoril do Estado de Rondônia.
INCRA (2007), Statistical data per category of rural property. Brazil: National Institute ofColonization and Land Reform.
INCRA (2008), Plans of Agrarian Projects in the North of Rondônia State, Ariquemes: INCRA.INPE (2009), PRODES – Monitoring the Brazilian Amazonian Forest by Satellite Images, São José
dos Campos, São Paulo: Instituto Nacional de Pesquisas Espaciais.INPE/CPTEC (2005), Burns monitoring. São José dos Campos, São Paulo. National Institute for
Space Research (INPE).Jenkins, C.N., and Joppa, L. (2009), “Expansion of the Global Terrestrial Protected Area System,”
Biological Conservation, 142(10), 2166–2174.Kok, K. (2009), “The Potential of Fuzzy Cognitive Maps for Semi-quantitative Scenario
Development, with an Example from Brazil,” Global Environmental Change, 19(1), 122–133.Kosko, B. (1986), “Fuzzy Cognitive Maps,” International Journal of Man-Machine Studies, 24,
65–75.Lambin, E.F., and Geist, H.J. (2003), „Regional Differences in Tropical Deforestation,” Environment,
45(6), 22–36.Lambin, E.F., Turner, B.L., Geist, H.J., Agbola, S.B., Angelsen, A., Bruce, J.W., Coomes, O.T., Dirzo,
R., Fischer, G., Folke, C., George, P.S., Homewood, K., Imbernon, J., Leemans, R., Li, X.B.,Moran, E.F., Mortimore, M., Ramakrishnan, P.S., Richards, J.F., Skanes, H., Steffen, W., Stone,G.D., Svedin, U., Veldkamp, T.A., Vogel, C., and Xu, J.C. (2001), “The Causes of Land-Use andLand-Cover Change: Moving Beyond the Myths,” Global Environmental Change-Human andPolicy Dimensions, 11(4), 261–269.
Journal of Land Use Science 23
Laurance, W.F., Albernaz, A.K.M., Fearnside, P.M., Vasconcelos, H.L., and Ferreira, L.V. (2004),“Deforestation in Amazonia,” Science, 304(5674), 1109–1109.
Laurance, W.F., and Williamson, G.B. (2001), “Positive Feedbacks Among Forest Fragmentation,Drought, and Climate Change in the Amazon,” Conservation Biology, 15(6), 1529–1535.
Liu, J., Dietz, T., Carpenter, S.R., Alberti, M., Folke, C., Moran, E., Pell, A.N., Deadman, P., Kratz,T., Lubchenco, J., Ostrom, E., Ouyang, Z., Provencher, W., Redman, C.L., Schneider, S.H.,and Taylor, W.W. (2007), “Complexity of Coupled Human and Natural Systems,”. Science,317(5844), 1513–1516.
Ludewigs, T., D’antona, A.D., Brondizio, E.S., and Hetrick, S. (2009), “Agrarian Structure and Land-Cover Change Along the Lifespan of Three Colonization Areas in the Brazilian Amazon,” WorldDevelopment, 37(8), 1348–1359.
Machado, L. (ed.) (1998), A fronteira agrícola na Amazônia, São Paulo: Cia das Letras.Malhi, Y., Aragão, L.E.O.C., Galbraith, D., Huntingford, C., Fisher, R., Zelazowski, P., Sitch, S.,
Mcsweeney, C., and Meir, P. (2009), “Exploring the Likelihood and Mechanism of a Climate-Change-Induced Dieback of the Amazon Rainforest,” Proceedings of the National Academy ofSciences, 106(49) pp. 20610–20616. Available from: http://www.pnas.org/content/early/2009/02/12/0804619106.abstract
MAPA, (2008), List of Slaughterhouses and Diary Industries Certified by the Federal InspectionAgency, 106(49) pp. 20610–20616. Brasilia: Serviço de Inspeção Federal – Ministério daAgricultura, Pecuária e Abastecimento.
Margulis, S. (2004), Causes of Deforestation in the Brazilian Amazon. Washington, DC: World Bank,p. 22.
Matricardi, E.A.T., Skole, D.L., Cochrane, M.A., Pedlowski, M., and Chomentowski, W. (2007),“Multi-Temporal Assessment of Selective Logging in the Brazilian Amazon using Landsat Data,”International Journal of Remote Sensing, 28(1–2), 63–82.
Microsoft (2003). Microsoft Office Excel. Copyright © 1985-2003 Microsoft Corporation.Millikan, B.H. (1992), Tropical Deforestation, Land Degradation, and Society – Lessons from
Rondonia, Brazil,” Latin American Perspectives, 19(1), 45–72.Milne, E., Aspinall, R., and Veldkamp, T. (2009), “Integrated Modelling of Natural and Social
Systems in Land Change Science,” Landscape Ecology, 24(9), 1145–1147.Montazemi, A.R., and Conrath, D.W. (1986), “The Use of Cognitive Mapping for Information
Requirements Analysis,” MIS Quarterly, 10(1), 45–56.Moran, E.F. (1993), “Deforestation and Land-Use in the Brazilian Amazon,” Human Ecology, 21(1),
1–21.Moran, E.F., Siqueira, A., and Brondizio, E.S. (2003), “Household Demographic Structure and
its Relationship to Deforestation in the Amazon Basin,” in People and the EnvironmentApproaches for Linking Household and Community Surveys to Remote Sensing and GIS, eds.J. Fox, R.R. Rindfuss, S.J. Walsh and V. Mishra, Dordrecht: Kluwer Academic Publishers,pp. 61–89.
Nepstad, D., Carvalho, G., Barros, A.C., Alencar, A., Capobianco, J.P., Bishop, J., Moutinho, P.,Lefebvre, P., Silva, U.L., and Prins, E. (2001), “Road Paving, Fire Regime Feedbacks, and theFuture of Amazon Forests,” Forest Ecology and Management, 154(3), 395–407.
Nepstad, D., Schwartzman, S., Bamberger, B., Santilli, M., Ray, D., Schlesinger, P., Lefebvre, P.,Alencar, A., Prinz, E., Fiske, G., and Rolla, A. (2006), “Inhibition of Amazon Deforestation andFire by Parks and Indigenous Lands,” Conservation Biology, 20(1), 65–73.
Nepstad, D.C., Verissimo, A., Alencar, A., Nobre, C., Lima, E., Lefebvre, P., Schlesinger,P., Potter, C., Moutinho, P., Mendoza, E., Cochrane, M., and Brooks, V. (1999), “Large-Scale Impoverishment of Amazonian Forests by Logging and Fire,” Nature, 398(6727),505–508.
Numata, I., Soares, J.V., Roberts, D.A., Leonidas, F.C., Chadwick, O.A., and Batista, G.T. (2003),“Relationships Among Soil Fertility Dynamics and Remotely Sensed Measures Across PastureChronosequences in Rondonia, Brazil,” Remote Sensing of Environment, 87(4), 446–455.
Overmars, K.P., De Koning, G.H.J., and Veldkamp, A. (2003),” Spatial Autocorrelation in Multi-Scale Land Use Models,” Ecological Modelling, 164(2–3), 257–270.
Ozesmi, U., and Ozesmi, S. (2003), “A Participatory Approach to Ecosystem Conservation: FuzzyCognitive Maps and Stakeholder Group Analysis in Uluabat Lake, Turkey,” EnvironmentalManagement, 31(4), 518–531.
Pacheco, P. (2009), “Agrarian Reform in the Brazilian Amazon: Its Implications for LandDistribution and Deforestation,” World Development, 37(8), 1337–1347.

24 L.S. Soler et al.
Parker, D.C., Hessl, A., and Davis, S.C. (2008), “Complexity, Land-Use Modeling, and the HumanDimension: Fundamental Challenges for Mapping Unknown Outcome Spaces,” Geoforum,39(2), 789–804.
Parker, D.C., Manson, S.M., Janssen, M.A., Hoffmann, M.J., and Deadman, P. (2003), “Multi-AgentSystems for the Simulation of Land-Use and Land-Cover Change: A review,” Annals of theAssociation of American Geographers, 93(2), 314–337.
Pedlowski, M.A., Dale, V.H., Matricardi, E.A.T., and Da Silva, E.P. (1997), “Patterns and Impacts ofDeforestation in Rondonia, Brazil,” Landscape and Urban Planning, 38(3–4), 149–157.
Pedlowski, M.A., Matricardi, E.A.T., Skole, D., Cameron, S.R., Chomentowski, W., Fernandes, C.,and Lisboa, A. (2005), “Conservation Units: A New Deforestation Frontier in the AmazonianState of Rondonia, Brazil,” Environmental Conservation, 32(2), 149–155.
Perz, S.G. (2001), “Household Demographic Factors as Life Cycle Determinants of Land Use in theAmazon,” Population Research and Policy Review, 20(3), 159–186.
Perz, S.G., and Walker, R.T. (2002), “Household Life Cycles and Secondary Forest Cover AmongSmall Farm Colonists in the Amazon,” World Development, 30(6), 1009–1027.
RADAMBRASIL (1978), Folha SC.20 – Porto Velho, Rio de Janeiro: IBGE.Roberts, D.A., Numata, I., Holmes, K., Batista, G., Krug, T., Monteiro, A., Powell, B., and
Chadwick, O.A. (2002), “Large Area Mapping of Land-Cover Change in Rondonia UsingMultitemporal Spectral Mixture Analysis and Decision tree Classifiers,” Journal of GeophysicalResearch-Atmospheres, 107(D20), pp. LBA 40-1-LBA 40–18.
Roberts, F.S. (1973), “Building and Analyzing an Energy Demand Signed Digraph,” Environmentand Planning A, 5(2), 199–221.
R-Project (2010), A Language and Environment for Statistical Computing. R Development CoreTeam. R Foundation for Statistical Computing. Vienna, Austria.
Schneider, R.R., Arima, E., Veríssimo, A., Barreto, P., and Souza, C.J. (2000), Sustainable Amazon:Limitations and Opportunities for Rural Development, Brasília: World Bank and IMAZON.
Scouvart, M., Adams, R.T., Caldas, M., Dale, V., Mertens, B., Nedelec, V., Pacheco, P., Rihoux,B., and Lambin, E.F. (2007), “Causes of Deforestation in the Brazilian Amazon: A QualitativeComparative Analysis,” Journal of Land Use Science, 2(4), 257–282.
Sills, E.O., and Caviglia-Harris, J.L. (2008), “Evolution of the Amazonian frontier: Land Values inRondônia, Brazil,” Land Use Policy, 26(1), 55–67.
Soares-Filho, B., Alencar, A., Nepstad, D., Cerqueira, G., Diaz, M.D.V., Rivero, S., Solorzano, L.,and Voll, E. (2004), “Simulating the Response of Land-Cover Changes to Road Paving andGovernance Along a Major Amazon Highway: The Santarem-Cuiaba corridor,” Global ChangeBiology, 10(5), 745–764.
Soares-Filho, B., Nepstad, D.C., Curran, L.M., Cerqueira, G.C., Garcia, R.A., Ramos, C.A., Voll, E.,Mcdonald, A., Lefebvre, P., and Schlesinger, P. (2006), “Modelling Conservation in the AmazonBasin,” Nature, 440(7083), 520–523.
Soler, L.S., Escada, M.I.S., and Verburg, P.H. (2009), “Quantifying Deforestation and SecondaryForest Determinants for Different Spatial Extents in an Amazonian Colonization Frontier(Rondonia),” Applied Geography, 29(2), 182–193.
Soler, L.S., and Verburg, P.H. (2010), “Combining Remote Sensing and Household Level Datafor Regional Scale Analysis of Land Cover Change in the Brazilian Amazon,” RegionalEnvironmental Change, 10(4), 371–386.
Sombroek, W. (2001), “Spatial and Temporal Patterns of Amazon Rainfall – Consequences for thePlanning of Agricultural Occupation and the Protection of Primary Forests,” Ambio, 30(7), 388–396.
Turner II, B.L., Moran, E.F., and Rindfuss, R.R. (2004), “Integrated Land-Change Science andits Relevance to the Human Sciences,” In Land Change Science: Observing, Monitoring andUnderstanding Trajectories of Change on the Earth’s Surface, eds. G. Gutman, A.C. Janetos,C.O. Justice, E.F. Moran, and J.F. Mustard, Dordrecht/London: Kluwer Academic Publishers,pp. 431–447.
Veldkamp, A., and Fresco, L.O. (1996), “CLUE-CR: An Integrated Multi-Scale Model to SimulateLand Use Change Scenarios in Costa Rica,” Ecological Modelling, 91(1–3), 231–248.
Veldkamp, A., Kok, K., De Koning, G.H.J., Schoorl, J.M., Sonnenveld, M.P.W., and Verburg, P.H.(2001), “Multi-Scale System Approaches in Agronomic Research at the Landscape Level,” SoilAnd Tillage Research, 58, 129–140.
Veldkamp, A., and Verburg, P.H. (2004), “Modelling Land Use Change and Environmental Impact,”Journal of Environmental Management, 72(1–2), 1–3.

Journal of Land Use Science 25
Verburg, P.H. (2006), “Simulating Feedbacks in Land Use and Land Cover Change Model,”Landscape Ecology, 21(8), 1171–1183.
Verburg, P.H., Kok, K., Pontius Jr., R.G., and Veldkamp, A. (2006), “Modeling Land-Use and Land-Cover Change,” In Land-Use and Land-Cover Change: Local Processes and Global Impacts (1sted.), eds. E.F. Lambin and H. Geist, Berlin: Springer, p. 222.
Verburg, P.H., Overmars, K.P., and Witte, N. (2004), Accessibility and Land-Use Patterns at theForest Fringe in the Northeastern Part of the Philippines,” The Geographical Journal, 170(3),238–255.
Vliet, M., Kok, K., and Veldkamp, A. (2010), “Linking Stakeholders and Modellers in ScenarioStudies; the Use of Fuzzy Cognitive Maps as a Communication and Learning Tool,” Futures,42(1), 1–14.
Walker, R., Moore, N.J., Arima, E., Perz, S., Simmons, C., Caldas, M., Vergara, D., and Bohrer, C.(2009), “Protecting the Amazon with Protected Areas,” Proceedings of the National Academy ofSciences, (106), 10582–10586.
Walker, R., Moran, E.F., and Anselin, L. (2000), “Deforestation and Cattle Ranching in the BrazilianAmazon: External Capital and Household Processes,” World Development, 28(4), 683–699.
Witcover, J., Vosti, S.A., Carpentier, C.L., and Gomes, T.C.D.A. (2006), Impacts of Soil QualityDifferences on Deforestation, Use of Cleared Land, and Farm Income,” Environment andDevelopment Economics, 11, 343–370.

26 L.S. Soler et al.
Appendix 1
Table A.1. Cross-analysis between correlation values (among coded variables) and literature reviewof expert knowledge (N = 140,000). Correlations are considered relevant when larger than 0.100 andsignificant at the 0.01 level (two-tailed).
RelationshipSignificantcorrelation Relationship cited by relevant literature
Data-FCMand
expert-FCM
Acces↔ Infra Yes Alves et al. (1999), Aguiar et al. (2007),Arima et al. (2008), Soler et al. (2009)
X
Agrop↔ DrySv Sombroek (2001), Chomitz and Thomas(2003), Aragão et al. (2008)
X
Agrop↔ Lpri Browder (1988), Fujisaka et al. (1996),Margulis (2004), Arima et al. (2005),Browder et al. (2008), Sills andCaviglia-Harris (2008)
X
Agrop↔ Hfert Moraes et al. (1996), Hughes et al. (2002),Roberts et al. (2002), Numata et al. (2003)
X
Agrop↔ Acces Aguiar et al. (2007), Arima et al. (2008), Soleret al. (2009)
X
Agrop↔ Fire Laurance and Williamson (2001), Aragão et al.(2008)
X
Agrop↔ Cred Andersen and Reis (1997), Arima et al. (2005) XAgrop↔ OldSet Alves et al. (1999), Escada (2003), Brandão
and Souza (2006)X
Agrop↔ CHerd Fujisaka et al. (1996), Margulis (2004), Arimaet al. (2005)
X
Agrop↔ Incap Margulis (2004), Browder et al. (2008), Soleret al. (2009)
X
Cred↔ CHerd Faminow (1997), Arima et al. (2005) XCHerd↔ AgeH Perz (2001), Moran et al. (2003), Brondizio
and Moran (2008)X
DrySv↔ Fire Nepstad et al. (2001), Aragão et al. (2007,2008)
X
Fire↔ FoRes Nepstad et al. (2006) XHfert↔ Fire Hughes et al. (2002) XHfert↔ Cred Fearnside (1986), Arima et al. (2008) XHfert↔ CHerd Fearnside (1980), Hecht (1985), Margulis
(2004)X
Infra↔ OldSet Alves et al. (1999), Alves (2002), Brandão andSouza (2006), Brandão et al. (2007), Soleret al. (2009), Soler and Verburg (accepted)
X
Infra↔ SptCol Brandão et al. (2007) XInhab↔ AgeH Perz (2001), Moran et al. (2003), Brondizio
and Moran (2008)X
Lpri↔ Hfert Sills and Caviglia-Harris (2008) XLpri↔ Acces Sills and Caviglia-Harris (2008) XLpri↔ Cred Sills and Caviglia-Harris (2008) XDrySv↔ Hfert Indirect indications: Hughes et al. (2002),
Aragão et al. (2007)X
(sensitivityanalysis andscenarios)
Acces↔ FoRes No Pedlowski et al. (2005) X(sensitivityanalysis andscenarios)
(Continued)
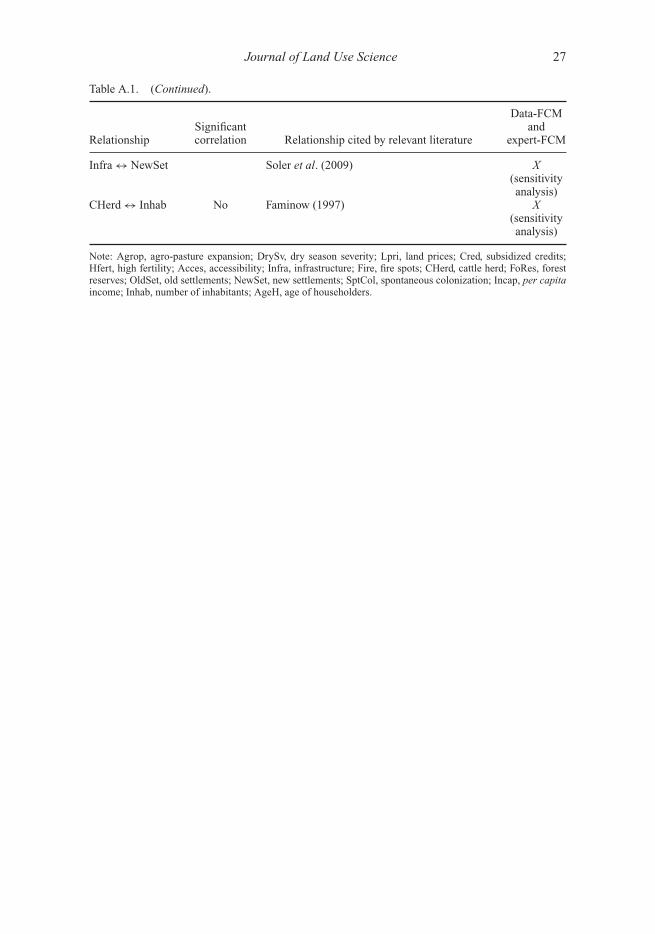
Journal of Land Use Science 27
Table A.1. (Continued).
RelationshipSignificantcorrelation Relationship cited by relevant literature
Data-FCMand
expert-FCM
Infra↔ NewSet Soler et al. (2009) X(sensitivityanalysis)
CHerd↔ Inhab No Faminow (1997) X(sensitivityanalysis)
Note: Agrop, agro-pasture expansion; DrySv, dry season severity; Lpri, land prices; Cred, subsidized credits;Hfert, high fertility; Acces, accessibility; Infra, infrastructure; Fire, fire spots; CHerd, cattle herd; FoRes, forestreserves; OldSet, old settlements; NewSet, new settlements; SptCol, spontaneous colonization; Incap, per capitaincome; Inhab, number of inhabitants; AgeH, age of householders.