Embed Size (px)
Citation preview
Proceedings of COBEM 2009 20th International Congress of Mechanical Engineering Copyright © 2009 by ABCM November 15-20, 2009, Gramado, RS, Brazil
USING FINITE ELEMENT ANALYSIS AND STRAIN GAUGE
EXPERIMENTAL DATA TO EVALUATE STRESS CONCENTRATION
FACTOR ON PRESS-FIT ASSEMBLY
Cajuhi, Aguinaldo Jose, [email protected]
Pepe, Iuri Muniz, [email protected] Laboratório de Propriedades Óticas, Instituto de Fisica, Universidade Federal da Bahia – UFBA, PPGM, Escola Politécnica, Universidade Federal da Bahia – UFBA
Moreno, Denis Mestre , [email protected] Ford Motor Company Brasil Ltda – Camaçari - Bahia Abstract. The behavior of any physical structure is usually non linear. However, the response of a given structure can
often be approximated to a linear case if its deformations or local displacements are small. This simplification is even
more acceptable when the assembled parts are able to interfere each other, a good example of interference fit is a shaft
assembled inside its housing. Interference fit tools can be used to better understanding of joint parts mounted in
circular geometry. Analytically is possible to have an initial approach in determining the amount of efforts applied to a
giving joint system. Almost all machine components and structural members suffer some form of geometrical recoil due
to backlashes and production tolerances, or, in some cases, one can experience abrupt change in cross section or
internal micro structural discontinuities. Those factors, associated with the local stress are coming from Press-fit
process causing pre-tension on internal and external surfaces. The maximum local stress normally occurs at these
discontinuities and local defects. The nominal stress can be calculated, for a particular loading and net cross section,
assuming a stress distribution for a uniform geometry. This paper presents the analytical treatment of the stress
concentration factor, based on the elasticity theory, in association with finite element analysis and the experimental
data from a strain gauge. That system was able to measure small deformation from assembled parts and its
correlations.
Keywords: strain gauge; small deformation; press-fit; correlation
1. INTRODUCTION
An essential element of successful fatigue analysis is the accurate determination of stress concentrations around
stress raising features. Quick and easy access to such data is important when different alternative geometry could be considered. Present methods for determining stress concentrations around stress raising features mainly depend on graphical charts and analytical information presented in the literature. In addition, finite element analysis (FEA) is widely used for cases where a standard solution cannot be found in the fore mentioned texts.
These methods can be time consuming and error prone, when data may need to be interpolated and extrapolated from graphical representations. Finite element analysis critically depends on the development of an accurate problem modeling, what undoubtedly takes time and consumes limited development resources. Therefore, there is a requirement of systems able on providing relevant information from powerful analysis tooling. Those analysis tools must be capable of easy and quick results interpretation, what would be extremely useful during the early stages of the product design process, especially when alternative geometries are being considered.
Analytical modeling and graphical methods are helpful in focusing resources on priority areas, and could be applied before starting with more intensive resource and time consuming techniques, such as finite element analysis.
In some structural issues it is adequate to consider uniform sections and take the average stress across that section. However, in the aerospace industry, were fatigue failure is a major consideration, it is important to consider the local stress around shoulders, holes and grooves where the stress distribution and the localized stress concentrations are introduced. If the stress concentration is significant, then premature failure of components may occur. The stress concentration factor Kt, is defined as the ratio of the peak stress and the general stress for a given component. 2. PRESS-FIT CONCEPTS
An “interference fit” is created when two cylindrical parts are assembled by shrink-fitting or press-fitting of one part
upon another (a common means of coupling a hub to a shaft). A Press-fit is obtained by machining the hole in the hub (the outer member) with a slightly smaller diameter respect to the shaft (the inner member, note that the shaft does not have to be solid). The two parts are then forced together slowly using a press (normally with oil applied at the intersection to act as a lubricant). The subsequent elastic deformation of both the shaft and the hub acts creating large
Proceedings of COBEM 2009 20th International Congress of Mechanical Engineering Copyright © 2009 by ABCM November 15-20, 2009, Gramado, RS, Brazil
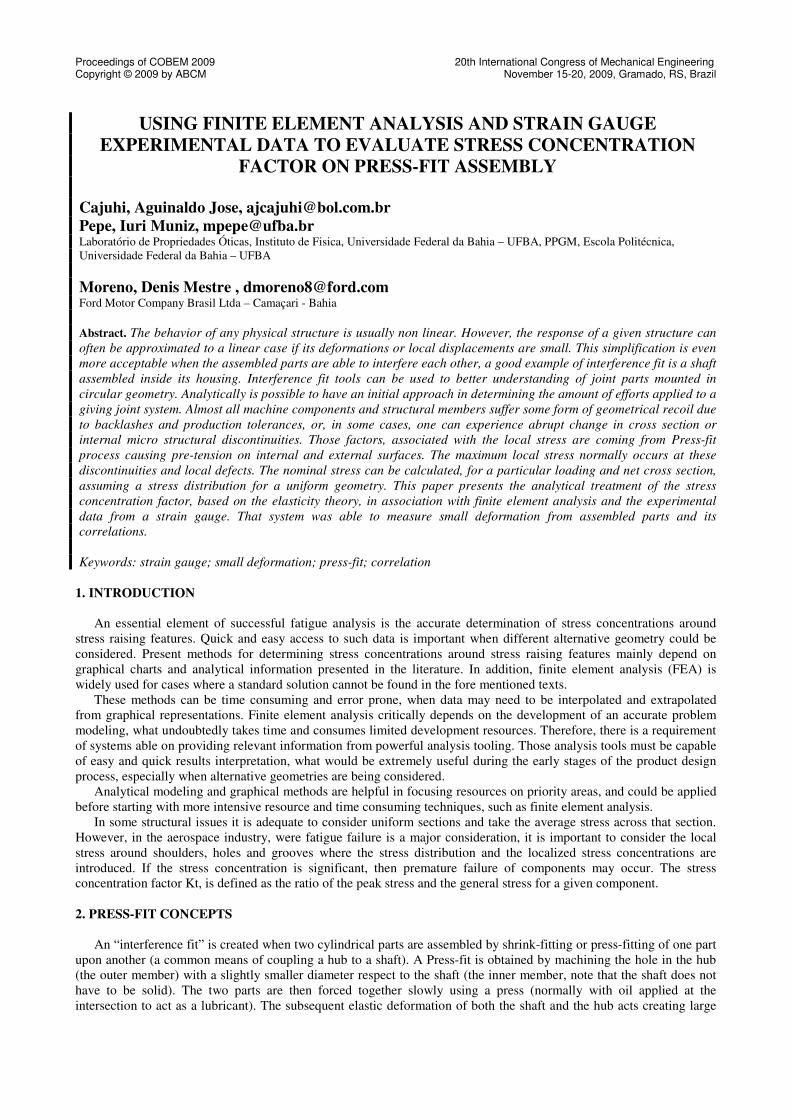
normal and frictional forces between the parts. The frictional force transmits the shaft torque to the hub and also resists to axial motion. The “Figures 1, 2, 3 and 4” show the most common of interference fit.
3. COMPUTER AIDED ENGINEERING (CAE) TOOL FOR STRESS ANALYSIS
Computer Aided Engineering (CAE) technology is supported by many commercial software packages that
successfully implement different simulation methods, the Finite Element Method (FEM) that is widely used in structural design is a good example of this technology. System responses like stress, displacements, rotations, natural frequencies, strain energy, mass, volume, etc, should be optimized and/or used as constraints.
Theses responses are generally restricted by one or more “admissible” engineering parameters such as: rupture or yield stress, fatigue limit, resonance frequency, maximum displacements at some locations, admissible weight, cost, etc.
When the parts are assembled using press-fit process a tube or a shaft is introduced inside of a hub by sliding. Considering the tolerances between tube and hub, associate to the pressing fit process, then a superficial finishing occur between these two surfaces, by the breaking of material superficial peaks associated to its roughness. Depending on the tolerances adjustments, the parts will be hold together. The elastic stress due to parts processing must be considered on further calculation.
This work presents a method to determine the Stress Concentration Factor – Kt from CAE results, applied in the development of mechanical components, based on structural durability, using computer simulation resources and finite element modeling techniques as well.
3.1. Strategy to perform CAE analysis
Six sigma methods have been designed to identify the most influent factors on stress study and define the best CAE
supporting experiments to test the previews hypothesis. A finite element result, based on nonlinear behavior, was used to determine stress in a tube inserted by press-fit in a
hub. This press-fit element has been tested and numerically simulated by the application of bending forces and a von Mises criterion is used to predict yield stress. A range of friction coefficients between the fitted parts were assumed.
Experimental test and CAE press-fit analysis are used to validate analytical results. The model was calibrated using data from friction coefficients, material type, geometry, etc.
3.2. Stress Concentration Factor analysis cascade
In CAE analysis important and relevant factors can be introduced to simulate press-fit, as: material specification:
elastic modulus for inner and outer members, as well as the Poisson’s ratio for both members and tensile stress. The geometric parameters taken into account are: geometric tolerances, radial interference, outer radius for outer
member, inner radius for inner member, thickness, nominal radius at the interference and tolerance grade. The assembly conditions are: sequence of adjustment, no alignment between tube and hub, longitudinal force to
assemble the tube inside the hub and friction coefficient.
3.3. Problem description The cascade proposed on item 3.2 was used to identify the input terms of the CAE model, trying to obtain analytical
results and compare to experimental test. Abaqus (Simulia Software) pre, post-processing and solver were used for non-linear analysis to obtain best results using geometric interference.
Figure 1. Longitudinal interference assembly Figure 2. Longitudinal interference by expansion
Figure 3. Transversal interference by contraction Figure 4. Transversal interference by plasticity interior part

Proceedings of COBEM 2009 20th International Congress of Mechanical Engineering Copyright © 2009 by ABCM November 15-20, 2009, Gramado, RS, Brazil
3.4. Concept – CAE Analysis
The parameters from initial study were identified and applied, as inputs, to the model are: Geometry: tube and hub -> thickness varying from 8.30 and 4.16 mm; Materials: Tube – SAE 1020 / SAE 1035M; Hub – Cast Iron; Loads: Interference between wall thickness varying from 0.300 and 0.150 mm; Concentrated load at outside tube = 8541 N; Load Steps: Step1: Shrinkage and expansion to simulate the press up; Step2: Applying load to simulate bending +
press up results; Boundary Conditions: pinned (displacements = 0 and free rotation on x, y and z directions) on the hub and free at
tube extreme
3.5. CAE model details
Basically one non-linearity type was identified in this model, the radial interference between tube and hub as can be
seen in “Fig. 5”.
Figure 5. d = radial interference Two steps are used on Abaqus software to determine stresses on press-fit structure. ** STEP - 1 ** PERFORM INTERFERENCE FIT BETWEEN TUBE AND HUB *CONTACT INTERFERENCE, SHRINK
SLAVE, MASTER
** STEP - 2 ** LOAD APPLICATION = 8541 N IN Z DIRECTION *CLOAD, OP=NEW
NODE, DIRECTION, LOAD VALUE
3.6. CAE Model
The “Figure 6” shows a viewgraph indicating the boundary conditions.
LoadLoad
TubeTubeDifferentialDifferential
(U1,U2,U3=0)(U1,U2,U3=0)
LoadLoad
TubeTubeDifferentialDifferential
(U1,U2,U3=0)(U1,U2,U3=0)
Figure 6. Model and boundary conditions
dd
Hub
Hub
Tube
Proceedings of COBEM 2009 20th International Congress of Mechanical Engineering Copyright © 2009 by ABCM November 15-20, 2009, Gramado, RS, Brazil
3.7. CAE Model – Elements/Nodes Results
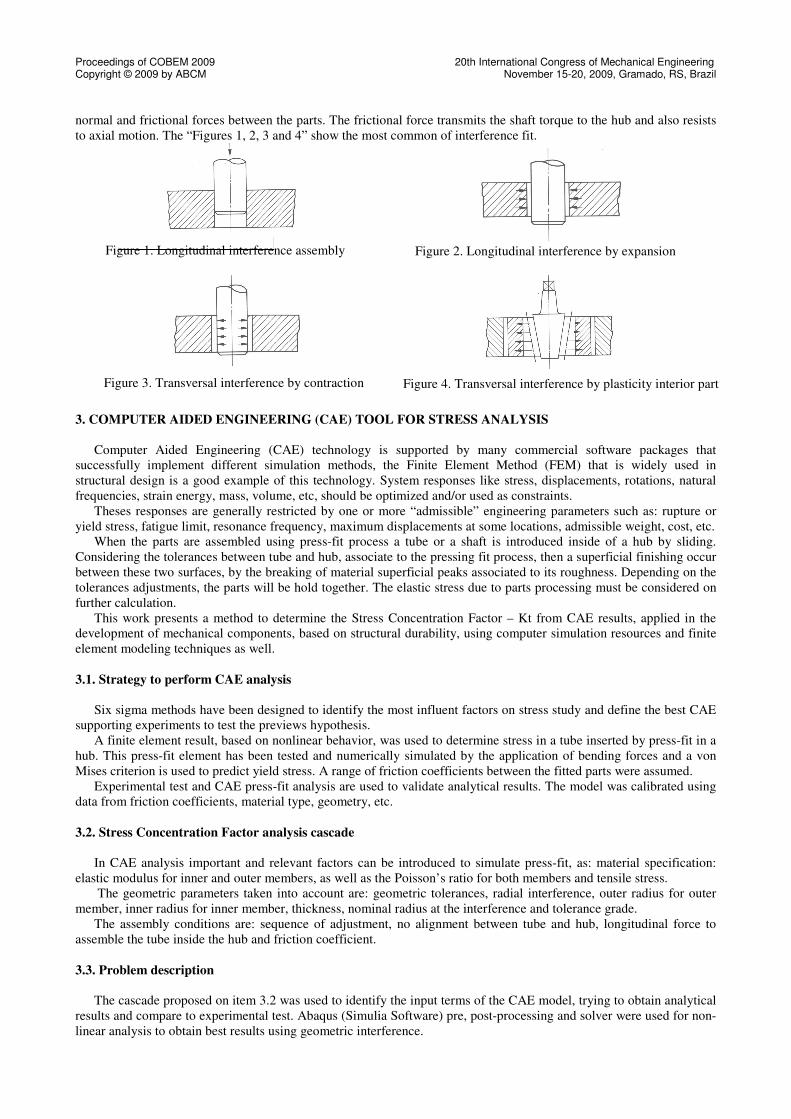
The “Figure 7” indicates the position of the local stresses used on this analysis.
Stress results from inside tube
at the same bending plane
Stress results from inside tube
at the same bending plane
Stress results from outside
tube at the same bending plane
Stress results from outside
tube at the same bending plane
External tube ring to get the
pressure results
External tube ring to get the
pressure results
Stress results from inside tube
at the same bending plane
Stress results from inside tube
at the same bending plane
Stress results from outside
tube at the same bending plane
Stress results from outside
tube at the same bending plane
External tube ring to get the
pressure results
External tube ring to get the
pressure results
Figure 7. Places for local stresses
3.8. Kt Definition
The Kt is the relation between the Maximum Local Stress and the Nominal Stress is presented on equation 1 (σmax =
CAE Max Stress and σnom = Theoretical Stress), “Peterson. (1997)”.
nomkt
σ
σ max=
(1)
3.8.1. σmax from CAE Max Stress
The state of stress in a plane is considered using experimental data of a strain gauges sensing system. The problem is
modeled by an ensemble of tetrahedron and heptahedron finite elements. All displacements on the tube positioning are hold by nodes on the hub (see figure 7) and a concentrated force is applied at the extreme of the piece.
3.8.2. σmax from Theoretical Stress
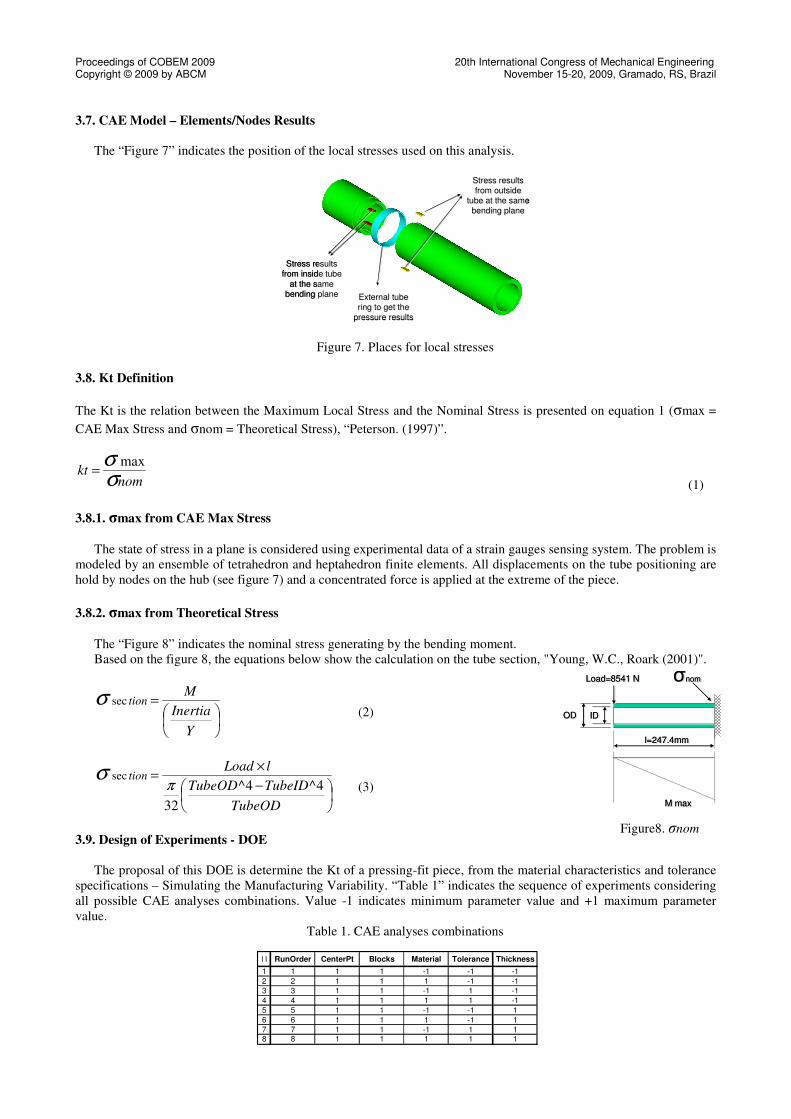
The “Figure 8” indicates the nominal stress generating by the bending moment. Based on the figure 8, the equations below show the calculation on the tube section, "Young, W.C., Roark (2001)".
=
Y
Inertia
Mtionsecσ
(2)
−
×=
TubeOD
TubeIDTubeOD
lLoadtion
4^4^
32
secπ
σ (3)
3.9. Design of Experiments - DOE
The proposal of this DOE is determine the Kt of a pressing-fit piece, from the material characteristics and tolerance
specifications – Simulating the Manufacturing Variability. “Table 1” indicates the sequence of experiments considering all possible CAE analyses combinations. Value -1 indicates minimum parameter value and +1 maximum parameter value.
Table 1. CAE analyses combinations
l=247.4mml=247.4mm
Load=8541 NLoad=8541 N
M maxM max
ODOD IDID
σnomσnom
l=247.4mml=247.4mm
Load=8541 NLoad=8541 N
M maxM max
ODOD IDID
σnomσnom
l l RunOrder CenterPt Blocks Material Tolerance Thickness
1 1 1 1 -1 -1 -1
2 2 1 1 1 -1 -1
3 3 1 1 -1 1 -1
4 4 1 1 1 1 -1
5 5 1 1 -1 -1 1
6 6 1 1 1 -1 1
7 7 1 1 -1 1 18 8 1 1 1 1 1
Figure8. σnom
Proceedings of COBEM 2009 20th International Congress of Mechanical Engineering Copyright © 2009 by ABCM November 15-20, 2009, Gramado, RS, Brazil
Factors that were used in this DOE: Material -> +1= SAE 1035M and -1 = SAE 1020 Interference -> +1 = 0.300 mm and -1 = 0.150 mm Wall Thickness -> +1 = 8.35 mm and -1 = 4.16 mm
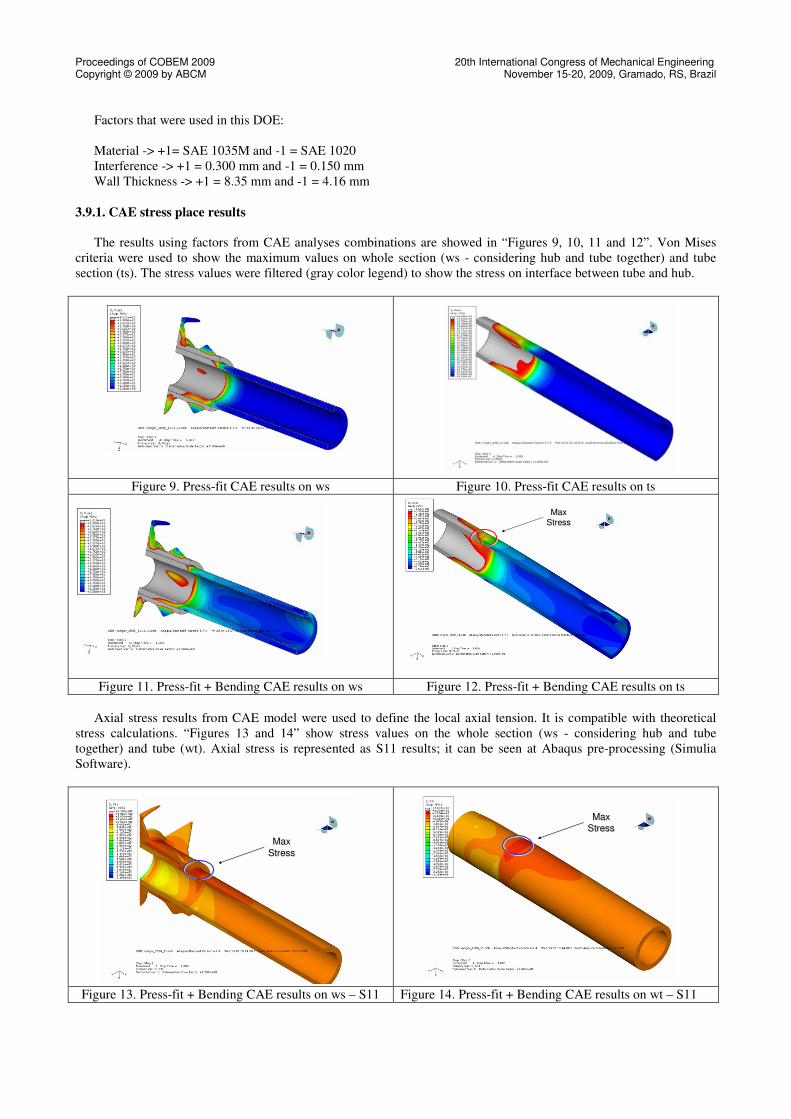
3.9.1. CAE stress place results
The results using factors from CAE analyses combinations are showed in “Figures 9, 10, 11 and 12”. Von Mises
criteria were used to show the maximum values on whole section (ws - considering hub and tube together) and tube section (ts). The stress values were filtered (gray color legend) to show the stress on interface between tube and hub.
Figure 9. Press-fit CAE results on ws Figure 10. Press-fit CAE results on ts
Figure 11. Press-fit + Bending CAE results on ws Figure 12. Press-fit + Bending CAE results on ts Axial stress results from CAE model were used to define the local axial tension. It is compatible with theoretical
stress calculations. “Figures 13 and 14” show stress values on the whole section (ws - considering hub and tube together) and tube (wt). Axial stress is represented as S11 results; it can be seen at Abaqus pre-processing (Simulia Software).
Figure 13. Press-fit + Bending CAE results on ws – S11 Figure 14. Press-fit + Bending CAE results on wt – S11
Max Stress
Max Stress
Max Stress
Max Stress
Max Stress
Max
Stress Max
Stress
Max
Stress
Max
Stress
Max Stress
Max Stress
Max Stress
Proceedings of COBEM 2009 20th International Congress of Mechanical Engineering Copyright © 2009 by ABCM November 15-20, 2009, Gramado, RS, Brazil
3.9.2. Design of Experiments – CAE Results
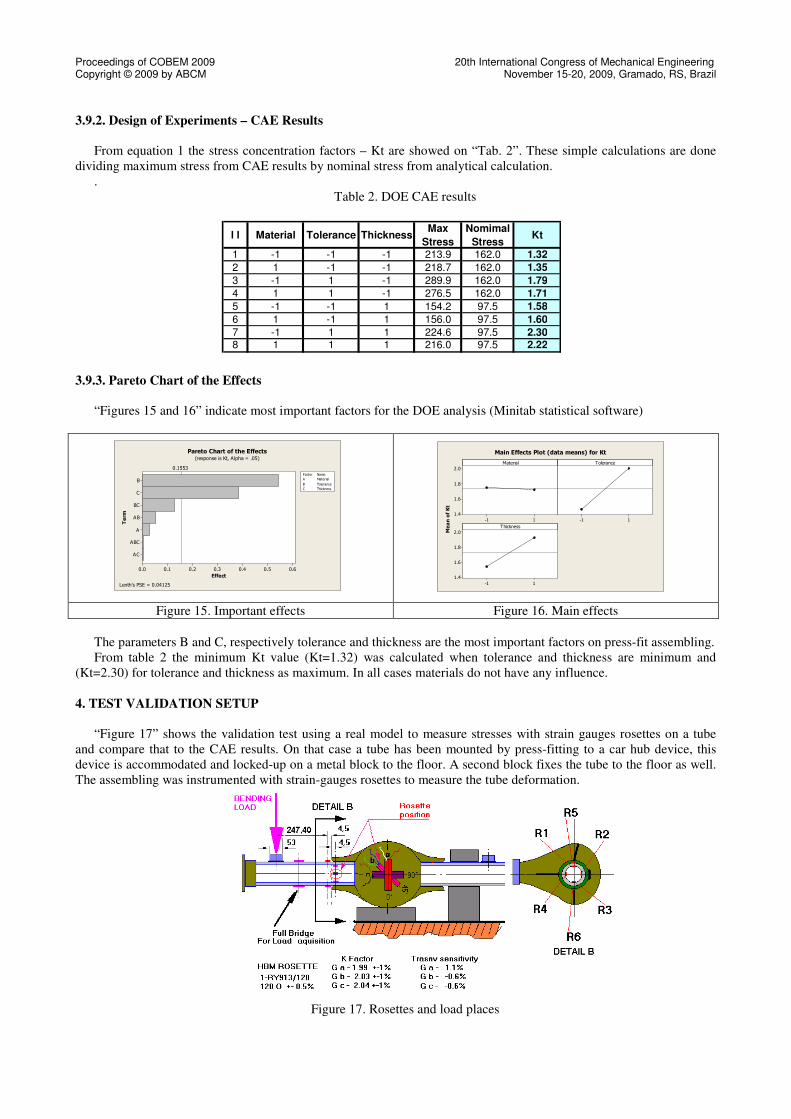
From equation 1 the stress concentration factors – Kt are showed on “Tab. 2”. These simple calculations are done
dividing maximum stress from CAE results by nominal stress from analytical calculation. .
Table 2. DOE CAE results 3.9.3. Pareto Chart of the Effects
“Figures 15 and 16” indicate most important factors for the DOE analysis (Minitab statistical software)
Figure 15. Important effects Figure 16. Main effects The parameters B and C, respectively tolerance and thickness are the most important factors on press-fit assembling. From table 2 the minimum Kt value (Kt=1.32) was calculated when tolerance and thickness are minimum and
(Kt=2.30) for tolerance and thickness as maximum. In all cases materials do not have any influence. 4. TEST VALIDATION SETUP
“Figure 17” shows the validation test using a real model to measure stresses with strain gauges rosettes on a tube and compare that to the CAE results. On that case a tube has been mounted by press-fitting to a car hub device, this device is accommodated and locked-up on a metal block to the floor. A second block fixes the tube to the floor as well. The assembling was instrumented with strain-gauges rosettes to measure the tube deformation.
Figure 17. Rosettes and load places
l l Material Tolerance ThicknessMax
Stress
Nomimal
StressKt
1 -1 -1 -1 213.9 162.0 1.32
2 1 -1 -1 218.7 162.0 1.35
3 -1 1 -1 289.9 162.0 1.79
4 1 1 -1 276.5 162.0 1.71
5 -1 -1 1 154.2 97.5 1.58
6 1 -1 1 156.0 97.5 1.60
7 -1 1 1 224.6 97.5 2.308 1 1 1 216.0 97.5 2.22
Term
Effect
AC
ABC
A
AB
BC
C
B
0.60.50.40.30.20.10.0
0.1553
A Material
B Tolerance
C Thickness
Factor Name
Pareto Chart of the Effects(response is Kt, Alpha = .05)
Lenth's PSE = 0.04125
Mean of Kt
1-1
2.0
1.8
1.6
1.4
1-1
1-1
2.0
1.8
1.6
1.4
Material Tolerance
Thickness
Main Effects Plot (data means) for Kt
Proceedings of COBEM 2009 20th International Congress of Mechanical Engineering Copyright © 2009 by ABCM November 15-20, 2009, Gramado, RS, Brazil
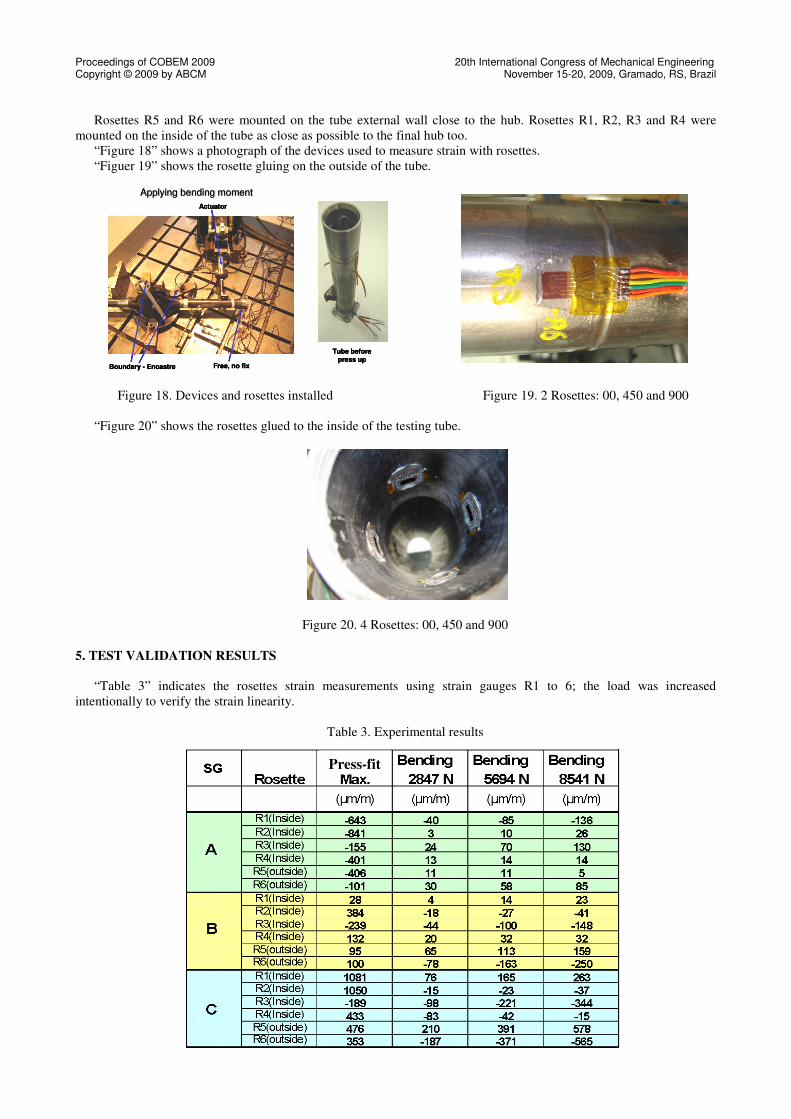
Rosettes R5 and R6 were mounted on the tube external wall close to the hub. Rosettes R1, R2, R3 and R4 were mounted on the inside of the tube as close as possible to the final hub too.
“Figure 18” shows a photograph of the devices used to measure strain with rosettes. “Figuer 19” shows the rosette gluing on the outside of the tube.
Figure 18. Devices and rosettes installed Figure 19. 2 Rosettes: 00, 450 and 900 “Figure 20” shows the rosettes glued to the inside of the testing tube.
Figure 20. 4 Rosettes: 00, 450 and 900 5. TEST VALIDATION RESULTS
“Table 3” indicates the rosettes strain measurements using strain gauges R1 to 6; the load was increased intentionally to verify the strain linearity.
Table 3. Experimental results
Free, no fixBoundary - Encastre
Actuator
Tube before
press up
Applying bending momentApplying bending moment
Free, no fixBoundary - Encastre
Actuator
Free, no fixBoundary - Encastre
Actuator
Tube before
press up
Tube before
press up
Applying bending momentApplying bending moment
Press-fit
Proceedings of COBEM 2009 20th International Congress of Mechanical Engineering Copyright © 2009 by ABCM November 15-20, 2009, Gramado, RS, Brazil
Von Mises
CAE
Von Mises
Rosette
Von Mises
Diff
Stress11
CAE
Stress11
Rosette
Stress11
Diff
Rosette R1 398.87 311.07 28.2% 95.22 278.21 65.8%
Rosette R3 310.28 112.26 176.4% -2.27 -110.33 97.9%
Rosette R5 244.73 223.56 9.5% 193.73 218.18 11.2%
Rosette R6 75.91 44.33 71.2% -40.28 -43.88 8.2%
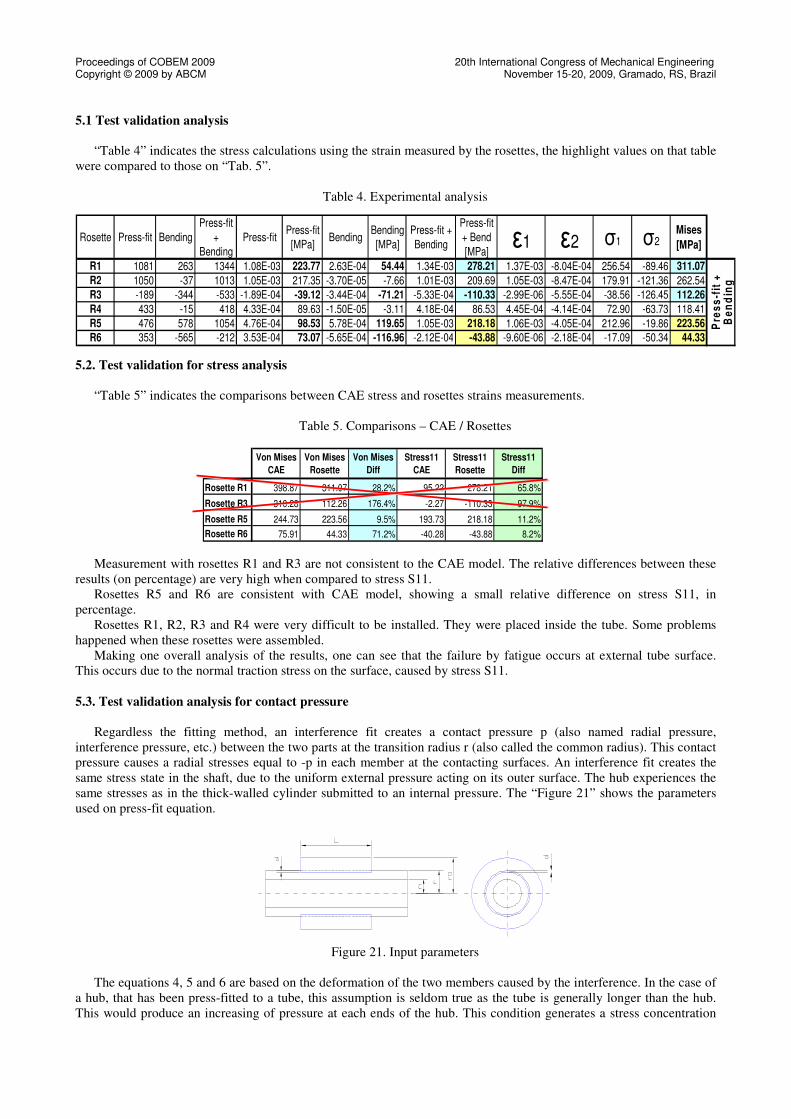
5.1 Test validation analysis
“Table 4” indicates the stress calculations using the strain measured by the rosettes, the highlight values on that table
were compared to those on “Tab. 5”.
Table 4. Experimental analysis 5.2. Test validation for stress analysis
“Table 5” indicates the comparisons between CAE stress and rosettes strains measurements.
Table 5. Comparisons – CAE / Rosettes Measurement with rosettes R1 and R3 are not consistent to the CAE model. The relative differences between these
results (on percentage) are very high when compared to stress S11. Rosettes R5 and R6 are consistent with CAE model, showing a small relative difference on stress S11, in
percentage. Rosettes R1, R2, R3 and R4 were very difficult to be installed. They were placed inside the tube. Some problems
happened when these rosettes were assembled. Making one overall analysis of the results, one can see that the failure by fatigue occurs at external tube surface.
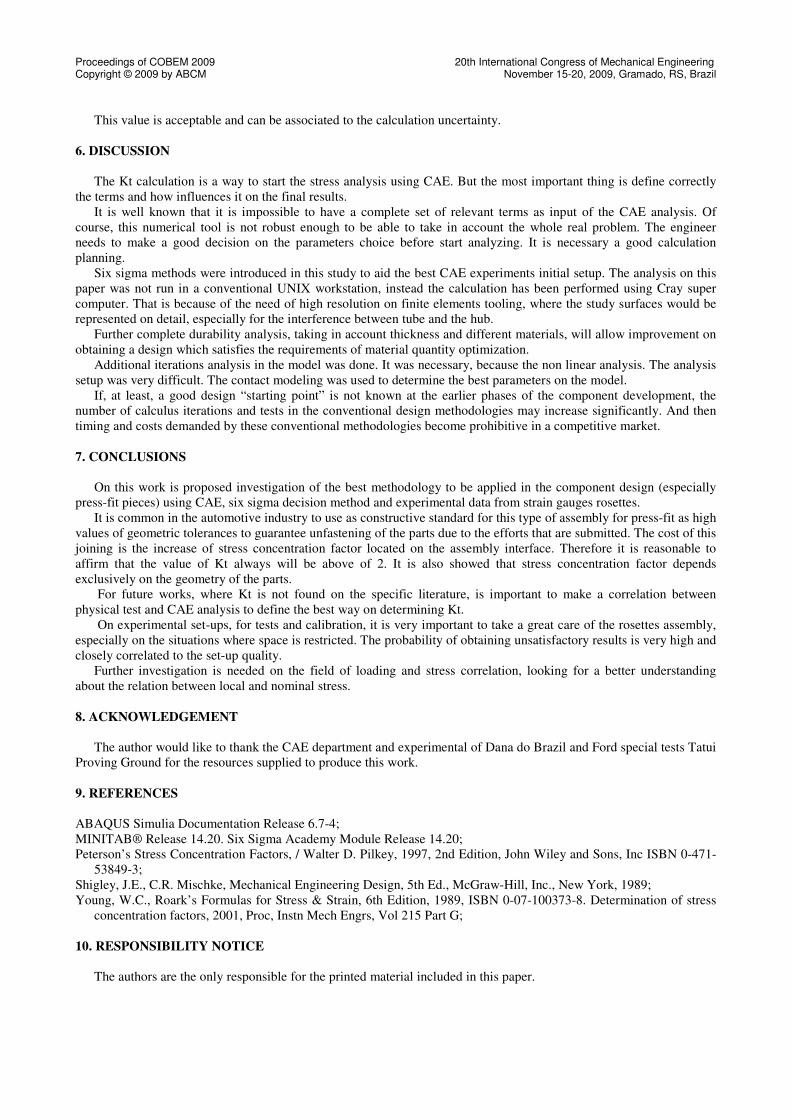
This occurs due to the normal traction stress on the surface, caused by stress S11. 5.3. Test validation analysis for contact pressure
Regardless the fitting method, an interference fit creates a contact pressure p (also named radial pressure,
interference pressure, etc.) between the two parts at the transition radius r (also called the common radius). This contact pressure causes a radial stresses equal to -p in each member at the contacting surfaces. An interference fit creates the same stress state in the shaft, due to the uniform external pressure acting on its outer surface. The hub experiences the same stresses as in the thick-walled cylinder submitted to an internal pressure. The “Figure 21” shows the parameters used on press-fit equation.
Figure 21. Input parameters
The equations 4, 5 and 6 are based on the deformation of the two members caused by the interference. In the case of
a hub, that has been press-fitted to a tube, this assumption is seldom true as the tube is generally longer than the hub. This would produce an increasing of pressure at each ends of the hub. This condition generates a stress concentration
Rosette Press-fit Bending
Press-fit
+
Bending
Press-fitPress-fit
[MPa]Bending
Bending
[MPa]
Press-fit +
Bending
Press-fit
+ Bend
[MPa]ε1 ε2 σ1 σ2
Mises
[MPa]
R1 1081 263 1344 1.08E-03 223.77 2.63E-04 54.44 1.34E-03 278.21 1.37E-03 -8.04E-04 256.54 -89.46 311.07
R2 1050 -37 1013 1.05E-03 217.35 -3.70E-05 -7.66 1.01E-03 209.69 1.05E-03 -8.47E-04 179.91 -121.36 262.54
R3 -189 -344 -533 -1.89E-04 -39.12 -3.44E-04 -71.21 -5.33E-04 -110.33 -2.99E-06 -5.55E-04 -38.56 -126.45 112.26
R4 433 -15 418 4.33E-04 89.63 -1.50E-05 -3.11 4.18E-04 86.53 4.45E-04 -4.14E-04 72.90 -63.73 118.41
R5 476 578 1054 4.76E-04 98.53 5.78E-04 119.65 1.05E-03 218.18 1.06E-03 -4.05E-04 212.96 -19.86 223.56
R6 353 -565 -212 3.53E-04 73.07 -5.65E-04 -116.96 -2.12E-04 -43.88 -9.60E-06 -2.18E-04 -17.09 -50.34 44.33
Pre
ss
-fit
+
Be
nd
ing

Proceedings of COBEM 2009 20th International Congress of Mechanical Engineering Copyright © 2009 by ABCM November 15-20, 2009, Gramado, RS, Brazil
factor on the tube that must be investigated, whom is the main objective of this work. The value of the stress concentration factor depends upon on the contact pressure and the design of the hub, “Shigley et al. (1989)”.
5.3.1. Interference Pressure
p = Contact pressure
−
−
++
+
−
+
=
12^2^
2^2^
12
2^2^
2^2^
2n
rir
rir
E
rn
rro
rro
E
r
dp
(4)
di = Change of the outer radius of the inner member
−
−
+×−= 1
2^2^
2^2^
1n
rir
rir
E
rpdi (5)
do = Change of the inner radius of the outer member
+
−
+×= 2
2^2^
2^2^
2n
rro
rro
E
rpdi (6)
The "Table 6" indicates the ring pressure on the external tube calculation using "Equations (4, 5 and 6)".
Table 6. Interference pressure results calculations Entries E1 = Elastic Modulus for the inner member 2.10E+05 MPa
E2 = Elastic Modulus for the outer member 1.70E+05 MPan1 = Poisson's Ratio for the inner member 0.30 mmn2 = Poisson's Ratio for the outer member 0.30 mmm = Coefficient of friction - 0.12-0.15 for hydraulically expanded hubs and 0.15-0.20 for shrink or press fit hubs 0.25d = Radial Interference 0.30 mmL = Contact length 105.00 mmr = Nominal radius at the interference 35.00 mmro = Outer radius of the outer member 42.00 mmri = Inner radius of the inner member - ri = 0 for a solid member 26.70 mm
Answers p = Contact pressure, Interference Pressure 168.15 MPad = Radial Interferencedi = Change of the outer radius of the inner member -0.0976 mmdo = Change of the inner radius of the outer member 0.2024 mm
5.3.2. External tube ring pressure results from CAE results
“Fig. 21” shows annular pressure results at external ring tube.
Figure 21. Annular pressure results Comparing CAE calculation for the average contact pressure for an external ring of the tube (157.38 MPa) and the
analytical calculation done above (168.15 MPa) (presented on “Tab. 6”) the difference is less than 10% (6.40 %).
Proceedings of COBEM 2009 20th International Congress of Mechanical Engineering Copyright © 2009 by ABCM November 15-20, 2009, Gramado, RS, Brazil
This value is acceptable and can be associated to the calculation uncertainty.
6. DISCUSSION
The Kt calculation is a way to start the stress analysis using CAE. But the most important thing is define correctly
the terms and how influences it on the final results. It is well known that it is impossible to have a complete set of relevant terms as input of the CAE analysis. Of
course, this numerical tool is not robust enough to be able to take in account the whole real problem. The engineer needs to make a good decision on the parameters choice before start analyzing. It is necessary a good calculation planning.
Six sigma methods were introduced in this study to aid the best CAE experiments initial setup. The analysis on this paper was not run in a conventional UNIX workstation, instead the calculation has been performed using Cray super computer. That is because of the need of high resolution on finite elements tooling, where the study surfaces would be represented on detail, especially for the interference between tube and the hub.
Further complete durability analysis, taking in account thickness and different materials, will allow improvement on obtaining a design which satisfies the requirements of material quantity optimization.
Additional iterations analysis in the model was done. It was necessary, because the non linear analysis. The analysis setup was very difficult. The contact modeling was used to determine the best parameters on the model.
If, at least, a good design “starting point” is not known at the earlier phases of the component development, the number of calculus iterations and tests in the conventional design methodologies may increase significantly. And then timing and costs demanded by these conventional methodologies become prohibitive in a competitive market.
7. CONCLUSIONS
On this work is proposed investigation of the best methodology to be applied in the component design (especially
press-fit pieces) using CAE, six sigma decision method and experimental data from strain gauges rosettes. It is common in the automotive industry to use as constructive standard for this type of assembly for press-fit as high
values of geometric tolerances to guarantee unfastening of the parts due to the efforts that are submitted. The cost of this joining is the increase of stress concentration factor located on the assembly interface. Therefore it is reasonable to affirm that the value of Kt always will be above of 2. It is also showed that stress concentration factor depends exclusively on the geometry of the parts.
For future works, where Kt is not found on the specific literature, is important to make a correlation between physical test and CAE analysis to define the best way on determining Kt.
On experimental set-ups, for tests and calibration, it is very important to take a great care of the rosettes assembly, especially on the situations where space is restricted. The probability of obtaining unsatisfactory results is very high and closely correlated to the set-up quality.
Further investigation is needed on the field of loading and stress correlation, looking for a better understanding about the relation between local and nominal stress.
8. ACKNOWLEDGEMENT
The author would like to thank the CAE department and experimental of Dana do Brazil and Ford special tests Tatui
Proving Ground for the resources supplied to produce this work. 9. REFERENCES
ABAQUS Simulia Documentation Release 6.7-4; MINITAB® Release 14.20. Six Sigma Academy Module Release 14.20; Peterson’s Stress Concentration Factors, / Walter D. Pilkey, 1997, 2nd Edition, John Wiley and Sons, Inc ISBN 0-471-
53849-3; Shigley, J.E., C.R. Mischke, Mechanical Engineering Design, 5th Ed., McGraw-Hill, Inc., New York, 1989; Young, W.C., Roark’s Formulas for Stress & Strain, 6th Edition, 1989, ISBN 0-07-100373-8. Determination of stress
concentration factors, 2001, Proc, Instn Mech Engrs, Vol 215 Part G; 10. RESPONSIBILITY NOTICE
The authors are the only responsible for the printed material included in this paper.