Embed Size (px)
Citation preview

Using Financial Statement Models for Valuation
MGT 4850
Spring 2008
University of Lethbridge

Corporate Valuation
• Building Pro forma model
• Calculating the relevant free cash flows
• Calculating the cost of capital for the free cash flows
• Determining the terminal value of the firm
• Properly discounting the free cash flows
• Sensitivity analysis
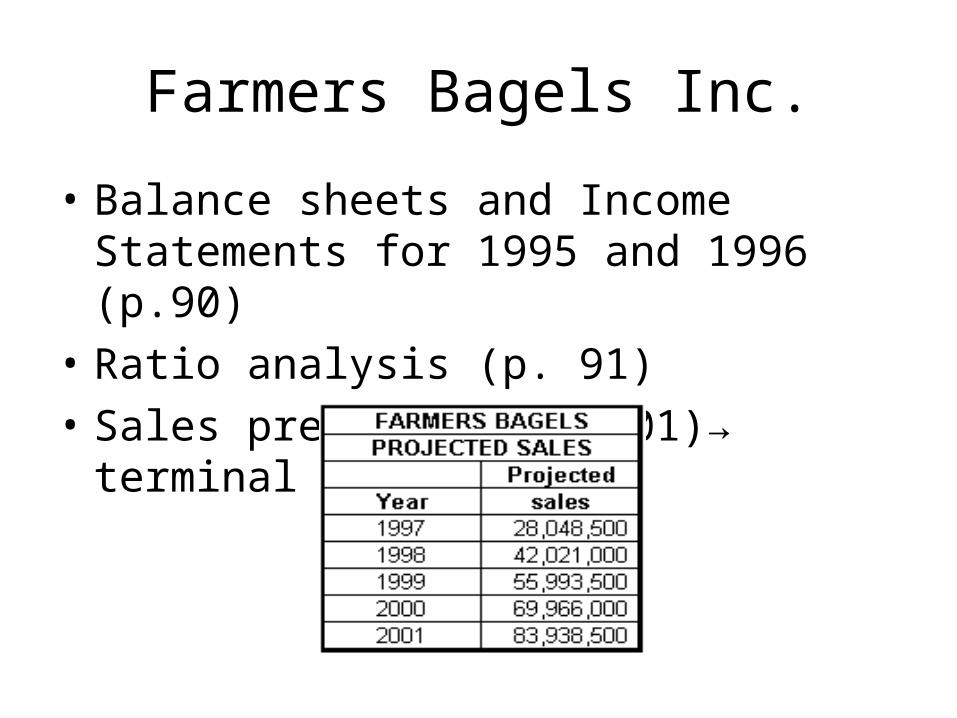
Farmers Bagels Inc.
• Balance sheets and Income Statements for 1995 and 1996 (p.90)
• Ratio analysis (p. 91)
• Sales predictions (2001)→ terminal value

Model Assumptions
• Drop the distinction between product sales and other income
• Cost of goods sold -40%
• Selling, general and administrative expenses (-1%/y)
• Income tax rate 41.5%
• Cash cushion-declining proportion of sales
• Accounts receivable – 22% of sales

Model Assumptions II
• Inventory 5% of sales• Property and equipment at cost 70% in ‘96 to
40% in 2001.• Straight line deprec. at 10% of prop. Cost• Accounts payable and accrued expenses +1%/y
till 20%• Income tax payable 25%• Other curr. liabilities 1% of sales• No dividends, no new equity (debt is the plug).

MODEL
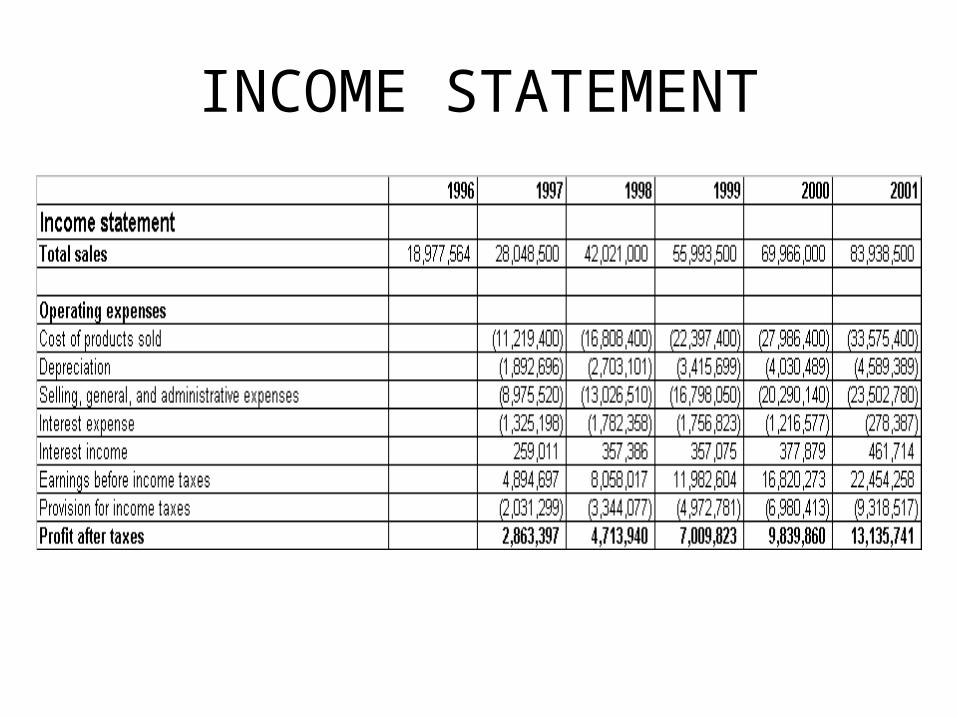
INCOME STATEMENT

Balance Sheet

Negative Debt
• If total value of minimum cash balance plus all other assets is greater than current liabilities the company needs debt.
• [Cash ratio]*Sales+Acc. Rec. + Inventory + Prepaid exp. + Net property and equipm. – Curr. Liab. – Com. Stock – Ret. Earn. < 0
then debt is set at 0
p.94 pro forma model

Deriving the FCF (p.90)
• Positive profit, negative cashflows
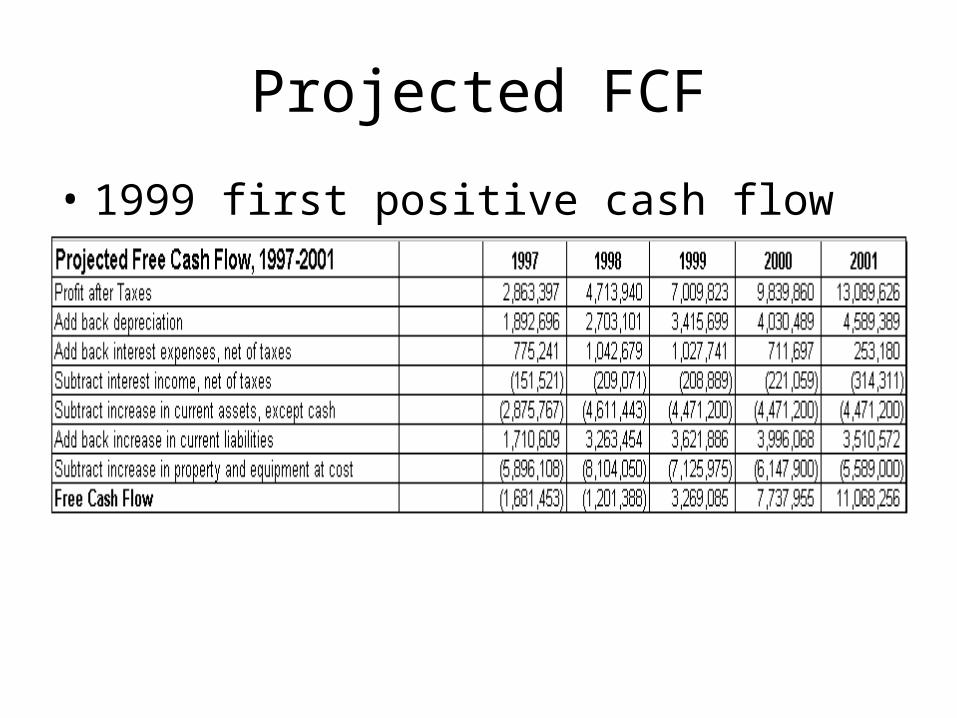
Projected FCF
• 1999 first positive cash flow (p.97)

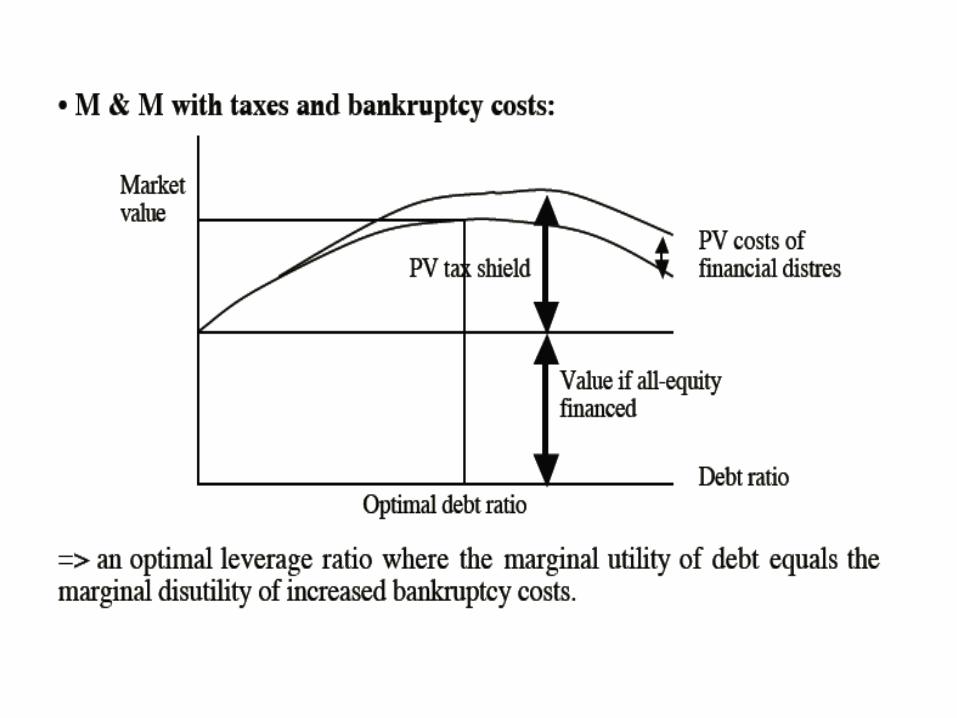
Proposition one

Agency costs

As
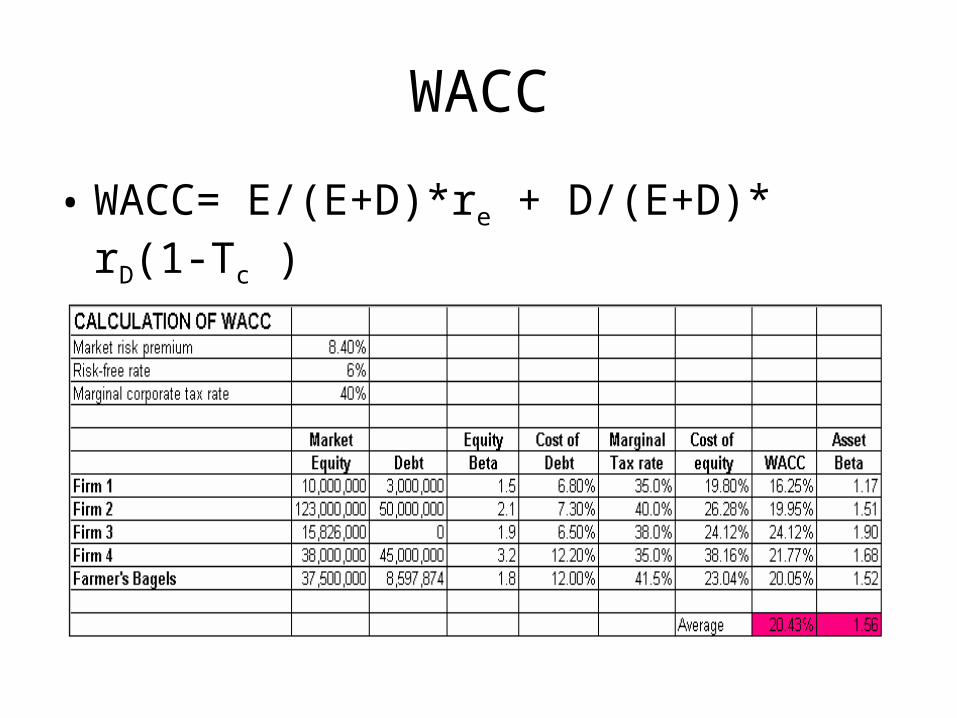
WACC
• WACC= E/(E+D)*re + D/(E+D)* rD(1-Tc )
• CAPM based averages for the industry

Industry Average WACC 20.43% and terminal value
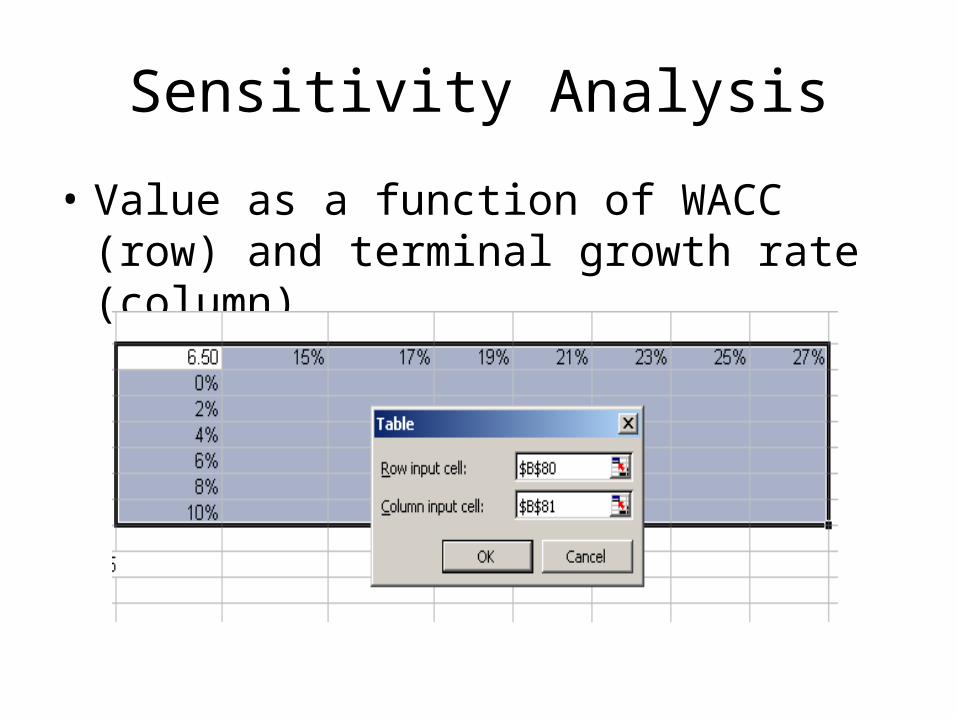
Sensitivity Analysis
• Value as a function of WACC (row) and terminal growth rate (column)

Sensitivity Analysis
• Share price is calculated as a unction of two variables

Terminal Value Proxies