Embed Size (px)
Citation preview

Using Extended Surface Air Filters in Heating Ventilation and AirConditioning Systems: Reducing Utility and Maintenance Costs while
Benefiting the Environment
Michael .J. Chimack, Energy Resources Center, University ofillinois at ChicagoDave Sellers, PortlandEnergy Conservation, Inc.
ABSTRACT
Air filter manufacturers have begun target marketing premium air filters that providevery high particle capture efficiencies with very low initial static pressure drops. This isaccomplished with proprietary filter designs incorporating at least twice the media surfacearea of traditional filters.1 The increased media reduces the initial pressure drop ofair filterswhile dramatically increasing their dust holding capacity. In addition, their useful lives areextended and prefilter use may be eliminated.
Physical principles governing airflow in fan systems predict available energy savingsfrom using premium air filters. This energy savings may offset the additional cost of thepremium filters. In fact, premium filter investments can payback in six months to three yearsdepending on airflow and number of hours of fan operation. Additional benefits of usingpremium air filters include longer filter life, lower installation and disposal costs,elimination of prefilters and the ability to increase effective filter efficiency in buildingswithout reducing ventilation effectiveness.
A case study was conducted in an office building with two nearly identical VAVsystems to determine if premium air filters are good investments for building owners andmanagers. This paper presents performance characteristics including fan energy use andstatic pressure drops across both premium and typical air filters. The performance data wereused to test the validity of one manufacturer’s claim concerning their premium filters, fanenergy reduction and improved indoor air quality. Results of this study demonstratedpurchase and use ofthe premium air filters might be good investments for building ownersand managers.
Introduction
Heating, ventilation, and air conditioning (HVAC) systems are used to controltemperature, humidity and promote good indoor air quality. Air filters are an integral part ofan HVAC system with cleanliness and ventilation requirements determining the number andtype of air filters needed. Since air filters capture particulates, their life is finite and theymust be replaced periodically. The air filter’s useful life depends on it’s type and size as wellas the installed environment. The maintenance costs associated with the purchase,installation and disposal of air filters are generally fixed. Unfortunately, there is a hiddencost associated with air filter use that is more difficult to quantify and is often overlooked.This is the cost ofthe energy required to move air across the filter.
When compared to earlier air filter manufacturing practices.
Commercial Buildings: Technologies, Design, and Performance Analysis - 3.77

Whether filters are manufactured from paper, fiberglass or synthetic materials, theycause a pressure drop in the ventilation system that must be overcome to deliver adequateventilation to a space. This pressure drop increases as the filter loads with contaminants.Thus, the energy required to maintain the ventilation rate increases over the filter life.
The purpose of this case study was to determine whether reducing an HVACsystem’s total fan static pressure, by using air filters with lower initial static pressure dropsthan industry-typical air filters, would lower the energy consumed by fan motors. In addition,this study investigated the purported benefits of premium air filters including extended life,air quality improvement and subsequent reductions offixed maintenance costs.
The study investigated the use of premium air filters in variable air volume (VAV)fan systems. Two nearly identical VAV systems were selected. One system, the controlgroup, operated with standard bag-type air filters. The other system operated with premiumbag-type air filters. The manufacturers ofthe air filters were Quality Filters, Inc. and Viledonrespectively. Viledon claims their filters save energy since they have very low initial staticpressure drops and consequently lower average static pressure drops over the life of thefilter. In theory, this is true. In practice, however, if total fan static pressure is decreased fromthe baseline design, power consumption could actually increase.2
Background
Air handling units (AHUs) are used to heat and cool occupied spaces in commercial,institutional and in most industrial markets. AHUs are designed and built primarily for theventilation requirements of a space. Specific system pressurization and required airflowdetermine the size of fans, motors, coils, air filters and ductwork. Figure 1 below shows aschematic ofa typical air handling unit.
System Pressurization
Supply fans convert rotational kinetic energy from a motor to a combination of staticpressure and velocity pressure in a duct system. Total fan pressure is the sum of staticpressure and velocity pressure. Fans can be classified as either an axialfan , where air flowsparallel to the fan shaft, or a centrifugalfan, where air flows radially through the fan wheel.
Static pressure is a measure of the amount of potential energy (potential flow) withina ventilation system. Conversely, velocity pressure is a measure of the airflow (kineticenergy) within a ventilation system. They are measured in inches of water gauge eitherabove or below atmospheric pressure.3 Total system pressure is obtained by adding themagnitudes of static and velocity pressure anywhere in the ventilation system.
2 In a constant volume system, if system pressure was decreased, air volume would increase resulting
in greater power consumption by the motor. The fan would have to be resheaved to keep airflow and powerbaselined.
One pound per square inch equals 27.7 inches ofwater.
3.78

Return Fan
4ef Air
Outdoor~
Relief AirDamper
Figure 1. Ventilation System Schematic
Air from ss
Pressurein Building
±
System Curves and Fan Curves
Each component in a ventilation system exhibits a pressure drop as air is movedacross it. The sum of all these pressure drops (including friction losses and ductworkpressure drops) make up the total pressure that must be supplied by the fan. For any fixedsystem, the relationship between airflow and system pressure follows a quadraticrelationship as presented in equation 1.
P k * Q2 Equation 1
WhereP = system pressure (inches of water)k = constant based on measured airflow and pressureQ = system flow (cubic feet per minute)
If you reduce the air flow by a factor of one half, the pressure required to producethat airflow in the system will be one quarter of what was required at full airflow. Ifyou plotthe results ofthis equation, the resulting parabola is called a system characteristic curve. Anychange to the system (moving a balance damper, VAV terminal throttling, filter loading,
BypassDamper
(~1
Supply Fan
OutdoorAir Damper
Air
Air Mixing System
to spaces
Filter Heating CoolingCoil Coil
Commercial Buildings: Technologies, Design, and Performance Analysis - 3.79

etc.) will change this flow to pressure drop relationship and therefore will change the systemcurve. System curves, when combined with other information such as the coolingrequirements for a space, answer the questions, “how much air does the space require,” and“how much pressure will the fan need to produce to deliver this air in a given system?”
Conversely, fan curves answer the question, “how much air can the system provide.”All fans are tested in an apparatus similar to the one depicted in Figure 2 below. Fans aretested from Blocked Tight Static Pressure (BTSP) to Wide Open Cubic Feet Per Minute(WOCFM) at different fan speeds. This is accomplished by blocking the duct with athrottling device and measuring pressure and horsepower consumption, which establishesthe BTSP point, then moving the throttling device away from the duct exit in a series ofiterations while continuing to measure pressure and horsepower. This is continued until thethrottling device is removed from the test duct, which establishes the WOCFM point. Whenfan tests are completed, fan performance curves are generated.
Operating Point
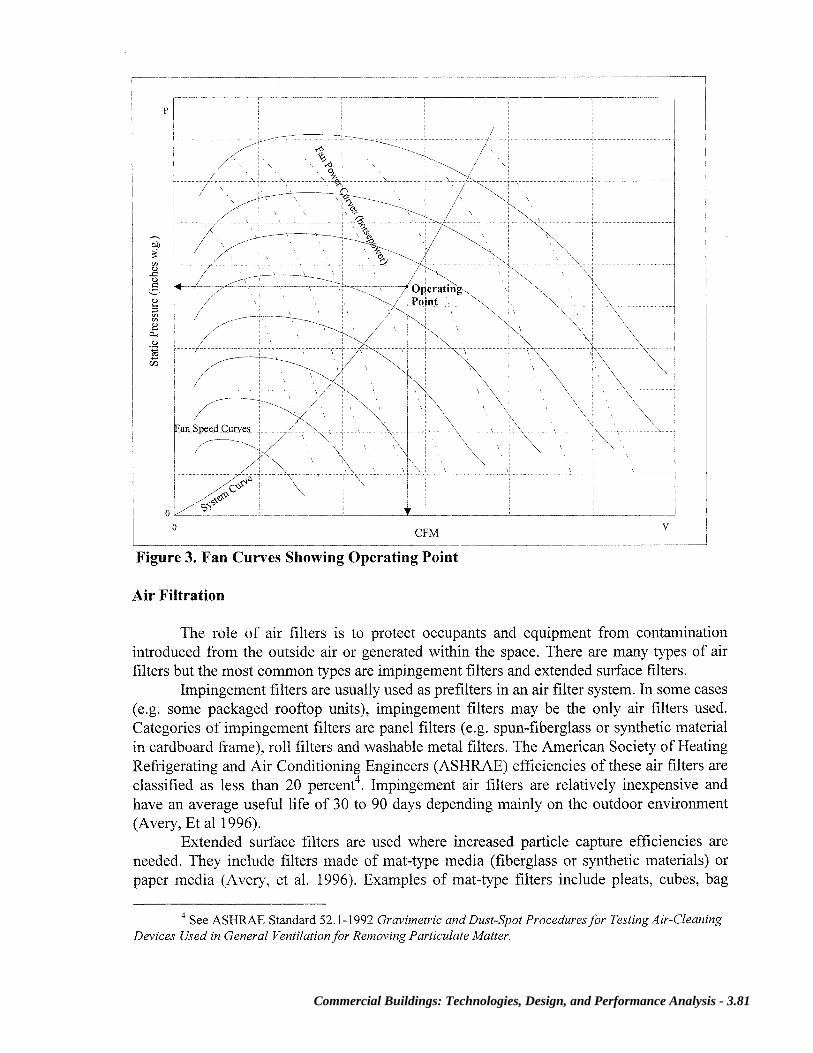
Superimposing the fan curves onto the system resistance curve yields the operatingpoint. In practice, to determine where the system curve intersects the fan curve, one mustaccurately determine the total airflow ofthe fan with a Pitot-tube traverse, a flowhood, or ananemometer, and the speed of the fan with a stroboscope or tachometer. Where the airflowintersects with the fan speed, exists the operating point. The operating point determines therequired motor horsepower for the system. Figure 3 shows a sample family of fanperformance curves with a system curve and depicts an example of an operating point.
The operating point is not constant. It changes as the pressure/flow characteristics ofthe system change. For example, on a hot and humid day the cooling coil would be wetted asthe coil condenses moisture out of the supply air. The pressure drop across the coil wouldincrease and the system characteristic curve and operating point would change. This isknown as “riding the fan curve.” This same phenomenon occurs as filters capturecontaminants from the air. Most real fan systems actually operate on a family of systemcurves that are related to the variations in system pressure requirements associated with theseoperational changes.
Figure 2. Fan Test Stand
10D
Air Pitot Tube ThrottlingStraightener Traverse Device
Fan onPoint
Dynamometer
3.80
C,)5)5)
5)
C,)C/C5)
0/C5)
5/3
0 _____
0
The role of air filters is to protect occupants and equipment from contaminationintroduced from the outside air or generated within the space. There are many types of airfilters but the most common types are impingement filters and extended surface filters.
Impingement filters are usually used as prefilters in an air filter system. In some cases(e.g. some packaged rooftop units), impingement filters may be the only air filters used.Categories of impingement filters are panel filters (e.g. spun-fiberglass or synthetic materialin cardboard frame), roll filters and washable metal filters. The American Society ofHeatingRefrigerating and Air Conditioning Engineers (ASHRAE) efficiencies ofthese air filters areclassified as less than 20 percent4. Impingement air filters are relatively inexpensive andhave an average useful life of 30 to 90 days depending mainly on the outdoor environment(Avery, Et al 1996).
Extended surface filters are used where increased particle capture efficiencies areneeded. They include filters made of mat-type media (fiberglass or synthetic materials) orpaper media (Avery, et al. 1996). Examples of mat-type filters include pleats, cubes, bag
~See ASHRAE Standard 52.1-1992 Gravimetric and Dust-Spot Proceduresfor Testing Air-CleaningDevices Used in General Ventilationfor RemovingParticulate Matter.
Figure 3. Fan Curves Showing Operating Point
Air Filtration
Commercial Buildings: Technologies, Design, and Performance Analysis - 3.81

filters and rigid cell filters. Paper media filters are typically pleated-type filters withcorrugated separators or close-pleated filter designs. ASHRAE efficiencies of extendedsurface filters range from 30 to 98 percent. Extended surface filters are more costly thanprefilters, however, their life is typically four to ten times that ofa prefilter.
Building owners/managers who use extended surface air filters in their air handlingunits usually place an impingement filter upstream to protect the more expensive final filter.In these instances, the prefilters are used to extend the life of the higher efficiency finalfilters. Prefilters capture coarse dusts and allow the final filter to be exposed to smallerconcentrations offiner dusts. The lives ofprefilters and final filters are typically determinedby comparing the measured static pressure drop across the air filters at rated airflow,5 to avariety of standards. Some ofthese standards include pressure drops selected by the designengineer who specified the equipment, air filter manufacturers’ or final pressure dropsdetermined by field experience. Typically, the manufacturer recommended final pressuredrops are related to the structural capacity of the filter, while designers often take the over-allcapabilities of the air handling system into account in addition to the manufacturersrecommendations. The facilities engineers try to maintain good indoor air quality yet areoften pressured to extend filter life so air filter budgets can be minimized.
Some air filter manufacturers are marketing high efficiency extended surface airfilters under the trade names LUWA, Viledon, Optiflow, American Air Filter and others thatexhibit extremely low initial static pressure drops. They claim these premium filters will lasttwo to three times longer than typical air filters and will supply the lowest initial staticpressure drop in the industry. If true, the life cycle costs6 of these air filters could be lowerthan typical extended surface air filter types. Use of these filters could also make the airhandling equipment in a facility more sustainable due to the reduction in size of the filterresource and waste stream.
Air Filter Efficiency
Historically, the ASHRAE standard for measuring the efficiency and arrestance of airfilters has been ASHRAE 52.l.~ Air filter manufacturers are allowed to advertise“ASHRAE” efficiencies if they have had their air filters tested in an ASHRAE air filter testduct in accordance with the testing procedures outlined in ASHRAE 52.1-1992. ASHRAEallows the nomenclature “less than 20 percent ASHRAE efficiency” to be used for anyuntested filter. This reference is usually used for prefilters.
While Standard 52.1 deals with average efficiencies, the next generation of air filtertesting, Standard 52.2-1999, addresses fractional efficiency tests where air filters are testedover a spectrum of particle sizes. This standard is new, however, it will dramatically increasethe comparative nature of air filter specifications once it is implemented throughout the airfiltration market.
Even the most efficient air filter is suspect in a system with a poorly maintained airfilter housing. The integrity of the air filter housing is as important as the selection ofthe airfilters themselves since air always follows the path of least resistance. It is impossible to
Typically 400-5 00 feetper minute.
6 Including first cost, maintenance costs, disposal costs and cost of moving the air through the filter.
Efficiency refers to the ASHRAE Average Dust Spot Efficiency.
3.82

maintain good indoor air quality with a poorly designed or poorly maintained set ofair filterframes. In addition, it is very likely the air filters will not perform at the level identified intheir respective testing report.
Case Study
Since air filters are maintenance items and must be replaced periodically (eliminatingthem is not an option), there is a potential to save fan energy by replacing existing air filterswith high efficiency, low initial static pressure drop air filters (premium filters). The purposeof this case study8 was to validate energy savings professed by air filter manufacturers andprovide life cycle economic analyses concerning the use of premium air filters bycommercial and institutional end users. This case study was conducted at a commercialbuilding in Hoffman Estates, Illinois that had two variable air volume fan systems.
The air filters used for comparative purposes in this study are listed in Table 1 below,which contains all pertinent air filter performance data. These filters were selected by theend user and were not exclusive to the market. The Viledon air filter represents a final bag-type air filter exhibiting uniquely low initial static pressure drop. This is considered a high-end productwith unit costs equal to two to four times that of a typical bag-type air filter.
The Quality air filters represent a generic (standard) final bag-type air filter whoseconstruction is typical of several other U.S. manufacturers. They are consideredrepresentative bag-type air filter products (Hardt 1998).
VAV System Description
The building’s air handling systems, labeled AHU-1 and AHU-2, were located on thefifth floor of the building. These units supplied 100 percent of the heating and coolingrequired by the building. The fan systems operated on the following schedule:
Monday-Friday: 6:00 am to 7:00 pmSaturday: 7:00 am to 3:00 pmSunday: As needed for limited scheduled occupancy.
AHU-1 and AHU-2 contained one Joy Series 1000 Axivane Fan Model 48-26-1770driven by a Reliance 125hp motor. Each AHU supplied 70,000 CFM against 6.5 inches ofstatic pressure (design) to their half the building and had a two-stage filtration system. Theprefilters used in the study were 40-24x24 inch 3-ply polyester panel air filters. These weregraduated density polyester filters sewn around a wire ring with an estimated AverageASHRAE Dust Spot Efficiency of 25-30%. Identical prefilters were used in both air-handling units.
Downstream of the prefilters in AHU-1 were 40-24x24xl5 inch, 12-pocket 65% airfilters manufactured by Quality Filters, Inc. of Robertsdale, Alabama. Downstream of theprefilters in AHU-2 were 40-24x24x22 inch T60 air filters manufactured by Viledon Air
Funded by the Illinois Department of Commerce and Community Affairs (DCCA) Bureau ofEnergyand Recycling.
Commercial Buildings: Technologies, Design, and Performance Analysis - 3.83

Filtration Division, Chelmsford, Massachusetts. Both AHUs were balanced prior to the casestudy. Airfiows and motor horsepower were verified prior to the start of the study andcompared with data from the test and balance reports.
Table 1. Case Study Air Filter Specifications
Theoretical Predictions
The manufacturers ofthe Viledon air filters predicted a filter life of at least two timesthat of typical air filters in any given application (Fries 1998). Based on that assumption, thefollowing equation was derived that predicts the theoretical electrical demand savingsbetween two identical fan systems containing different air filters.
kW =CFM*(SP -SPa)
8520 * SEEquation 2
Where:kW = reduced electric demand (kilowatts)CFM = volumetric airflow in cubic feet per minuteSP~ = average pressure drop across the premium air filter over the air filter’s lifeSP~ = average pressure drop across the typical air filter over the air filter’s life8520 = conversion constantSE = system efficiency (motor efficiency * fan efficiency * drive efficiency)
Trade name/Manufacturer Viledon/ Viledon (USA) Quality/Quality Filters, Inc.(USA)
Air Filter Model T60 65% ASHRAE Dust SpotEfficiency
Air Filter Size 24x24x26 8 pocket 24x24x15 12 pocket bagASHRAE Dust Spot
Efficiency60% 65%
Initial Fractional Efficiency 98% on 2 micron particles Not AvailableInitial Cost(S) $106 $39.50Average Life (months) 24 12Initial Pressure drop at 2000
CFM_(in._w.g.)0.18 0.40
Benefits • Immediate High Efficiency• Non-Shedding Media• High Particulate Retention• Moisture Resistant• Structural Integrity• Particle Retention• 100% Synthetic Material• Long ServiceLife• Will Not Leak up to 2.4 in. w.g.
• Non-Shedding Media• Moisture Resistant• Inexpensive to produce• 100% Synthetic Material
Disadvantages • Expensive First Cost • Prone to Racking• Prone to Leaking• Bag/Frame Separation
3.84

The motor and fan efficiencies were estimated at 80 percent,9 while the driveefficiency was 100 percent (direct drive). Table 2 below demonstrates the theoretical savingsby using the Viledon air filters over a two-year timeframe accounting for energy to move theair through the air filter exclusively. The Quality air filters were expected to last one yearbased on past air filter longevity at the building (Cowgill 1998).
Table 2. Predicted Energy Savings Using Viledon Air Filters (Fries, 1998) 10
Given: CFM=70,000
Electricy Cost-CornEd Rate 6T
Quality Viledon
Final Filter Final FilterUnits 12P 65% Bag T60
Operating Life months 12 24No. of Replacements n/a 2 1Number of Full Size Filters n/a 80 40
Initial Static Pressure Drop (“w.g.) 0.4 0.17Final Static Pressure Drop (“w.g.) 1.25Average Static PressureDrop (“w.g.) 0.83 0.59Total Fan Operation Time hours 7,091 7,091Average Power Consumption kW 10.59 7.51Total Energy Use kwh 75,104 53,255Energy Cost $ $3,084 $2,187
Demand Cost $ $1,546 $ 1,096
Theoretical Savings: Quality Viledon SavingsTotal Energy Usage (kwh)Total Energy CostTotal Filter Cost
(kWh)$$
75,104$4,630$3,160
53,255$3,283$4,240
21,848$1,347-$1,080
Total Dollar Savings $267IRR (2 year) 8.1%
Though Equation 2 can be used to predict energy savings in any fan system, it mayoverestimate predicted savings in VAV systems, since it assumes a constant load profile. Inreality, the total savings should account for hourly variances in fan capacity and staticpressure drop across the filters. This information was not available during this case study;therefore, the simplified model was used.
Field Measurements
Power consumed by the supply fan motors was continuously monitored for 40 weeksstarting on April 30, 1998. Power consumption was monitored on each AHU with Elite-4Poly Phase Power Loggers,1’ using a time interval step of 10 minutes. The meters wereconnected to each fan’s motor control center and periodically downloaded to ensure dataintegrity. In addition, static pressure drop measurements across the air filters were monitoredperiodically to document the rise in pressure drop rise of the air filters as a function of time.
From motor nameplate and fan curve information.°Rate 6T charges are: $14.24/kW (summer), $1 1.137kw (winter), $0.05599/kWh peak time
(9:00 a.m. to 10:00 p.m. M-F) and $0.0234l off-peak time (all remaining hours).~ Manufactured by Pacific Science and Technology, Bend Oregon.
Commercial Buildings: Technologies, Design, and Performance Analysis - 3.85

Pressure drop readings were taken with a digital manometer12. All instrumentation werecalibrated by the instruments’ manufacturers prior to the study.
In addition to the instrumentation, the building’s DDC controller was programmed tomonitor the positions ofthe inlet vane dampers and supply static pressure for both fans. Thiswas conducted to verify that each fan had approximately 50 percent ofthe building load andto validate the power readings by comparing them to inlet vane damper position.
Data Analysis
The power data was analyzed for load trends, peak demand and total powerconsumption. The shapes ofthe power curves for both fans were similar, however, the totalelectric consumption of AHU2 (the Viledon system) was approximately 21 percent lowerthan that of AHU 1 (the Quality system). The cyclic nature of the power draw was duepredominantly to weather fluctuations and load variations within the building. Peakventilation loads varied with the seasons. The metering equipment also verified that the fanswere off during the weekends and holidays. As expected, the inlet vane damper position wasshown to be proportional to motor draw. The data summary is presented in Table 3.
Table 3. Results of Data Analyses (40 Week Duration)AHU-1 (Quality filters) AHU-2 (Viledon filters)
Maximum Power (kW) 74.1 67.2Minimum Power (kW) 0.0 0.0Average Power (kW) 21.6 17.1
Standard Deviation (kW) 20.6 22.3Electric Use (kWh) 60,487 47,884
During the study, AHU-1 used 12,603 more kWh than AHU-2. Normalizing the datafor 24 months would yield an estimated electricity savings of 32,768 kWh. Using electricuse rate data from CornEd (the local electric utility), the expected savings over this timewould be $1,345.’~ If the Quality air filter life was 12 months, the simple payback on theinvestment for the Viledon air filters would be approximately 10 months. A moreconservative model would be to assume the Quality air filters would last as long as theViledon air filters. The simple payback of this investment would be 2.0 years. In either case,the purchase ofViledon air filters seems appropriate in this application.
The static pressure drop across the filters was also monitored to determine how thepressure relationship changes as a function of time. It was not possible to isolate the pressuredrop across the prefilters and final filter; therefore, the measurements represented a total airfilter system pressure drop. The relationship of filter loading versus time was nearly linearfor both air filter types. Though most ofthe loading was on the prefilter, it was evident afterchanging the prefilter six months into the study that both final filters were capturingsignificant amounts of air contaminants. The air filter systems had a 50 percent difference in
t2 ALNOR Micromanometer 53013 Demand savings were not considered but would decrease the overall payback.
3.86

static pressure drop at the beginning of the study. This magnitude remained relativelyconstant throughout the case study.
Post Inspection of Air Filters
After approximately 40 weeks of service, one Viledon and one Quality air filter wereremoved and inspected to determine any significant performance-related issues. The mediain the Quality air filter did not load evenly as indicated by its inconsistent coloringthroughout the depth of the filter. When a filter does not load evenly, building owners andmanagers do not receive a good value for their investment.
Many of the stitch holes of the Quality air filter were not covered with glue. Perhapsthis is a manufacturing quality control issue. Large channels remain open for particles topass through the media and contaminate occupied areas. The value of this product is suspectconsidering the filter should be designed for virtually 100% particle retainment. In addition,because of the holes in the filter, it would likely never reach its recommended final pressuredrop. This is problematic for maintenance programs relying on this information for air filterchange intervals.
Conversely, the Viledon filters loaded evenly as demonstrated by the consistent colorof the air filter pockets throughout their depth. The Viledon air filter was specificallydesigned with self-supporting pockets that keep them open in varying airflows. Perhaps thischaracteristic allows for the decreased initial static pressure drop. The Viledon bags are heat-sealed at the ends of the pockets ensuring 100 percent particle retainment. In addition, thefronts ofthe bag pockets are molded into the polyurethane header for added filter integrity.
Conclusions
Physical laws (including the fan laws) predict some savings in ventilation systems byreducing the total pressure within the system. In this study, premium air filters (Viledon)were compared to standard air filters (Quality) with typically higher initial static pressuredrops. The cost ofthe Viledon air filter was 2.7 times the cost of the Quality air filter. Themanufacturers of premium bag-type air filters purport the incremental filter cost can berecovered with the subsequent savings in electric costs due to the lower average pressuredrop of the filters. In theory, this is irrefutable.
The case study of a VAV system demonstrated both air handlers had similar demandcurves with the energy consumption ofAHU2 (Viledon) approximately 21 percent less thanAHU 1 (Quality). The static pressure drop of AHU2 was clearly lower than AHU1 resultingin a 10-month to two-year payback for the retrofit of one AHU with the Viledon air filters.Though this is a very respectable payback range, it did not include benefits of reducedinstallation and disposal costs and other ancillary benefits that could reduce the paybackeven further. In addition, building managers could upgrade their filter system’s ASHRAEefficiency by using a premium air filter. Finally, the economic viability of this type ofinvestment was proven on a building where the variable air volume AHUs operatedapproximately 10 hours/day. Buildings with variable air volume AHUs that operate at least16 hours/day could find this investment extremely desirable.
Commercial Buildings: Technologies, Design, and Performance Analysis - 3.87

Reducing burden on our power plants by increasing energy efficiency in commercialbuildings is beneficial to the environment. In addition, reducing waste streams by reducingair filter use could help ease the burden on already over-taxed landfills throughout the U.S.
Epilogue
Last year the host of the case study replaced the Quality air filters in AHU-1 withViledon T60 air filters. The air filters in AHU-2 have been in use nearly two years. Duringthe last prefilter change, the static pressure drop was measured across the Viledon air filters.The reading was approximately 0.7 inches of water. The engineer anticipates using theoriginal Viledon filters another year (Cowgill 1999).
This study considered energy and air filter cost exclusively. The other benefits tousing premium air filters instead of typical air filters were not considered, however,advocates of improved indoor air quality would clearly benefit from their use.Recommendations for supplemental studies include:
• Benefits ofusing premium air filters in constant-velocity fan systems• Comparing fractional efficiencies ofpremium and typical air filters in the field• Exploring the relationship of decreasing system pressure and its effect on system
efficiency
• Determining the effect of eliminating prefilters on the life of final filters, on theenergy consumption of the system, and on the over-all life cycle cost for the filtersystem when energy costs, filter costs and disposal costs are all taken intoaccount
• Explore the relationship between filter dust load, pressure drop, and time atconstant flow rates for different filter types
References
Avery, Bob Et al. 1996. NAFA Guide to Air Filtration2nd Edition, National Air Filtration
Association.
Hardt, Rich. 1998. Telephone communication. Skokie, Illinois.: Airways Inc.
Fries, Mark. 1998. Telephone communication. Viledon Air Filtration, Division ofFreudenberg Non Wovens.
Cowgill, Carl. 1998. Personal communication. Hoffman Estates, Illinois.: Poplar CreekOffice Plaza.
Fries, Mark. 1998. Viledon Filter Energy Savings Program. Viledon Air Filtration, Divisionof Freudenberg Non Wovens.
Cowgill, Carl. 1999. Personal communication. Hoffman Estates, Illinois.: Poplar CreekOffice Plaza.
3.88