Embed Size (px)
Citation preview
Business and Management Horizons ISSN 2326-0297
2016, Vol. 4, No. 1
22
Using Experimental Survey Designs to Support Pricing Decisions
Andreas Krämer
BiTS - Business and Information Technology School GmbH Iserlohn, Germany Tel: 49-178-256-2241 E-mail: [email protected]
and
exeo Strategic Consulting AG
Wittelsbacherring, 24, 53115 Bonn, Germany
E-mail: [email protected]
Received: April 1, 2016 Accepted: April 18, 2016 Published: April 27, 2016
doi:10.5296/bmh.v4i1.9355 URL: http://dx.doi.org/10.5296/bmh.v4i1.9355
Abstract
Due to a changing marketing environment (more volatile, uncertain, complex and ambiguous framework, digitization) and the lack of a consistent pricing approach (challenge to harmonize neoclassical and behavioral elements), managers are increasingly questioning established ways to determine price levels and display price structures. Experimental testing represents a possibility to provide a decision support to pricing managers in the short run. The article presents three different projects, which quantitatively examine key elements of behavioral pricing: (1) the “Center-stage Effect” (electricity contract), (2) the impact of context on price perception (promotional campaigns for train tickets) and (3) offering of price guarantees as a means for improving the overall image as well as customer loyalty of the supplier (gas station). The results are partly unexpected as they contradict often-cited rules of thumb in behavioral pricing. Hence, it can be shown that experimental testing based on online surveys is a valuable and cost-efficient method to optimize price structures, price levels as well as price communication.
Keywords: VUCA, Price strategy, Behavioral pricing, Experimental testing, Online survey

Business and Management Horizons ISSN 2326-0297
2016, Vol. 4, No. 1
23
1. Introduction: Do We Know How Pricing Really Works?
“The more I know, the more I know that I know nothing” (Albert Einstein). At least partially this also applies to price management. The more information and tools for optimizing pricing structures are available, the more it becomes obvious how limited the current understanding of causal relationships in pricing actually is. This is mainly due to the fact that (1) digitization and Big Data arouse the hope to be able to automate the “right” price decision, (2) behavior-based pricing elements nowadays represent the mainstream in pricing research (Somervuori, 2014), but still leave open questions when optimizing price levels or price structures and (3) different factors in combination built an environment characterized by the keywords Volatility, Uncertainty, Complexity, and Ambiguity - known by the acronym VUCA - for decision-making. These trends are discussed in the following.
1.1 Pricing in the Age of Digitization and Big Data
Basically the increasing commercialization of products and services via the Internet and linking different data sources improve the possibilities, to carry out cause-effect analyses with the help of experimental testing. Nevertheless Thomke & Manzi (2014) note that such methods are not widespread in management practice and ask: “Why don’t more companies conduct rigorous tests of their risky overhauls and expensive proposals? Because most organizations are reluctant to fund proper business experiments and have considerable difficulty executing them.” If it is not possible for companies to carry out experiments in practice (for example, to change the product placement in individual stores or to systematically vary prices for a product in a given time period) there is at least the option for experimental testing based on a survey. The ability to carry out research online, to define structure-identical test groups and target these by experimental factors (for example changes in price levels, presentation of different advertisements or price displays etc.) offers a wide range of applications.
1.2 Mainstream: Behavioral Pricing
Typically, firms have a relatively good knowledge of the available economic inputs to the pricing decision such as cost of goods sold, price of substitutes and competitors, but at the same time not fully understand and anticipate a consumer’s response to a change in pricing (price level, price communication). The majority of economists nowadays agree with the statement that a purely analytical approach to price optimization is rarely successful. Consumers do not always react in the “rational” way that traditional microeconomics predict. Simon (2013) notes that since the award of the Nobel Prize to Kahneman & Tversky for their work on Prospect Theory “the number of authors and publications dedicated to behavioral economic problems explosively swells.” However, the key problem still remaining for the practical price management is, that there is no consistent model for behavior-based pricing. Finally, there are no clear and pragmatic rules to implement behavioral pricing in practice.
1.3 Pricing in a VUCA World
Managers increasingly face an environment in which information has no long-term prognostic value anymore since conditions change rapidly, market determinants are becoming

Business and Management Horizons ISSN 2326-0297
2016, Vol. 4, No. 1
24
increasingly complex and drivers of future trends are changing. The consequence is Volatility, Uncertainty, Complexity and Ambiguity: VUCA. This also leads to a scenario where companies are frequently thinking about alternative price models and question the way prices were traditionally set (Krämer, 2015a).
2. Background and Methodology
2.1 Background
Out of a wide range of effects that are discussed in behavioral pricing, three elements will be examined more closely in the following. All of them are particularly relevant to the price image. The first relates to the preference of price offers placed in the center of a price-/product range, secondly the context influence of price displays and thirdly, the impact of price guarantees on the overall image of the supplier.
2.1.1 Consumer Preference for the Mean Offer (“Center-stage effect”)
A common learning effect from behavioral economics is that consumers change their choices, depending on whether two alternatives are presented (with a lower and a higher price) or three alternatives. In the case of three alternatives there is a stronger preference for the middle price range. There are different explanations. Some researchers argue that a changed set of reference prices might be responsible, others state consumers feel more comfortable with a medium priced product (Simon, 2013; Rodway, Schepman, & Lambert, 2012). Nevertheless, the consumers’ price sensitivity appears to change simply by adjusting the assortment of products that are available. However, prior research examining the effect of the physical position of products in an array has found inconsistent effects ranging from preferences for the last option (Nisbett & Wilson, 1978), the middle option (Christenfeld, 1995; Shaw, 2000), either the first or the middle option (Dreze, Hoch, & Purk, 1994), or no position effect at all (Chandon et al., 2007). Valenzuela & Raghubir (2009) summarize their studies and conclude “that there is a center-stage effect: a product in a central position is preferred over one at either end of the array” and “the center advantage is due to beliefs that the product in the center is the most popular one rather than due to greater attention paid to the product”. Although, not all choices experiments confirm center-stage effect there is an assumption that consumers believe that options placed in the center of a simultaneously presented array are usually the most popular.
2.1.2 The Impact of Context on Price Perception
When consumers translate price information into categories as expensive or inexpensive, this requires a comparison with an internal standard price, typically referred to as a reference price (Helson, 1964). Janiszewski & Lichtenstein (1999) enhance this perspective by differentiating between internal (i.e., price paid in the past) and external reference price (for example where the price of a competitor’s product is known). In addition, an often discussed phenomenon in pricing is the price-ending-effect: If a price is $9.99 whereas another is $10, although the real difference is only one Cent, the fact that the number 10 has two digits, its perceived value is a lot higher than it really is. This is described as the “left-digit-effect” (Thomas & Morwitz, 2005), when the leftmost digit of the compared prices differ. Further
Business and Management Horizons ISSN 2326-0297
2016, Vol. 4, No. 1
25
pricing tactics widely used emphasize limited availability as framing-effect (“Scarcity effect”) as well as hints on absolute and relative savings. If consumers are promotion-focused (either from product attributes or marketing messages), supply-based scarcity (e.g., purchase limits) can motivate more purchases (Ku, Kuo, & Kuo, 2012).
2.1.3 Feel of Safety: the Usage of Price Guarantees to Influence the Overall Image of the Supplier
As Bodea & Ferguson (2012) point out, the price image of a company is often driven by its perceived fairness; the perceived fairness can be related to the seller’s profit, to past and future prices (price changes over time) or to what other customers get (value to the customer). One possibility to communicate fairness in pricing is that a company decides on a marketing strategy that emphasizes low prices as a general company policy (for example, everyday low prices at Wal-Mart). The strategy of “Every Day Low Prices” (EDLP) is useful when consumers try to maximize savings, and therefore choose retailers they believe offer the lowest prices the majority of the time (Danziger, Hadar, & Morwitz, 2014).
Another possibility is to offer price guarantees, sometimes as a tool to strengthen the EDLP-approach. The customer receives assurance that he has paid a lower price for a product at current purchase than if he had bought from a competitor. Andersen & Simester (2003) argue that customers find these price-matching policies reassuring, although there is evidence that a price matching used by the main players in the market might finally lead to higher price in the market. There are also ways to combine price fairness elements with customer loyalty. Amazon Prime is one example (the customer receives free and preferred delivery while paying a subscription fee); another example is the BahnCard, a loyalty and discount card in Germany, which guarantees a discount (25 % or 50 %, depending on the type of card) on the full fare train tickets (Krämer, 2015b).
2.2 Methodology
In order to test and document the performance of experimental research designs subsequently three different independently conducted studies in Germany are presented, each related to a different industry. Core elements of online studies are experiments as part of online surveys in which test groups were presented different price advertisements or price structures. A precondition for the experiment is firstly, that only selected experimental factors have impact while interference effects are avoided and, secondly, the test groups are equally structured (randomized). If the experiment is designed and executed properly, the only thing consistently different between the two variants is the change between the control and treatment (Weiss, 1997, p. 215). Therefore it is assumed that the observed change in the dependent variable is, in fact, due to the independent variable (internal validity).
Online studies offer particularly good possibilities to implement a methodically reliable testing environment for projects with limitations concerning time and budget. The design fulfills the preconditions for a laboratory experiment, in which the independent variable is manipulated and measures of the dependent variable are taken in an artificial setting for the purpose of controlling the many possible extraneous variables that may affect the dependent
Business and Management Horizons ISSN 2326-0297
2016, Vol. 4, No. 1
26
variable. During the last years options to conduct experiments integrated into surveys are enhanced due to progress in developing more elaborated survey software and due to simplified survey recruiting. Modern web-based survey platforms now allow researchers to expose participants to a variety of multi-media stimuli such as advertisements or individual sales offers.
The first study is focused on the optimal number of price bundles that are offered to the consumer (electricity supplier). The second study examines price perception effects in price displays (rail industry). The third study examines the influence of a price guarantee on the company’s image and customer loyalty (fuel station). All studies were conducted between September 2015 and January 2016.
3. Empirical Studies Using Experimental Survey Designs
For all cases as a first step the market environments are discussed briefly. Thereafter, the key questions for the study are presented and the background is explained. In the last step questions are answered based on the results of the experimental survey designs.
3.1 Study on Bundle Offers of an Electricity Provider
In Germany, there are about 1,000 electricity providers; the number of providers is increasing slightly over time. In about 80% of electricity-grid areas household customers can choose from more than 50 providers. The intensity of competition has significantly strengthened, last but not least because the standardized change process to a different supplier has been facilitated for the consumer. Since 2006 more than 15 million electricity customers changed their suppliers (excluding those who changed their supplier after relocation) - corresponding to one third of all households with electricity purchases. This trend continues: an additional 15 million people (16+ years) indicate that they consider changing their electricity supplier in the future (Krämer & Bongaerts, 2015). This result is also confirmed in the empirical study: about a quarter of respondents intend to change their electricity provider in the near future. 60% have switched suppliers in the past.
3.1.1 Key Focus: Efficient Presentation of Bundle Offers for Private Households
The experimental study was preceded by first quantitative studies (conjoint measurement) to determine relevant service components, followed by qualitative research (focus groups) and quantitative studies to determine the best way to structure offers (bundles vs. service modules that can be selected by the potential buyer). Before the final decision on the launch, however, there were two questions unanswered. The first question concerned the number of bundles that should be offered. Here the variants two or three bundles were discussed. The second question relates to the type of price and product presentation. The rising performance level of the bundle set (from “Small” to “Medium” to “Large”) should be communicated and guided through core services, either the term of the contract or the type of price guarantee.
3.1.2 Experimental Design
In the empirical study (Germany, online) about 631 people (age 18+ years) were surveyed, which are responsible for the purchase of electricity in their household. Focus of the survey

Business and Management Horizons ISSN 2326-0297
2016, Vol. 4, No. 1
27
was an experimental design, which divided the subjects into four equally structured groups (A to D, Table 1). Respondents were asked to indicate the postcode of residence and the power consumption of the household. Based on these parameters individual prices were calculated and displayed in the experiment.
Table 1. Experimental design for bundle offers (power contract for private households) Product bundles offered to interviewees
A: 3 bundle offers (S, M, L) contract period unchangeable
B: 2 bundle offers (M, L) contract period unchangeable
C: 3 bundle offers (S, M, L) price guarantee unchangeable
D: 2 bundle offers (M, L) price guarantee unchangeable
Bundle “S” Service low (1 month contract period)
----- Service low (no price guarantee)
-----
Bundle “M” Service medium (12 months contract period)
Service medium (12 months contract period)
Service medium (reduced price guarantee)
Service medium (reduced price guarantee)
Bundle “L” Service Large (24 months contract period)
Service Large (24 months contract period)
Service Large (full price guarantee)
Service Large (full price guarantee)
Each group received a specific simulation surface (individual prices were presented) with the option to add or eliminate certain service elements. Respondents were asked to indicate which of the product bundles were eligible for selection, which offer would be chosen and how satisfactory the offer was rated overall. In addition, image items as clarity, comprehensibility and interest were evaluated after respondents made their choice. In order to keep the choice set realistic, there was always a “non-option”, provided respondents did not like or accept the bundle offers presented in the experiment.
3.1.3 Main Results
In Table 2 the shares of selected bundle offers out of a set of two bundles (group B and D) as well as three bundles (group A and C) are presented.
Table 2. Choices according to experimental group
Choices A: 3 bundle offers (S, M, L) contract period changeable (n=157)*
B: 2 bundle offers (M, L) contract period changeable (n=158)**
C: 3 bundle offers (S, M, L) price guarantee changeable (n=158)*
D: 2 bundle offers (M, L) price guarantee changeable (n=158)**
Bundle “S” 26% ----- 17% ----- Bundle “M” 33% 37% 8% 11% Bundle “L” 18% 34% 56% 67% Do not select 23% 29% 18% 22%
Note. * Differences between A / C are significant (p=0.000; Chi-square), ** Differences between B / D are significant (p=0.000, Chi-square).

Business and Management Horizons ISSN 2326-0297
2016, Vol. 4, No. 1
28
The results of the choice experiment can be summarized as follows:
x The proportions of subjects, who did not opt for one of the bundled products offered, are between 18% (group C) and 29% (group B). The majority of respondents were able and willing to select one offer.
x The choice structure strongly differs between the bundles S, M and L (group A and C). In particular, the presentation style in group C leads to high preference shares for the package “L”. A tendency towards the center - often quoted in the literature (Simon, 2013) - can be observed in the group A (in this case the bundle offer “M” cumulates 33% of the choices), but not in the group C (here the medium bundle “M” amounts to 8%, a lower percentage than for “S” and “L”).
x Reducing the variants from three to two options (group B vs. A and group D vs. C) also leads to inconsistent effects: the shares for non-option increases slightly, in Group D the highest quality bundle offer (L) accounts for 67% of the choices simulated in the survey.
Through the experimental design it could be clearly demonstrated that the basic structure of the three product bundles is best explained by using the frame of a price guarantee. This is also supported by the image review. The groups C and D achieve better results in terms of clarity of the offer as well as overall attractiveness than the groups A and B (although differences are not significant). About three-quarters of respondents in the trade-off (two vs. three offers, direct question) decided for three bundle deals. Nevertheless, opportunities arise for suppliers to influence customers by a reduced offer. In order to determine the best strategy for the supplier, the incremental costs between the bundles have to be considered as well.
3.2 Study on Price Perception of Ticket Promotion for Passenger Rail
The current competitive situation for rail passenger transport in Germany could hardly be more dynamic: the business model of low-cost airlines has become prevailing in the domestic market. Cost reductions of the airlines are passed on to the market. Therefore the price pressure increases. Additional pressure on prices is resulting from the announcement of Ryanair to displace competitor Air Berlin from rank No. 2 in domestic air travel in medium term. In addition, dynamic developments concerning intercity buses and car sharing are considerable. After the liberalization of the market for long distance bus connections in Germany (2013), the market for bus trips boosted. One determinant was the low price level offered by suppliers of bus trips (Krämer & Jung, 2014). For 2014, the German Federal Statistical Office estimated the market size of 16 million trips, followed by 20 million trips in 2015. In relation to the approximately 130 million train rides (2014), there is a ratio of 0.12:1 (bus trips vs. train trips). German Rail is aiming to counter these tendencies with a service campaign and with very low promotional rates from €19 for a saver ticket (Krämer, Jung, & Burgartz, 2016).
3.2.1 Key Focus: Measuring Framing Effects on Price Promotions
With the special fare of €19-tickets German Rail (DB) was breaking new ground in 2015 as such low rates have not been offered before. Therefore, the campaign was promoted with the
Business and Management Horizons ISSN 2326-0297
2016, Vol. 4, No. 1
29
slogan “The lowest fare ever”. The offer was valid on longer journeys. Including additional discounts effective prices of about €14 were generated which correspond to yield of about 3 cents per km (medium distances were approximately 450 km). Within the advertising banner on the website of DB the sold number of tickets has been presented, a novelty, since sales figures have not been included in DB advertising displays before. The price promotion has been repeated in 2016. However, it is yet unclear how attractive the communicated price level evaluated by individual market segments is and whether there are additional positive effects due to the indication of the volume of tickets sold. Since rail ads are also competing with ads from intercity bus connections their influence on the rail price image has to be questioned as well.
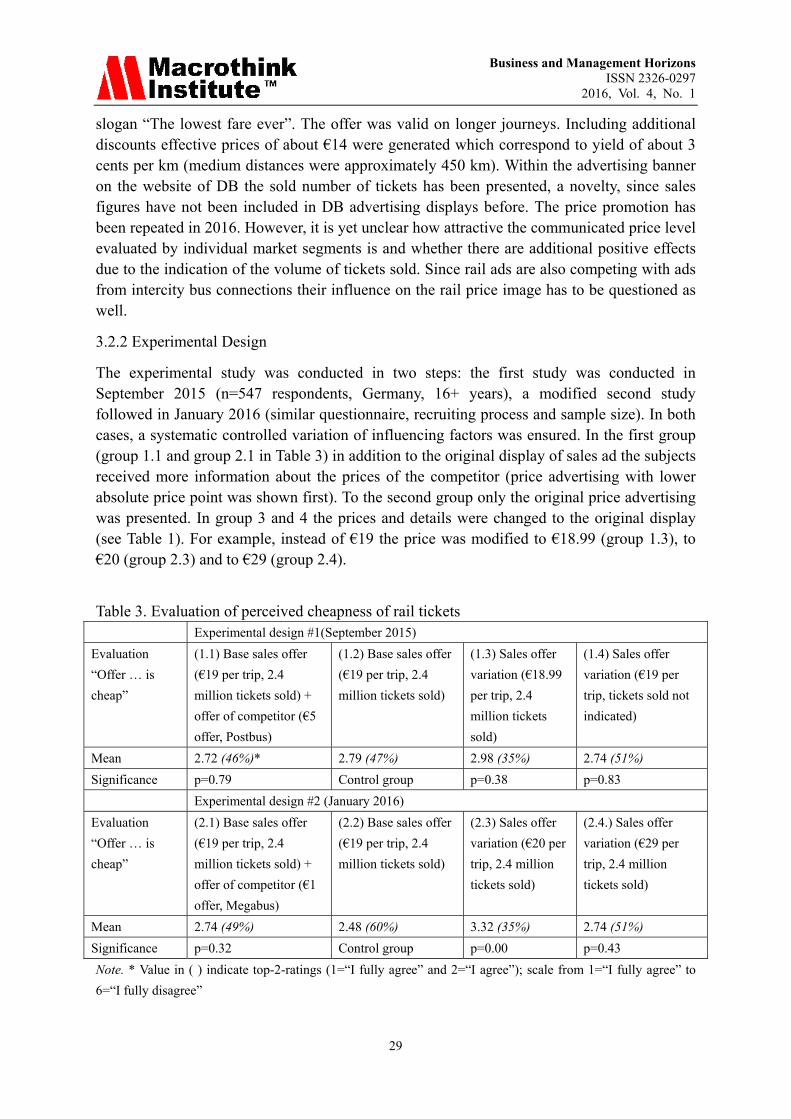
3.2.2 Experimental Design
The experimental study was conducted in two steps: the first study was conducted in September 2015 (n=547 respondents, Germany, 16+ years), a modified second study followed in January 2016 (similar questionnaire, recruiting process and sample size). In both cases, a systematic controlled variation of influencing factors was ensured. In the first group (group 1.1 and group 2.1 in Table 3) in addition to the original display of sales ad the subjects received more information about the prices of the competitor (price advertising with lower absolute price point was shown first). To the second group only the original price advertising was presented. In group 3 and 4 the prices and details were changed to the original display (see Table 1). For example, instead of €19 the price was modified to €18.99 (group 1.3), to €20 (group 2.3) and to €29 (group 2.4).
Table 3. Evaluation of perceived cheapness of rail tickets
Experimental design #1(September 2015) Evaluation “Offer … is cheap”
(1.1) Base sales offer (€19 per trip, 2.4 million tickets sold) + offer of competitor (€5 offer, Postbus)
(1.2) Base sales offer (€19 per trip, 2.4 million tickets sold)
(1.3) Sales offer variation (€18.99 per trip, 2.4 million tickets sold)
(1.4) Sales offer variation (€19 per trip, tickets sold not indicated)
Mean 2.72 (46%)* 2.79 (47%) 2.98 (35%) 2.74 (51%) Significance p=0.79 Control group p=0.38 p=0.83 Experimental design #2 (January 2016) Evaluation “Offer … is cheap”
(2.1) Base sales offer (€19 per trip, 2.4 million tickets sold) + offer of competitor (€1 offer, Megabus)
(2.2) Base sales offer (€19 per trip, 2.4 million tickets sold)
(2.3) Sales offer variation (€20 per trip, 2.4 million tickets sold)
(2.4.) Sales offer variation (€29 per trip, 2.4 million tickets sold)
Mean 2.74 (49%) 2.48 (60%) 3.32 (35%) 2.74 (51%) Significance p=0.32 Control group p=0.00 p=0.43 Note. * Value in ( ) indicate top-2-ratings (1=“I fully agree” and 2=“I agree”); scale from 1=“I fully agree” to 6=“I fully disagree”
Business and Management Horizons ISSN 2326-0297
2016, Vol. 4, No. 1
30
3.2.3 Main Results
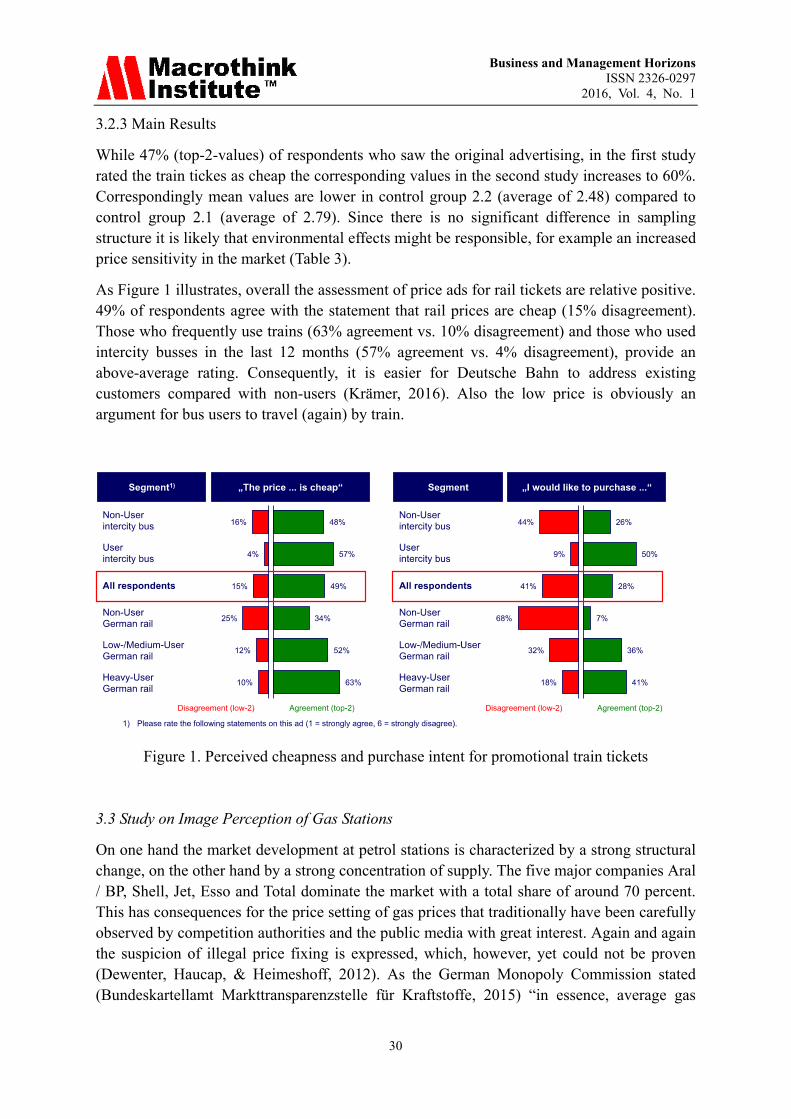
While 47% (top-2-values) of respondents who saw the original advertising, in the first study rated the train tickes as cheap the corresponding values in the second study increases to 60%. Correspondingly mean values are lower in control group 2.2 (average of 2.48) compared to control group 2.1 (average of 2.79). Since there is no significant difference in sampling structure it is likely that environmental effects might be responsible, for example an increased price sensitivity in the market (Table 3).
As Figure 1 illustrates, overall the assessment of price ads for rail tickets are relative positive. 49% of respondents agree with the statement that rail prices are cheap (15% disagreement). Those who frequently use trains (63% agreement vs. 10% disagreement) and those who used intercity busses in the last 12 months (57% agreement vs. 4% disagreement), provide an above-average rating. Consequently, it is easier for Deutsche Bahn to address existing customers compared with non-users (Krämer, 2016). Also the low price is obviously an argument for bus users to travel (again) by train.
Figure 1. Perceived cheapness and purchase intent for promotional train tickets
3.3 Study on Image Perception of Gas Stations
On one hand the market development at petrol stations is characterized by a strong structural change, on the other hand by a strong concentration of supply. The five major companies Aral / BP, Shell, Jet, Esso and Total dominate the market with a total share of around 70 percent. This has consequences for the price setting of gas prices that traditionally have been carefully observed by competition authorities and the public media with great interest. Again and again the suspicion of illegal price fixing is expressed, which, however, yet could not be proven (Dewenter, Haucap, & Heimeshoff, 2012). As the German Monopoly Commission stated (Bundeskartellamt Markttransparenzstelle für Kraftstoffe, 2015) “in essence, average gas

Business and Management Horizons ISSN 2326-0297
2016, Vol. 4, No. 1
31
prices show a robust wave-shaped function over of the day, with a significant increase in the evening and on the following day until the evening and then again falling prices. This curve is repeating on any day of the week”.
3.3.1 Key Focus: Improve Customer Loyalty by Offering a Price Guarantee
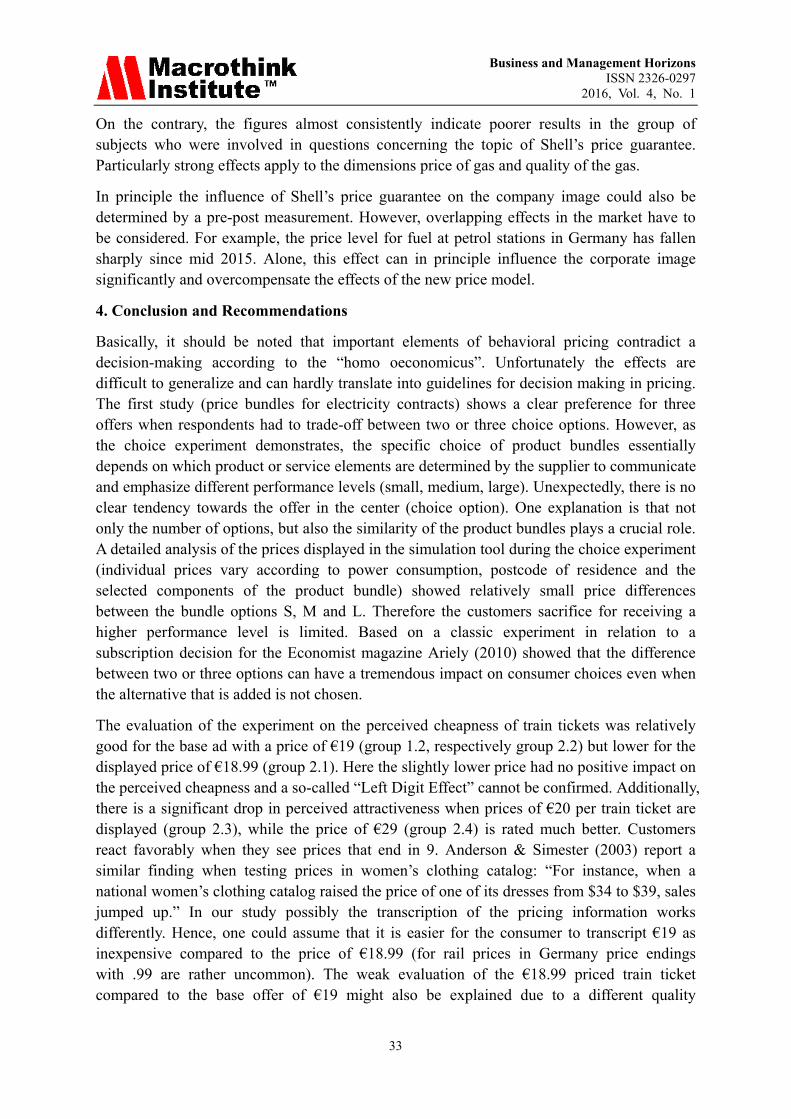
In mid 2015, Shell (ranking No. 2 in terms of market share in Germany) introduced a modified loyalty scheme in its 2000 stations in Germany (slogan: “Life is too short to compare gasoline prices”). Key element is a new pricing and discount model that is based on data from the official market transparency unit. At checkout, the currently valid prices of the respective Shell station are compared with the prices of the ten nearest stations. In case there is a cheaper competitor Shell’s customer is charged at maximum 2 cents per liter more than at the cheapest gas station. “We want to offer customers the guarantee that they pay fair and low prices,” underlined Shell when introducing the price model. The offer is targeted to approximately six million owners of Shell discount card Clubsmart. As Simon-Kucher & Partners (SKP, 2015) stated: “The new pricing model not only fits perfectly to the customer settings, it also strengthens the brand and increases customer loyalty”.
Yet, it remains unclear whether consumers are truly convinced of the fairness and price safety promised by the supplier. Overall, the study reveals an ambivalent image. Only about one out of three respondents is interested in Shell’s pricing model (top-2 rating), for 51%, however, the pricing model is not interesting (low-2 rating). The impressions and comments of respondents (open question) demonstrate a strong polarization. Particularly positive is the review for Shell customers currently holding a Clubsmart card - the loyalty scheme of Shell. In this group, about 65% of customers are clear supporters of the price guarantee.
Admittedly, the situation is different for Shell customers without the Clubsmart loyalty card. In this group the proportion of critical consumers prevails. Thus, the new pricing model also polarizes and splits existing Shell customers into proponents and opponents (Figure 2).
Total
1) in Germany, Shell offers the following price guarantee: Registered Shell Club Smart members pay no more than 2 cents / liter than at the cheapest competitor gas station close to the Shell station and collect the same Shell Club Smart points. How interesting this price guarantee is for you personally?
Shell-non- customers
This is very interesting (=1)
2
3
4
This is not interesting at all (=5)
Interest in the price guarantee1)
Shell-customers / without Clubsmart
Shell-customers / with Clubsmart
10%
19%
21%
15%
36%
8%
18%
21%
17%
37%
3%
17%
23%
11%
46%
36%
29%
14%
14%
7%
Figure 2. Consumers’ interest in the Shell price guarantee according to customer segments

Business and Management Horizons ISSN 2326-0297
2016, Vol. 4, No. 1
32
This also corresponds to a differentiated willingness to participate in Clubsmart (higher for Clubsmart customers and lower for Shell customers without Clubsmart card).
3.3.2 Experimental Design
To measure the relative performance of Shell against major rivals, seven performance indicators for gas station companies were evaluated (scale from 1=very good to 6=very bad). Only interviewees who have visited a gas station in the last two months were considered. Overall, the results for Shell and its main competitors show little differentiations: in most brand-image dimensions only slight differences in the perception of the provider are obvious. Significant disadvantages are found for the market leaders ARAL and Shell in terms of prices.
To measure the effect of the Shell price guarantee on the company’s image, the interviewees were classified randomly into two groups. One group of subjects received specific questions about Shell’s price guarantee during the interview (among others questions awareness of Shell’s media campaign, awareness of Shell’s price guarantee, degree of interest in participating in Clubsmart, use of intention, etc. were measured), another group did not receive any questions about Shell (control group).
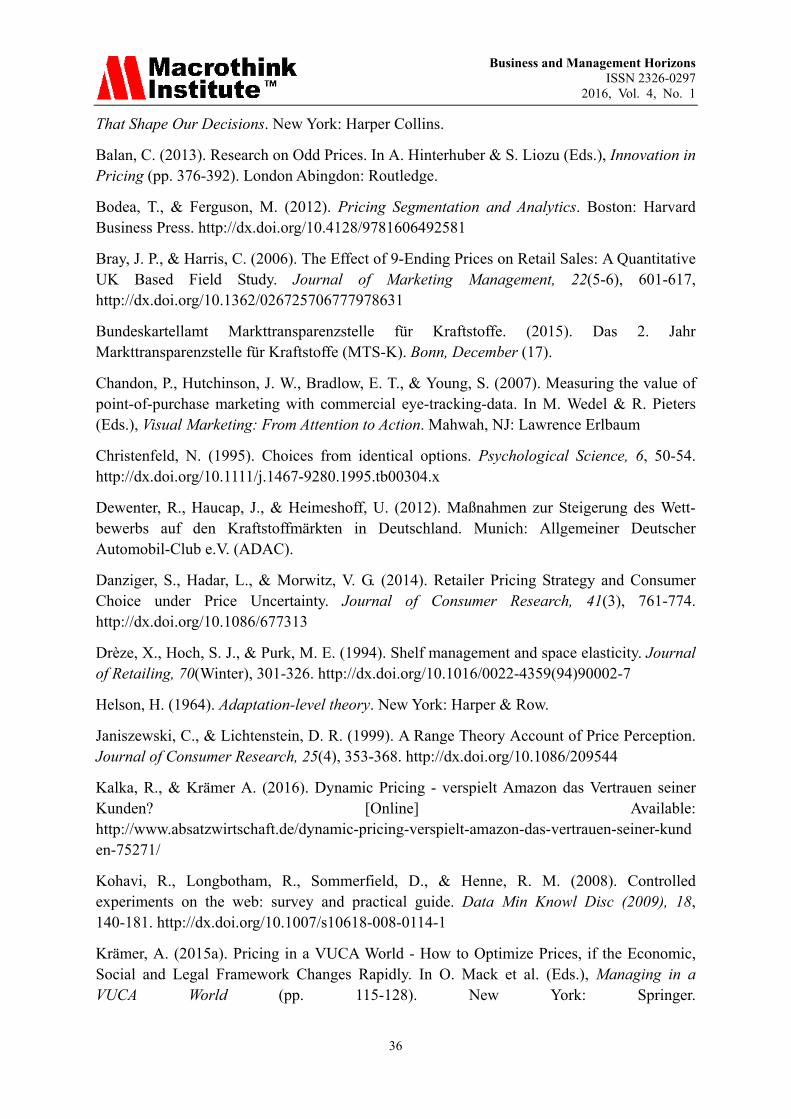
3.3.3 Main Results
The ratings of the two groups are compared in Figure 3. Furthermore, the differences in the top-2-values (level of agreement) are shown (scale point “good” and “very good”). In addition, the significances of the mean values of both groups have been checked. Basically, it should be noted that the hypothesis that offering a price guarantee and thereby increasing price transparency for the consumer positively impacts the corporate image, could not be confirmed.
Figure 3. Rating of Shell gas stations according to test groups (Germany 2016)
Business and Management Horizons ISSN 2326-0297
2016, Vol. 4, No. 1
33
On the contrary, the figures almost consistently indicate poorer results in the group of subjects who were involved in questions concerning the topic of Shell’s price guarantee. Particularly strong effects apply to the dimensions price of gas and quality of the gas.
In principle the influence of Shell’s price guarantee on the company image could also be determined by a pre-post measurement. However, overlapping effects in the market have to be considered. For example, the price level for fuel at petrol stations in Germany has fallen sharply since mid 2015. Alone, this effect can in principle influence the corporate image significantly and overcompensate the effects of the new price model.
4. Conclusion and Recommendations
Basically, it should be noted that important elements of behavioral pricing contradict a decision-making according to the “homo oeconomicus”. Unfortunately the effects are difficult to generalize and can hardly translate into guidelines for decision making in pricing. The first study (price bundles for electricity contracts) shows a clear preference for three offers when respondents had to trade-off between two or three choice options. However, as the choice experiment demonstrates, the specific choice of product bundles essentially depends on which product or service elements are determined by the supplier to communicate and emphasize different performance levels (small, medium, large). Unexpectedly, there is no clear tendency towards the offer in the center (choice option). One explanation is that not only the number of options, but also the similarity of the product bundles plays a crucial role. A detailed analysis of the prices displayed in the simulation tool during the choice experiment (individual prices vary according to power consumption, postcode of residence and the selected components of the product bundle) showed relatively small price differences between the bundle options S, M and L. Therefore the customers sacrifice for receiving a higher performance level is limited. Based on a classic experiment in relation to a subscription decision for the Economist magazine Ariely (2010) showed that the difference between two or three options can have a tremendous impact on consumer choices even when the alternative that is added is not chosen.
The evaluation of the experiment on the perceived cheapness of train tickets was relatively good for the base ad with a price of €19 (group 1.2, respectively group 2.2) but lower for the displayed price of €18.99 (group 2.1). Here the slightly lower price had no positive impact on the perceived cheapness and a so-called “Left Digit Effect” cannot be confirmed. Additionally, there is a significant drop in perceived attractiveness when prices of €20 per train ticket are displayed (group 2.3), while the price of €29 (group 2.4) is rated much better. Customers react favorably when they see prices that end in 9. Anderson & Simester (2003) report a similar finding when testing prices in women’s clothing catalog: “For instance, when a national women’s clothing catalog raised the price of one of its dresses from $34 to $39, sales jumped up.” In our study possibly the transcription of the pricing information works differently. Hence, one could assume that it is easier for the consumer to transcript €19 as inexpensive compared to the price of €18.99 (for rail prices in Germany price endings with .99 are rather uncommon). The weak evaluation of the €18.99 priced train ticket compared to the base offer of €19 might also be explained due to a different quality

Business and Management Horizons ISSN 2326-0297
2016, Vol. 4, No. 1
34
perception (Balan, 2013). Overall, the results for prices with 9-endings are confirmed by other studies that suggest that consumers favor round numbers when paying for goods and services (Lynn, Flynn, & Helion, 2013) and adopting round-pound prices may be more effective (Bray & Harris, 2006).
The third project example illustrates that the offer of a price guarantee must convey a customer benefits that is solid and easy to understand. If this requirement is not fulfilled, the assessment of the consumer is ambivalent. The German car drivers are to a large extend aware of Shell’s advertising explaining the new price model and a significant share is able to recall this. However, consumers are not fully convinced of the price model, since it offers a relative price guarantee - not an absolute price guarantee. One explanation is that the fuel prices in Germany are partly changed hourly. Throughout the day prices per liter of fuel may vary by more than 20 cents in cities like Cologne, Munich or Berlin (Bundeskartellamt Markttransparenzstelle für Kraftstoffe, 2015). The benefit of a relative price guarantee therefore is limited for the consumer. Based on the results of the survey experiments the following recommendations are given:
(1) In the illustrated experiments only a few factors influencing the price image are tested. In his overview article Larson (2014) describes more than fifty of these principles of behavioral pricing dividing them into four categories: framing, congruency, context, and signaling. Under a cost-benefit perspective the management should focus on the most important effects. Therefore it is crucial to formulate concrete hypotheses and accurately narrow the subject matter, to be able to provide concrete results based on the experimental design in a field or laboratory environment. As the three studies presented in this paper show online surveys with experimental designs can provide useful results when pricing manager face uncertainty. Due to its simplicity, clarity of the results and the cost-efficiency such methods are recommended to support pricing decisions. This approach is generally not competing with other pricing research methods as conjoint measurement or Price Sensitivity Measurements (PSM). Test designs are rather helpful at the end of a pricing process; for example, if key questions on the implementation of promotional offers need clarification.
(2) Although, it seems intuitively more reasonable to decide for a Web-Testing as a field experiment (if practically feasible), there are also limitations compared with an experimental survey design (Table 4). One critical issue is that even if quantitative metrics are provided, there is usually a lack of explanations. As Kohavi et al. (2008) state: “It is possible to know which variant is better, and by how much, but not why.” One option is to introduce usability labs in order to augment and complement controlled experiments (Nielsen, 2005). Another problem is consistency. Users may notice that they are getting a different variant than their friends and family. It is also possible that the same user will see multiple variants when using different computers (with different cookies). Since the price is often a key parameter for web users, variations in pricing may become a concern (for example if consumers misunderstand the experiment as a way to discriminate prices by the supplier, as shown by Kalka & Krämer, 2016). In 2000, Amazon.com Inc. infuriated many customers when it sold DVDs to different people for different prices. Amazon angered customers, who discussed DVDs at the website DVDTalk.com and noticed that they were charged as much as 40% more than other

Business and Management Horizons ISSN 2326-0297
2016, Vol. 4, No. 1
35
consumers (Streitfeld, 2000; Taylor, 2004) leading to the public discussion on price fairness.
Amazon called it merely a test and ultimately refunded the price difference to people who paid more. (Valentino-Devries, Singer-Vine, & Soltani, 2012). Jeff Bezos said in a news release: “We have never tested and we never will test prices based on customer demographics,” founder Amazon.com spokesman Bill Curry said the tests were useful in determining a price point-the right balance between how much Amazon.com could charge and still maintain a good sales volume. Nevertheless, because of the consumer outcry, Amazon.com ended up refunding 6,896 customers an average of $3.10 each, or a total of $21,377.60. Similar risks of perceive unfairness when testing price levels (Li, 2014) can be avoided when experimental survey designs are used instead of real-time web-testings.
Table 4. Comparison of Web-Testing and experimental study design
Characteristics Web-Testing Experimental Survey Design Research method Observation / tracking Interviews / questionnaire Typ of experiment Field (“real life”) Laboratory (“artificial”) Focus Behavior (purchase, response) ... Perception, purchase intent … Scope E-commerce (Internet) All sales channels
(3) While access to consumer data is no real limitation for decision making anymore, the ability to draw the right conclusions is remaining a crucial factor. Yet, companies receive more, detailed and real-time data about products and services. However, there is always a retrospective view on the data (unless data are provided in real time). This is true for data internally available for firms as well as externally acquired. Because the uncertainty in pricing continuously increases and decisions must be taken and proved more frequently and faster, experimental research designs in surveys are increasingly becoming relevant. As behavioral pricing shows, small differences in communication or display of prices can have a large effect on the price image and hence on sales volumes. Unfortunately, the direction of the effect can hardly be predicted. Testing under realistic conditions is possibly one way to systematically and specifically prepare pricing decisions.
Acknowledgement
The author is grateful to Rogator AG, Nuremberg, for the provision of survey software, the programming of the questionnaire and the complete data management including access to the online panel. Many thanks also Dr. Gerd Wilger, Dr. Robert Bongaerts and Martin Jung (exeo Strategic Consulting AG) for valuable suggestions and substantive input to the study.
References
Anderson, E., & Simester, D. (2003). Mind Your Pricing Cues. Harvard Business Review 81(9), 96-103.
Ariely, D. (2010). Predictably Irrational, Revised and Expanded Edition: The Hidden Forces
Business and Management Horizons ISSN 2326-0297
2016, Vol. 4, No. 1
36
That Shape Our Decisions. New York: Harper Collins.
Balan, C. (2013). Research on Odd Prices. In A. Hinterhuber & S. Liozu (Eds.), Innovation in Pricing (pp. 376-392). London Abingdon: Routledge.
Bodea, T., & Ferguson, M. (2012). Pricing Segmentation and Analytics. Boston: Harvard Business Press. http://dx.doi.org/10.4128/9781606492581
Bray, J. P., & Harris, C. (2006). The Effect of 9-Ending Prices on Retail Sales: A Quantitative UK Based Field Study. Journal of Marketing Management, 22(5-6), 601-617, http://dx.doi.org/10.1362/026725706777978631
Bundeskartellamt Markttransparenzstelle für Kraftstoffe. (2015). Das 2. Jahr Markttransparenzstelle für Kraftstoffe (MTS-K). Bonn, December (17).
Chandon, P., Hutchinson, J. W., Bradlow, E. T., & Young, S. (2007). Measuring the value of point-of-purchase marketing with commercial eye-tracking-data. In M. Wedel & R. Pieters (Eds.), Visual Marketing: From Attention to Action. Mahwah, NJ: Lawrence Erlbaum
Christenfeld, N. (1995). Choices from identical options. Psychological Science, 6, 50-54. http://dx.doi.org/10.1111/j.1467-9280.1995.tb00304.x
Dewenter, R., Haucap, J., & Heimeshoff, U. (2012). Maßnahmen zur Steigerung des Wett- bewerbs auf den Kraftstoffmärkten in Deutschland. Munich: Allgemeiner Deutscher Automobil-Club e.V. (ADAC).
Danziger, S., Hadar, L., & Morwitz, V. G. (2014). Retailer Pricing Strategy and Consumer Choice under Price Uncertainty. Journal of Consumer Research, 41(3), 761-774. http://dx.doi.org/10.1086/677313
Drèze, X., Hoch, S. J., & Purk, M. E. (1994). Shelf management and space elasticity. Journal of Retailing, 70(Winter), 301-326. http://dx.doi.org/10.1016/0022-4359(94)90002-7
Helson, H. (1964). Adaptation-level theory. New York: Harper & Row.
Janiszewski, C., & Lichtenstein, D. R. (1999). A Range Theory Account of Price Perception. Journal of Consumer Research, 25(4), 353-368. http://dx.doi.org/10.1086/209544
Kalka, R., & Krämer A. (2016). Dynamic Pricing - verspielt Amazon das Vertrauen seiner Kunden? [Online] Available: http://www.absatzwirtschaft.de/dynamic-pricing-verspielt-amazon-das-vertrauen-seiner-kunden-75271/
Kohavi, R., Longbotham, R., Sommerfield, D., & Henne, R. M. (2008). Controlled experiments on the web: survey and practical guide. Data Min Knowl Disc (2009), 18, 140-181. http://dx.doi.org/10.1007/s10618-008-0114-1
Krämer, A. (2015a). Pricing in a VUCA World - How to Optimize Prices, if the Economic, Social and Legal Framework Changes Rapidly. In O. Mack et al. (Eds.), Managing in a VUCA World (pp. 115-128). New York: Springer.

Business and Management Horizons ISSN 2326-0297
2016, Vol. 4, No. 1
37
http://dx.doi.org/10.1007/978-3-319-16889-0
Krämer, A. (2015b). Rabatt- und Kundenbindungskarten im Personenverkehr - Länderübergreifende Analyse zu den Bahn-Rabattkarten in der DACH-Region. ZEVrail, 139(9), 341-347.
Krämer, A., & Jung, M. (2014). Zwischen Preiswettbewerb und Preiskampf - Das Spannungsfeld zwischen Nachfrageboom und Preiserosion bei Reisen mit Fernlinienbussen. Internationales Verkehrswesen, 66(4), 58-60
Krämer, A., & Bongaerts, R. (2015). Mit der doppelten Wertperspektive zum Erfolg - Einsatz der Value-to-Value-Segmentierung im Strommarkt. ew Magazin für die Energiewirtschaft, 114(9), 39-42.
Krämer, A., Jung, M., & Burgartz, T. (2016). A Small Step from Price Competition to Price War - Understanding Causes, Effects and Possible Countermeasures. International Business Research, 9(3), 1-13. http://dx.doi.org/10.5539/ibr.v9n3p1
Krämer, A. (2016). Robustness of Price Perception: How Strong are Anchoring-, Left-Digit- and Framing-Effects when Promoting Sales Offers? Business and Management Studies, 2(1), S. 35-43. http://dx.doi.org/10.11114/bms.v2i1.1137
Ku, H., Kuo, C., & Kuo, T. (2012). The Effect of Scarcity on the Purchase Intentions of Prevention and Promotion Motivated Consumers. Psychology and Marketing, 29(8), 541-548. http://dx.doi.org/10.1002/mar.20541
Larson, R. B. (2014). Psychological Pricing Principles for Organizations with Market Power. Journal of Applied Business and Economics, 16(1), 11-25
Li, K. J., & Sanjay, J. (2016). Behavior-Based Pricing: An Analysis of the Impact of Peer-Induced Fairness. Management Science, 1.
Lynn, M., Flynn, S. M., & Helion, C. (2013). Do consumers prefer round prices? Evidence from pay-what-you-want decisions and self-pumped gasoline purchases. Journal of Economic Psychology, 36(June), 96-102. http://dx.doi.org/10.1016/j.joep.2013.01.010
Nielsen, J. (2005). Putting A/B testing in its place. Useit.com Alertbox. [Online] Available: http://www. useit.com/alertbox/20050815.html
Nisbett, R. E., & Wilson, T. D. (1977). Telling more than we can know: Verbal reports on mental processes. Psychological Review, 84(3), 231-259. http://dx.doi.org/10.1037/0033-295X.84.3.231
Rodway, P., Schepman, A., & Lambert, J. (2012). Preferring the One in the Middle: Further Evidence for the Centre-stage Effect. Applied Cognitive Psychology, 26(2), 215-222. http://dx.doi.org/10.1002/acp.1812
Simon, H. (2013). Preisheiten - Alles, was Sie über Preise wissen müssen. Frankfurt: Campus.

Business and Management Horizons ISSN 2326-0297
2016, Vol. 4, No. 1
38
Simon-Kucher & Partners. (2015). An die Spitze mit TopLine Power. [Online] Available: https://www.simon-kucher.com/sites/default/files/SimonKucher_Imagebroschuere_DE.pdf
Somervuori, S. (2014). Profiling behavioral pricing research in marketing. Journal of Product & Brand Management, 23(6), 462-474. http://dx.doi.org/10.1108/JPBM-06-2014-0653
Shaw, J. I. (2000). Centrality preferences in choices among similar options. Journal of General Psychology, 127(2), 157-164.
Streitfeld, D. (2000). On the Web Price Tags Blue: What You Pay Could Depend on WhoYou Are. The Washington Post, September (27).
Taylor, C. (2004). Consumer Privacy and the Market for Customer Information. RAND Journal of Economics, 35(4), 631-650. http://dx.doi.org/10.2307/1593765
Thomas, M., & Morwitz, V. (2005). Penny Wise and Pound Foolish: The Left-Digit Effect in Price Cognition. Journal of Consumer Research, 32(1), 54-64. http://dx.doi.org/10.1086/429600
Thomke, S., & Manzi, J. (2014). The Discipline of Business Experimentation. Harvard Business Review, 92(12), 70-79.
Valenzuela, A., & Raghubir, P. (2009). Position-based beliefs: The center-stage effect. Journal of Consumer Psychology, 19(2), 185-196. http://dx.doi.org/10.1016/j.jcps.2009.02.011
Valentino-Devries, J., Singer-Vine, J., & Soltani, A. (2012). Websites Vary Prices, Deals Based on Users’ Information. Wall Street Journal, December (24).
Weiss, C. H. (1997). Evaluation: methods for studying programs and policies (2nd ed.). New Jersey: Prentice Hall.
Copyright Disclaimer
Copyright for this article is retained by the author(s), with first publication rights granted to the journal.
This is an open-access article distributed under the terms and conditions of the Creative Commons Attribution license (http://creativecommons.org/licenses/by/3.0/).