Embed Size (px)
Citation preview
Journal of the Earth and Space Physics, Vol. 46, No. 4, Winter 2021, P. 13-26 (Research)
DOI: 10.22059/jesphys.2020.280457.1007112
Using Electrical Properties of Some Subsurface Sedimentary Rocks as a Tool to Detect Bedding Direction
Gomaa, M. M.*
Professor, Department of Geophysical Sciences, National Research Center, Cairo, Egypt
(Received: 8 May 2019, Accepted: 21 Jan 2020)
Abstract The direction of bedding is not natural to be detected using laboratory measurements. Cretaceous rocks are mainly composed of sandstone and clay (clastic facies, sandstones, siltstones, mudstone). Electrical characteristics were measured perpendicular and parallel to layer direction (42 Hz to 5 MHz) to detect anisotropy and homogeneity of samples. Electrical characteristics of samples were measured at the dry state and three different salines (NaCl) concentrations at a constant temperature. Electrical anisotropy and homogeneity of samples are contributed mainly to load pressure direction compaction. Previous factors are an excellent diagenetic feature and changes from one example to another. Elongation of conductor and insulator grains will change electrical properties. Due to the homogeneity of samples, the only variable in electrical characteristics will relate to the anisotropy of grains. When the grains are, more or less, spherical, then electrical components will be similar at two perpendicular directions. Whereas, when grains are needles or disks, later, electrical characteristics will be changed. This paper tries to detect qualitatively and as a quick tool, anisotropy and homogeneity of samples by measuring their electrical properties. Anisotropy in studied samples was described by slight to moderate electric lineation and foliation.
Keywords: Electric; Dielectric constant; Complex conductivity; Clastic; Anisotropy; Heterogeneity.
1. Introduction Clastic rocks are competent reservoirs of hydrocarbons and water. The used samples in this article are collected from Abu El-Gharadig basin, north of Western Desert, Egypt, Figure 1. The beginning of the formation of Abu El-Gharadig basin started at the first Mesozoic sedimentary cycle. A limited, slow southward transgression of Tethyan Sea, arrived at Abu El-Gharadig Basin during Middle Jurassic age (Bayoumi and Lotfy, 1989). Cretaceous rocks that cover Abu El-Gharadig basin are divided into Khoman, Abu Roash, Bahariya, Kharita, Alamein, Alam El-Bueib and Betty Formations. Electrical characteristics are resulted from many factors. The quantity of sample conductor concentration is the primary factor of these operators. The nature and concentricity of dissolved saline salts, at pore spaces, is essential for electrical characteristic variations (NaCl, CaCl2 and MgCl2, etc.). Generally, the texture within a sample (pore volume, shape anisotropy, geometry and distribution, effective porosity, tortuosity) is also a competent
operator in controlling electrical properties. Electrical characteristics are controlled, too, by its type, impurity content, humidity, salinity etc. Electrical characteristics may change due to the grain elongation (in bedding or perpendicular to layer). The anisotropy or the heterogeneity at electrical components measure variations of physical characteristics in horizontal and vertical orientations (in line or perpendicular to the coat). The horizontal electrical conductivity (bedding direction of the layer) is always higher than the vertical ones (perpendicular to layer) unless the medium is entirely homogeneous (Louis et al., 2003). Electrical properties, usually, can be used for the determination of the rank of connectivity of channels and their lengths in rocks. Samples used are some clastic rocks (clastic facies, sandstones, siltstones, mudstone with some shale interbeds). Generally, the rank of shape anisotropy of these samples may be considered slight to moderate. This means that most of the grains are nearly spheres not in the form of
*Corresponding author: [email protected]

14
disks or From anhave mdonors influencsamples alkalinitextent, samplesthe primsamplesresult fsolution degree o
Fi
needles. n electrical p
many active or accepto
ce the type o(Shuey, 1
ty of the soluthe nature
. Broken bomary sources. Free charfrom the t
or from brof thermal e
igure 1. a) Loc
Journal of the
point of vieimpurities,
or. Many fof charge an1975). The ution impac
of the pnds and frees of conductge carriers trace elemeroken crystaexcitation ac
ation map of A
e Earth and Sp
ew, all rocks which arefactors maynd density a
acidity orts, to a grea
potentials oe charges aretion in thesemay be the
ents, at theal bonds andcross energy
Abu El-Gharadig
pace Physics, V
s e y at r
at f e e e e d y
gapall thein sfacshaAlsparbonstruanddenfacand
(a)
(b)
g basin. b) Sam
Vol. 46, No. 4, W
ps. The condthese carr
rmal excitatsamples. Claies, sandston
ale are suppso, electricrtially on thnds and imucture (Gomd Cohen, 1nsity of eleilitates the
d Shuey, 197
mple holder used
Winter 2021
ductivity is riers, chargtion, frequenastic rocks thnes, siltstonposed to becal characte defects, thmpurity ele
maa et al., 21982). Presectrons withelectron tr
76).
d in the electrica
comparativege concentrncy and mohat contain c
nes, mudstone semiconduteristics dhe broken cements in 2009; Mend
sence of a thin the saransfer (Prid
al experiment.
e with ration, obility clastic ne and uctors. epend
crystal grain
delson high
mples dmore

Using Electrical Properties of Some Subsurface Sedimentary Rocks as a … 15
Interpretation of electrical characteristics is sensitive to variations of the physical, electrochemical, chemical structure of samples, heterogeneity and other many microstructural factors (Gomaa and Elsayed, 2009; Abraitis et al., 2004; Chelidze and Guéguen, 1999; Chelidze et al., 1999). Generally, electrical characteristics depend on shape anisotropy, grain size and other heterogeneity parameters of the sample (Gomaa, 2008; Gomaa and Abou El-Anwar, 2015; Gomaa, 2009). The present paper is a trial to define the isotropy/anisotropy and heterogeneity/homogeneity of samples using electrical properties by measuring these electrical characteristics in two various perpendicular directions. We will try to give some detailed information on electrical, mineralogical, geochemical and petrographical details of these clastic samples and their relation to the homogeneity and anisotropy of these samples. The frequency range used is from 42 Hz up to 5 MHz. Electrical characteristics of samples are measured at the dry state and three different salines (NaCl) concentrations (9 k ppm, 30 k ppm and 90 k ppm) at a constant temperature. This study may be extended to be a tool for a quick prediction (qualitatively) of anisotropy of samples from electrical properties. 2. Methods and techniques A total of nine representative samples, oriented according to the bedding plane, were prepared for electrical measurements. After that, samples are cleaned by ultrasonic waves and then dried in an electric oven at 70 C (as a maximum temperature) for one day. Insoluble residue and decantation methods (Ireland, 1958) were used to determine the carbonate, clay and sand concentration in samples. Bulk density and effective porosity are then measured (Dakhanova, 1977). Finally, some thin sections for Scanning Electron Microscope (SEM) were made to investigate petrophysical properties, pore shapes and orientation of grains. Electrical resistivity measurements were measured in two directions, perpendicular to bedding plane and in bedding plane
direction, at dry conditions and three different salines (NaCl) concentrations (9 k ppm, 30 k ppm and 90 k ppm). The temperature used was constant temperature (~20 °C). The geometry (an area to thickness ratio) of samples, for electrical measurements, was chosen to be more than 5:1. 2-1. Instrumental setup Hitester Impedance Analyzer (LCR, Hioki 3522-50) was used to measure electrical properties. Sample edges were polished to be parallel. Electrical characteristics were measured at a frequency range from 42 Hz to 5 MHz at relative atmospheric humidity of (~57 %) (Gomaa and Alikaj, 2009; Gomaa et al. 2019). Electrical characteristics of samples were measured at parallel mode. Parallel capacitance ( pC ) and conductance ( pG ) and
series impedance Z were measured. Complex relative dielectric constant is "'* i ,
where, AdCp 0' , is the real part of
complex relative permittivity, and the imaginary part of complex relative permittivity is AdGp 0" , where A is
cross-sectional area of the sample, d is
sample thickness, 120 1085.8 is free
space permittivity and is angular
frequency. 0"' AdGp is the real
conductivity (Shaltout et al., 2012; Gomaa, 2013). Complex conductivity means that the output value of conductivity has a real (in phase) and imaginary (out of phase) components. Conductivity (only) means that the output value of conductivity has only a real (in phase) component. Electrode impedance within the samples, for all the frequency range, was found to be ~ (15- J 0.1) Ω, and it was removed from the calculations. J is the imaginary component of the complex electrode impedance. 3. Lithostratigraphy and Petrography Abu El-Gharadig basin constitutes ~ 85% of clastic rocks and ~15% of limestones. The sand texture varies from silt to coarse-grained sand (very fine to tiny grained particle size). The particles are described by

16
moderateThere exmaturity Lower Cbasin cLithic frHeavy Glaucon(patchy CarbonaCarbonatQuartz and PyritThe LowGharadigsandston
Figure 2.
e to comxists a high te
of theCretaceous roconstructed ragments (gra
minerals ite, Phosphat
pore-fillingaceous debrate cements,
overgrowthste. wer Cretaceg basin consnes, siltstone
a) Anisotropic grains and pospaces, f) Andissolved por
Journal of the
mpletely sorextural and cese sandstocks in Abu
of Quartzanites and ch
(includingtic particles, g and grris, Bioclas, Argillaceos, Feldspar
eous rocks structed of ces, mudstone
(a)
(c)
(e)
(g)
flattened pore ore spaces, d) Anisotropic zigzares between gra
e Earth and Sp
rted grainscompositionatones. The
El-Gharadigz, Feldsparherts), Micasg zircon)Detrital clay
rain-coating)t, Cements
ous cementsovergrowths
in Abu Elclastic faciese with some
spaces, b) AnisAuthigenic kaoag tortoise, g) Cains with silica o
pace Physics, V
s. al e g r, s, ), y ), s, s, s
l-s, e
shacoatideStuthe crywitspeclaymatspaandpresandolmic
sotropic pores folinite booklets Crystallized illiovergrowths.
Vol. 46, No. 4, W
ale interbeds. astal environe. udies of petr
samples stalline quarh silica a
ecimens consy booklets trix) as detrit
aces (authigend 2-d). Alsosent (calcare
ndstone, calcaostone and crofacies).
filled with claywith some por
ites with pyrite
Winter 2021
Clastic sampnment with t
ographic andare compo
rtz grains cand calcite sist of clay m
dispersed tal cement ornic clay min, some dolo
eous and ferrareous Ferron
glauconite
(b)
(d)
(f)
(h)
y flakes, c) Comres, e) Isotropic
crystals, h) Se
ples depositethe dominati
d SEM showosed of encemented to
cement. minerals (kaowithin the
r embedded anerals) (Figuomitic faciesruginous dolon dolostone,
sandy dolo
mpletely maturec and anisotropecondary intrag
ed in a ion of
w that ntirely gether Some
olinite rock
at pore re 2-b were omitic sandy
ostone
e quartz pic pore granular

Using Electrical Properties of Some Subsurface Sedimentary Rocks as a … 17
The digenetic features represented mainly by cementation and compaction (Figure 2-c, 2-Ee and 2-f). Also, channels and pore spaces are mostly flat, anisotropic and are sometimes lineated in some instances (Figure 2-a, 2-e and 2-f).
4. Results and Discussions The existing research focused on the anisotropic and homogeneity characteristics of some clastic sedimentary rocks. The specimens are composed principally of sand, sandstones, siltstones, clay, calcareous or ferruginous dolomitic sandstone, clastic facies, mudstone and shale, calcareous Ferron dolostone, sandy dolostone and glauconite sandy dolostone microfacies. Electrical characteristics of these clastic sedimentary rocks have resulted from the solution between grains and grain interactions. Generally, the grain anisotropy at samples may be considered slightly to moderate as can be seen in Figure 2. Grain anisotropy is an indicator that the effect of the compaction, perpendicular to the bedding plane, may be nearly the same at the direction of bedding direction. At the dry conditions, the grains differentiated into semiconductors (e.g. clay, ferruginous dolomitic sandstone) and insulators (e.g. sand, sandstones, siltstones and air). Then, the dominant effect at electrical characteristics will be from the conducting part (semiconductors). At the different saturated conditions, the liquid (saline water) will be more conductor (especially, for more saline liquids) than the other components (semiconductor and insulator grains) and accordingly, the pores will be filled with that saline solution (Schwan et al., 1962). The interstitial pore spaces and other semiconductors are the main dominant effects on electrical characteristics (Garrouch, 2001; Garrouch and Sharma, 1994). The distribution of the saline water at the grain pores will be (to a great extent) similar to each other, especially, when the grain shapes are nearly spheroidal. Also, the link between these pores will be through the pore throats. Now, for all these full saturated samples, if the grains are nearly spheres and consequently, the orifices are nearly spheres in shape, then electrical conductivity, at the direction of bedding and perpendicular direction will be roughly similar. While, if
the grains are not spheres, then there will be some differences (minor or significant) in electrical characteristics between the two perpendicular directions. Anisotropy will be an essential factor that we used, a judgment of the anisotropy and heterogeneity degrees of samples. The sand content in these core samples changes from ~ 67.6 to 85.6 %, while, the clay content changes from ~ 11.2 to 24.2 %. The carbonate content is less than 9 %. Bulk density changes from ~1.9 to 2.4 g/cm3. Effective porosity changes from ~4.9 to 22. 6
%. Bulk density ( b ) values, of the clayey
sandstones are relatively higher than usual, which indicate the existence of some heavy iron oxides (ferruginous dolomitic sandstone). The electrical conductivity of samples increases with increasing saline saturation degree and increase with increasing frequency. Electrical conductivity is low at the dry condition and increases gradually with the increase of the three different salines (NaCl) concentrations (9 k ppm, 30 k ppm and 90 k ppm). Figures 3 to 12 show dielectric constant and conductivity of measured samples in horizontal (bedding plane direction H) and vertical (perpendicular to the bedding plane V) directions. There exists a general increase of conductivity, at measured samples, with the rise in frequency (in the two perpendicular directions), in bedding plane direction and perpendicular to the bedding plane directions (Gomaa et al., 2015). The increase of conductivity, at the dry condition, is speedy and its value saturates slowly with the growth of degree of salinity ( 9 k ppm, 30 k ppm and 90 k ppm ), see Figures 3 to 12. The increase of frequency increases the excitation of charge carriers across the energy gaps that will increase the continuous conduction paths and accordingly increases the conductivity. The conductivity values, of all the samples, in bedding direction and perpendicular to bedding direction, at relatively low frequency, ranges from ~ 510 to 710 . The conductivity values at relatively high-frequency range from ~ 3102 to ~
3108 , at the perpendicular direction to

18 Journal of the Earth and Space Physics, Vol. 46, No. 4, Winter 2021
bedding. Besides, it ranges from ~ 3106
to ~ 2102 , at the direction of bedding . These conductivity values show that the samples behave as semiconductor specimens and the dispersed clay, or ferruginous dolomitic sandstone or other conducting components in these samples are coating relatively high concentrations of insulator components (e.g. sand, sandstones, siltstones and air) (Abou El-Anwar and Gomaa, 2013) . The slight small variations of conductivity values, between the different samples, in bedding plane direction and perpendicular to the bedding plane, are a piece of clear evidence that they are homogeneous and isotropic (Figure 3). There exists a general decrease of dielectric constant, of the measured samples, with the increase of frequency (Figure 3), in bedding plane directions and perpendicular to the bedding plane directions . The decrease, at the dry condition case, is expeditious and decreases more gently, at other three saturations, with the increase of the degree of salinity ( 9 k ppm, 30 k ppm and 90 k ppm ) (see Figures 3 to 12). The rise of frequency motivates charge carriers to be excited and jump across the energy gaps. Increase in frequency rate will lead to the decrease of the continuous conduction paths and accordingly decreases the dielectric constant. The dielectric constant values (at the dry condition case) of all the samples, in bedding direction and perpendicular to bedding directions, at relatively low frequency, ranges from ~ 30 to 240. The dielectric constant values at a relatively high-frequency range from ~ 12 to 25 . The slight small variations, of dielectric constant between the different samples in bedding plane direction and perpendicular to the bedding plane is a perfect indicator or evidence that the samples are homogeneous and isotropic (Figure 3) (Abou Elanwar and Gomaa, 2013). The slight variations in conductivity and dielectric constant are related to the change at conductor and insulator concentration at samples. Also, the difference in conductivity and dielectric constant values, for the same specimen, in bedding plane direction and at the vertical plane direction, may be due to the slight variation of texture (grain anisotropy
direction and dead ends of pore throats). Three slopes of conductivity with the frequency are shown at dry condition, for all the samples. Also, all the curves are the of measured values at two perpendicular directions of measurements (Figures 3 to 12). The first slope (at low frequency) has resulted from the DC conduction in the specimen, and it has a slope of nearly zero. The second slope, the intermediate one, is due to the increase of charge carrier conduction due to the frequency increase, and it has a slope of nearly 0.6-0.75. The third slopes are related to high-frequency ranges above 100 kHz, and it has a slope of almost 0.5. For the other three different salines (NaCl) saturation (9 k ppm, 30 k ppm and 90 k ppm), there are only two slopes but with less gentle slope than the other related hills at dry conditions. Three slopes of dielectric constant with frequency shown at the dry condition for all the samples and all the curves for two directions of measurements (Gomaa and Kassab, 2016; Knight and Endres, 1990; Knight and Nur, 1987). The first slope is resulted from the DC conduction (nearly flat), and it has a slope of almost zero. The second slope, the intermediate one, is due to the increase of charge carriers that reaches the end of the broken paths due to the rise in frequency, and it has a slope of nearly 0.3. The third slope is related to the relatively high-frequency range when the charge carriers reach their maximum values, and it has a slope of nearly zero. For the other three different salines (NaCl) saturation (9 k ppm, 30 k ppm and 90 k ppm), there are only two slopes (the first DC nearly disappear) but with more gentle slopes than of the other comparable slopes at dry condition (Gomaa and Abou El-Anwar, 2017; Glover et al., 1994) . We measured electrical characteristics at two directions (in bedding plane direction and perpendicular to the bedding plane ). From these measurements, we can try to predict the homogeneity or heterogeneity and isotropy or anisotropy from the measured electrical characteristics (dielectric constant and conductivity and the impedance used also). When the specimens are homogeneous and isotropic, electrical characteristics at two perpendicular directions will be nearly

Using Electrical Properties of Some Subsurface Sedimentary Rocks as a … 19
similar (the same behaviour and almost the same values). There will be a clear difference when there exists a significant change in the shape anisotropy and size of the grains in a particular direction (Saarenketo, 1998). The elongation of the sample grains in a specific direction will affect electrical characteristics, which will be an indication of the anisotropy and heterogeneity of that specimen. Degree of symmetry at a sample will be the essential factor in electrical properties, especially at the dry condition. Of course, these changes are qualitative, but it used as a quick tool for that test. These changes may show significant differences in bedding direction or a vertical direction of bedding according to the degree of homogeneity of the same samples. Generally, all the conductivity values for all the samples (in the low-frequency range), at the three different salinity (NaCl) saturation (9 k ppm, 30 k ppm and 90 k ppm) range
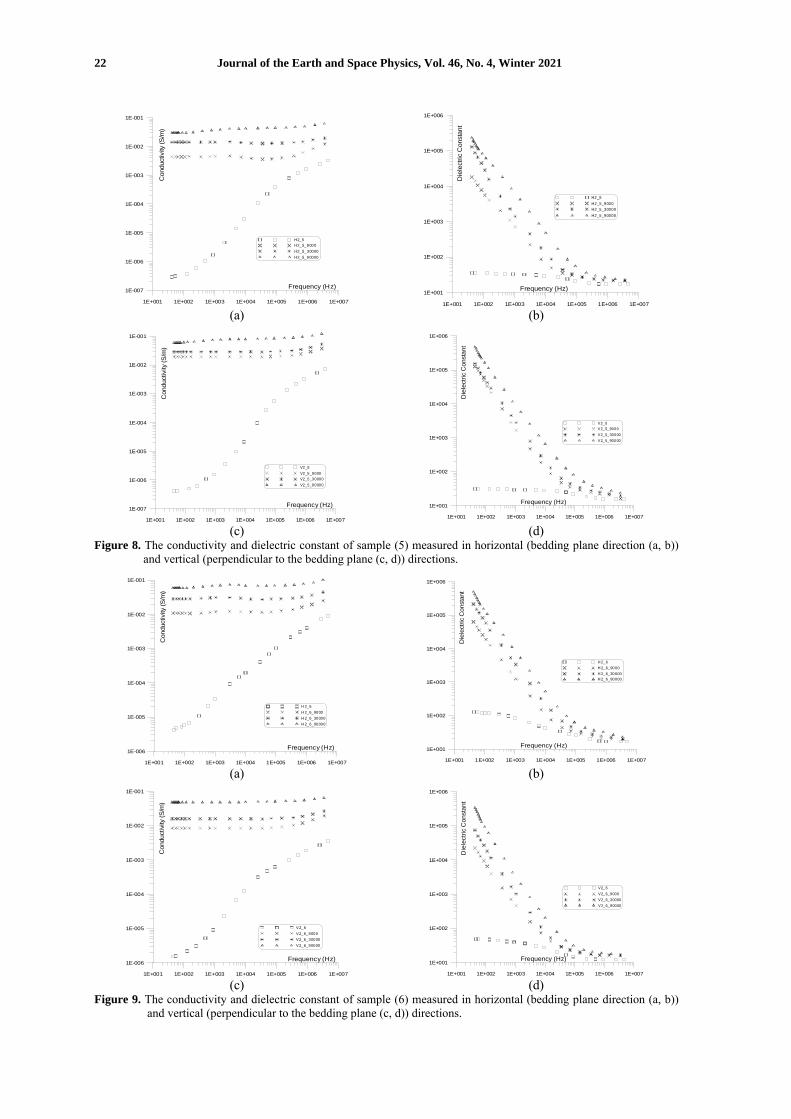
from ~ 110 to 210 (Gomaa et al., 2018). Comparing the dry cases and the different saline (NaCl) saturation (9 k ppm, 30 k ppm and 90 k ppm), Figures 3 to 12, we can see clearly that electrical characteristics are nearly the same with tiny changes in electrical values of the conductivity and dielectric constant. The general trends of all the curves are virtually identical, that means that the samples, to a great extent, are homogeneous and isotropic. Curves are classified to three groups according to the values of conductivity. Samples 1 and 6 have high conductivity values, samples 2, 3, 7, 9, and 11 have moderate conductivity values, and samples 4 and 5 have low conductivity values. Samples were chosen to show the anisotropy of the samples according to the direction of the bedding, so the behavior of them is the same for the direction of bedding or perpendicular to the bedding plain.
1E+001 1E+002 1E+003 1E+004 1E+005 1E+006 1E+007
Frequency (Hz)1E-007
1E-006
1E-005
1E-004
1E-003
1E-002
1E-001
Con
duct
ivity
(S/m
)
H2_1H2_2H2_3H2_4H2_5H2_6H2_7H2_9H2_11
1E+001 1E+002 1E+003 1E+004 1E+005 1E+006 1E+007
Frequency (Hz)1E+001
1E+002
1E+003D
iele
ctric
con
stan
t
H2_1H2_2H2_3H2_4H2_5H2_6H2_7H2_9H2_11
(a)
(b)
1E+001 1E+002 1E+003 1E+004 1E+005 1E+006 1E+007
Frequency (Hz)1E-008
1E-007
1E-006
1E-005
1E-004
1E-003
1E-002
Con
duct
ivity
(S/m
)
V2_1V2_2V2_3V2_4V2_5V2_6V2_7V2_9V2_11
1E+001 1E+002 1E+003 1E+004 1E+005 1E+006 1E+007
Frequency (Hz)1E+001
1E+002
1E+003
Die
lect
ric c
onst
ant
V2_1V2_2V2_3V2_4V2_5V2_6V2_7V2_9V2_11
(c) (d)
Figure 3. The conductivity and dielectric constant of samples measured (dry) in horizontal (bedding plane direction (a, b)) and vertical (perpendicular to the bedding plane (c, d)) directions.

20 Journal of the Earth and Space Physics, Vol. 46, No. 4, Winter 2021
1E+001 1E+002 1E+003 1E+004 1E+005 1E+006 1E+007
Frequency (Hz)1E-006
1E-005
1E-004
1E-003
1E-002
1E-001
Con
duct
ivity
(S/m
)
H 2_1H 2_1_9000H 2_1_30000H 2_1_90000
1E+001 1E+002 1E+003 1E+004 1E+005 1E+006 1E+007
Frequency (Hz)1E+001
1E+002
1E+003
1E+004
1E+005
1E+006
Die
lect
ric c
onst
ant
H 2_1H 2_1_9000H 2_1_30000H 2_1_90000
(a)
(b)
1E+001 1E+002 1E+003 1E+004 1E+005 1E+006 1E+007
Frequency (Hz)1E-006
1E-005
1E-004
1E-003
1E-002
1E-001
Con
duct
ivity
(S/m
)
V2_1V2_1_9000V2_1_30000V2_1_90000
1E+001 1E+002 1E+003 1E+004 1E+005 1E+006 1E+007
Frequency (Hz)1E+001
1E+002
1E+003
1E+004
1E+005
1E+006
Die
lect
ric C
onst
ant
V2_1V2_1_9000V2_1_30000V2_1_90000
(c) (d)
Figure 4. The conductivity and dielectric constant of sample (1) measured in horizontal (bedding plane direction (a, b)) and vertical (perpendicular to the bedding plane (c, d)) directions.
1E+001 1E+002 1E+003 1E+004 1E+005 1E+006 1E+007
Frequency (Hz)1E-007
1E-006
1E-005
1E-004
1E-003
1E-002
1E-001
Con
duct
ivity
(S/m
)
H2_2H2_2_9000H2_2_30000H2_2_90000
1E+001 1E+002 1E+003 1E+004 1E+005 1E+006 1E+007
Frequency (Hz)1E+001
1E+002
1E+003
1E+004
1E+005
1E+006
Die
lect
ric c
onst
ant
H2_2H2_2_9000H2_2_30000H2_2_90000
(a)
(b)
1E+001 1E+002 1E+003 1E+004 1E+005 1E+006 1E+007
Frequency (Hz)1E-006
1E-005
1E-004
1E-003
1E-002
1E-001
Con
duct
ivity
(S/m
)
V2_2V2_2_9000V2_2_30000V2_2_90000
1E+001 1E+002 1E+003 1E+004 1E+005 1E+006 1E+007
Frequency (Hz)1E+001
1E+002
1E+003
1E+004
1E+005
1E+006
Die
lect
ric C
onst
ant
V2_2V2_2_9000V2_2_30000V2_2_90000
(c) (d)
Figure 5. The conductivity and dielectric constant of sample (2) measured in horizontal (bedding plane direction (a, b)) and vertical (perpendicular to the bedding plane (c, d)) directions.

Using Electrical Properties of Some Subsurface Sedimentary Rocks as a … 21
1E+001 1E+002 1E+003 1E+004 1E+005 1E+006 1E+007
Frequency (Hz)1E-007
1E-006
1E-005
1E-004
1E-003
1E-002
1E-001
Con
duct
ivity
(S/m
)
H2_3H2_3_9000H2_3_30000H2_3_90000
1E+001 1E+002 1E+003 1E+004 1E+005 1E+006 1E+007
Frequency (Hz)1E+001
1E+002
1E+003
1E+004
1E+005
1E+006
Die
lect
ric c
onst
ant
H2_3H2_3_9000H2_3_30000H2_3_90000
(a)
(b)
1E+001 1E+002 1E+003 1E+004 1E+005 1E+006 1E+007
Frequency (Hz)1E-006
1E-005
1E-004
1E-003
1E-002
1E-001
Con
duct
ivity
(S/m
)
V2_3V2_3_9000V2_3_30000V2_3_90000
1E+001 1E+002 1E+003 1E+004 1E+005 1E+006 1E+007
Frequency (Hz)1E+002
1E+003
1E+004
1E+005
1E+006
1E+007
Die
lect
ric C
onst
ant
V2_3V2_3_9000V2_3_30000V2_3_90000
(c) (d) Figure 6. The conductivity and dielectric constant of sample (3) measured in horizontal (bedding plane direction (a, b))
and vertical (perpendicular to the bedding plane (c, d)) directions.
1E+001 1E+002 1E+003 1E+004 1E+005 1E+006 1E+007
Frequency (Hz)1E-007
1E-006
1E-005
1E-004
1E-003
1E-002
1E-001
Con
duct
ivity
(S/m
)
H2_4H2_4_9000H2_4_30000H2_4_90000
1E+001 1E+002 1E+003 1E+004 1E+005 1E+006 1E+007
Frequency (Hz)1E+001
1E+002
1E+003
1E+004
1E+005
1E+006
Die
lect
ric C
onst
ant
H2_4H2_4_9000H2_4_30000H2_4_90000
(a)
(b)
1E+001 1E+002 1E+003 1E+004 1E+005 1E+006 1E+007
Frequency (Hz)1E-008
1E-007
1E-006
1E-005
1E-004
1E-003
1E-002
1E-001
Con
duct
ivity
(S/m
)
V2_4V2_4_9000V2_4_30000V2_4_90000
1E+001 1E+002 1E+003 1E+004 1E+005 1E+006 1E+007
Frequency (Hz)1E+001
1E+002
1E+003
1E+004
1E+005
1E+006
Die
lect
ric C
onst
ant
V2_4V2_4_9000V2_4_30000V2_4_90000
(c) (d) Figure 7. The conductivity and dielectric constant of sample (4) measured in horizontal (bedding plane direction (a, b))
and vertical (perpendicular to the bedding plane (c, d)) directions.
22 Journal of the Earth and Space Physics, Vol. 46, No. 4, Winter 2021
1E+001 1E+002 1E+003 1E+004 1E+005 1E+006 1E+007
Frequency (Hz)1E-007
1E-006
1E-005
1E-004
1E-003
1E-002
1E-001
Con
duct
ivity
(S/m
)
H2_5H2_5_9000H2_5_30000H2_5_90000
1E+001 1E+002 1E+003 1E+004 1E+005 1E+006 1E+007
Frequency (Hz)1E+001
1E+002
1E+003
1E+004
1E+005
1E+006
Die
lect
ric C
onst
ant
H2_5H2_5_9000H2_5_30000H2_5_90000
(a)
(b)
1E+001 1E+002 1E+003 1E+004 1E+005 1E+006 1E+007
Frequency (Hz)1E-007
1E-006
1E-005
1E-004
1E-003
1E-002
1E-001
Con
duct
ivity
(S/m
)
V2_5V2_5_9000V2_5_30000V2_5_90000
1E+001 1E+002 1E+003 1E+004 1E+005 1E+006 1E+007
Frequency (Hz)1E+001
1E+002
1E+003
1E+004
1E+005
1E+006
Die
lect
ric C
onst
ant
V2_5V2_5_9000V2_5_30000V2_5_90000
(c) (d)
Figure 8. The conductivity and dielectric constant of sample (5) measured in horizontal (bedding plane direction (a, b)) and vertical (perpendicular to the bedding plane (c, d)) directions.
1E+001 1E+002 1E+003 1E+004 1E+005 1E+006 1E+007
Frequency (Hz)1E-006
1E-005
1E-004
1E-003
1E-002
1E-001
Con
duct
ivity
(S/m
)
H 2_6H 2_6_9000H 2_6_30000H 2_6_90000
1E+001 1E+002 1E+003 1E+004 1E+005 1E+006 1E+007
Frequency (Hz)1E+001
1E+002
1E+003
1E+004
1E+005
1E+006
Die
lect
ric C
onst
ant
H 2_6H 2_6_9000H 2_6_30000H 2_6_90000
(a)
(b)
1E+001 1E+002 1E+003 1E+004 1E+005 1E+006 1E+007
Frequency (Hz)1E-006
1E-005
1E-004
1E-003
1E-002
1E-001
Con
duct
ivity
(S/m
)
V2_6V2_6_9000V2_6_30000V2_6_90000
1E+001 1E+002 1E+003 1E+004 1E+005 1E+006 1E+007
Frequency (Hz)1E+001
1E+002
1E+003
1E+004
1E+005
1E+006
Die
lect
ric C
onst
ant
V2_6V2_6_9000V2_6_30000V2_6_90000
(c) (d)
Figure 9. The conductivity and dielectric constant of sample (6) measured in horizontal (bedding plane direction (a, b)) and vertical (perpendicular to the bedding plane (c, d)) directions.

Using Electrical Properties of Some Subsurface Sedimentary Rocks as a … 23
1E+001 1E+002 1E+003 1E+004 1E+005 1E+006 1E+007
Frequency (Hz)1E-006
1E-005
1E-004
1E-003
1E-002
1E-001
Con
duct
ivity
(S/m
)
H 2_7H 2_7_9000H 2_7_30000H 2_7_90000
1E+001 1E+002 1E+003 1E+004 1E+005 1E+006 1E+007
Frequency (Hz)1E+001
1E+002
1E+003
1E+004
1E+005
1E+006
Die
lect
ric C
onst
ant
H 2_7H 2_7_9000H 2_7_30000H 2_7_90000
(a)
(b)
1E+001 1E+002 1E+003 1E+004 1E+005 1E+006 1E+007
Frequency (Hz)1E-006
1E-005
1E-004
1E-003
1E-002
1E-001
Con
duct
ivity
(S/m
)
V2_7V2_7_9000V2_7_30000V2_7_90000
1E+001 1E+002 1E+003 1E+004 1E+005 1E+006 1E+007
Frequency (Hz)1E+001
1E+002
1E+003
1E+004
1E+005
1E+006
Die
lect
ric C
onst
ant
V2_7V2_7_9000V2_7_30000V2_7_90000
(c) (d) Figure 10. The conductivity and dielectric constant of sample (7) measured in horizontal (bedding plane direction (a, b))
and vertical (perpendicular to the bedding plane (c, d)) directions.
1E+001 1E+002 1E+003 1E+004 1E+005 1E+006 1E+007
Frequency (Hz)1E-007
1E-006
1E-005
1E-004
1E-003
1E-002
1E-001
1E+000
Con
duct
ivity
(S/m
)
H 2_9H 2_9_9000H 2_9_30000H 2_9_90000
1E+001 1E+002 1E+003 1E+004 1E+005 1E+006 1E+007
Frequency (Hz)1E+001
1E+002
1E+003
1E+004
1E+005
1E+006
Die
lect
ric C
onst
ant
H 2_9H 2_9_9000H 2_9_30000H 2_9_90000
(a)
(b)
1E+001 1E+002 1E+003 1E+004 1E+005 1E+006 1E+007
Frequency (Hz)1E-006
1E-005
1E-004
1E-003
1E-002
1E-001
1E+000
Con
duct
ivity
(S/m
)
V2_9V2_9_9000V2_9_30000V2_9_90000
1E+001 1E+002 1E+003 1E+004 1E+005 1E+006 1E+007
Frequency (Hz)1E+001
1E+002
1E+003
1E+004
1E+005
1E+006
Die
lect
ric C
onst
ant
V2_9V2_9_9000V2_9_30000V2_9_90000
(c) (d) Figure 11. The conductivity and dielectric constant of sample (9) measured in horizontal (bedding plane direction (a, b))
and vertical (perpendicular to the bedding plane (c, d)) directions.

24 Journal of the Earth and Space Physics, Vol. 46, No. 4, Winter 2021
1E+001 1E+002 1E+003 1E+004 1E+005 1E+006 1E+007
Frequency (Hz)1E-007
1E-006
1E-005
1E-004
1E-003
1E-002
1E-001
1E+000
Con
duct
ivity
(S/m
)
H 2_11H 2_11_9000H 2_11_30000H 2_11_90000
1E+001 1E+002 1E+003 1E+004 1E+005 1E+006 1E+007
Frequency (Hz)1E+001
1E+002
1E+003
1E+004
1E+005
1E+006
Die
lect
ric C
onst
ant
H 2_11H 2_11_9000H 2_11_30000H 2_11_90000
(a)
(b)
1E+001 1E+002 1E+003 1E+004 1E+005 1E+006 1E+007
Frequency (Hz)1E-007
1E-006
1E-005
1E-004
1E-003
1E-002
1E-001
1E+000
Con
duct
ivity
(S/m
)
V2_11V2_11_9000V2_11_30000V2_11_90000
1E+001 1E+002 1E+003 1E+004 1E+005 1E+006 1E+007
Frequency (Hz)1E+001
1E+002
1E+003
1E+004
1E+005
1E+006
Die
lect
ric c
onst
ant
V2_11V2_11_9000V2_11_30000V2_11_90000
(c) (d)
Figure 12. The conductivity and dielectric constant of sample (11) measured in horizontal (bedding plane direction (a, b)) and vertical (perpendicular to the bedding plane (c, d)) directions.
5. Conclusion The Cretaceous rocks were sampled and studied from Abu El-Gharadig basin western desert, Egypt. Electrical characteristics were measured perpendicular and parallel to layer directions to detect rank of anisotropy (or isotropy) and homogeneity (or heterogeneity) of samples (in frequency range of 42 Hz- 5 MHz). Electrical characteristics of samples measured at the dry state and three different salines (NaCl) concentrations, 9 k ppm, 30 k ppm and 90 k ppm, at a constant temperature. This method is used as a new and quick tool for the detection of anisotropy (or isotropy) and homogeneity (or heterogeneity) using electrical characteristics measurements. There were some slight changes in electrical components due to some minor deformations in the grain size and shape besides the conducting paths (throats) of samples. Electrical characteristics are dependent, to a great extent, on the charge carrier concentration and mobility of them between
electrodes. From all the specimens, the average values of electrical characteristics (measured in the two perpendicular directions) are nearly the same. The slight differences in electrical components may be negligible. Most of the grains are spherical, and the electrical characteristics show almost the same behaviour in the two directions. Same electrical behaviour means that samples are homogeneous and isotropic. If the grains are needles or disks, then, electrical characteristics will change in the different perpendicular directions. The dielectric constant decreases with the decrease of broken conduction paths. The dielectric constant decreases the accumulation of charges at the ends of conducting clusters. Significant changes may be found at electrical characteristics when there exists a big difference in the grain shape or anisotropy, in a specific direction. This method is a quick trial to detect the anisotropy and homogeneity of the samples qualitatively by measuring their electrical characteristics in
Using Electrical Properties of Some Subsurface Sedimentary Rocks as a … 25
many directions. The anisotropy in studied samples is characterized by slight to moderate electric variation (slight lineation and foliation). References Abou El-Anwar, E.A. and Gomaa, M.M.,
2013, Electrical properties and geochemistry of carbonate rocks from the Qasr El-Sagha formation, El-Faiyum, Egypt. Geophysical Prospecting, 61, 630–644.
Abraitis, P.K., Pattrick, R.A. and Vaughan, D.J., 2004, Variations in the compositional, textural and electrical properties of natural pyrite: a review. International Journal of Mineral Processing, 74, 41–59.
Bayoumi, A.I. and Lotfy, H.I., 1989, Modes of structural evolution of Abu Gharadig basin, Western desert of Egypt as deduced from seismic data. Journal of African Earth Science, 9(2), 273-287.
Chelidze, T. and Guéguen, Y., 1999, Electrical spectroscopy of porous rocks: a review -I. Theoretical models. Geophysical Journal International, 137, 1–15.
Chelidze, T. Guéguen, Y. and Ruffet, C., 1999, Electrical spectroscopy of porous rocks: a review -II. Experimental results and interpretation. Geophysical Journal International, 137, 16-34.
Dakhanova, N.V., 1977, Determinations of the petrophysical properties of samples, In Russian, Nedra, Moscow, 19-59.
Garrouch, A.A. and Sharma, M.M., 1994, The influence of clay content, salinity, stress and wettability on the dielectric properties of brine-saturated rocks: 10 Hz to 10 MHz. Geophysics, 137, 909–917.
Garrouch, A.A., 2001, Effect of wettability and water saturation on the dielectric constant of hydrocarbons rocks, 41st Annual Logging Symp. (SPWLA), paper NN.
Glover, P.W.J., Meredith, P.G., Sammonds P. R. and Murrel S. A. F., 1994, Ionic surface electrical conductivity in sandstone. Journal of geophysical Research, 99(B11), 21 635–21 650.
Gomaa, M.M., 2008, Relation between electric properties and water saturation for hematitic sandstone with frequency.
Annals of Geophysics, 51(5/6), 801-811. Gomaa, M.M., 2009, Saturation effect on
electrical properties of hematitic sandstone at audio frequency domain using non-polarizing electrodes. Geophysical Prospecting, 57, 1091–1100.
Gomaa, M.M., 2013, Forward and inverse modeling of the electrical properties of magnetite intruded by magma, Egypt. Geophysical Journal International, 194(3), 1527-1540.
Gomaa, M.M., Abou El-Anwar, E., 2015, Electrical and geochemical properties of tufa deposits as related to mineral composition in South Western Desert, Egypt. Journal of Geophysics and Engineering, 12(3), 292-302.
Gomaa, M.M. and Abou El-Anwar, E., 2017, Electrical, mineralogical, and geochemical properties of Um Gheig and Um Bogma Formations, Egypt. Carbonates and Evaporites, 1-14, https://doi.org/10.1007/s13146-017-0370-5.
Gomaa, M.M. and Elsayed, M., 2009, Thermal Effect of Magma Intrusion on Electrical Properties of Magnetic Rocks from Hamamat Sediments, NE Desert, Egypt. Geophysical Prospecting, 57(1), 141-149.
Gomaa M. M., Elnasharty, M. and Rizo, E., 2019, Electrical properties speculation of contamination by water and gasoline on sand and clay composite, Arabian Journal of Geosciences, Vol. 12, in print. https://doi.org/10.1007/s12517-019-4767-4.
Gomaa, M.M. and Kassab, M., 2016, Pseudo random renormalization group forward and inverse modeling of the electrical properties of some carbonate rocks. Journal of Applied Geophysics, Vol. 135, 144- 154.
Gomaa, M.M., Kassab, M. and El-Sayed, N.A., 2015, Study of electrical properties and petrography for carbonate rocks in the Jurassic Formations: Sinai Peninsula, Egypt. Arabian Journal of Geosciences, 8(7), 4627-4639.
Gomaa, M.M., Metwally, H. and Melegy, A., 2018, Effect of concentration of salts on electrical properties of sediments, Lake Quaroun, Fayium, Egypt. Carbonates and Evaporites, 1-9, https://doi.org/ 10.1007/
26 Journal of the Earth and Space Physics, Vol. 46, No. 4, Winter 2021
s13146-018-0433-2. Gomaa, M.M. and Alikaj, P., 2009, Effect of
electrode contact impedance on a. c. electrical properties of wet hematite sample. Marine Geophysical researches, 30(4), 265-276.
Gomaa, M.M., Shaltout, A., Boshta, M., 2009, Electrical properties and mineralogical investigation of Egyptian iron ore deposits. Materials Chemistry and Physics, 114( 1), 313-318.
Ireland, H.A., 1958, Insoluble residues: In surface geology and petroleum exploration, J. D. Haun and L. W. LeRoy (Eds.), Colorado School of Mines, pp. 75-94.
Knight, R.J. and Endres, A.L., 1990, A new concept in modeling the dielectric response of sandstones: Defining a wetted rock and bulk water system. Geophysics, 55, 586-594.
Knight, R.J. and Nur, A., 1987, The dielectric constant of sandstones, 50 kHz to 4 MHz. Geophysics, 52, 644-654.
Louis, L., David, C. and Robion, P., 2003, Comparison of the anisotropic behaviour of reservoir rocks under dry and wet
conditions. Tectonophysics, 370(1-4), 193-212.
Mendelson, K.S. and Cohen, M.H., 1982, The effect of grain anisotropy on the electrical properties of sedimentary rocks. Geophysics, 47(2), 257-263.
Pridmore, D.F. and Shuey, R.T., 1976, The electrical resistivity of galena, pyrite, and chalcopyrite. American Mineralogist, 61, 248–259.
Saarenketo, T., 1998, Electrical properties of water in clay and silty soils. Journal of Applied Geophysics, 40, 73–88.
Schwan, H.P., Schwarz, G., Maczuk, J. and Pauly, H., 1962, On the low-frequency dielectric dispersion of colloidal particles in electrolyte solution. Journal of Physical Chemistry, 66, 2626-2635.
Shaltout, A.A., Gomaa, M.M. and Wahbe, M., 2012, Utilization of standard-less analysis algorithms using WDXRF and XRD for Egyptian Iron Ores identification. X-Ray Spectrometry, 41, 355-362.
Shuey, R.T., 1975, Semiconducting Ore Minerals. Elsevier Publishing Co., Amsterdam.