Embed Size (px)
Citation preview

1
USING DETAILED 2D URBAN FLOODPLAIN MODELLING TO INFORM DEVELOPMENT PLANNING IN MISSISSAUGA, ON P. Delaney1, Y. Qiao1, T. Mereu2, N. Lorrain3
1. DHI Water and Environment, Cambridge, ON 2. MMM Group, Thornhill, ON 3. Toronto and Region Conservation Authority, Toronto, ON ABSTRACT: The city of Mississauga has recently identified strategic growth areas where investments will be targeted for redevelopment and intensification projects. One of the growth areas has a history of flooding during major storm events. In order to redevelop this area, businesses and land owners need to prepare development proposals ensuring that appropriate flood proofing requirements have been achieved and emergency management plans have been prepared. Although the area had previously been included in an update to the regulatory floodplain mapping, the one-dimensional (1D) model that was used to map the floodplain was not capable of representing the complex overland flow within the study area. Therefore, the Toronto Region Conservation Authority determined that a more detailed two-dimensional (2D) hydraulic model was required to refine the floodplain mapping for this area. MIKE FLOOD was selected for the modelling because it couples a 1D channel flow model (MIKE 11) with a 2D overland flow model (MIKE 21). This approach was advantageous because it could leverage the existing 1D HEC-RAS model to prepare a MIKE 11 model for the 1D channel flow in Little Etobicoke Creek and then model the overland flooding using the 2D MIKE 21 model. This approach provided the ability to accurately represent the depths and velocities of flooding in the streets, on properties, and around buildings. The resultant model was used to run different storm events such as 5-year, 50-year, 350-year and regional flow for the existing condition where a flood wall and flood protection berm were included in the model. Similar models were also run for 350-year and regional flow events for the condition without flood wall and the berm in order to determine the current level of flood protection being provided, and to meet regulatory floodplain mapping requirements. The model is also being used to evaluate the effectiveness of the proposed flood proofing and flood mitigation plans. The updated flood constraint mapping will also provide guidance to local, regional and provincial government agencies as well as private sectors in managing and planning existing and future developments throughout the study area. Keywords: floodplain mapping, flood protection, two-dimensional flood modelling, MIKE FLOOD 1. INTRODUCTION Toronto Region Conservation Authority (TRCA) is in the process of updating floodline mapping for watercourses within the Etobicoke Creek watershed, including Little Etobicoke Creek. While the standard one-dimensional (1D) HEC-RAS program is adequate for most of the watershed, the flood regime through
22nd Canadian Hydrotechnical Conference
22e Conférence canadienne d’hydrotechnique
Water for Sustainable Development : Coping with Climate and Environmental Changes
L’eau pour le développement durable: adaptation aux changements du climat et de l’environnement
Montreal, Quebec, April 29 – May 2, 2015 / Montréal, Québec, 29 avril – 2 mai 2015

2
the Dixie and Dundas Special Policy Area (SPA) and Applewood SPA in Mississauga are quite complex and warrant a 2D modelling approach. Specifically, Little Etobicoke Creek overtops its banks at multiple locations through the study area. Special Policy Areas represent existing flood prone development, and are intended to strike a balance between flood protection and maintaining the economic viability of community. As such, development is allowed within an SPA subject to a number of constraints related to both flood protection and safe access/egress. The limits of the Dixie/Dundas SPA and the Applewood SPA are illustrated in Figure 1 along with the limits of the Regulatory floodplain as defined in the previous HEC-RAS modelling study
Figure 1 : Map of study area
The objective of the study was to develop a 2D hydraulic model of Little Etobicoke Creek to map flooding conditions within the Dixie/Dundas SPA and Applewood SPA for selected flood events, and to use the model to complete a preliminary evaluation of flood mitigation alternatives. Results from the study will provide input to private business sectors and landowners for preparing development proposals which are required to include flood proofing and mitigation, as well as emergency response plans for the area. The updated flood constraint mapping is providing guidance to local, regional and provincial government agencies as well as private sector developers in managing and planning existing and future developments. 2. 2D URBAN FLOODPLAIN MODEL DEVELOPMENT The modelling prepared for previous floodplain mapping for these SPA’s was primarily focussed on the representation of flows in the channel of Little Etobicoke Creek. Although the previous floodplain mapping study indicated that flooding would occur and spill into the adjacent developed urban areas, it did not provide
SPILLING ONTO QUEEN FREDERICA DR
SPILLING ONTO DIXIE RD
PEDESTRIAN BRIDGES
3
any indication of where the flooding would go, how deep it would be, or how fast it would flow or whether it would represent a potential hazard. In order to meet the requirements of developing within the SPAs, a better characterization of the extent and severity of flooding in this area was required. TRCA chose an integrated 1D and 2D flood modelling approach using MIKE FLOOD since it was capable of simulating 1D flow in the main channel (using MIKE 11) and 2D flow in the overbank areas (using MIKE 21). The workflow for the development of the 2D urban floodplain model proceeded as follows:
Model selection
Preparation and verification of updated base mapping developed using LiDAR
Verification of 1D MIKE 11 model of Little Etobicoke Creek against an updated HEC-RAS model
Development of integrated 1D-2D MIKE FLOOD model for Little Etobicoke Creek
Validation of the MIKE FLOOD model using the flood event of July 8 2014
Application of MIKE FLOOD to generate flood elevations and flow patterns for the Regional Storm and design storms with return periods ranging from 2-years to 100-years
Summary of updated flood hazard mapping
Preliminary assessment of remedial options to reduce food risk in the two SPAs Each step of this workflow is described in more detail in the following sections. 2.1. Model Selection The selection of modelling software was based on the need to more accurately capture the two-dimensional nature of overland flow throughout the study area. Although previous flood mapping studies had identified potential overbank flooding at two locations, the flood map simply indicates an open floodline with an arrow pointing in the direction of spilling. Due to the anticipated complex nature of the overland flow through a highly urbanized areas, it was determined that the standard HEC-RAS 1D modelling approach is not suitable. TRCA selected MIKE FLOOD because it provides a dynamic coupling between a 1D river flow model and a fully 2D overland flow model. The advantage of using a coupled 1D-2D flood model is that it maintains a highly accurate representation of 1D flow, including bridge structures, along the main channel(s) while the overbank flow is handled by a fully hydrodynamic 2D flow model with highly resolved topography. In urban settings the topography is highly engineered but generally very flat, whereby even subtle changes in topography can have significant influences on the nature and extent of flooding. In addition, a fully hydrodynamic 2D solution is important in order to capture the flooding caused by momentum and wave propagation during a flood event. With so many major development decisions and designs relying on floodline delineation, it is critical to be able to represent the topography with as much accuracy and resolution as possible. The advantage of using MIKE FLOOD was that it facilitated a representation of the overbank topography using 2x2 m grid cells to accurately represent flow between closely spaced buildings as well as flow in the streets (between curb lines), and flow along engineered drainage pathways. The other advantage of using MIKE FLOOD is that it is able to provide a highly resolved coupling of the 1D channel to the 2D overland flow model along the channel banks. One of the challenges of coupling a 1D river model and 2D overland flow model is that 1D river models usually have a much more coarse discretization with cross-sections spacing of 50 – 500 m, or more, depending on the scale of the model (the original HEC-RAS model for the study are used cross-sections spaced 100 – 150 m apart). This discrepancy in grid spacing between the 1D model and the 2D model makes it difficult to know where and how to distribute flow from the 1D model to the 2D model without over-loading one specific location. With MIKE FLOOD the link between the 1D model and the 2D model is digitized along the entire length of the bank of the 1D model and a weir equation is used provide a two-way exchange of flows along the bank. This approach is important because it allows overbank flows from the 1D river model to be properly distributed to many 2D model grid cells along the banks of the channel.
4
2.2. Preparation and Verification of Updated Base Mapping Due to the engineered surfaces and drainage courses in a highly developed area, 2D urban floodplain modelling and mapping requires high resolution and very accurate topographic data in order to provide reliable and accurate estimates of the overland flow depths, velocities and extents of flooding. As such TRCA determined that topographic information used to define the model would be based on Light Illuminated Detection and Ranging (LiDAR), which is an enhancement over topographic information used to define the previous HEC-RAS model, and floodplain mapping for the area. The LIDAR data for this study was collected and produced in November of 2012. The accuracy required for this project was 10 cm Root Mean Square Error (RMSE). The results of the ground truthing showed an RMSE of just less than 5 cm. The accuracy at the 2-sigma confidence level (95% of the time) is twice the RMSE value. Therefore the data shows that vertical accuracy is within 10 cm 95% of the time, which exceeds TRCA’s current mapping specification. 2.3. Verification of the 1D MIKE 11 model of Little Etobicoke Creek Since the integrated 1D and 2D modelling approach was still relatively new to TRCA at the time of this study, it was decided that the MIKE 11 model should be verified against the HEC-RAS model. In the absence of any monitoring data for this water course, the purpose of the verification was to provide confidence that the MIKE 11 model was capable of reasonably replicating the results from previous flood studies. The HEC-RAS model was converted to a MIKE 11 model using a standard conversion utility. Although the conversion tool automates the conversion of the river topology, cross-section geometry and roughness values, the resulting MIKE 11 model still requires some additional editing to complete the model setup to update the chainage as well as the settings for the bridges and boundary conditions. Once the MIKE 11 model setup was completed it was run for the 100 year flood event. Initially, there were some differences in the results because the HEC-RAS model was run as a steady-state simulation and MIKE 11 was run as a fully hydrodynamic simulation using steady peak inflows. The results of the comparison showed the MIKE 11 water levels in the channel were nearly identical to the HEC-RAS water levels throughout the majority of the study reach. The lone exception was the tailwater at one of the submerged bridges where the MIKE 11 model water levels were approximately 1.2 m lower than HEC-RAS. This difference was attributed to the fact that HEC-RAS is not capable of modelling mixed sub-critical and super-critical flow regimes in steady-state mode and, as such, it was not representing the same flow conditions as the fully-hydrodynamic MIKE 11 model. The water levels of the two models converge again almost immediately downstream of this location. Based on these results it was determined that the MIKE 11 model is capable of reasonably replicating the same flood conditions as HEC-RAS for this study area. 2.4. Development of Integrated 1D-2D MIKE FLOOD Model Once the 1D MIKE 11 model was constructed and verified the remaining steps to construct the integrated 1D-2D MIKE FLOOD hydraulic model consisted of the following;
1. Trim the 1D MIKE 11 model 2. Construct a 2D MIKE 21 overland flow model 3. Couple the 1D MIKE 11 and 2D MIKE 21 models
Development of each of these three components is described in detail in the following sections. 2.4.1 Trim the 1D MIKE 11 Model The MIKE 11 model that was developed and verified in the previous step was a direct conversion of the existing HEC-RAS model. As a result, it was modelling flow in both the main channel of the Little Etobicoke

5
Creek and the overbank areas adjacent to the creek. Development of the 1D MIKE 11 model for coupling with the 2D MIKE 21 overland flow model involves trimming the cross-sections of the MIKE 11 model such that they represent only the main channelized flows in Little Etobicoke Creek (see Figure 2). This allows the 1D channelized flow to be calculated by MIKE 11 while the overbank flows are calculated by the 2D MIKE 21 overland flow model. The spacing of cross-sections in the converted MIKE 11 model was approximately 100 m. However, when considering the 2x2 m grid size of the 2D model it was determined that a closer spacing between cross-sections was required in order to generate more frequent water level calculation points in the 1D model. Initially, the cross-sections were trimmed up to the top of the banks on either side of the channel, and then additional cross-sections were interpolated between these cross-sections using a maximum 50 m distance. Cross-sections were interpolated along the reach where the overbank flows are most likely to occur based on the previous modelling results.
Figure 2: Example of a trimmed cross-section for a MIKE FLOOD model
2.4.2 Construct 2D MIKE 21 Overland Flow Model The data requirements for a 2D overland flood model include:
High-resolution topography to describe the direction of flow
Surface roughness to describe the resistance to flow from different surfaces and vegetation
Boundary conditions to describe how flow enters or leaves the model across the outer edges of the model domain
Sources and sinks to describe how flow enters or leaves the model domain from within the model domain.
For this project it was decided to use the Single Grid version of MIKE 21 to solve for the overland flow. This version of the model uses a uniform, finite difference grid throughout the model domain. The extent of the 2D model area was identified in the scope of work provided by TRCA and is shown in Figure 1. Typically, the boundary of the model domain is selected based on topographic ridges or hydraulic controls where overland flow is not likely to pass. However, in this case the boundary was chosen based on both the availability of high-resolution LiDAR topographic data. In order to decide the appropriate grid spacing it is important to consider the level of detail required for the model. In this case, the study area is characterized by a mixture of commercial and residential land use, and in several areas there are developed areas where gaps between buildings are very narrow. Considering
6
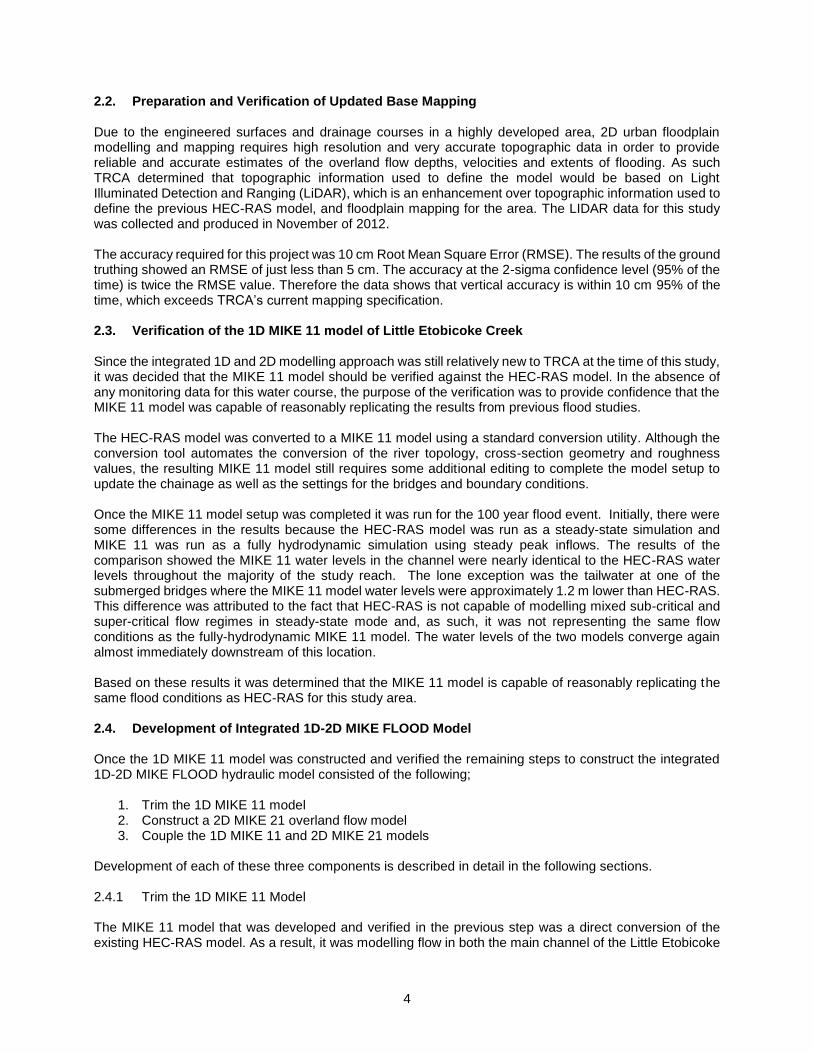
the need to balance the accuracy of model versus being able to achieve a reasonable model runtime, a 2m grid spacing was chosen for the 2D models. The topography for the model was obtained by resampling the LiDAR base map to the 2 m grid spacing used by the model. A shape file of the building locations was then intersected with the 2 m topography grid and the grid cells intersecting the building were set to an elevation that makes the cells inactive (i.e. they are treated as a flow barrier). Finally, the last step was to remove the 2D grid cells that intersect with the 1D MIKE11 channel cross sections. This step was done to avoid double accounting of flows in both the MIKE 11 model and the MIKE 21 model. The surface roughness values for the model area were assigned using a polygon shape file containing TRCA’s standard roughness values for different land use categories. The values for each polygon were mapped to the 2 m grid cells underlying each polygon (see Figure 3).
The boundaries of 2D model area were initially considered to be closed (i.e. no flow) except at the downstream end where the Little Etobicoke Creek flows out of the model domain near the confluence with Etobicoke Creek. A water level boundary condition was used at the downstream end where the reference water level was obtained from the HEC-RAS model of Etobicoke Creek for the flood events being modelled in this study. However, through the course of the study it was observed that the flooding from the creek is quite extensive and extends well beyond the anticipated study area, well beyond the available LiDAR coverage and, in fact, well beyond TRCA’s jurisdictional boundary. So rather than forcing water to effectively pile up along the edge of the model, a water level boundary condition was specified along the edges of the model domain where water was artificially collecting, thereby allowing the water to effectively drain out of the model domain. 2.4.3 Couple the 1D MIKE 11 Model and the 2D MIKE 21 Model In order to enable the dynamic, two-way exchange of flows between the 1D MIKE 11 model and the 2D MIKE 21 model these two models need to be coupled together using MIKE FLOOD. MIKE FLOOD provides three options to couple the MIKE 11 and MIKE 21 models together;
Standard links describe the coupling at the upstream or downstream end of the 1D model to the 2D model.
Figure 3: Map of Manning's M roughness values
7
Lateral links describe the coupling along the left bank and right bank of the 1D model to the 2D model, and
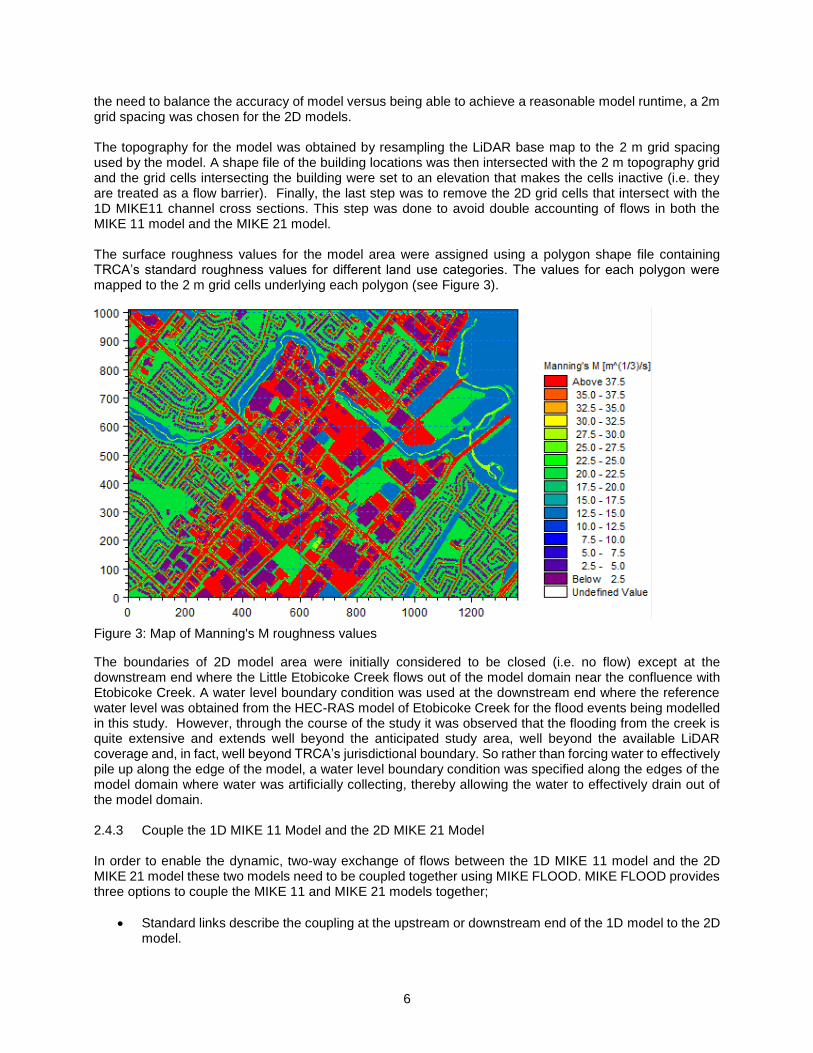
Structure links describe the coupling of a 1D structure element (e.g. culvert) to the 2D model For the Little Etobicoke Creek MIKE FLOOD model, a standard link was used to describe the discharge of flows from the downstream boundary of the 1D MIKE 11 model into the 2D MIKE 21 model at the confluence of Little Etobicoke Creek and Etobicoke Creek. The grid cells in the 2D model directly downstream of the 1D model boundary were identified and selected for coupling based on the width of the cross section at the Little Etobicoke Creek outlet. These ‘standard link’ grid cells allow outflow from the 1D MIKE11 model to be evenly distributed into the MIKE 21 model across the connected grid cells.MIKE11 model to be evenly distributed into the MIKE 21 model across the coupled grid cells. Along the edge of the river banks, lateral links were used to connect the top of banks in the 1D MIKE 11 model with the corresponding grid cells of the 2D MIKE 21 model (see Figure 4). Lateral link couplings allow a dynamic exchange of overbank flows between the 1D and 2D models. The linked cells in the 2D model are treated as weir structures where the crest elevation of the weir structure controls the exchange of flows along the top of bank.
Once the coupling was completed the model was run using inflows for the Regional flood event to ensure the model was stable and was producing results that were reasonable. The results of the Regional flood showed very extensive flooding throughout the study area and even well beyond the study area. In fact, the initial runs of the MIKE FLOOD model were used as the basis to revisit the initial assumption of closed boundaries around the majority of the model domain (see Section 2.3.2). 2.5. Validation of the Little Etobicoke Creek 1D-2D MIKE FLOOD Model The flood of July 8, 2013 was used to validate the MIKE FLOOD model. The validation included three steps:
1. Development of the July 8, 2013 hydrograph for the study area, 2. Running the Little Etobicoke Creek MIKE FLOOD model using inflows from the hydrograph, and
comparing the modelled water levels to observed data. Based on recorded rainfall records, the TRCA completed an analysis to estimate a rainfall hyetograph for the Etobicoke Creek watershed, and then applied the hyetograph to the 2013 Hydrologic Model in order to generate runoff hydrographs for Little Etobicoke Creek for the study area.
Figure 4: Examples of 1D-2D model coupling (green cells are the Standard link at the downstream end of the channel, pink cells represent the Lateral Links along the left and right banks of the channel)

8
The July 8, 2013 storm was simulated using MIKE FLOOD and the results were compared against observed flooding. Since there is no flow or water level monitoring stations for the study area, the comparison involved utilizing social media to find videos of the flooding posted by residents in the area. Several good quality videos were found for locations within the study area and were studied to estimate the water depth from the videos. Although the water depths can be estimated with some measure of accuracy, some caution is warranted because there is no way of knowing whether the video was taken at the maximum flow and depth. From the videos, five points of interest were selected. For the five points the results between modelled and observed estimated depths are very similar; all within 0.1 metres. However there was an instance at a rail crossing grade separation where observed depth is substantially less than the calculated depth. This is likely due to the fact that the model did not include the extent of drainage that would have occurred through the storm sewer system (i.e. the impact of catch basins and storm sewers conveying flow through the system). During the course of the event the accumulated runoff that would have discharged through the storms sewer would likely have been substantial. It was determined there is a strong correlation between the estimated observed water depths and the modelled water depths at several locations throughout the study area, and it was concluded that the model was able to accurately represent the actual flood event. 2.6. Design Storm Floodplain Modelling and Mapping The next step was to simulate the various design storms, from the 5-year event through to the Regional Storm event. The topography for all events from the 5-year to 100-year are based on the existing flood control works being in place, while the topography for the Regional Storm excludes the impact of the existing flood control works. The 350-year flood event considers both cases. The flood wall and berm were excluded for the Regional Storm simulation to ensure the resulting floodplain is consistent with the policies and procedures as defined by Ontario’s Ministry of Natural Resources and Forestry. The simulations were based on a steady state flow scenario where the inflow to the system is held constant at the peak flow for a period of 6 hours in order to achieve a near steady-state flow condition throughout the entire study area. In this case, since the flow is steady, the timing of the loading from the subcatchments is not an important consideration. Therefore, it was decided to use a single inflow at the upstream end of the study area. As with the unsteady hydrograph conditions, the inflows for each flood event were obtained from the updated hydrology study completed by MMM Group in 2013. In order to be conservative, the inflow for each flood event was chosen from a flow node located at the downstream end of the study area. For small flood events (e.g. 5-year to 50-year), a constant flow was assigned, while for larger events the inflow was gradually increased to the peak value in order to maintain numerical stability of the model solution (i.e. avoid ‘shocking’ the system) and then the peak flow remained constant for 6 hours. Although the purpose of this paper is not to present the updated floodplain mapping in it’s entirety, an example of the flooding extents from the Regional event is provided in Figure 5: Regional flood extent for the steady peak flow condition (without flood control works)Figure 5.

9
Figure 5: Regional flood extent for the steady peak flow condition (without flood control works)
The detailed results from the integrated 1D-2D flood modelling facilitated a number of observations regarding magnitude and frequency of the spills as wells as the main overland flow routes of the spills. 2.6.1 Spill Magnitude and Frequency Spill from Little Etobicoke Creek to Queen Frederica Drive starts to occur during the 5-year event. The spill occurs just downstream of the upstream Pedestrian Bridge, and as such is upstream of the flood wall which is adjacent to the downstream pedestrian bridge. The magnitude of the spill is nominal at approximately 1.0 m3/s of the peak flow of 58 m3/s. As summarized in Table 1, the fraction of flow that spills from Little Etobicoke Creek to Queen Frederica Drive increases significantly for higher return events. As a percentage of the total flow it increases from near zero for the 5-year event to 49 percent for the 350-year event with the existing flood wall and flood berm in place.

10
2.6.2 Flood Flow Routes The flood flow routes are clearly illustrated on the various maps. The dominate spill route is south on Queen Frederica Drive. At Dundas Street the flow splits as follows:
The larger fraction continues south across Dundas Street then along Blundell Road towards the CPR, and then southerly on Dixie Road.
A significant fraction also flows easterly on Dundas Street to Dixie Road, and then south.
A small fraction flows southwesterly from the intersection of Queen Frederica Drive and Dundas Street.
2.7. Preliminary Flood Remediation Assessment Given the extent of spill that occurs from Little Etobicoke Creek to Queen Frederica Drive, a number of preliminary alternatives were tested to determine what measures could be implemented to reduce spill and related flood risk. These alterative will be further investigated as part of a future study. The preliminary alternatives that were investigated included:
1. Remove Two Pedestrian Bridges Upstream of Dixie Road 2. Contain spill west of Dixie Road 3. Contain spill west of Dixie Road and east of Dixie Road to Neilco Court.
Alternative 1: Remove Two Pedestrian Bridges Upstream of Dixie Road The purpose of this alternative was to determine if the flow impediment associated with the two pedestrian bridges upstream of Dixie Road were a significant factor contributing to the frequency and magnitude of the spill to Queen Frederica Drive. Figure 6 shows the maximum flood extent and flood depth. A comparison of Figure 6Error! Reference source not found. to Figure 5 illustrates that the backwater imposed by the pedestrian bridges is a minor factor contributing to the spill.
Figure 6: Maximum flood extent and flood depth with two pedestrian bridges removed
TABLE 1: Spill to Queen Frederica
Case Return Period
Flow Rate (m3/s) Spill to Queen Frederica Dr.
(%) Total flow
At Dixie Road
Spill to Queen Frederica Dr,
With Berm and Wall
5-year 25-year 100-year 350-year
59 81 100 152
58 65 70 78
1 16 30 74
<2 20 30 49
No Berm and Wall 350-year Regional St.
152 210
74 80
78 130
51 62
11
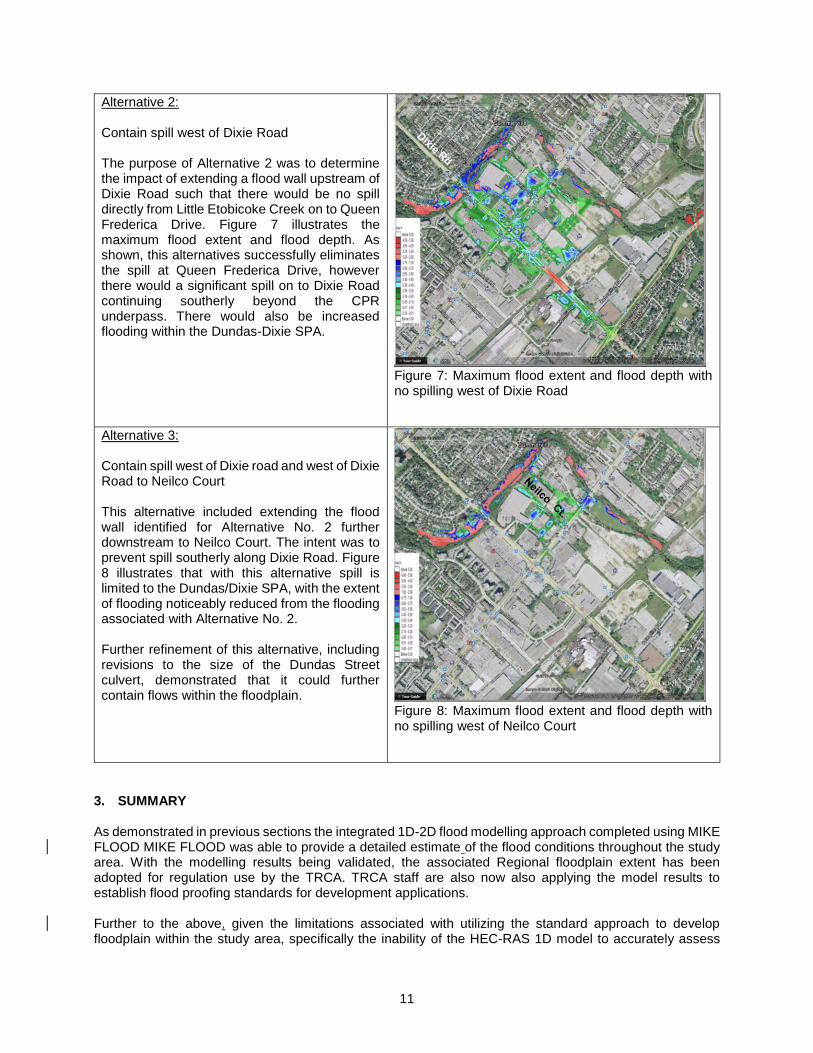
Alternative 2: Contain spill west of Dixie Road The purpose of Alternative 2 was to determine the impact of extending a flood wall upstream of Dixie Road such that there would be no spill directly from Little Etobicoke Creek on to Queen Frederica Drive. Figure 7 illustrates the maximum flood extent and flood depth. As shown, this alternatives successfully eliminates the spill at Queen Frederica Drive, however there would a significant spill on to Dixie Road continuing southerly beyond the CPR underpass. There would also be increased flooding within the Dundas-Dixie SPA.
Figure 7: Maximum flood extent and flood depth with no spilling west of Dixie Road
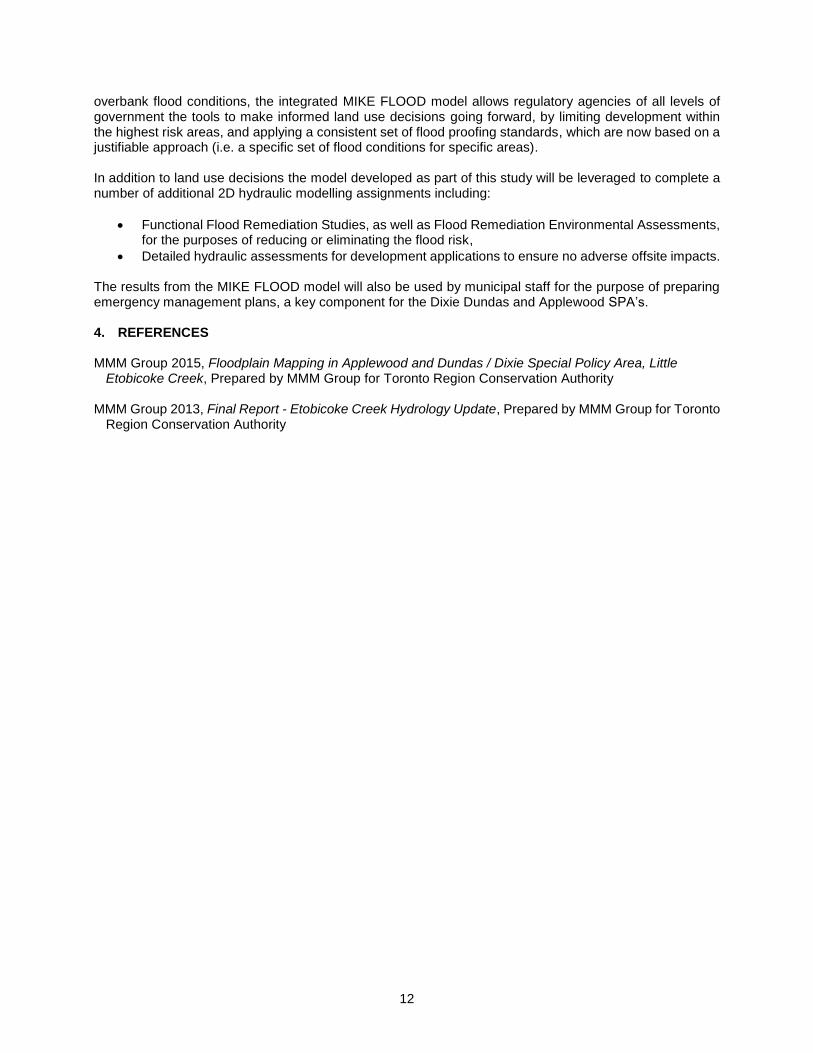
Alternative 3: Contain spill west of Dixie road and west of Dixie Road to Neilco Court This alternative included extending the flood wall identified for Alternative No. 2 further downstream to Neilco Court. The intent was to prevent spill southerly along Dixie Road. Figure 8 illustrates that with this alternative spill is limited to the Dundas/Dixie SPA, with the extent of flooding noticeably reduced from the flooding associated with Alternative No. 2. Further refinement of this alternative, including revisions to the size of the Dundas Street culvert, demonstrated that it could further contain flows within the floodplain.
Figure 8: Maximum flood extent and flood depth with no spilling west of Neilco Court
3. SUMMARY As demonstrated in previous sections the integrated 1D-2D flood modelling approach completed using MIKE FLOOD MIKE FLOOD was able to provide a detailed estimate of the flood conditions throughout the study area. With the modelling results being validated, the associated Regional floodplain extent has been adopted for regulation use by the TRCA. TRCA staff are also now also applying the model results to establish flood proofing standards for development applications. Further to the above, given the limitations associated with utilizing the standard approach to develop floodplain within the study area, specifically the inability of the HEC-RAS 1D model to accurately assess
12
overbank flood conditions, the integrated MIKE FLOOD model allows regulatory agencies of all levels of government the tools to make informed land use decisions going forward, by limiting development within the highest risk areas, and applying a consistent set of flood proofing standards, which are now based on a justifiable approach (i.e. a specific set of flood conditions for specific areas). In addition to land use decisions the model developed as part of this study will be leveraged to complete a number of additional 2D hydraulic modelling assignments including:
Functional Flood Remediation Studies, as well as Flood Remediation Environmental Assessments, for the purposes of reducing or eliminating the flood risk,
Detailed hydraulic assessments for development applications to ensure no adverse offsite impacts. The results from the MIKE FLOOD model will also be used by municipal staff for the purpose of preparing emergency management plans, a key component for the Dixie Dundas and Applewood SPA’s. 4. REFERENCES MMM Group 2015, Floodplain Mapping in Applewood and Dundas / Dixie Special Policy Area, Little
Etobicoke Creek, Prepared by MMM Group for Toronto Region Conservation Authority MMM Group 2013, Final Report - Etobicoke Creek Hydrology Update, Prepared by MMM Group for Toronto
Region Conservation Authority


![A Semi-Automatic 2D Solution for Vehicle Speed Estimation ...openaccess.thecvf.com/.../w3/Kumar_A_Semi-Automatic... · A Semi-Automatic 2D solution for ... [19] for a more detailed](https://img.dokumen.tips/doc/110x75/5e7dee91a1fc5e50f33196da/a-semi-automatic-2d-solution-for-vehicle-speed-estimation-a-semi-automatic-2d.jpg)


![CM01 02 [režim kompatibility]) - cvut.czpeople.fsv.cvut.cz/~bilypet1/vyuka/CM01/CM01_02.pdf · Detailed calculation of 2D frame • Calculation of loads • Modelling 2D frame in](https://img.dokumen.tips/doc/110x75/6015257dd2f2d625fa5b076c/cm01-02-reim-kompatibility-cvut-bilypet1vyukacm01cm0102pdf-detailed.jpg)