Embed Size (px)
Citation preview

Using Data to Using Data to Plan for Plan for
InstructionInstructionSummer 2006 PreschoolSummer 2006 Preschool
CSDCCSDC
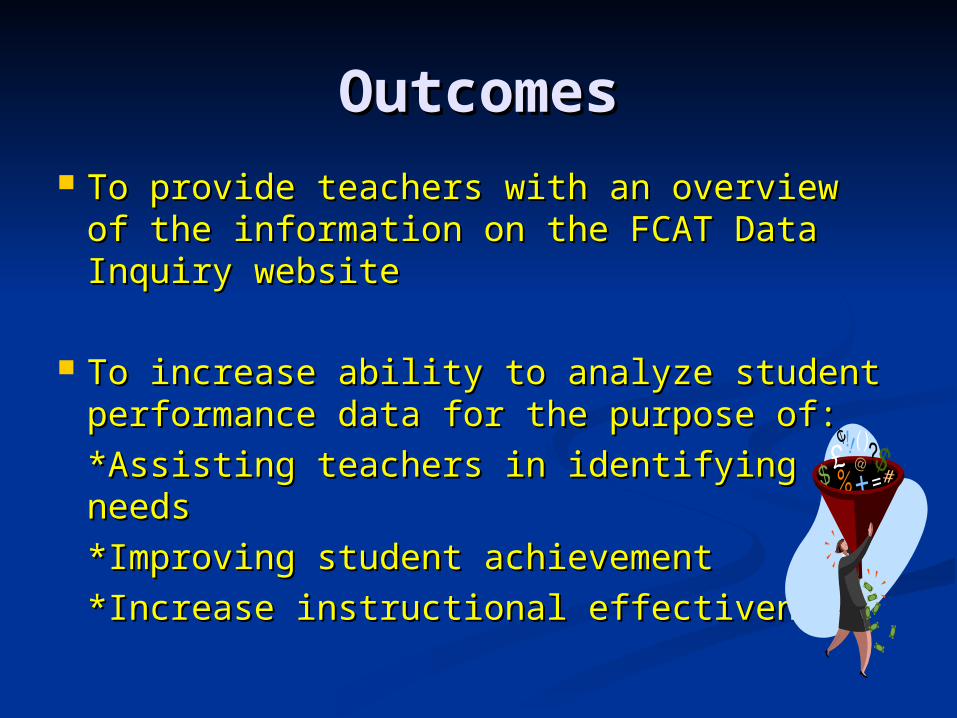
OutcomesOutcomes To provide teachers with an overview of To provide teachers with an overview of
the information on the FCAT Data Inquiry the information on the FCAT Data Inquiry websitewebsite
To increase ability to analyze student To increase ability to analyze student performance data for the purpose of:performance data for the purpose of:
*Assisting teachers in identifying needs*Assisting teachers in identifying needs
*Improving student achievement *Improving student achievement
*Increase instructional effectiveness*Increase instructional effectiveness
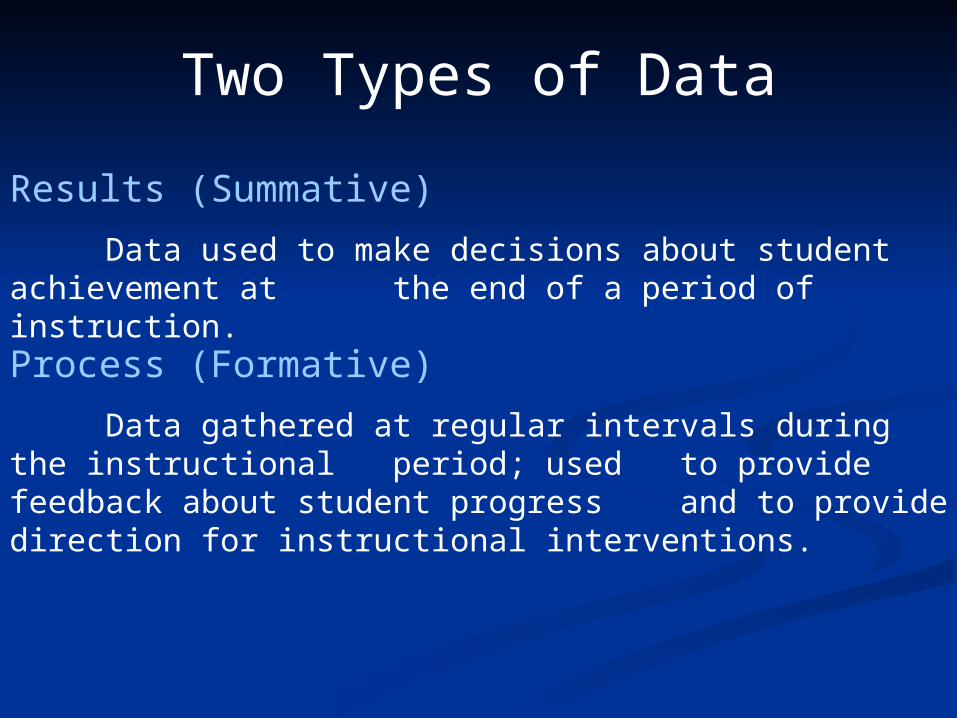
Two Types of Data
Results (Summative)
Data used to make decisions about student achievement at the end of a period of instruction.
Process (Formative)
Data gathered at regular intervals during the instructional period; used to provide feedback about student progress and to provide direction for instructional interventions.
Results Data
(Summative)
Examples:
•FCAT
•SAT 10
•DIBELS
Process Data (Formative)
Examples:
•Quizzes
•Chapter Tests
•DIBELS
•District Math Assessments
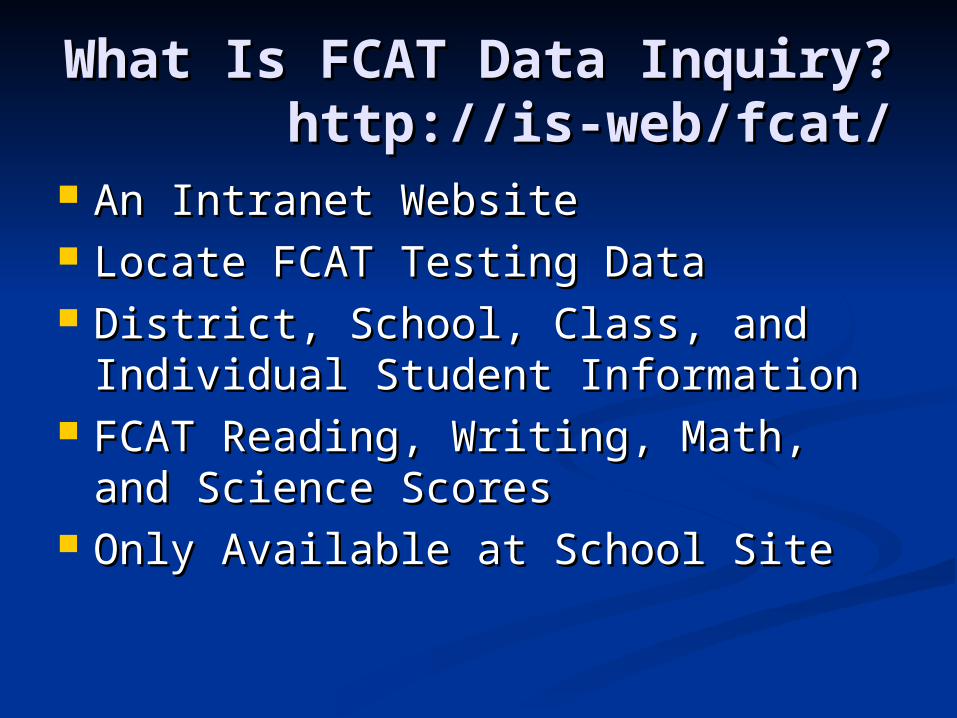
What Is FCAT Data Inquiry?What Is FCAT Data Inquiry? http://is-web/fcat/ http://is-web/fcat/
An Intranet WebsiteAn Intranet Website Locate FCAT Testing Data Locate FCAT Testing Data District, School, Class, and District, School, Class, and
Individual Student Information Individual Student Information FCAT Reading, Writing, Math, and FCAT Reading, Writing, Math, and
Science ScoresScience Scores Only Available at School Site Only Available at School Site
What tools do we have?What tools do we have?
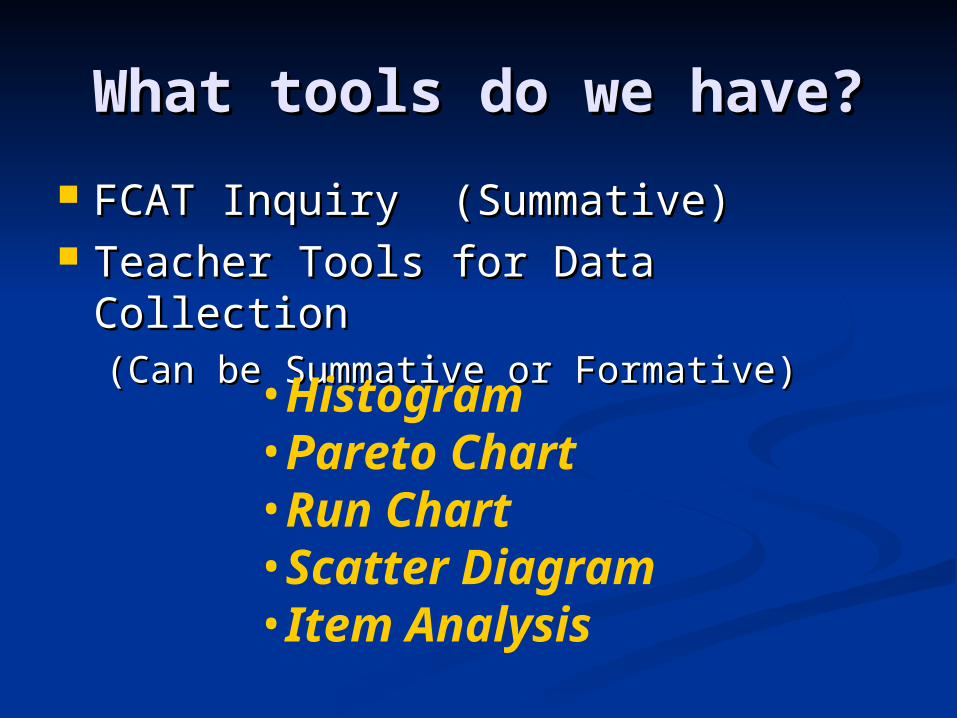
FCAT Inquiry (Summative)FCAT Inquiry (Summative) Teacher Tools for Data Collection Teacher Tools for Data Collection
(Can be Summative or Formative)(Can be Summative or Formative)
•Histogram•Pareto Chart•Run Chart•Scatter Diagram•Item Analysis
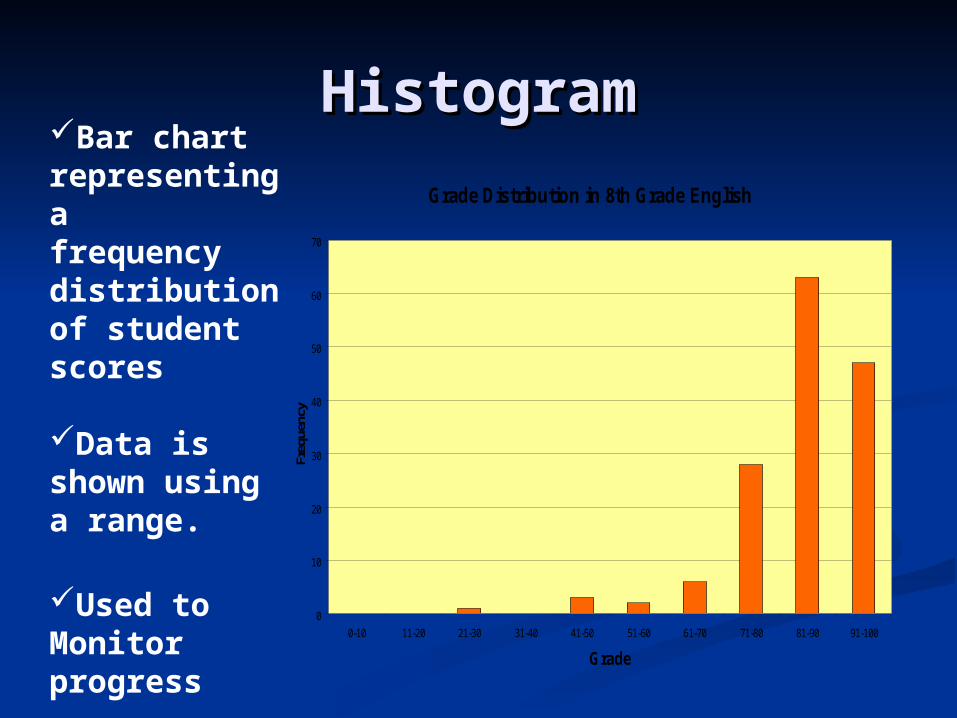
HistogramHistogram
Grade Distribution in 8th Grade English
0
10
20
30
40
50
60
70
0-10 11-20 21-30 31-40 41-50 51-60 61-70 71-80 81-90 91-100
Grade
Freq
uenc
y
Bar chart representing a frequency distribution of student scores
Data is shown using a range.
Used to Monitor progress
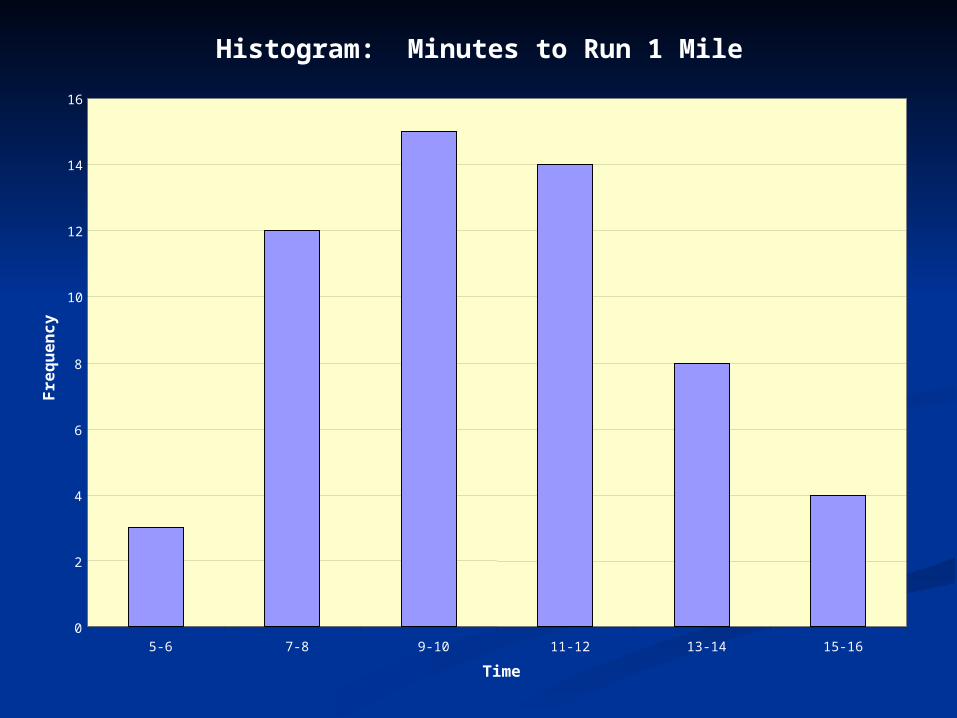
Histogram: Minutes to Run 1 Mile
0
2
4
6
8
10
12
14
16
5-6 7-8 9-10 11-12 13-14 15-16
Time
Fre
qu
en
cy

Histogram: Grade Distribution in 8th Grade English
0
10
20
30
40
50
60
70
0-10 11-20 21-30 31-40 41-50 51-60 61-70 71-80 81-90 91-100
Grade
Fre
qu
ency
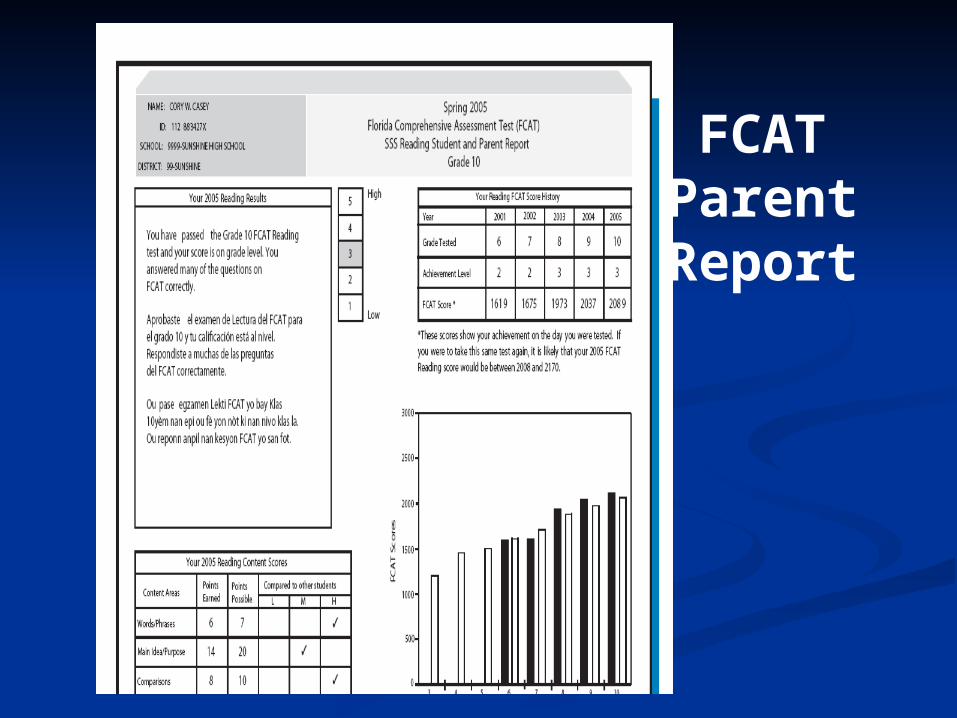
FCAT Parent Report
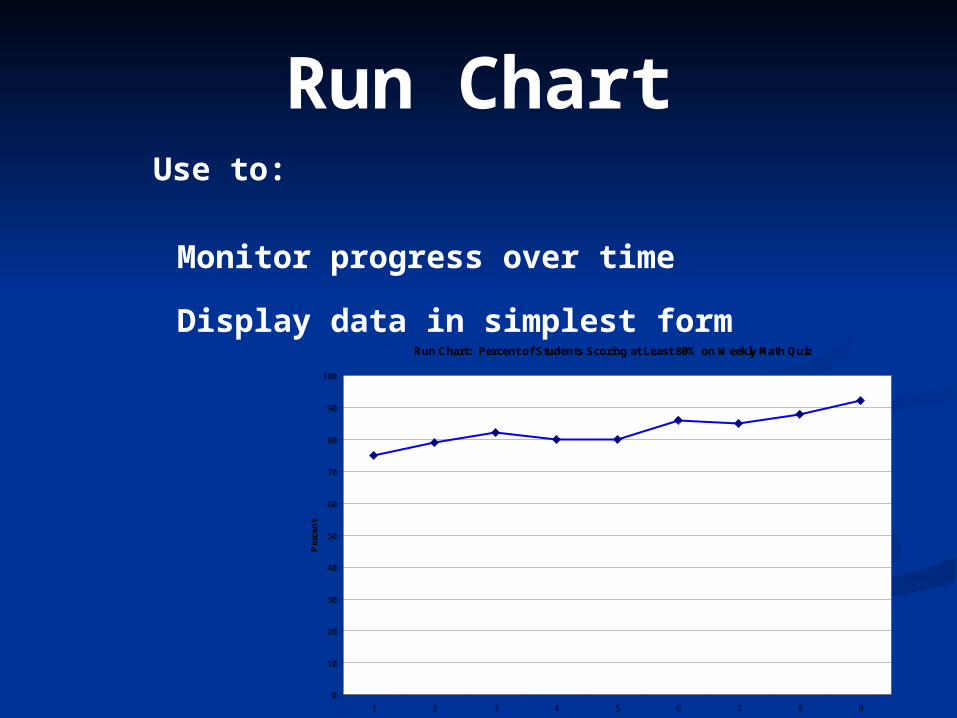
Run ChartUse to:
Monitor progress over time
Display data in simplest formRun Chart: Percent of Students Scoring at Least 80% on Weekly Math Quiz
0
10
20
30
40
50
60
70
80
90
100
1 2 3 4 5 6 7 8 9
Week
Per
cen
t

Run Chart: Number of Words Spelled Correctly on Weekly Quiz
140
145
150
155
160
165
170
175
180
1 2 3 4 5 6 7 8 9
Week
Nu
mb
er o
f w
ord
s

Class Goal: By the end of 9 weeks, 100% of our class will have an average of at least 80% on our
weekly math quizzes.Class Run Chart: Percent of Students Averaging at Least 80% on Weekly Math
Quizzes
0
10
20
30
40
50
60
70
80
90
100
1 2 3 4 5 6 7 8 9
Week
Per
ce
nt
w/
avg
. o
f a
t le
as
t 8
0%


Class Run ChartClass Run Chart
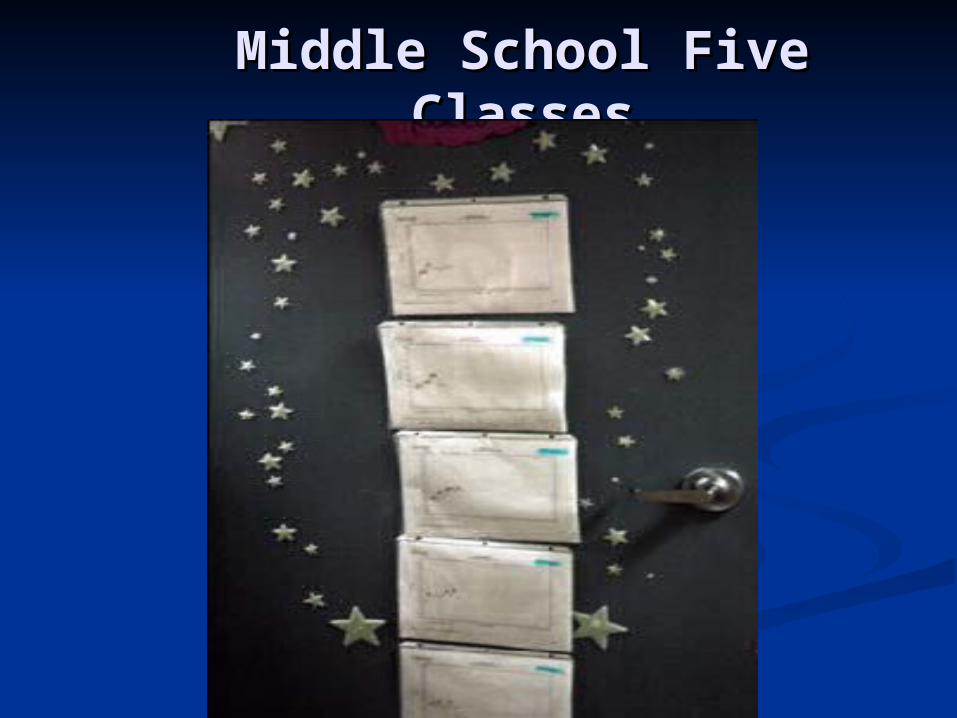
Middle School Five Middle School Five ClassesClasses
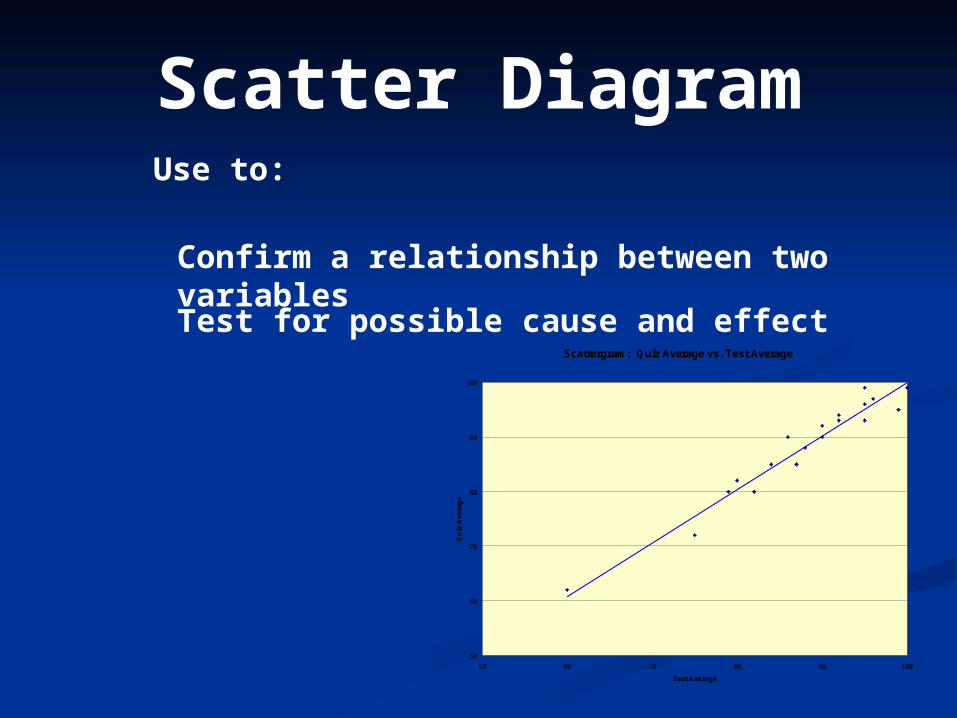
Scatter DiagramUse to:
Confirm a relationship between two variables
Test for possible cause and effectScattergram: Quiz Average vs. Test Average
50
60
70
80
90
100
50 60 70 80 90 100
Test Average
Qu
iz A
vera
ge
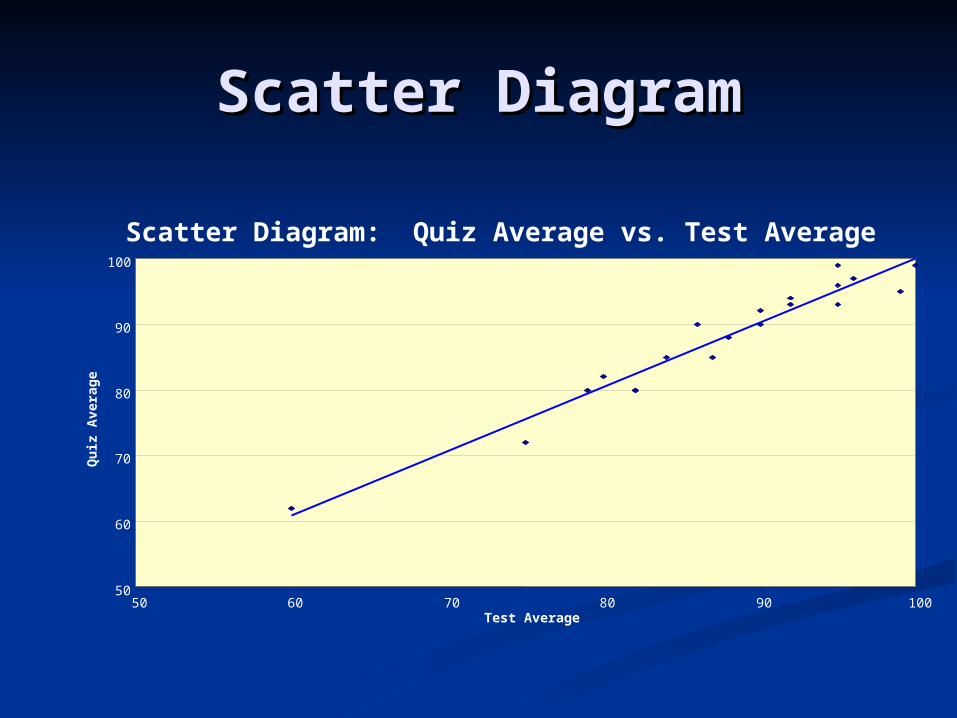
Scatter DiagramScatter Diagram
Scatter Diagram: Quiz Average vs. Test Average
50
60
70
80
90
100
50 60 70 80 90 100Test Average
Qu
iz A
vera
ge
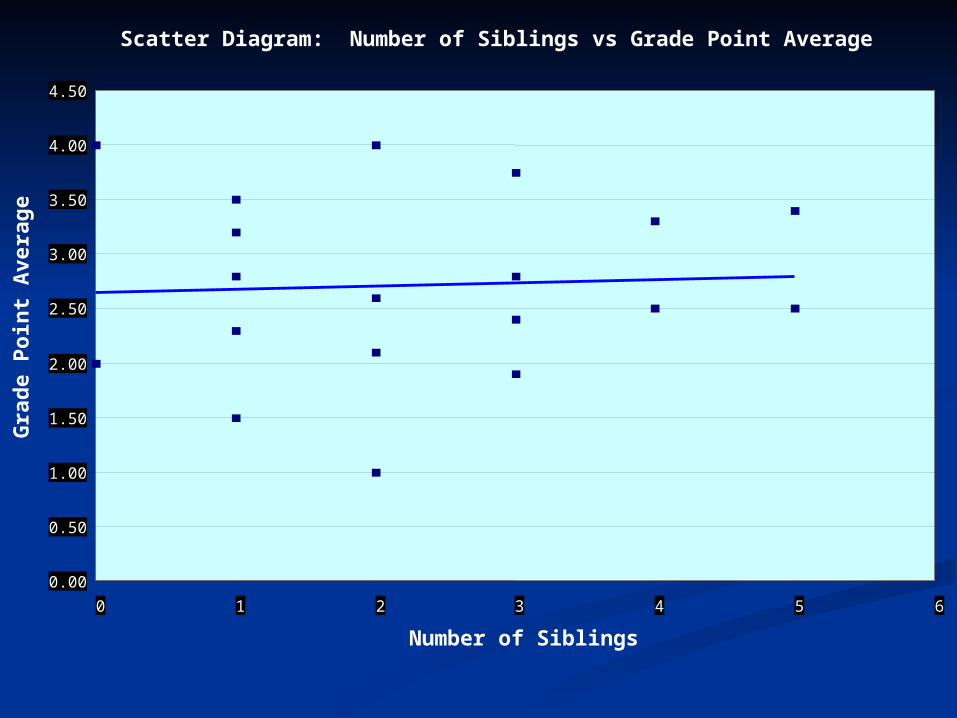
Scatter Diagram: Number of Siblings vs Grade Point Average
0.00
0.50
1.00
1.50
2.00
2.50
3.00
3.50
4.00
4.50
0 1 2 3 4 5 6
Number of Siblings
Gra
de
Po
int
Ave
rag
e
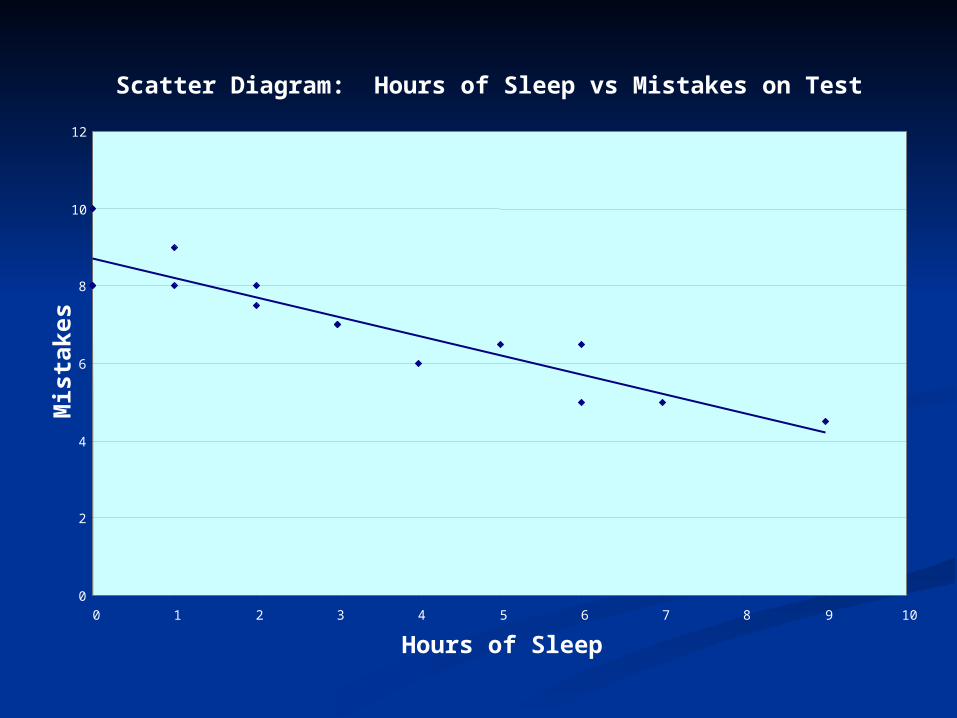
Scatter Diagram: Hours of Sleep vs Mistakes on Test
0
2
4
6
8
10
12
0 1 2 3 4 5 6 7 8 9 10
Hours of Sleep
Mis
take
s
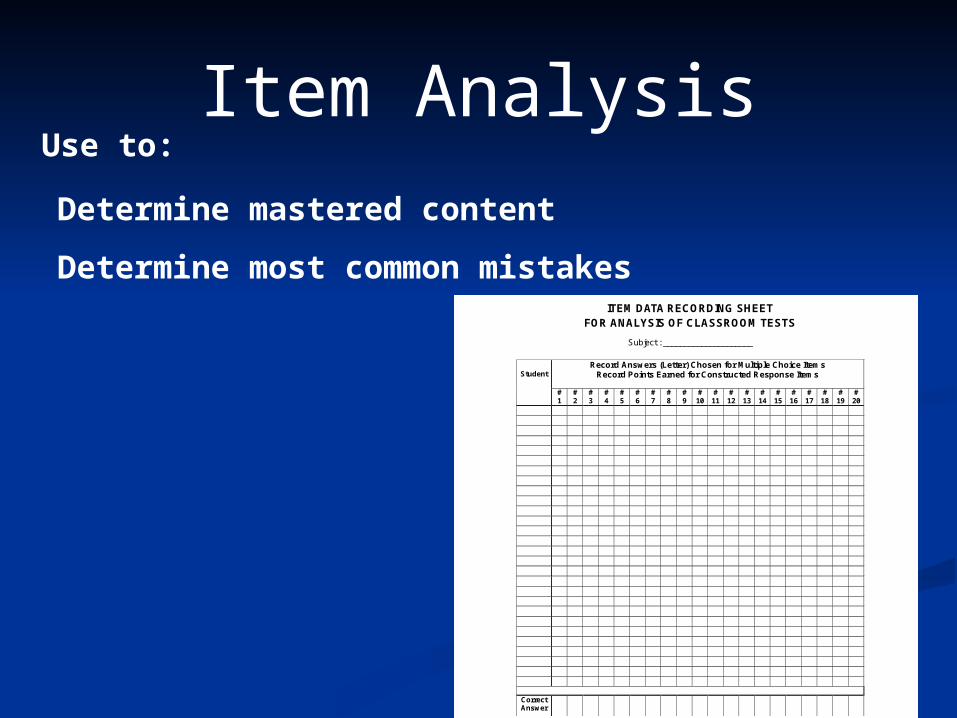
Item AnalysisUse to:
Determine mastered content
Determine most common mistakes ITEM DATA RECORDING SHEET
FOR ANALYSIS OF CLASSROOM TESTS
Subject : _____________________
Record Answers (Letter) Chosen for Multiple Choice Items Record Points Earned for Constructed Response Items
Student
# 1
# 2
# 3
# 4
# 5
# 6
# 7
# 8
# 9
# 10
# 11
# 12
# 13
# 14
# 15
# 16
# 17
# 18
# 19
# 20
Correct Answer
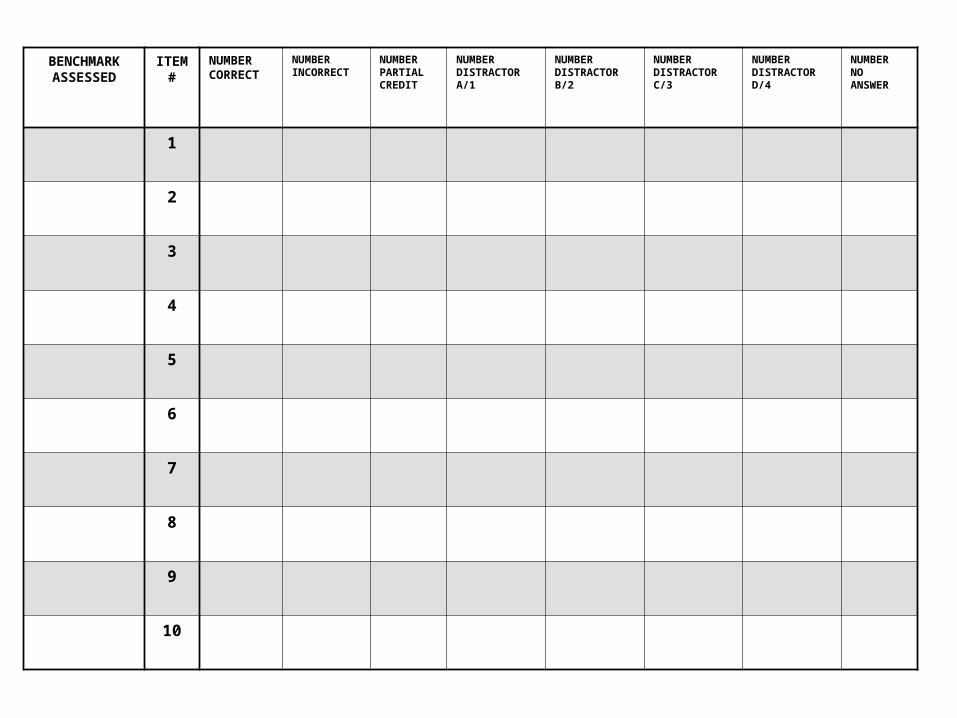
CLASSROOM TEST ANALYSISBENCHMARK
ASSESSEDITEM
#NUMBER CORRECT
NUMBERINCORRECT
NUMBERPARTIALCREDIT
NUMBERDISTRACTORA/1
NUMBERDISTRACTORB/2
NUMBERDISTRACTORC/3
NUMBERDISTRACTORD/4
NUMBERNOANSWER
1
2
3
4
5
6
7
8
9
10

Pareto ChartUse to:
Rank issues in order of occurrence
Decide which problems need to be addressed first
Find the issues that have the greatest impact
Monitor impact of changes Pareto Chart: Types of mistakes in Division Problems
0
10
20
30
40
50
60
70
80
90
100
Incorrect multiplication Incorrect subtraction No decimal Other
Mistake
Per
cen
t
0
10
20
30
40
50
60
70
80
90
100
Cu
mu
lativ
e p
erce
nta
ge
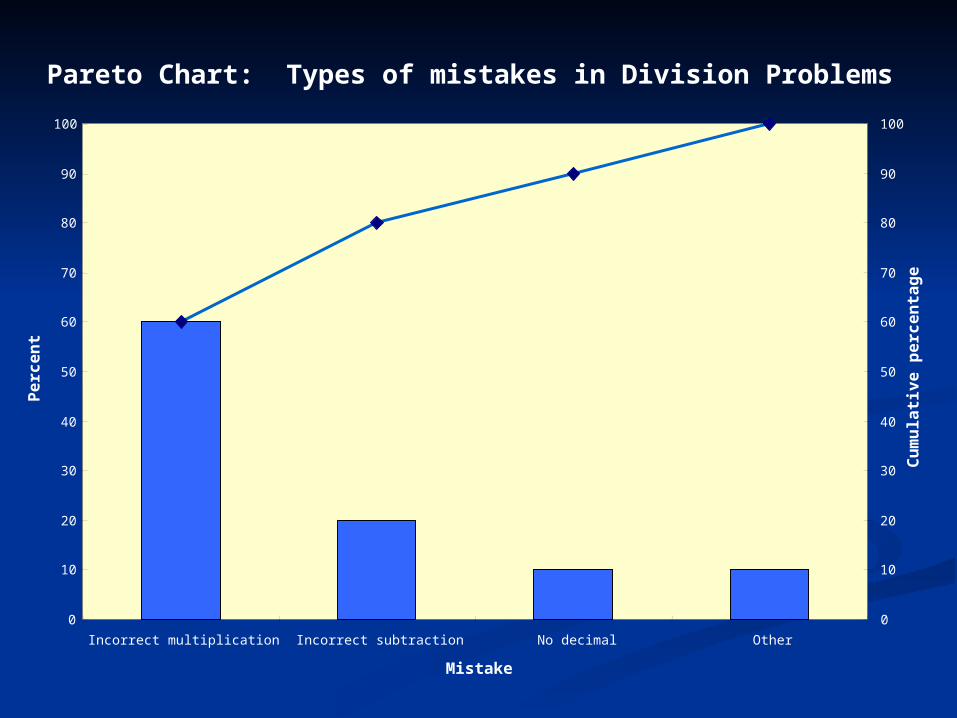
Pareto Chart: Types of mistakes in Division Problems
0
10
20
30
40
50
60
70
80
90
100
Incorrect multiplication Incorrect subtraction No decimal Other
Mistake
Pe
rce
nt
0
10
20
30
40
50
60
70
80
90
100
Cu
mu
lati
ve
pe
rce
nta
ge

Data analysis provides:
Insight
and
Questions


Adapted from Getting Excited About Data, Edie Holcombwww.corwinpress.com
• What question are we trying to
answer?• What can we tell from the data?• What can we NOT tell from the
data? What else might we want to
know?• What good news is here for us to
celebrate?• What opportunities for improvement
are suggested by the data?
Questions to Ponder…

Action
Answers!
Provides
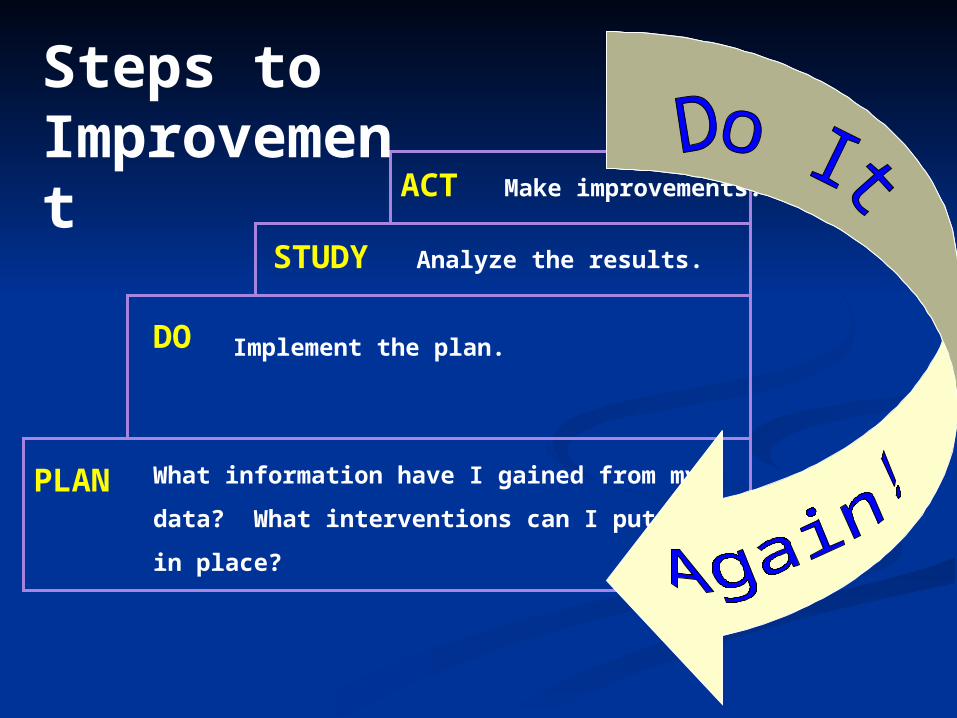
What information have I gained from my
data? What interventions can I put
in place?
Implement the plan.
Analyze the results.
Make improvements.
Steps to Improvement
PLAN
DO
STUDY
ACT

Personal Action Plan
What data can I access?
What tools can I use to help me monitor progress toward our class goals?
What/who else do I need to help me?
What is my start date?
How will I evaluate the results?
P
DS
A

Thank You!Thank You!