Embed Size (px)
Citation preview

Louisiana State UniversityLSU Digital Commons
LSU Doctoral Dissertations Graduate School
2011
Using curriculum-based measures to predict mathperformance on a statewide assessmentKeri F. MenessesLouisiana State University and Agricultural and Mechanical College
Follow this and additional works at: https://digitalcommons.lsu.edu/gradschool_dissertations
Part of the Psychology Commons
This Dissertation is brought to you for free and open access by the Graduate School at LSU Digital Commons. It has been accepted for inclusion inLSU Doctoral Dissertations by an authorized graduate school editor of LSU Digital Commons. For more information, please [email protected].
Recommended CitationMenesses, Keri F., "Using curriculum-based measures to predict math performance on a statewide assessment" (2011). LSU DoctoralDissertations. 3920.https://digitalcommons.lsu.edu/gradschool_dissertations/3920

USING CURRICULUM-BASED MEASURES
TO PREDICT MATH PERFORMANCE ON A STATEWIDE ASSESSMENT
A Dissertation
Submitted to the Graduate Faculty of the Louisiana State University and
Agricultural and Mechanical College in partial fulfillment of the
requirements for the degree of Doctor of Philosophy
in
The Department of Psychology
by Keri F. Menesses
B.S., Louisiana State University, 2005 M.A., Louisiana State University, 2008
August 2011

ii
TABLE OF CONTENTS
List of Tables……………………………………………………………………………………..iii
Abstract…………………………………………………………………………………………..iv
Introduction………………………………………………………………………………………..1 Rationale and Research Questions…………………………………………………………7 Method…………………………………………………………………………………………….9
Participants and Setting………………………………………………...………………….9 A Priori Power Analyses…………………………………………………………..9 Materials and Procedures………………………………………………………………...10 Curriculum-Based Measures……………………………………………………..10 Statewide Assessments…………………………………………………………..12 Teacher Reports………………………………………………………………….15
Results……………………………………………………………………………………………16 Outcomes with LEAP/iLEAP..…………………………………………………………...16 Outcomes with Final Grades ……………………………………………………………..19 Outcomes by Grade Level………………………………………………………………..20 Discussion………………………………………………………………………………………..24
Practical Implications…...………………………………………………………………..25 Limitations…...…………………………………………………………….……….……26
Conclusion……………………………………………………………………………………….28 References……………………………………………………………………………………….30 Vita………………………………………………………………………………………………33
iii
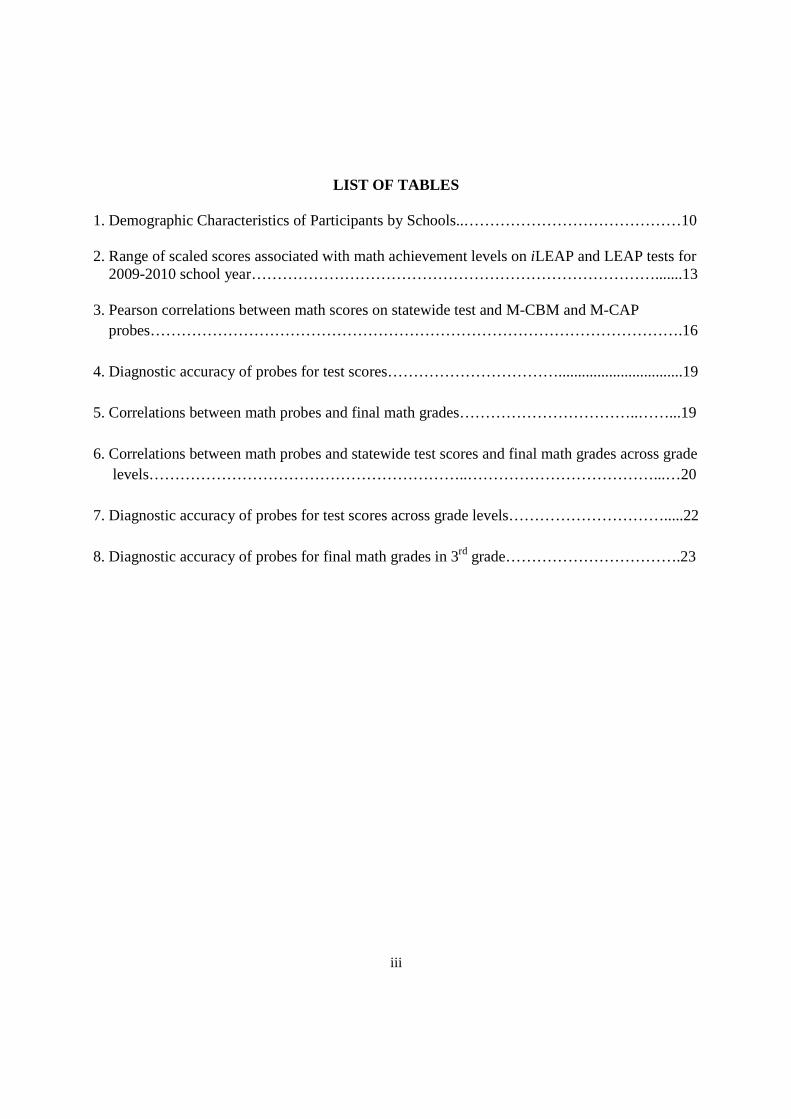
LIST OF TABLES
1. Demographic Characteristics of Participants by Schools..……………………………………10
2. Range of scaled scores associated with math achievement levels on iLEAP and LEAP tests for 2009-2010 school year…………………………………………………………………….......13 3. Pearson correlations between math scores on statewide test and M-CBM and M-CAP probes………………………………………………………………………………………….16 4. Diagnostic accuracy of probes for test scores……………………………................................19 5. Correlations between math probes and final math grades……………………………..……...19 6. Correlations between math probes and statewide test scores and final math grades across grade levels……………………………………………………..………………………………...…20 7. Diagnostic accuracy of probes for test scores across grade levels………………………….....22 8. Diagnostic accuracy of probes for final math grades in 3rd grade…………………………….23

iv
ABSTRACT
One hundred forty-six students in third, fourth, and fifth grades completed two types of
curriculum-based measurement (CBM) math probes, math computation and math concepts/
applications, in the winter and spring. The relationship between scores on the math probes and
scores on the math portion of the Louisiana statewide assessments were analyzed by computing
correlation coefficients and conducting multiple regression analyses. Both types of probes were
significantly correlated with test outcomes, yet the concepts/applications probes were stronger
predictors of test performance. The diagnostic accuracy of the probes was determined using
receiver operating characteristic (ROC) curve analyses, which established cut scores that are
associated with passing the statewide test and revealed the concepts/applications probes have
higher overall correct classification rates. Having the ability to predict performance on high-
stakes tests enhances the utility of CBM and provides the opportunity for educators to intensify
instruction for at-risk students before they experience failure.

1
INTRODUCTION
With the passage of the No Child Left Behind Act (NCLB, 2001), states and districts face
extensive accountability standards for the performance and annual progress of every student in
their schools. Each state is required to set high standards for what students should know and how
they should demonstrate their knowledge at each grade level as well as to establish clear,
measurable goals for progress, with the ultimate goal of improving individual student outcomes.
NCLB (2001) called for a standards-based reform movement in education; rather than focusing
on how they compare to classmates, as in norm-referenced assessment, all students are assessed
in comparison to a set criterion in this standards-based system. Every state is required to
administer a standardized assessment of basic skills to students in grades 3 through 8 in order to
assess proficiency in core academic areas such as reading and math and to determine if schools
are achieving “adequate yearly progress” (NCLB, 2001) based on the state’s standards (Braden,
2002; Linn, 2000).
These statewide tests are considered “high-stakes” tests, single assessments that have a
predetermined cut score used to distinguish those who pass from those who fail, with direct
consequences associated with passing and failing. For example, major decisions such as retaining
students, terminating teachers, and removing funding, accreditation, or administrative control
from schools are based on the outcomes of statewide tests. Given that the scores of all students in
a school determine the school’s success and schools’ scores are used to determine state
performance, there is substantial pressure on teachers to raise students’ test scores. Teachers
often narrow their curriculum by “teaching to the test” (Popham, 2003), intending not only to
increase student performance but also to avoid salary cuts and even job loss. Also, because

2
students are made aware of the impending consequences of these assessments, test anxiety
becomes common (Cizek & Burg, 2006).
Although these standardized tests are designed to measure overall academic achievement
and are used to make high-stakes decisions, they typically provide too little information too late
(McGlinchey & Hixson, 2004). Generally, statewide assessments are conducted near the end of
the school year with the intention of determining whether the instruction provided throughout the
year was effective, which does not allow time to modify instruction for students in need of more
intensive services. It can be argued that decisions such as retention, which can result in
detrimental consequences for students (Jimerson, 2001), should not be solely based on a one-shot
assessment. Rather, students and teachers should be assessed and given performance feedback
throughout the year, which can improve the probability of schools continuing effective practices
and modifying or eliminating ineffective instructional procedures (Good, Simmons, &
Kame’enui, 2001). Ensuring effective instruction is being provided during the school year not
only prevents individual students from failing but also entire schools from performing poorly.
Furthermore, an assessment that is able to provide an indication of future performance on the
statewide test may reduce a significant amount of pressure experienced by teachers and students
as test dates approach.
Aside from their inability to be administered frequently enough to monitor progress,
statewide assessments fail to provide information about student attainment of specific
educational goals and thus lack instructional validity (Crawford, Tindal & Stieber, 2001;
Popham, 2003). If a student fails the reading section of a high-stakes test, the student’s teacher
will be aware of his or her difficulties in reading but will most likely be unsure of the specific
reading skills that require more practice. Assessments that have treatment validity, or inform

3
intervention (Hayes, Nelson, & Jarrett, 1987), have obvious advantages over those that do not;
the more specifically a test can pinpoint deficits in academic skills, the more useful the test can
be when designing interventions that directly address the identified deficits. Curriculum-based
measurement (CBM) is a type of assessment that can inform treatment as well as be administered
frequently enough to monitor progress throughout the school year.
CBM has been established as a reliable and valid method of identifying academic
concerns and monitoring student response to instructional programs (Deno, Espin, & Fuchs,
2002; Fuchs & Fuchs, 1999). The tasks involved in CBM serve as general outcome measures
(GOM) which represent the global content (rather than sub-skills) in the academic domain being
assessed (Fuchs & Deno, 1991). In addition, CBM is comprised of a set of standardized
procedures that are easy and efficient to administer and score, and the resulting data can be used
to inform the design of instructional interventions (Deno et al., 2002; Fuchs & Deno, 1991;
Fuchs & Fuchs, 1999). CBM has been developed in reading, math, writing, and spelling. Some
uses of CBM include screening to identify students at-risk for academic failure, establishing
local norms, monitoring student progress, classifying students, and evaluating intervention
effectiveness (Hosp, Hosp, & Howell, 2007).
Most recently, while investigating the range of applications of CBM, researchers have
found that there are moderate to strong correlations between oral reading CBM scores and scores
on high-stakes tests in eight states: Colorado (Shaw & Shaw, 2002), Florida (Buck & Torgeson,
2003), Michigan (McGlinchey & Hixson, 2004), Minnesota (Hintze & Silberglitt, 2005), North
Carolina (Barger, 2003), Oregon (Good, Simmons, & Kame’enui, 2001), Pennsylvania (Shapiro,
Keller, Lutz, Santoro, & Hintze, 2006), and Washington (Stage & Jacobsen, 2001). Furthermore,
CBM reading scores that indicate a student will pass the statewide assessment have been

4
identified. For example, Good et al. (2001) determined a third grader who can read 110 words or
more on an oral reading probe is likely to pass the Oregon test. Studies have found a similar
relationship between math CBM probes and math scores on statewide tests (Helwig, Anderson,
& Tindall, 2002; Jiban & Deno, 2007; Shapiro et al., 2006), although correlations are slightly
weaker than those found with reading CBM probes.
These findings have significant implications in that administrators, teachers, and students
do not need to wait until the end of the school year to determine where they stand in comparison
to established standards as individuals and as a school. Also, because CBM outcomes are
significantly related to measures more commonly used in schools to evaluate student
performance and progress (i.e. tests), the usefulness and practical significance of CBM is
enhanced. Most importantly, having the ability to predict students’ test results allows a school to
take action in remediating students who are identified as at-risk for failing the statewide
assessment months before the test is administered. Such proactive measures may prevent
multiple negative consequences that could ensue as a result of students failing high-stakes tests.
Although most research on the relationship between CBM scores and statewide test
scores involves oral reading fluency probes, researchers have begun to investigate this
relationship with math CBM, and in particular, math concepts/applications probes (Helwig et al.,
2002; Shapiro et al., 2006; Keller-Margulis, Shapiro, & Hintze, 2008). Rather than measure
foundational strategies and procedural knowledge by presenting basic math facts, which is done
with computational math CBM probes, concepts/applications probes measure conceptual
knowledge by presenting charts, graphs, measurement, time, money, and word problems. The
logic behind developing and administering conceptually-based math probes is to assess students’
ability to reason mathematically and apply computation skills to various scenarios, rather than

5
solve problems in isolation (Fuchs, Fuchs, & Zumeta, 2008). Also, investigating the relationship
between scores on a conceptually-based CBM and scores on a statewide test is a logical
evaluation because high-stakes tests do not simply contain math facts but rather, require students
to apply math reasoning skills to many different types of problems.
Helwig and colleagues (2002) were the first to investigate the relationship between scores
on conceptually-based math CBM and performance on a computer adaptive test that paralleled a
statewide (Oregon) assessment. Eighth-grade students completed the computer test and a math
CBM probe containing 11 conceptual problems. A Pearson product-moment correlation
demonstrated a strong relationship between the two math measures (r = .80), and a discriminate
function analysis indicated the conceptual math probe predicted with 81% accuracy which
students would and would not score high enough on the computer test to meet the state standard.
Helwig et al. (2002) discussed support of their theory that the more successful students are at
completing conceptual math CBM probes, the more likely they have developed well-networked
mathematical schemas and the higher they will score on standardized measures of general math
achievement. The authors emphasized the significance of using CBM to estimate where students
stand in relation to state benchmarks throughout the year and called for more research on this
relationship.
Shapiro et al. (2006) expanded this area of research by investigating the relationship
between statewide (Pennsylvania) test performance and math CBM scores using both
computational and concepts/applications probes. Elementary school students across two districts
were administered probes in the fall, winter, and spring, and the statewide test was conducted in
the spring. With both types of CBMs, the winter probes were the best predictors of the spring
statewide test scores. As for correlations with the state standardized test scores, the

6
concepts/applications probes were somewhat higher correlated (r ranged from .46 to .64) than
the computational probes (r ranged from .41 to .53). Using a receiver operating characteristic
(ROC) curve analysis, the authors determined cut scores on the math probes that would most
accurately classify which students would and would not meet the state testing standard. As for
diagnostic accuracy using those cut scores, the two CBM measures showed similar results; both
had an overall correct classification rate around .65, sensitivity around .65, and specificity
around .66. Shapiro et al. (2006) underscored the advantages of CBM probes being predictors of
high-stakes test performance including being inexpensive, efficient, and effective screening
measures capable of informing the design of remedial interventions.
Most recently, Keller-Margulis, Shapiro, & Hintze (2008) extended the research by
examining the relation between rate of growth and performance on a statewide (Pennsylvania)
achievement test 1 and 2 years later as well as the diagnostic accuracy of CBM scores in
predicting scores on a statewide assessment 1 and 2 years later. Oral reading fluency probes from
AIMSweb, Monitoring Basic Skills Progress-Math Computation probes (Fuchs, Hamlett, &
Fuchs, 1998), and Monitoring Basic Skills Progress-Math Concepts and Applications probes
(Fuchs, Hamlett, & Fuchs, 1999) were administered in the fall, winter, and spring. Correlations
were computed between performance on each probe and performance on the statewide test. Also,
the three CBM data points were used to calculate a slope, representing the rate of growth across
the school year, which was then correlated with scores on the standardized assessment. Results
showed moderate to strong correlations between individual math computation scores (r ranged
from .23 to .69) and individual math concepts/applications scores (r ranged from .25 to .66) and
test performance both 1 and 2 years later. Correlations were weaker between slope of math
computation scores (r ranged from .35 to .45) and slope of math concepts/applications scores (r

7
ranged from .08 to .32) and the statewide test. ROC curve analyses were used to identify cut
scores for reading, math computation, and math concepts and applications, and the diagnostic
accuracy of CBM was determined to be strong. Within reading CBM probes and slopes, an
average of 78% of students were correctly classified as either passing or failing the high-stakes
test. Within math computation CBM probes and slopes, an average of 70% of students were
correctly classified, whereas an average of 69% of students were correctly classified using math
concepts and applications probes and slopes. Overall, individual CBM probe scores resulted in
better diagnostic accuracy than CBM slope data, but the authors pointed out the need for further
research that aims to clarify the predictability and diagnostic decision-making ability of CBM.
Rationale and Research Questions
Considering the decisions that are based on statewide test outcomes, having the ability to
identify students who are unlikely to pass the test is certainly considered desirable by school
personnel. And although the relationship between CBM scores and performance on statewide
assessments has been established to some degree, the idiosyncratic nature of state standards and
assessments requires replication of this type of investigation. Also, there are limited studies
addressing the relationship between math test performance and scores on math CBM probes,
especially math concepts and applications. As such, this study aims to add to the existing
research on the relationship between math CBM scores and high-stakes test scores as well as
establish the accuracy of math CBM probes in predicting student performance on the statewide
achievement test in Louisiana.
Two types of math CBM probes, computation and concepts/applications, were
administered to determine how well each predicts student performance on the statewide test.
Because the standards addressed in Louisiana’s statewide assessments are derived from the math

8
curriculum, which encompasses number relations, measurement, geometry, algebra, patterns,
charts, and graphs, the math portion of these tests contain more conceptually-based problems
than computational math facts. As such, it was hypothesized the concepts/applications probe
would have a stronger correlation with test scores and would be able to better predict students’
performance on the Louisiana Educational Assessment Program (LEAP/iLEAP) tests.
Additionally, teachers were asked to report their prediction of student performance on the
statewide assessment, which was then correlated with actual student performance; it was
predicted teacher reports would be moderately correlated with test scores but would not add
significantly to the variance associated with test scores above that explained by CBM scores.
Lastly, the relationship between CBM scores and final math grades was analyzed; it was
hypothesized both would be moderately correlated with final grades, with the
concepts/applications probes having a stronger correlation and predictive ability than the
computational probes.

9
METHOD
Participants and Setting
Principals at three schools in East Baton Rouge and Central School Districts were
explained the purpose and procedure of this study and agreed to allow their students to
participate. The principals at the two schools in the Central School District nominated two or
three third, fourth, and fifth grade classrooms (depending on the number of students per
classroom). Nomination was based levels of academic achievement within the classrooms
(students were placed in classrooms based on academic tracking results) so that all levels were
represented, as well as on the principals’ perception of teacher willingness to participate. All
third, fourth, and fifth grade classrooms at the school in the East Baton Rouge School District
participated due to small numbers of students per classroom. Parental consent forms were sent
home with all students in the participating classrooms. Students who returned parental consent
and gave their assent were eligible participants; however, only students who completed all math
probes and had an available statewide test score were included in data analyses. Student
demographics such as age, race, grade, sex, and socioeconomic status were collected.
A total of 146 students were included in final data analyses. There were 29 males and 27
females in third grade, 22 males and 26 females in fourth grade, and 14 males and 28 females in
fifth grade. The students attended a small rural public elementary school (School A), a small
rural middle school (School B), or a small urban elementary school (School C) in southeast
Louisiana. The schools’ and the participants’ demographic information is presented in Table 1.
A priori Power Analyses. Two power analyses were conducted, one for each of the
planned statistical analyses. One analysis determined how many participants were needed to
compute Pearson r correlations between final math grades, scores on math probes, and

10
Table 1
Demographic Characteristics of Participants by Schools
School A School B School C District Small, rural Small, rural Moderate, urban/suburban Grade Levels 2-3 4-5 K-5 Number of Participants 44 71 31 Sex Male 22 28 15 Female 22 43 16 Race
African American 4% 16% 94% Caucasian 89% 79% 3% Asian 7% 0% 0% Hispanic 0% 4% 3% Alaskan American 0% 1% 0%
Socioeconomic Status Free/Reduced Lunch 39% 54% 100% Paid Lunch 61% 46% 0%
performance on the statewide test. With an effect size set of q = .5 and alpha of α = .05, 106
participants are required to reach a power level of 1 – β = .80. In order to conduct a multiple
regression and determine which math probe is a stronger predictor of math performance in class
and on the state assessment, 68 participants are needed with an effect size of f2 = .15, alpha of α
= .05, and power of 1 – β = .80. Approximately 200 participants were recruited to account for
missing data due to absences and attrition throughout the study. One hundred fifty-three students
returned parental permission and after excluding students who were absent during the second
CBM administration, 146 students’ data were included in the final analyses.
Materials and Procedure
Curriculum-based Measures. All participants were administered four math CBM
probes: three computation (M-CBM) and one concepts/applications (M-CAP) probe retrieved
from the AIMSweb system, in the winter (early February) and spring (late April). Each student

11
completed three multiple-skill M-CBM probes at each measurement based on the results of a
study by Hintze, Christ, & Keller (2002), which determined the median of three multiple-skill
probes is a more dependable score than that of one multiple-skill probe. The internal consistency,
interscorer agreement, and test-retest reliability of M-CBM data have been established as being
near or over .90 in multiple studies (Foegen, Jiban, & Deno, 2007; Fuchs et al., 1994; Thurber,
Shinn, & Smolkowski, 2002). According to the administration manual for the recently published
AIMSweb M-CAP probes, the internal consistency and split-half reliability ranges from .81 to
.89.
M-CBM probes contained six rows of six problems across two pages, for a total of 72
computational problems. Third grade probes included addition sums to 2000 and subtraction
from 999. Fourth grade items included addition sums to 20000, subtraction from 5000,
multiplication facts to 12, and simple division from 144. Fifth grade probes included addition
sums to 20000, subtraction from 10000, multiplication facts to 999, and division with and
without remainders from 999. Each computation problem was scored by counting the number of
digits correct in the final answer, and the median number of digits correct across the three probes
for each student was used as the dependent measure for math computation.
The third grade M-CAP probes contained 29 problems, whereas the fourth and fifth grade
probes presented 30 problems. Although the level of difficulty increased with grade level, all
probes contained measurement, money, geometry, algebra, number relations, rounding, graphs,
word problems, fractions, number patterns, time, and temperature problems. Problems required
between one and three responses and varied in type (e.g., fill-in-the-blank, multiple choice). The
scoring key that is provided with the concepts/applications probes was used to score each probe.
The number of points awarded for each answer was weighted according to problem difficulty. As

12
per the scoring instructions, there was no partial credit; the entire answer had to be correct to
obtain the correct score value, and if any part of a multi-part answer was incorrect, the student
was given zero points for that item. The total number of points earned on the probe was used as
the dependent measure for math concepts/applications.
Probes were administered in a group format, with the size of groups dependent on the
number of students within each class who returned parental consent and gave their assent. If the
majority of students within one classroom were eligible to participate, the probes were
administered in the classroom. Otherwise, small groups of students were removed from the
classroom and completed the probes in the cafeteria or an empty classroom. Probes were placed
face-down and students were asked to write their names on the back of the last page of each
probe. The experimenter, who has extensive training and experience administering CBM probes,
used the standardized administration procedures provided in the administration manuals to
administer the probes. Third graders were given 2 minutes to complete the M-CBM probe,
whereas fourth and fifth graders were given 4 minutes. All students were allotted 8 minutes to
complete the M-CAP probe. Students were allowed to turn the probes over when the
administrator set an audible timer and said “Begin.” When the timer sounded, students were
asked to put their pencils down. Thirty percent of all administrations were observed by a research
assistant who recorded procedural integrity (M = 100%), and 30% of all probes were scored by a
research assistant in order to compute interscorer reliability (M = 96%). Inconsistent scores
across raters were re-scored until a consistent score was reached, which was then used in final
analyses.
Statewide Assessments. All fourth grade public school students are administered the
Louisiana Educational Assessment Program (LEAP), whereas all third and fifth grade students
13
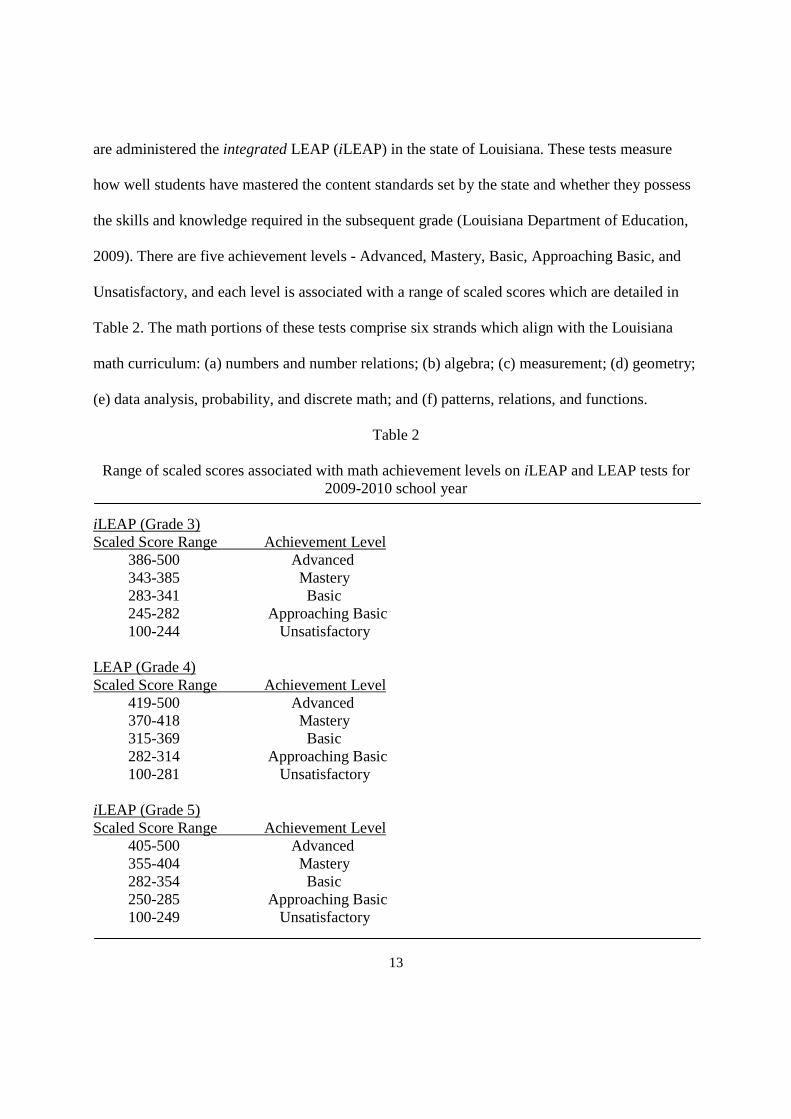
are administered the integrated LEAP (iLEAP) in the state of Louisiana. These tests measure
how well students have mastered the content standards set by the state and whether they possess
the skills and knowledge required in the subsequent grade (Louisiana Department of Education,
2009). There are five achievement levels - Advanced, Mastery, Basic, Approaching Basic, and
Unsatisfactory, and each level is associated with a range of scaled scores which are detailed in
Table 2. The math portions of these tests comprise six strands which align with the Louisiana
math curriculum: (a) numbers and number relations; (b) algebra; (c) measurement; (d) geometry;
(e) data analysis, probability, and discrete math; and (f) patterns, relations, and functions.
Table 2
Range of scaled scores associated with math achievement levels on iLEAP and LEAP tests for 2009-2010 school year
iLEAP (Grade 3) Scaled Score Range Achievement Level 386-500 Advanced 343-385 Mastery 283-341 Basic 245-282 Approaching Basic 100-244 Unsatisfactory LEAP (Grade 4) Scaled Score Range Achievement Level 419-500 Advanced 370-418 Mastery 315-369 Basic 282-314 Approaching Basic 100-281 Unsatisfactory iLEAP (Grade 5) Scaled Score Range Achievement Level 405-500 Advanced 355-404 Mastery 282-354 Basic 250-285 Approaching Basic 100-249 Unsatisfactory

14
According to the Louisiana Department of Education (LDE; 2009), the LEAP test was
constructed using items developed by testing contractors and approved of by an advisory
committee comprised of educators and assessment specialists. The items were judged on
congruence with the state assessment specifications, technical quality, and age-appropriate
content validity. Next, a bias review committee critiqued the items for gender, ethnicity and
special population issues. All approved items were included in a preliminary item bank and field
tested in randomly selected schools based on the following stratifications: school size, ethnicity,
socio-economic status, and achievement performance. The advisory committees conducted a
final review of the items after they were field tested and determined which items were to remain
in the item bank based on their statistical quality. Students taking the LEAP test must score Basic
or above on either the English Language Arts or the Mathematics test and Approaching Basic or
above on the other (referred to as the “Basic/Approaching Basic combination”) to be promoted to
fifth grade (LDE, 2009). The math portion of this test is comprised of three subtests: (a) 30
multiple choice items, (b) 30 multiple choice items, and (c) 3 constructed-response items.
Students are allowed as much time as necessary to complete the subtests, but suggested times are
provided in the test administration manual. Calculators are allowed on the second and third
subtests.
The iLEAP test was constructed using a combination of items from the Iowa Tests of
Basic Skills (ITBS, which the iLEAP replaced in 2006) and newly developed items designed to
measure state standards and grade level expectations. The new items covered gaps in the Iowa
test which did not directly address specific state content and performance standards. Therefore,
these new items, written specifically to align with state standards and referred to as the criterion
referenced test (CRT) component, were integrated into the ITBS test booklet, referred to as the

15
norm-referenced test (NRT) component, in order to meet the requirements of NCLB (LDE,
2009). The math portion of the iLEAP consists of four subtests administered in one day. Part one
presents four multiple choice estimation items to be completed in 3 minutes. Part two consists of
19 multiple choice conceptual questions to be completed in 22 minutes. Part three is comprised
of 27 multiple choice conceptual items, and part four presents two complex constructed-response
items that involve multiple steps and the application of various skills. Parts three and four are
untimed, although 60 minutes are recommended for part three and 20 minutes for part four.
Calculators are allowed during the second, third, and fourth subtests.
The LEAP and iLEAP tests were administered in mid-April by general and special
education teachers according to the standardized procedures that accompany the test. Individual
students’ scores from the math portion of the tests were gathered by the experimenter directly
from the schools’ score reports which were obtained from the state.
Teacher Reports. During the winter administration of CBM probes, teachers were asked
to predict the level of performance each of their participating students would achieve on the math
portion of the statewide assessment. Each teacher completed a form which listed each student’s
name and provided the possible levels of achievement next to each name; teachers simply
marked the predicted achievement level next to each student’s name.
Once final grades were determined in the spring (late May), teachers were asked to report
each participating student’s final grade in math. The schools in this study had an electronic
database in which final grades were entered by teachers and subsequently printed on report
cards; the experimenter simply recorded the students’ final grades from this database.

16
RESULTS
Outcomes with LEAP/iLEAP
The data were analyzed preliminarily to assess the distributional properties, identify
outliers, and ensure the appropriate parametric assumptions were met. Cases with missing data
were removed from all analyses. Pearson product-moment correlations were computed between
the two types of math probes and the statewide tests to determine the nature of their
relationships. As displayed in Table 3, all probes were significantly correlated with the statewide
test scores (p < .001). As predicted, the M-CAP probes were more highly correlated with
performance on the LEAP and iLEAP, perhaps due to the similarity of the content presented on
these measures. Hierarchical regression analyses revealed the winter M-CAP helped explain
more variance than the winter M-CBM alone whereas the winter M-CBM did not explain more
unique variance when entered after the winter M-CAP. The spring M-CBM and the spring M-
CAP both significantly account for variance in test scores.
Table 3
Pearson correlations between math scores on statewide test and M-CBM and M-CAP probes ______________________________________________________________________________ Test Score Winter Winter Spring Spring M-CBM M-CAP M-CBM M-CAP Test Score -- .32** .55** .30** .53**
Winter M-CBM -- .53** .89** .16*
Winter M-CAP -- .40** .56**
Spring M-CBM -- .14*
Spring M-CAP -- *p < .05, ** p < .001
17
Pearson correlations were also computed between the two administrations of the probes
(winter and spring) and the statewide test scores. The correlation between the winter probes and
the test scores can be considered a measure of the math probes’ predictive validity whereas the
relationship between the spring probes and the test scores is considered an indication of the
probes’ concurrent validity. As displayed in Table 3, both the winter and spring probes were
significantly correlated with test scores (p < .001). A series of regression analyses revealed
neither the winter nor the spring M-CBM probe significantly explained more variance in test
scores than the other, whereas both the winter and spring M-CAP probes significantly accounted
for variance in test scores.
The relationship between teacher report of future student performance and actual student
performance on the statewide tests was determined by conducting Pearson product-moment
correlations. As predicted, the teacher report was moderately and significantly correlated with
the statewide assessment scores (r = .67, p < .001). Although we hypothesized that the probes
would be a stronger predictor of test scores, the teacher reports of future student performance did
in fact add significantly to the variance associated with test scores when entered into a
hierarchical regression analysis after the probes. Likewise, the probes explained additional
unique variance in test scores when entered after teacher prediction of student performance.
The diagnostic accuracy of both types of math probes in predicting statewide test
performance was determined. Diagnostic accuracy is defined using the following terms: (Swets,
Dawes, & Monahan, 2000): (a) sensitivity refers to the percentage of students who were not
successful on the LEAP/iLEAP and scored below the cut score on the math probe; (b) specificity
refers to the percentage of students who passed the LEAP/iLEAP and scored at or above the cut
score on the math probe; (c) positive predictive power refers to the probability that the students

18
who scored below the cut score on the CBM measure will score below Basic on the
LEAP/iLEAP; (f) negative predictive power refers to the probability that students who scored at
or above the cut score on the CBM probe will score in the Basic range or above on the
LEAP/iLEAP; and (g) overall correct classification refers to the percent of agreement between
math probe cut scores and statewide test performance.
Receiver operator characteristic (ROC) curves, which graphically display the trade-off
between sensitivity and specificity, were created to identify explicit cut scores for the M-CBM
and M-CAP probes that are associated with passing or failing the statewide test. This procedure
allows the user flexibility in establishing cut scores that maximize both the sensitivity and
specificity of the measures. Once cut scores were established for each probe, the percentage of
students who were predicted to pass or fail and did so (i.e. they performed as predicted) was
calculated in order to determine the diagnostic accuracy of the math probes. For the 2009-2010
academic year, scores of 283, 315, and 282 were considered passing (or Basic achievement
level) for grades 3, 4, and 5, respectively. Therefore, these scores were used as the cut scores on
the LEAP and iLEAP that were subsequently compared to the established cut scores on the math
CBM probes to determine how well the probes distinguished between successful and
unsuccessful test results. The results of these analyses are presented in Table 4, which reveal
overall correct classification rates ranging from 61% to 73%. As predicted, the M-CAP probes
had higher overall correct classifications than the computational probes perhaps due to the
similarity of the items presented on the statewide assessment and the concepts/applications
probes.

19
Table 4
Diagnostic accuracy of probes for test scores
Winter M-CBM Winter M-CAP Spring M-CBM Spring M-CAP Cut score 40 10 19 9 Sensitivity .92 .83 .38 .67 Specificity .32 .60 .84 .79 False positive rate .68 .40 .16 .21 False negative rate .08 .17 .62 .33 Positive predictive power .21 .29 .32 .38 Negative predictive power .95 .95 .87 .92 Hit rate .62 .72 .61 .73
Outcomes with Final Grades
Pearson product-moment correlations were calculated between scores on the math probes
and final grades in math (see Table 5). Both types of math probes were significantly correlated
with final grades, with the concepts/applications probes having stronger correlations than the
computational probes perhaps due to the alignment between the state’s curriculum and the
material presented on the M-CAP probe.
Table 5
Correlations between math probes and final math grades Final Grade
Winter M-CBM .25*
Winter M-CAP .37**
Spring M-CBM .25*
Spring M-CAP .40** *p < .01, ** p < .001

20
Outcomes by Grade Level
The correlations between the math probes, math scores on the statewide test, and final
math grades were computed for each grade level and are presented in Table 6.
Table 6
Correlations between math probes and statewide test scores and final math grades across grade levels
Grade 3 Test Score Final Grade Winter M-CBM .46*** .49***
Winter M-CAP .56*** .47***
Spring M-CBM .42*** .54***
Spring M-CAP .62*** .50***
Grade 4 Test Score Final Grade Winter M-CBM .42** .51***
Winter M-CAP .61*** .55***
Spring M-CBM .38** .51***
Spring M-CAP .64*** .52***
Grade 5 Test Score Final Grade Winter M-CBM .15 .06
Winter M-CAP .39** .19
Spring M-CBM .27* .16
Spring M-CAP .38** .30* *p < .05, ** p < .01, *** p < .001
These correlations should be interpreted with caution and considered only tentative as the
number of participants in each grade was not enough to reach an adequate level of power;

21
however, the pattern remains that the M-CAP scores are more highly correlated with test scores
and final grades than the M-CBM scores.
ROC curve analyses using math probes to predict test outcomes were conducted for each
grade level. The results of these analyses are presented in Table 7, which found a score of 16
digits correct on the winter and spring M-CBM probes and scores of 6 in the winter and 9 in the
spring on M-CAP probes attained the highest levels of diagnostic accuracy in third grade. Scores
of 45 digits correct in the winter and 46 digits correct in the spring on fourth grade M-CBM
probes and scores of 11 in the winter and 10 in the spring on the fourth grade M-CAP probes
showed the highest levels of diagnostic accuracy. In fifth grade, scores of 38 in the winter and 48
in the spring on M-CBM probes and scores of 10 in the winter and 6 in the spring on M-CAP
probes showed the highest levels of sensitivity and specificity. The M-CAP probes had higher
overall correct classifications than the computational probes in fourth and fifth grade whereas the
M-CBM probes had higher hit rates than the M-CAP probes in third grade.
The diagnostic accuracy of the probes in predicting final math grades in third grade are
displayed in Table 8. A score of 16 digits correct on the winter and spring M-CBM probes as
well as scores on the M-CAP probes of 5 in the winter and 9 in the spring showed the highest
sensitivity and specificity. Notably, these results are nearly identical to the cut scores that were
determined for predicting performance on the iLEAP test in third grade. Results could not be
computed for fourth and fifth grade due to the fact all fourth and fifth grade students received a
passing final math grade.

22
Table 7
Diagnostic accuracy of probes for test scores across grade levels ______________________________________________________________________________
Grade 3 __________________Winter M-CBM Winter M-CAP Spring M-CBM Spring M-CAP__ Cut score 16 6 16 9 Sensitivity .88 .75 .75 .63 Specificity .79 .85 .83 .88 False positive rate .21 .15 .17 .12 False negative rate .12 .25 .25 .37 Positive predictive power .41 .46 .43 .46 Negative predictive power .97 .95 .95 .93 Hit rate .84 .80 .79 .76
Grade 4 Winter M-CBM Winter M-CAP Spring M-CBM Spring M-CAP Cut score 45 11 46 10 Sensitivity 1.00 .78 .89 .67 Specificity .33 .74 .46 .85 False positive rate .67 .26 .54 .15 False negative rate .00 .22 .11 .33 Positive predictive power .26 .41 .28 .50 Negative predictive power 1.00 .94 .95 .92 Hit rate .67 .76 .68 .76
Grade 5 Winter M-CBM Winter M-CAP Spring M-CBM Spring M-CAP Cut score 38 10 48 6 Sensitivity .86 1.00 .71 .71 Specificity .66 .51 .66 .77 False positive rate .34 .49 .34 .23 False negative rate .14 .00 .29 .29 Positive predictive power .33 .29 .29 .39 Negative predictive power .96 1.00 .92 .93 Hit rate .76 .76 .69 .74

23
Table 8
Diagnostic accuracy of probes for final math grades in 3rd grade ______________________________________________________________________________
Grade 3 __________________Winter M-CBM Winter M-CAP Spring M-CBM Spring M-CAP__ Cut score 16 5 16 9 Sensitivity 1.00 .60 1.00 .80 Specificity .76 .86 .82 .86 False positive rate .24 .14 .18 .14 False negative rate .00 .40 .00 .20 Positive predictive power .29 .30 .36 .36 Negative predictive power 1.00 .96 1.00 .98 Hit rate .88 .73 .91 .83

24
DISCUSSION
The purpose of this study was to add to the existing research on the relationship between
math CBM scores and high-stakes test scores as well as establish the accuracy of math CBM
probes in predicting student performance on the statewide achievement test in Louisiana. Similar
to the results from Shapiro et al. (2006) and Keller-Margulis et al. (2008), the results of this
study showed that math computation and math concepts/applications curriculum-based measures
had moderate to strong relationships with outcomes on high-stakes assessments. The correlations
between the math probes and statewide math test scores were consistent across winter and spring
assessment periods. The correlations with test scores were consistently higher for the M-CAP
probes, which ranged from r = .53 to .55, than for the M-CBM probes, which ranged from r =
.30 to .32. The same pattern existed for correlations between the math probes and final math
grades: M-CAP probe correlations were in the r = .37-.40 range whereas M-CBM probe
correlations were both r = .25. Furthermore, this pattern held true across the three grade levels
investigated. Although correlations were consistently higher with M-CAP probes, all correlations
were statistically significant.
When examining the results of the hierarchical regression analyses, there was a consistent
pattern that M-CAP probes explained more unique variance in test scores than M-CBM probes.
This held true for both assessment periods (winter and spring). Therefore, adding a
conceptual/applications measure offers a better explanatory model than does a computational
measure alone. Additionally, adding teacher prediction of future student performance explains
more variance in state assessment scores than having either an M-CBM or M-CAP measure
alone.

25
To further determine how well curriculum-based math measures predict outcomes on the
LEAP and iLEAP, an analysis of diagnostic accuracy was conducted for each of the math
probes. Overall correct classification rates were between 61% and 72%, a level that suggests that
the CBM metrics are appropriate measures for the purpose of universally screening students. As
hypothesized, M-CAP probes had consistently higher rates of overall correct classification.
Practical Implications
One implication of this study is the potential use of two types of math curriculum-based
measures as effective screening tools that predict performance on the Louisiana statewide
assessments. The results showed that a quick sample of math computation and
concepts/applications obtained during early February had moderate to strong predictive power to
identify students who were not likely to achieve a passing score on the math portion of the state
test, which was administered in mid-April. Although there were several false positive and false
negative decisions, the probes can serve as efficient and inexpensive screening tools which can
potentially identify a large group of students who are at risk for not achieving a passing score on
the statewide assessment. Knowing how many and which students may be at-risk can guide
school administrators in implementing an intensive, short-term remediation program focused on
teaching the skills necessary to be successful in the general math curriculum as well as on the
statewide assessment. Considering the high-stakes nature of the statewide assessments, these
remediation efforts would be vital for students, teachers, schools, and districts.
The majority of assessments used in schools today are unable to monitor progress
because they typically cannot be administered repeatedly or frequently. The progress monitoring
capability of curriculum-based measures allows school personnel to have consistent and on-

26
going data on the status of their students in regard to state standards, rather than waiting for the
return of statewide testing results in late spring.
Limitations
There are several limitations that affect the degree to which the findings of this study can
be applied to various other student populations. First, it is imperative to note that only students
who returned parental permission and who assented to participate were eligible for participation.
Although it is not confirmed, it is probable that students who volunteered to participate and who
displayed responsibility by returning parental permission slips may differ from students who
were not willing to participate or were not successful in returning parental consent. For example,
a student’s awareness that he typically is not successful on math assignments may lead him to
decline participation in a study which presents numerous math tasks. And despite the fact there
were participants who performed poorly on the curriculum-based measures, the statewide
assessment and/or in their math class, it is fairly likely more highly-performing students
participated in this study, which does not result a fully representative sample of students.
Similarly, only students who had complete data sets were included in final data analyses.
Unfortunately, there were a number of students who were either absent during the second
administration of curriculum-based measures or who initially gave assent and returned parental
consent but subsequently withdrew from the study before completing all CBM probes. Such
attrition once again limits the representativeness of the final sample.
Finally, this study was conducted in only three schools across two districts in Louisiana.
Although the schools represented very different demographics, it is certainly likely that the
results of this study would not be representative of the majority of Louisiana students. Therefore,

27
additional replications of the methods in this study need to be conducted across other schools and
districts in Louisiana in order to obtain more representative results that can be applied statewide.

28
CONCLUSION
Today’s schools must show increases in the number of students who are proficient in
reading and math each year (NCLB, 2001). The primary accountability tool used to determine
whether students are meeting benchmarks is an annual comprehensive evaluation, which has
limited utility in that it is a one-time, broad based assessment that fails to provide specific
feedback in a timely manner. The outcomes of this research study link one of the political
pressures affecting educators today with an evidence-based practice: universal benchmarking
using curriculum-based measures.
The results of this study were similar to those found in studies that were conducted in
other states, which show that CBM probes can serve as effective screening measures for
performance on statewide tests. These types of measures can be administered throughout the
academic year to determine where students stand in relation to state standards. Teachers and
students can receive crucial feedback at a time when such information can promote necessary
changes in instruction. Having an indication of which students are likely to receive a failing
grade in math class or on the statewide assessment may motivate educators to provide more
intensive services earlier in the school year; in other words, utilizing a screening measure
promotes proactive strategies rather than reactive approaches to education, such as waiting for
students to fail and then attempting to remediate their difficulties during a repeated grade level.
Discovering the significant relationship between the recently-published AIMSweb M-
CAP probes and the Louisiana statewide tests contributes to the knowledge base in conceptual
mathematics CBM, an area which lacks empirical investigations. Also, verifying the
advantageous contribution of teacher prediction of student test performance in determining
future test outcomes substantiates teachers’ value and provides practical information for schools.

29
Due to the accountability laws currently in place and the ramifications associated with
poor test results, it is unlikely that schools and everyone that is a part of them will cease to focus
on the outcomes of statewide tests. Thus, it is imperative to utilize tools that have the ability to
forecast test performance as well as specify deficits that require remedial instruction, with the
ultimate goal of increasing the number of students who perform successfully.

30
REFERENCES
AIMSweb system. Retrieved from http://www.aimsweb.com
Barger, J. (2003). Comparing the DIBELS oral reading fluency indicator and the North Carolina end of grade reading assessment (Technical Report). Asheville: North Carolina Teacher Academy.
Braden, J. P. (2002). Best practices for school psychologists in educational accountability: High stakes testing and educational reform. In A. Thomas & J. Grimes (Eds.), Best practices in school psychology IV (Vol. 1, pp. 301-320). Bethesda, MD: National Association of School Psychologists.
Buck, J., & Torgeson, J. (2003). The relationship between performance on a measure of oral reading fluency and performance on the Florida Comprehensive Assessment Test (Technical Report 1). Tallahassee: Florida Center for Reading Research.
Cizek, G. J., & Burg, S. S. (2006). Addressing test anxiety in a high-stakes environment. Thousand Oaks, CA: Corwin Press.
Crawford, L., Tindal, G., & Steiber, S. (2001). Using oral reading rate to predict student performance on statewide achievement tests. Educational Assessment, 7, 303-323.
Deno, S. L., Espin, C. A., & Fuchs, L. S. (2002). Evaluation strategies for preventing and remediating basic skill deficits. In M. R. Shinn, H. M. Walker, & G. Stoner (Eds.), Interventions for academic and behavior problems II: Preventative and remedial approaches (pp. 213-241). Bethesda, MD: National Association of School Psychologists.
Faul, F., Erdfelder, E., Lang, A.-G., & Buchner, A. (2007). G*Power 3: A flexible statistical power analysis program for the social, behavioral, and biomedical sciences. Behavior Research Methods, 39, 175-191.
Foegen, A., Jiban, C., & Deno, S. (2007). Progress monitoring measures in mathematics: A review of the literature. The Journal of Special Education, 41, 121-139.
Fuchs, L. S., & Deno, S. L. (1991). Paradigmatic distinctions between instructionally relevant measurement models. Exceptional Children, 57, 488-500.
Fuchs, L. S., & Fuchs, D. (1999). Monitoring student progress toward the development of reading competence: A review of three forms of classroom-based assessment. School Psychology Review, 28, 659-671.
Fuchs, L. S., Fuchs, D., Hamlett, C. L., Thompson, A., Roberts, P. H., Kubek, P., et al. (1994). Technical features of a mathematics concepts and supplications curriculum-based measurement system. Diagnostique, 19, 23-49.
31
Fuchs, L. S., Fuchs, D., & Zumeta, R. O. (2008). A curricular sampling approach to progress monitoring: Mathematics concepts and applications. Assessment for Effective Intervention, 33, 225–233.
Fuchs, L. S., Hamlett, C. L., & Fuchs, D. (1998). Monitoring basic skills progress: Basic math computation (2nd ed.) [computer program]. Austin, TX: Pro-Ed.
Fuchs, L. S., Hamlett, C. L., & Fuchs, D. (1999). Monitoring basic skills progress: Basic math concepts and applications (2nd ed.) [computer program]. Austin, TX: Pro-Ed.
Good, R. H., Simmons, D. C.,& Kame’enui, E. J. (2001). The importance and decision-making utility of a continuum of fluency-based indicators of foundational reading skills for third-grade high-stakes outcomes. Scientific Studies of Reading, 5, 257-288.
Hayes, S., Nelson, R., & Jarrett, R. (1987). The treatment utility of assessment: A functional approach to evaluating assessment quality. American Psychologist, 42, 963-974. Helwig, R., Anderson, L., & Tindal, G. (2002). Using a concept-grounded, curriculum-based
measure in mathematics to predict statewide test scores for middle school students with LD. Journal of Special Education, 36, 102-112.
Hintze, J. M., Christ, T. J., & Keller, L. A. (2002). The generalizability of CBM survey-level mathematics assessments: Just how many samples do we need? School Psychology Review, 31, 514-528.
Hintze, J. M., & Silberglitt, B. (2005).A longitudinal examination of the diagnostic accuracy and predictive validity of R-CBM and high-stakes testing. School Psychology Review, 34, 372-386.
Hosp, M. K., Hosp, J. L., & Howell, K. W. (2007). The ABCs of CBM: A practical guide to curriculum-based measurement. New York, NY: The Guilford Press.
Jiban, C. L., & Deno, S. L. (2007). Using math and reading curriculum-based measurements to predict state mathematics test performance: Are simple one-minute measures technically adequate? Assessment for Effective Intervention, 32, 78-89.
Jimerson, S. R. (2001). Meta-analysis of grade retention research: Implications for Practice in the 21st century. School Psychology Review, 30, 420-437.
Keller-Margulis, M. A., Shapiro, E. S., Hintze, J. M. (2008). Long-term diagnostic accuracy of curriculum-based measures in reading and mathematics. School Psychology Review, 37, 374-390.
Linn, R. L. (2000). Assessments and accountability. Educational Researcher, 29, 4-16.
Louisiana Department of Education. Standards, assessments, and accountability. Retrieved from

32
http://www.louisianaschools.net
McGlinchey, M. T. & Hixson, M. D. (2004). Using curriculum-based measurement to predict performance on state assessments in reading. School Psychology Review, 33, 193-203.
No Child Left Behind (NCLB) Act of 2001. Pub. L. No. 107-110, H.R. 1, 115 Stat. 1425.
Popham, W. J. (2003). Test better, teach better: The instructional role of assessment. Alexandria, VA: Association for Supervision and Curriculum Development.
Shapiro, E. S., Keller, M. A., Edwards, L., Lutz, G., & Hintze, J. M. (2006). General outcome measures and performance on state assessment and standardized tests: Reading and math performance in Pennsylvania. Journal of Psychoeducational Assessment, 42, 19-35.
Shaw, R., & Shaw, D. (2002). DIBELS oral reading fluency-based indicators of third grade reading skills for Colorado State Assessment Program (CSAP) (Technical Report). Eugene: University of Oregon Press.
Stage, S. A., & Jacobsen, M. D. (2001). Predicting student success on a state-mandated performance-based assessment using oral reading fluency. School Psychology Review, 30, 407-419.
Swets, J. A. (1996). Signal detection theory and ROC analysis in psychology and diagnostics. Hillsdale, NJ: Lawrence Erlbaum.
Swets, J. A., Dawes, R. M., & Monahan, J. (2000). Psychological science can improve diagnostic decisions. Psychological Science in the Public Interest, 1, 1-26.
Thurber, R. S., Shinn, M. R., & Smolkowski, K. (2002). What is measured in mathematics tests? Construct validity of curriculum-based mathematics measures. School Psychology Review, 31, 498-513.

33
VITA
Keri F. Menesses is a candidate for the Doctor of Philosophy degree in the school
psychology program at Louisiana State University. She graduated summa cum laude with a
Bachelor of Science degree in psychology in 2005 and received her Master of Arts degree in
psychology in 2008 from Louisiana State University. Keri has completed her graduate work
under the supervision of Dr. Frank M. Gresham.