Embed Size (px)
Citation preview
WORK ING PAPER SER I E SNO 1385 / OCTOBER 2011
by Ulf von Kalckreuth,Tobias Schmidtand Helmut Stix
USING CASH TO MONITOR LIQUIDITY
IMPLICATIONSFOR PAYMENTS, CURRENCY DEMAND AND WITHDRAWAL BEHAVIOR
CONFERENCE ON THE FUTURE OF RETAIL PAYMENTS: OPPORTUNITIES AND CHALLENGES
CONFERENCE ON THE FUTURE OF RETAIL
PAYMENT: OPPORTUNITIES AND CHALLENGES
1 The opinions expressed in this paper are those of the authors and do not necessarily reflect the
views of the Deutsche Bundesbank or the Oesterreichische Nationalbank.
2 Deutsche Bundesbank, Wilhelm-Epstein-Strasse 14, D-60431 Frankfurt am Main, Germany;
e-mails: [email protected] and [email protected].
3 Österreichische Nationalbank, Otto-Wagner-Platz 3, 1090 Wien,
Austria; e-mail: [email protected].
This paper can be downloaded without charge from http://www.ecb.europa.eu or from the Social Science Research Network electronic library at http://ssrn.com/abstract_id=1932608.
NOTE: This Working Paper should not be reported as representing the views of the European Central Bank (ECB). The views expressed are those of the authors
and do not necessarily reflect those of the ECB.
WORKING PAPER SER IESNO 1385 / OCTOBER 2011
USING CASH TO MONITOR
LIQUIDITY – IMPLICATIONS FOR
PAYMENTS, CURRENCY DEMAND
AND WITHDRAWAL BEHAVIOR 1
by Ulf von Kalckreuth 2, Tobias Schmidt 2 and Helmut Stix 3
In 2011 all ECBpublications
feature a motiftaken from
the €100 banknote.

© European Central Bank, 2011
AddressKaiserstrasse 2960311 Frankfurt am Main, Germany
Postal addressPostfach 16 03 1960066 Frankfurt am Main, Germany
Telephone+49 69 1344 0
Internethttp://www.ecb.europa.eu
Fax+49 69 1344 6000
All rights reserved.
Any reproduction, publication and reprint in the form of a different publication, whether printed or produced electronically, in whole or in part, is permitted only with the explicit written authorisation of the ECB or the authors.
Information on all of the papers published in the ECB Working Paper Series can be found on the ECB’s website, http://www.ecb.europa.eu/pub/scientific/wps/date/html/index.en.html
ISSN 1725-2806 (online)
3ECB
Working Paper Series No 1383October 2011
The future of retail payments: opportunities and challenges
The way people pay is continuously changing, as a result of innovations in retail
payments, improvements in efficiency and regulatory changes. This changing
environment creates opportunities for some and challenges for others in the retail
payments sector. The impact of these changes on the future of retail payments was
the main theme of the biannual retail payments conference organised by the European
Central Bank (ECB), this time in cooperation with the Oesterreichische Nationalbank
(OeNB), on 12 and 13 May 2011 in Vienna. More than 200 high-level policymakers,
financial sector representatives, academics and central bankers from Europe and other
regions attended this conference, reflecting the topicality of and interest in the retail
payments market.
The aim of the conference was to better understand current developments in retail
payment markets and to identify possible future trends, by bringing together
policymaking, research activities and market practice. A number of key insights and
conclusions emerged. The Single Euro Payments Area (SEPA) project is recognised
as being on the right track, even though some further work needs to be done in the
areas of standardisation of card payments and migration towards SEPA instruments.
The European Commission’s proposal for a regulation setting an end date for
migration to SEPA credit transfers and SEPA direct debits is welcomed. For SEPA to
be a success, it is essential that users are involved, in order to ensure acceptance of
the SEPA instruments. Moreover, innovations in retail payments are taking place
more rapidly than ever, and payment service providers and regulators need to adapt
quickly to this changing business environment.
We would like to thank all participants in the conference for the very interesting
discussions. In particular, we would like to acknowledge the valuable contributions
and insights provided by all speakers, discussants, session chairpersons and
panellists, whose names can be found in the conference programme. Their main
statements are highlighted in the ECB-OeNB official conference summary. Six

4ECBWorking Paper Series No 1383October 2011
papers related to the conference have been accepted for publication in this special
series of the ECB Working Papers Series.
Behind the scenes, a number of colleagues from the ECB and the OeNB contributed
to both the organisation of the conference and the preparation of these conference
proceedings. In alphabetical order, many thanks to Nicola Antesberger, Stefan
Augustin, Michael Baumgartner, Christiane Burger, Stephanie Czák, Susanne
Drusany, Henk Esselink, Susan Germain de Urday, Monika Hartmann, Monika
Hempel, Wiktor Krzyzanowski, Thomas Lammer, Tobias Linzert, Alexander
Mayrhofer, Hannes Nussdorfer, Simonetta Rosati, Daniela Russo, Wiebe Ruttenberg,
Heiko Schmiedel, Doris Schneeberger, Francisco Tur Hartmann, Pirjo Väkevainen
and Juan Zschiesche Sánchez.
Gertrude Tumpel-Gugerell Wolfgang Duchatczek
Former member of the Executive Board Vice Governor European Central Bank Oesterreichische Nationalbank
5ECB
Working Paper Series No 1385October 2011
Abstract 6
Non-technical summary 7
1 Introduction 9
2 Cash is memory: bounded rationality and the choice of payment instruments 12
2.1 The basic idea 12
2.2 Objective function and transaction costs 13
2.3 Behavior under full information on liquidity 15
2.4 Costs of planning and budgeting 15
2.5 The trade-off involved 17
3 Testable hypotheses and empirical implications 19
4 Data and variable defi nition 20
4.1 Data 20
4.2 Defi nition of payment and withdrawal variables 21
4.3 Comparing consumers 21
5 Results 23
5.1 Descriptive evidence based on acomparison of consumers 23
5.2 Reduced form regression results 25
5.3 Correlation structure of endogenous variables 30
6 Conclusions 32
References 34
Tables and fi gures 37
Appendices 46
CONTENTS
6ECBWorking Paper Series No 1385October 2011
Abstract: Standard transaction cost arguments can only partially explain why the share of cash transactions is still high in many countries. This paper shows that consumers’ desire to monitor liquidity is one of the reasons. Consumers make use of a distinctive feature of cash – a glance into one’s pocket provides a signal for both the remaining budget as well as the level of past expenses. We propose a theoretical framework which incorporates this feature of cash, and derives implications not only for cash usage as such but also for a broader set of payment-related activities. Survey data from Germany on consumers’ payment and withdrawal patterns are used to test these implications empirically. The data are consistent with all theoretical predictions: consumers who need to keep control over their remaining liquidity and who have elevated costs of information processing and storage will conduct a larger percentage of their payments using cash, hold fewer non-cash payment instruments, withdraw less often and hold larger cash balances than other consumers. Such consumers also use payment cards for some transactions; they switch to non-cash payment instruments only at higher transaction values than other consumers, however. Our model provides an explanation of why cash usage has declined only slowly in some countries despite broad diffusion of non-cash means of payment.
Keywords: Payment behavior, payment instruments, withdrawal behavior, payment cards, payment innovation, cash usage, currency demand, survey data
JEL Classification: E41, E58, D12
7ECB
Working Paper Series No 1385October 2011
Non-technical summary
This paper is motivated by two observations. First, cash is still used extensively in many
countries despite the existence of a well-developed card payment infrastructure. Second, the
use of cash is characterized by considerable heterogeneity even within narrowly defined
demographic groups.
In order to analyze why some consumers use cash more extensively than others, we look for
characteristics of cash that are not reflected in standard transaction cost measures. In
particular, we focus on the distinctive feature of cash – it contains memory. At every point in
time, a glance into one’s pocket provides a signal about the extent of expenses and the
remaining budget. With a large cash share of expenditures, the quality of the signal is high.
We conjecture that for some consumers this signal is of value and hence they choose to use
cash.
We incorporate the idea that consumers use cash to monitor their budget into a formal model.
The necessity to monitor liquidity is given by the fact that expenditures are, to some extent,
stochastic. Unforeseen consumption opportunities pop up, sometimes many of them in a small
time interval, and it is difficult to plan ahead. In order to avoid a costly breach of their
budgetary restrictions, some consumers need a rather concise overview of their remaining
liquidity. Because cash has memory, it is very informative about the level of past expenditures
and about the remaining liquidity.
The value provided by this signal differs across consumers. Not all consumers need to keep a
close eye on their budget. Furthermore, if budget discipline is necessary, using cash is not the
only strategy: some consumers may use accounting tools (e.g. expenditure diaries), some are
able to mentally keep track of their expenses, and some use payment cards and the associated
records provided in account statements. Keeping track of liquidity via cash usage is chosen by
consumers characterized both by liquidity constraints and by limited information processing
capabilities ("restricted consumers"). For these consumers, the costs of using alternative
monitoring technologies are high.The model has implications not only for cash usage as such
but also for a broad set of other payment-related activities. In particular, the proposed model
predicts that consumers who use cash to monitor liquidity (i) carry out a larger percentage of
their expenditures using cash, (ii) hold fewer payment instruments and (iii) withdraw cash less
frequently than others. Note that these consumers may also use payment cards; however, they
(iv) start to use payment cards at higher expenditure values than “unrestricted consumers”.

8ECBWorking Paper Series No 1385October 2011
Testing the model with survey data from Germany yields broad support for our hypotheses.
The need to monitor liquidity does indeed seem to be an important explanation for cash usage.
This assessment is based on descriptive evidence and on a series of reduced form estimations,
explaining cash usage patterns, the cash share of consumers, the number of payment
instruments in use and withdrawal behavior. Moreover, we show that the correlation structure
among payment variables that is predicted by our model can be found in the data. This step of
our analysis is carried over to survey data from other countries.
9ECB
Working Paper Series No 1385October 2011
1. Introduction
This paper is motivated by two observations. First, although the usage of cash at the point-of-
sale has long been declared obsolete, empirical facts strongly challenge this presumption. In
an attempt to gauge the use of cash, the European Central Bank (ECB, 2011) reports that 55%
of respondents in the euro area make payments up to 100 euro in cash.1 The fact that cash is
still used extensively in many countries despite the existence of a well-developed card
payment infrastructure suggests that consumers are relatively insensitive to the substantial
changes in relative costs of payment instruments which have occurred over the past decade. In
the case of Germany, von Kalckreuth, Schmidt & Stix (2009) find little evidence that this
sluggish response can be attributed to habit persistence only.
Second, comparing consumers, the use of cash exhibits considerable heterogeneity even
within narrow demographic groups. As a case in point, for well-educated German consumers
between the age of 35 to 45 who live in large cities and own a debit card, we find a standard
deviation of 33% for the mean cash share in terms of value, where the estimated level is 55%.
This heterogeneity is not specific to the German situation: comparable numbers can also be
found for countries for which data are readily available.2 It seems unlikely that these
interpersonal differences can be explained entirely by differences in pecuniary transaction
costs, regional differences in the payment infrastructure or by comfort-with-technology
effects.
Starting from these observations, we analyze why some consumers use cash more extensively
than others. We stipulate that cash has characteristics which are valued by consumers and
which are not reflected in standard transaction cost measures. In particular, we focus on the
distinctive feature of cash – it contains memory. At every point in time, a glance into one’s
pocket provides a signal about the extent of expenses and the remaining budget. With a high
cash share of expenditures, the information content of this signal is rich. We conjecture that
for some consumers this signal is more valuable than for others, and that hence they choose to
use cash more intensively.
1 Spain, Italy, Austria and Germany are examples where cash payments are still very important – not only in terms of volume but also in terms of value. 2 For example, the respective cash shares are 66% for this group of Italian households with a standard deviation of 38%, and 56% for Austrian households with a standard deviation of 32%. The surveys used for these comparisons are described in more detail in the Appendix. A similar observation is made in Schuh and Stavins for US consumers (2009): “payment demand is far more heterogeneous within narrow demographic groups than across them” (ibid. p. 1745).
10ECBWorking Paper Series No 1385October 2011
The relevance of this approach is backed by data suggesting that the desire to keep track of
liquidity is an important factor in the choice of payment instruments in general and for the use
of cash in particular. For example, German survey data show that for 76% of respondents,
cash is a useful payment instrument to keep control of their budget. When asked about the
reasons for using different payment instruments, survey respondents from the Netherlands
(Jonker, 2007) and from Austria (Mooslechner, Stix, Wagner, 2006) cite the budget-
monitoring feature of cash as a predominant reason for using cash.3 Evidence reported by
Ching & Hayashi (2010) shows that cash is the payment instrument which receives the
highest approval by US consumers in terms of the statement “helps me budget”. These results
tally closely with experimental findings from the economic-psychology literature, which has
convincingly demonstrated that the willingness to spend is higher if a good is paid for by
credit card rather than by cash, that credit card usage creates an illusion of liquidity and that
credit card users tend to forget past transactions (e.g. Soman, 2001; Prelec & Simester, 2001).
We incorporate the idea that consumers use cash to monitor their budget into a formal model.
The necessity to monitor liquidity is given by the fact that expenditures are, to some extent,
stochastic. Unforeseen consumption opportunities pop up, sometimes many of them in a small
time interval, and it is difficult to plan ahead. In order to avoid a costly breach of their
budgetary restrictions, some consumers need a rather concise overview of their remaining
liquidity. Because cash has memory, it is very informative about the level of past expenditures
and about the remaining liquidity.
The value provided by a glance into one’s pocket differs across consumers, i.e. not all
consumers need to keep a close eye on their budget and, if budget discipline is necessary,
using cash is not the only option. Some consumers may use accounting tools (e.g. expenditure
diaries), some are able to mentally keep track of their expenses and some use payment cards
and the associated records provided in account statements. We stipulate that keeping track of
liquidity via cash usage is chosen mainly by consumers characterized both by liquidity
constraints and by limited information processing capabilities ("restricted consumers"). For
3 In this context, it is interesting that US consumers rate cash lowest when it comes to record keeping (Schuh & Stavins, 2010). Note, however, that the concept of “record keeping” and our concept of “budget monitoring” differ. A debit or credit card statement can provide an excellent overview of the level and the composition of expenses – but only at the end of a month or via online access. In contrast, a glance into one’s pocket gives an instantaneous signal of the level of remaining liquidity and budget.
11ECB
Working Paper Series No 1385October 2011
these consumers, the costs of using alternative monitoring technologies are high and, hence,
they rely on the monitoring feature of cash. By doing this, the model explicitly takes account
of the observed heterogeneity across consumers.
A salient feature of the proposed model is that it bears implications not only for cash usage as
such but also for a broad set of other payment-related activities. In particular, the proposed
model predicts that consumers who use cash to monitor liquidity (i) carry out a larger
percentage of their expenditures using cash, (ii) hold fewer payment instruments and, (iii)
withdraw cash less frequently than others. Note that these consumers may also use payment
cards; however, they (iv) start to use payment cards at higher expenditure values than
“unrestricted consumers”.
The theoretical predictions are confronted with data. Our principal data source is a survey of
German consumers that comprises transaction records from a payments diary as well as
detailed information on various, more general aspects of respondents’ payment and
withdrawal behavior. We find that the data are consistent with all theoretical predictions of
our model. This assessment is based on descriptive evidence and a series of reduced form
estimations, explaining cash usage patterns, the cash share of consumers, the number of
payment instruments in use and withdrawal behavior. Moreover, we employ alternative
definitions of “restricted” and “unrestricted” consumers and we test whether the correlation
structure among payment variables that is predicted by our model can be found in the data.
These results yield broad support for the view that the monitoring feature of cash exerts an
independent and sizeable effect, above and beyond the effect of standard pecuniary
transaction cost variables.
Our paper is related to several previous contributions. First, Ameriks, Caplin and Leahy
(2004) are among the first to note the memory feature of cash, albeit without working out its
implications for the payment structure of consumers.4 Second, by highlighting the effect of a
particular characteristic of cash, our paper is related to a strand of the literature which has
directed increasing attention to the role of payment instrument characteristics for the choice of
payment instruments (e.g. Arango, Huynh & Sabatti, 2011; Borzekowski & Kiser 2008;
Schuh & Stavins, 2010).5 While this literature consistently finds that payment instrument
4 Kockerlakota (1998) employed the idea that cash has memory in a different context, namely to derive fiat money’s technological role in an economy. 5 Our paper is also related to the literature on self-control: Bertaut, Haliassos & Reiter (2009) and Fusaro (2008), for example, focus on self-control in the context of debit or credit cards.

12ECBWorking Paper Series No 1385October 2011
characteristics are very important for the choice of payment instruments, relatively little is
known about why this is the case. Third, our paper is related to the recent literature on
demand for currency in the presence of financial innovations (Alvarez & Lippi, 2009;
Attanasio, Guiso & Jappelli, 2002; Bounie, Francois & Houy, 2007; Klee, 2008; Lippi &
Secchi, 2009; von Kalckreuth, Schmidt & Stix, 2009). Our approach can be seen as
complementary to these strands of the literature, and our main contribution is to provide a
systematic treatment of a currency demand model which incorporates the behavioral feature
of self-control. We provide an explanation of why the memory feature of cash is important
and thereby bridge the gap between the currency demand literature and the choice of payment
instruments literature. Our results demonstrate that cash can retain its importance despite the
presence of seemingly more cost-efficient alternative payment instruments. Moreover, we
demonstrate that incorporating the memory feature of cash has explanatory power that goes
beyond the mere case of cash usage, i.e. it influences withdrawal behavior, card adoption and
cash demand. Previous investigations have analyzed these different aspects in isolation, while
our results show that they are intimately related. As a case in point, payment card usage
frequencies and the number of currency withdrawals are positively correlated; this is a fact
that cannot easily be explained by standard transaction cost arguments.
The paper is structured as follows. Section 2 presents the theoretical model. Section 3
discusses the testable hypotheses. Section 4 presents the data. Results are discussed in Section
5. Section 6 concludes.
2. Cash is Memory: Bounded Rationality and the Choice of
Payment Instruments
2.1. The Basic Idea We argue that using cash is a simple device for monitoring liquidity. Meeting liquidity targets
may have importance to many consumers, either because of high costs of overdraft or because
this would violate some rule they have set themselves to avoid overspending. Furthermore,
costs of storing and processing information may make it difficult to know the amount of
remaining liquidity at the time of decision making. In those cases, paying in cash is an
attractive alternative to card payments. A glance into one’s pocket immediately and costlessly
informs the consumer on remaining cash. The information content of this partial knowledge
will depend on payments behavior, as cash is not the only relevant store of liquidity. If a

13ECB
Working Paper Series No 1385October 2011
consumer makes all payments in cash, knowledge of remaining cash is almost sufficient: the
only other piece of information needed is the residual liquidity on the bank deposit when the
last withdrawal was made. If some transactions are made electronically, a mental updating is
needed for each non-cash transaction, blurring the information content of cash in the pocket.
This can make it optimal to limit non-cash payments to rather infrequent cases of high-value
transactions.
2.2. Objective Function and Transaction Costs We assume that the individual optimizes over a given accounting period, such as a month.
Each month, there are a number of T shopping opportunities, with T large – one may think of
T as the number of minutes in a month. Consumption opportunities pop up in a stochastic
manner: each minute { }1, ,t T∈ , there is a price tp charged for buying and consuming good
t for consumption purposes. The price tp is stochastic, with a known distribution, and a
quantity tc is chosen by the consumer (see Bounie & Houy (2007)). Goods indexed
{ }1, ,t T∈ may or may not differ in a physical sense – being available at different times or
places makes them imperfect substitutes anyway.
Consumers start their accounting period with a given stock 0L of liquidity, a “salary”. At any
time, liquidity can take one of two forms: it may be stored as a demand deposit tD or it may
be held as cash tM in the pocket. Correspondingly, there are two alternatives for carrying out
payments: using cash or payment cards directly linked to the demand deposit. Initially the
salary is transferred to the checking account, so 0 0D L= and 0 0M = .
Individuals draw utility from the consumption of tc at every point in time. The activities of
budgeting, processing information and carrying out transactions are a source of disutility. At
the end of the accounting period, fees and interest for overdrafts are charged and interest for
residual liquidity is credited.
14ECBWorking Paper Series No 1385October 2011
We may write
( ) ( )( ) ( )1
E ...T
t Tt
U u c p R L=
= − + ,
with ( )u concave. The function ( )...p describes the pain of planning and transacting. All
transaction costs are relegated to this disutility component in order to obtain a simple state
equation for liquidity,
01
t
tL L cττ =
= − .
A special case of this state equation is the inter-temporal budget equation for the entire
accounting period, 01
T
TL L cττ =
= − .
The expression ( )TR L comprises the shadow value of liquidity at the end of the budgeting
period. The form of this function will be influenced by the extent of liquidity constraints. In
the complete absence of any liquidity constraints, a consumer can arrange for additional
liquidity at no cost or effort. ( )TR L then captures the utility of positive or negative liquidity
for consumption in the time after the planning period. In this case, ( )TR L will be near linear,
as residual liquidity simply adds to the present value of lifetime income, and any shortfall of
liquidity at the end of the month can easily be covered by consumer credits at a given interest
rate. With costs of liquidity, the borrowing costs may increase quickly with any shortfall in
liquidity. In addition, there may be a discrete penalty for non-positive values TL , depicting
the effort or fees for obtaining an overdraft credit. It may also be impossible to obtain more
than a certain amount of overdraft credit. Any attempt to spend more would then lead to a
costly reversal of the transaction.
At each point in time, the consumer may choose to withdraw money from his or her demand
deposits, increasing cash balances by the same amount as the checking account balance
decreases. The choice on withdrawal is made before the information on the consumption
opportunity arrives. As in the standard Baumol-Tobin model of cash demand (Baumol, 1952,
Tobin, 1956), each withdrawal induces a fixed disutility wp , the “shoe leather costs”.
Furthermore, holding cash causes a variable disutility tr M⋅ associated with the risk of theft
15ECB
Working Paper Series No 1385October 2011
and the necessary precautions for storing and transporting cash. The use of payment cards is
free of fees and other costs of active use.6
2.3. Behavior Under Full Information on Liquidity Before discussing the problems of budgeting and the costs of imperfect information, it is
useful to assess the predictions of the model under the assumption of full information on the
state variable liquidity. We assume that, at each point in time, the consumer has costless
knowledge on tL . The solution for the consumption problem is straightforward and can be
described recursively:
• In the last period, given 1TL − and tp known, consumption Tc is chosen such that the
sum ( ) ( )T Tu c R L+ is maximized, with the necessary condition
( ) ( )1' 'T T Tu c R L c−= − . This solution may be denoted ( )*1,T T tc L p− .
• This defines the value ( )1T TV L − of resources at the beginning of period T:
( ) ( )( ) ( )( )* *1 1 1 1E , ,
tT T T T t T t T T t
pV L u c L p R L p c L p− − − −= + − ⋅ .
• In period 1t − , with the knowledge of 1tp − , the consumer maximizes
( ) ( )1 1 1 1T T T Tu c V L p c− − − −+ − ⋅ and determines ( )*1 2 1,T T Tc L p− − − . This solution will pin
down a value function ( )1 2 1,T T TV L p− − − for the problem in period 2T − , etc.
Under the given assumptions, the optimal payment behavior is easy to predict and entirely
decoupled from the consumption decision. The marginal costs of using the payment card are
nil. The alternative, using cash, is ridden with costs of withdrawal and costs of storage. The
overall disutility is minimized if all transactions are carried out by payment card. Thus, the
consumer should avoid the use of cash wherever possible.
2.4. Costs of Planning and Budgeting To explain why cash is used at all, there must be additional costs associated with each card
transaction. Costs of card transactions may consist in the hassle of remembering and typing
the PIN or the risk of identity theft. However, this sort of costs is also associated with the
management of cash at each withdrawal from a cash dispenser. Instead, we argue that the use
of payment cards may involve a different type of costs, namely the costs of planning and
budgeting.
6 This is a reasonable approximation for the situation in most countries.
16ECBWorking Paper Series No 1385October 2011
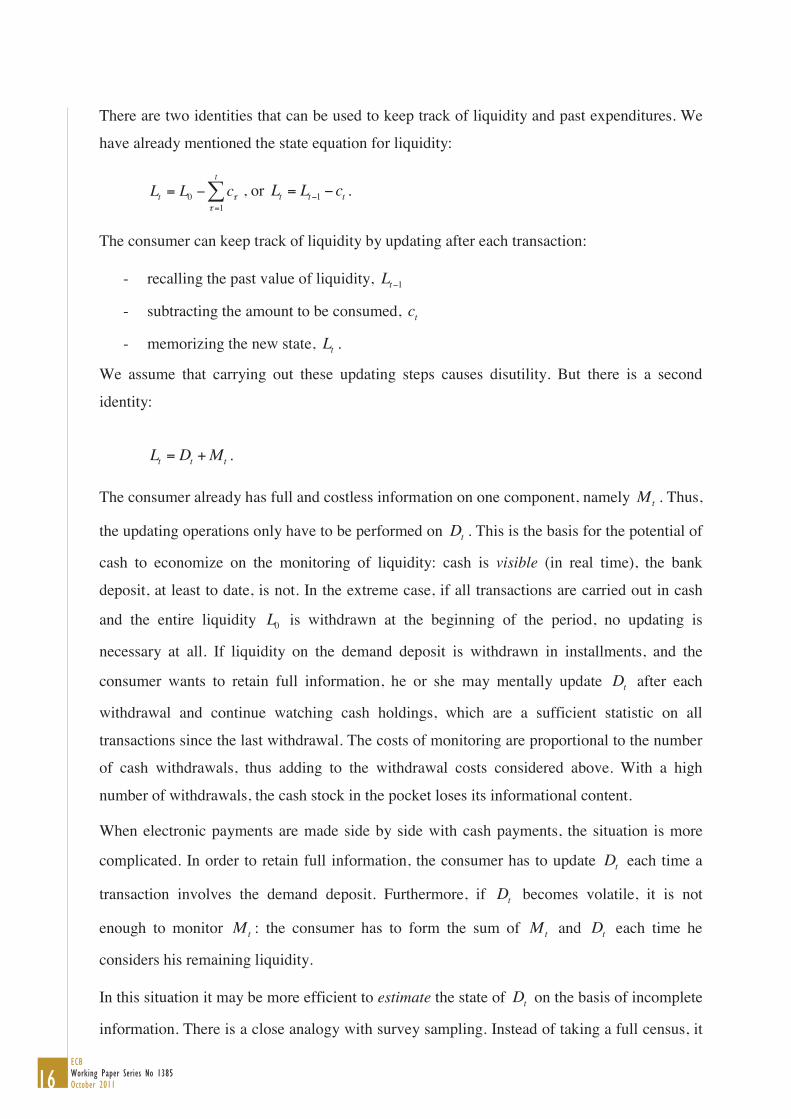
There are two identities that can be used to keep track of liquidity and past expenditures. We
have already mentioned the state equation for liquidity:
01
t
tL L cττ =
= − , or 1t t tL L c−= − .
The consumer can keep track of liquidity by updating after each transaction:
- recalling the past value of liquidity, 1tL −
- subtracting the amount to be consumed, tc
- memorizing the new state, tL .
We assume that carrying out these updating steps causes disutility. But there is a second
identity:
t t tL D M= + .
The consumer already has full and costless information on one component, namely tM . Thus,
the updating operations only have to be performed on tD . This is the basis for the potential of
cash to economize on the monitoring of liquidity: cash is visible (in real time), the bank
deposit, at least to date, is not. In the extreme case, if all transactions are carried out in cash
and the entire liquidity 0L is withdrawn at the beginning of the period, no updating is
necessary at all. If liquidity on the demand deposit is withdrawn in installments, and the
consumer wants to retain full information, he or she may mentally update tD after each
withdrawal and continue watching cash holdings, which are a sufficient statistic on all
transactions since the last withdrawal. The costs of monitoring are proportional to the number
of cash withdrawals, thus adding to the withdrawal costs considered above. With a high
number of withdrawals, the cash stock in the pocket loses its informational content.
When electronic payments are made side by side with cash payments, the situation is more
complicated. In order to retain full information, the consumer has to update tD each time a
transaction involves the demand deposit. Furthermore, if tD becomes volatile, it is not
enough to monitor tM : the consumer has to form the sum of tM and tD each time he
considers his remaining liquidity.
In this situation it may be more efficient to estimate the state of tD on the basis of incomplete
information. There is a close analogy with survey sampling. Instead of taking a full census, it
17ECB
Working Paper Series No 1385October 2011
is cheaper to collect information only on part of the population if some uncertainty can be
accepted.
But even so, the costs of monitoring liquidity can be greatly reduced by using cash:
1. Numerous small-scale payments are made in cash and only more infrequent and large
transactions are carried out with the payment card.
2. Entire classes of expenditures can be carried out in cash, such as retail payments.
3. Paying an amount in cash helps bring the budgetary consequences of this transaction
to mind.
The first strategy relieves the mind from keeping track of numerous small scale transactions.
The budgetary consequences of these payments can be monitored on the basis of cash stocks.
Updating or estimating is only necessary for larger and relatively infrequent expenditures.
The expected withdrawal costs and costs of storage involved in making small payment in cash
are low. With the second strategy, cash stocks inherit the quality of a sufficient statistic from
the pocket watching case for a subset of total expenditures. If all gasoline purchases are
carried out using a payment card and all retail payments are made using cash, the cash stock
still allows monitoring retail payments, a part of expenditure that is difficult to keep track of.
With regard to the third strategy, it has been shown that cash payments are better memorized
than credit card payments and that the immediacy of cash payments negatively affects
spending propensities in comparison to credit card payments for which the purchase is
decoupled from the payment (Soman, 2001).
2.5. The Trade-off Involved We have argued that using cash facilitates keeping track of residual liquidity at low cost, or
more precisely, at the costs involved in withdrawing and storing cash. In order to convert this
into an empirical prediction, we need to make a statement on who will make use of this device
more heavily than others. We argue that consumers who use cash intensively will be
distinguished by two properties:
1. high costs of storing and processing information, and
2. liquidity constraints, having to meet tight budget targets.
The first property is straightforward. There are alternatives to using cash in order to monitor
liquidity. Apart from mentally updating after each transacting, the consumer can estimate
remaining liquidity from time to time. The quality of either bookkeeping or guesswork

18ECBWorking Paper Series No 1385October 2011
depends on the mental capacities of the agent: on his memory and computational skills in the
first case and on his ability to statistically aggregate a fairly large amount of information in
the second case. If the costs of processing this sort of information are low enough, it may be
worthwhile avoiding the hassle associated with cash usage altogether.
The second argument depends on liquidity constraints. With such constraints, utility losses
depend on the precision of the liquidity estimate. To see this, think of the consumption
decision in the last period. Let 1Tλ − be an unbiased estimate of the liquidity carried over from
the second to last period. The consumer knows that
1 1T T T TL cλ ν− −= + + ,
where the term 1tν − is the estimation error at the start of the last period. Instead of equating
( ) ( )1' 'T T Tu c R L c−= − , the first best solution would then be to solve ( ) ( )1' E 'T T Tu c R L c−= − .
If ( )R ⋅ is concave, Jensen’s inequality makes sure that the associated utility is lower in
expectation even if negative liquidity is allowed and no penalty is in place. With ( )R ⋅
strongly concave because of financing constraints, the consumer will want to retain positive
liquidity in expectation in order to lower the risk of being illiquid at the end of T . If, on the
other hand, there are no liquidity constraints, the utility losses of imperfect information are
only minor.7
As to the entire time path of consumption, it has to be noted that the simple recursive solution
sketched in 2.3 for the full information case is no longer valid. If we permit incomplete
information on liquidity, the state variable liquidity is not a unique value but an entire
distribution. Consumption and payment activity are no longer separable, as the payment
choice will influence information on liquidity. A recursive solution of the joint problem is
under the curse of dimensionality, because the distribution of tL is unspecified a priori. It is
obvious that one cannot expect consumers to find an exact solution to this joint dynamic
stochastic control problem if one believes that monitoring past expenditures and present
liquidity generates relevant costs. Instead, we assume that consumers try to gain a fairly
accurate estimate of liquidity and decide on their consumption using rules of thumb that
7 Imagine that the consumer is able to shift funds between months at a fixed interest rate. In this case, the effects of imperfect monitoring merely come from a mistaken perception of the remaining NPV; but as long as consumption in the current month is small relative to this NPV, the resulting mistakes in the consumption plan will only be of second order.
19ECB
Working Paper Series No 1385October 2011
mimic the policy functions for the full information case. In the full information case, the
policy functions ( )*1,t t tc L p− are monotonic functions only of tL and the current price tp .
Unless prices vary a lot, the principal input is information on the remaining liquidity. By
refining estimates, consumers can come arbitrarily close to the full information time path, but
have to face additional costs of updating and processing information. This is the fundamental
trade-off consumers face in their payment and monitoring behavior.
3. Testable Hypotheses and Empirical Implications
The theoretical argument yields the following testable hypotheses. It is consumers with a need
to monitor liquidity and with high costs of processing and storing information for whom
pocket watching is the monitoring technology of choice.
1. These consumers, “pocket watchers”, use cash more intensively, i.e. they conduct a
larger share of their payments with cash.
2. For a given transaction volume, pocket watchers exhibit a lower cash withdrawal
frequency, a higher average withdrawal amount and hence hold larger cash balances
than persons using monitoring methods that are not based on cash.
3. Pocket watchers do not necessarily follow the naive strategy of only using cash.
Payment cards will be used, but only for higher-value payments. This is optimal, as
the costs of holding cash increase with the size of average cash balances, while the
costs of information processing depend only on the number of transactions. In other
words, cash is the ideal payment instrument to track the budgetary consequences of
smaller-value payments. The threshold amount that triggers the use of a payment card
increases with the costs of processing and storing information.
4. Pocket watchers will hold fewer payment cards, as each additional payment card in
use makes monitoring liquidity more costly.
The predictions of our model with respect to restricted and unrestricted consumers are
summarized in Table 1.
[See Table 1]
20ECBWorking Paper Series No 1385October 2011
We propose a testing strategy based on three tests. The first two tests are built on classifying
consumers into “restricted” and “unrestricted” according to our theoretical model. The third
test builds upon the model-implied correlation structure that we should be able to observe in
the data.
As a first test, we compare observed sample means of restricted and unrestricted consumers
for all variables for which our model makes predictions, and test whether the observed
differences between groups are consistent with the differences predicted by the theoretical
framework. This approach is informative as to the economic (quantitative) importance of our
propositions. But other (correlated) variables might influence these observed group means;
thus, testing for the difference in means will not suffice to reliably establish a statistical
difference. Therefore, as a second test, we conduct reduced form regressions for all relevant
variables that characterize payment behavior.
The third test treats the type of the consumer as a latent variable. We look at payment
behavior variables as an interrelated system and test whether the unique correlation structure
which the model implies is borne out by the data. Importantly, this test allows us to
complement the investigation with data from surveys in other countries. The separation into
groups and the variables which are used to proxy the costs of information processing are
discussed below.
4. Data and Variable Definition
4.1. Data We employ survey data which provide detailed information on the payment and withdrawal
behavior of consumers. The representative survey “Payment Habits in Germany” was
conducted by IPSOS on behalf of the Deutsche Bundesbank in spring 2008 among individuals
aged 18 years and older. Based on a random sample, 2,292 individuals were interviewed in all
16 German Länder (federal states).8
Information on various aspects of a person’s payment behavior, like ownership of payment
cards, assessments of certain features of payment methods (anonymity, convenience,
expenditure control, etc.) and on cash withdrawal behavior was collected in face-to-face
interviews. A special feature of the survey is that it comprises information from a drop-off
8 See Hoffmann et al. (2009) for more details and some results of the survey.
21ECB
Working Paper Series No 1385October 2011
5
payments diary which was to be completed by respondents in the seven days following the
initial interview. In total, more than 25,500 transactions were recorded – including the euro
amount, the expenditure type (shop, restaurant, internet, etc.) and the payment instrument
used to carry out the transaction (cash and a list of ten cashless payment methods).9
Results obtained from this survey show that in Germany, as in other European countries, (i)
cash still has a predominant share of payment transactions both in terms of the number and
the value of transactions, (ii) debit cards assume the dominant role among non-cash means of
payment (more than 90% of adult consumers have a debit card), whereas (iii) credit card
payments or check payments are only of minor importance.10 Descriptive sample statistics are
summarized in Table B1.
4.2. Definition of Payment and Withdrawal Variables Table A1 describes the variables used to analyze consumers’ payment and withdrawal
behavior. All variables are computed subject to two important restrictions. First, we only
consider consumers who have the choice of making non-cash payments, i.e. we exclude
persons who do not own a debit card. Second, whenever cash shares are reported, these
percentages were calculated only for those transactions for which a choice between cash and
non-cash payment instruments existed.11 This eliminates all transactions for which only cash
was accepted by merchants and hence guarantees that it is not supply-side effects which drive
results.
4.3. Comparing Consumers We employ two distinct ways of classifying consumers. The first separation builds on
respondents’ self-assessed usage of the pocket watching strategy. Second, we utilize
information from the survey on how strongly respondents feel the need to keep control over
spending and on their information processing capabilities, two important factors in our
9 Only direct payment transactions were recorded, i.e. all transactions apart from recurrent transactions, which are typically settled by direct debit or by bank transfers (e.g. rent, insurance fees, telephone bills, utility bills). 10 For a more detailed discussion, see von Kalckreuth, Schmidt & Stix (2009). The minor importance of credit cards is due to an institutional feature of credit card usage in many European countries: overdraft credit lines of checking accounts are widespread, and people can access them using their debit card. On the other hand, convenience usage dominates, i.e. almost everybody pays off credit card balances in full at the end of the month, which implies that credit cards are typically used as payment devices and not to obtain credit. In this situation, it does not matter for consumers whether they use debit or credit cards for domestic payments. 11 Respondents were asked to indicate for each individual transaction whether the transactions could also have been conducted by non-cash payment instruments.
22ECBWorking Paper Series No 1385October 2011
theoretical model.12 These categorizations allow testing whether payment behavior differs
between consumers with different strategies and between consumer types. Furthermore, we
investigate whether there is a link between the two ways of classifying consumers, i.e.
whether restricted consumers are pursuing the pocket watcher strategy.
The self-classification of consumers is based on two questions. First, respondents were asked
about the self-assessed importance of several characteristics of payment instruments, and then
whether cash or payment cards fulfill these characteristics. Accordingly, we have constructed
a dummy variable for those respondents who answered (i) that expenditure control is an
indispensible feature of a payment instrument and (ii) that only cash fulfils this feature.13 This
variable is denoted as POCKET WATCHER because it corresponds to the behavioral
typology of a pocket watcher we arrived at in the model. In our sample, about 20% of
respondents classify themselves as pocket watchers.
The model not only states which behavior we should observe for pocket watchers but also
identifies the reason why pocket watchers behave in such a way. In particular, the use of cash
to keep track of liquidity is mainly of value for consumers who need to monitor their
remaining budget and for whom processing and storing information is relatively costly. An
alternative classification of consumers can hence be conducted by identifying variables which
proxy the costs of processing and storing information and the need to keep track of liquidity.
Our measure for the costs of processing and storing information is based on the overall time
respondents needed to complete the interview. During the face-to-face survey, each
respondent answered a series of questions which were read out by interviewers. For some
questions, respondents had to choose answers based on a show-card. Persons who need little
time to go through the interview can be presumed to be well capable of comprehending and
processing complex information. Based on this idea, we construct a variable entitled
INTERVIEW LENGTH, which is defined as the average number of seconds required by a
respondent to answer survey questions.14
The empirical proxy for the desire to monitor liquidity is derived from the following survey
12 Also see Table A2 for a description of the variables used for the classification. 13 This dummy variable takes a value of zero either if expenditures control is not an indispensible feature of a payment instrument or if expenditures control is an indispensible feature of a payment instrument which is fulfilled not only by cash but also by other payment instruments. 14 In calculating the average interview length, we took into account the actual number of questions a respondent answered, which differs by respondents.
23ECB
Working Paper Series No 1385October 2011
question: “To reach my financial targets, expenditure discipline is very important –
unnecessary expenditures have to be avoided”. Answer categories range from “very much
agree” to “don’t agree at all”, with two more items in between. We define a consumer as
having a desire to monitor his or her liquidity (NEED TO MONITOR) if he or she “very
much agrees”, which applies to about 46% of respondents15. This variable identifies those
consumers for whom planning and budgeting mistakes generate monetary or psychological
costs.
In the empirical applications we will mainly use the interactions of INTERVIEW LENGTH
and NEED TO MONITOR. Accordingly, consumers are classified into three groups. The first
group (restricted consumers) consists of respondents who state that expenditure discipline is
very important and for whom we observe an above-median interview length (about 24% of
respondents). The second group (unrestricted consumers) consists of consumers who state that
expenditure discipline is not very important and whose interview length is below the median
of all respondents (28% of respondents). The third group comprises of consumers who face
one of these restrictions, but not both – they have a need to keep track either of liquidity or of
high costs of information processing (48% of respondents). Our principal interest is in the
comparison of restricted and unrestricted consumers, i.e. the polar cases. The differences
between restricted and unrestricted consumers can be expected to be stronger than those
between any of these two and consumers in the third group.
5. Results
5.1. Descriptive Evidence Based on a Comparison of Consumers Table 2 summarizes the results of a mean comparison of respondents on the basis of the two
groupings described above: POCKET WATCHER and restricted vs. unrestricted consumers.
For each variable, the table shows the group means and the p-value of the test statistics of the
null hypotheses of equal means. Column (1) depicts the sign of the group differences
predicted by our theoretical framework.
15 Although it can be expected that the desire to control expenditures is correlated with income, the concept covered by the question does not entirely match the theoretical model which is built on financing or liquidity constraints. For example, a wealthy person might also want to keep expenditures under control to achieve some financial goal, such as buying a house. Such a person is covered by our definition, although he or she may not be liquidity constrained.
24ECBWorking Paper Series No 1385October 2011
The results are grouped according to those aspects of payment and withdrawal behavior about
which our model makes predictions. For the extent of cash usage, available data allow us to
construct several indictors (see Table A1): the value and volume shares of cash payments
derived from the payments diaries; whether a person always pays cash; whether a person
always pays cash for very frequent payments (daily retail expenditures, at gas stations and for
services); whether a person pays transaction amounts below 100 euro by cash. Although these
variables can be expected to be highly correlated, we have included all of them because each
of these variables is derived from an independent survey question, i.e. the observed payment
shares measure actual behavior as recorded in the payments diary, while the other variables
measure self-assessed long-run behavior (as recorded in the face-to-face interviews). A priori,
it is not clear that the observed payment patterns correspond to self-assessed long-run
behavior.
The findings, however, show that all variables yield similar results. In accordance with the
theoretical predictions, pocket watchers (according to our indicator variable) are found to
have substantially higher cash intensities – all respective means are significantly different at
the 1% level. The differences between groups are also significant in economic terms. For
example, the cash share (in value terms) is 66% for pocket watchers and 52% for non-pocket
watchers; 35% of pocket watchers use cash exclusively; the respective value is 15% for non-
pocket watchers.16
The results are also consistent with our predictions regarding the threshold amount above
which consumers use non-cash payment instruments instead of cash. As a case in point, the
euro amounts at which consumers start to use cards is 116 euro for pocket watchers and 62
euro for non-pocket watchers. Moreover, there is support for our prediction that pocket
watchers have fewer payment instruments in use (1.7 versus 2.1). Finally, we find that pocket
watchers withdraw significantly less often (3.4 versus 4.2 withdrawals per month).
[See Table 2]
If the classification of consumers is not based on POCKET WATCHER but on the
comparison of restricted and unrestricted consumers classified according to the interview
length and the need to monitor, a very similar picture is obtained. The sign and significance of
16 The reader should be reminded that we analyze only respondents with a debit card and only transactions for which an actual payment option existed. Observed differences would be greater if we analyzed all transactions.
25ECB
Working Paper Series No 1385October 2011
the difference is as expected. Moreover, the magnitudes of the differences are even
accentuated. As a case in point, the cash share (in value terms) is 66% for restricted and only
45% for unrestricted consumers; the average amount withdrawn is 29% higher for the former
than for the latter. Moreover, among unrestricted consumers, not a single respondent in our
sample uses only cash and no other payment instrument.
Clearly, the observed group differences could also be caused by correlated covariates such as
age, income or differences in the scale of transactions. Table 3 summarizes descriptive
statistics for our different consumer groups. Pocket watchers and restricted consumers are, on
average, older and have lower income and lower education. Also, it seems that females adhere
more to the pocket watching strategy than males.
[See Table 3]
5.2. Reduced Form Regression Results We estimate a reduced-form behavioral equation for each variable we want to explain. These
models are estimated either by probit (for dummy variables), by ordinary least squares, by
interval regression or by ordered probit (for the number of payment instruments in use),
whatever is appropriate. We control for socio-demographic variables (age, income,
education), for transaction cost variables, for the relative costs of cash and card usage and the
role of preferences for payment attributes, like anonymity and familiarity.17 As with the mean
comparison, we use two different sets of classifications. The first version is based on the
indicator variable POCKET WATCHER, whereas the second version is based on dummy
variables identifying restricted and unrestricted consumers. Again, we find very strong
support for our predictions. Moreover, the point estimates uncover a substantial effect of
pocket watching above and beyond the effect of more standard transaction cost variables
(Table 4).
[See Table 4]
As the results from the reduced form equations are interesting as such, we will discuss the
chosen specification and the results in more detail.
17 For a definition of the control variables, see the Appendix.
26ECBWorking Paper Series No 1385October 2011
5.2.1. The Behavior of Pocket Watchers
Cash Usage
The regression results demonstrate that the POCKET WATCHER variable is significant in
four out of five regressions for the cash usage. The estimated coefficients imply that pocket
watchers have a cash share which is higher by 8 percentage points and have an 11 percentage
point higher probability than non-pocket watchers that they pay in cash at payment locations
that are visited frequently.
As far as control variables are concerned, the selection of variables for the cash usage
equations is based on von Kalckreuth, Schmidt and Stix (2009), who discuss in detail the set
of variables which are likely to affect the usage of cash: the time distance to the next ATM or
the next bank branch, the subjective risk of theft (measured from a survey question about the
amount of cash in pocket from which a respondent starts to feels uncomfortable), whether
persons are acquainted with the use of debit and ATM cards and whether fees are charged by
the bank for card payments or ATM withdrawals, all measuring the relative costs of cash and
card usage. Households’ monthly income can be seen as a measure for the shadow value of
time for withdrawals. Also, we include dummy variables for the degree of urbanization of
respondents’ place of residence as a proxy for the density of the payment terminal or ATM
network.
As the cash shares were calculated on the basis of all transactions throughout a relatively
short one-week period, they will be affected by the type of transactions recorded (for
example, a high value payment for furniture will affect the observed cash shares for a given
respondent). Therefore, we also include individual-level controls for the structure of the
recorded transactions.18 In addition, we include the average value of transactions, as the
relative costs of using cash or card (by transaction) can be expected to vary strongly with the
size of payments (see Klee, 2008).
We also consider assessments of certain payment instruments’ characteristics which have
been shown to be important (see Borzekowski & Kiser, 2008; Schuh & Stavins, 2010). In
particular, we include information about whether respondents regard protection of pri-
18 More specifically, we include variables measuring the frequencies of expenditure relating to (1) durable goods, (2) gas stations, (3) restaurants, hotels and cafes, (4) services (at home and outside home), (5) drugstores, vending machines and leisure, and (6) other, with daily retail being the reference category.
27ECB
Working Paper Series No 1385October 2011
vacy/anonymity and long-lasting experience with a payment instrument as important
characteristics of a payment instrument.
The results highlight that consumers’ choice of the intensity of use of payment instruments
constitutes a decision problem for which many factors are relevant (see Zinman, 2009). All
groups of variables are important. Among the relative cost variables, we find that frequent
users of ATMs have lower cash payment intensities.19 Furthermore, cash usage decreases with
income and education, ceteris paribus, while age is found to be insignificant. A higher risk of
theft is associated with less use of cash, as expected. This effect prevails only for the self-
reported longer-run behavior and not for the actual cash shares observed from the payments
diary. The opposite can be observed for bank fees for card payments. Such fees increase the
actual share of cash payments but do not exert an impact on the longer-run behavior.20 Again,
habit (i.e. the long-lasting experience with a payment instrument) affects the self-stated long-
run behavior, but not actual cash shares. In contrast, preferences for anonymity do not exert a
significant impact.
Payment Structure and Number of Payment Cards
As the amount at which persons will start using payment cards will be affected by the same
variables which affect the choice of payment instruments, we apply the same model structure.
Our findings show that pocket watchers use the card at significantly higher payment values
than non-pocket watchers.
The choice of how many payment instruments should be used again potentially depends on
the same relative cost considerations as the use of payment instruments. In particular, our
findings suggest that the number of payment cards consumers use is positively correlated with
the density of ATM and the payment terminal networks as measured by the distance to the
next ATM/bank branch and the size of the municipality. Moreover, higher age and
preferences for long-lasting experience with a payment instrument reduces the number of
cards. But again, even if one controls for these differences, pocket watchers have fewer
payment cards than non-pocket watchers.
19 A similar signed effect is also reported in Zinman (2009) and von Kalckreuth, Schmidt and Stix (2009). Our interpretation is that this variable measures the ease of payment card use. Frequent ATM users have their debit cards at hand most of the time, since they need them to be able to withdraw money. They are also familiar with using their cards and with punching their PIN code into an electronic machine. 20 This points towards self-selection of consumers. The account type and the associated fees are chosen on the basis of payment preferences.
28ECBWorking Paper Series No 1385October 2011
Withdrawal Behavior
We also present a reduced form equation for the withdrawal behavior, which is based on a
classical Baumol-Tobin model (for empirical examples, see Bounie and Francois, 2006, or
Stix, 2004). As an additional explanatory variable, we include a measure for the scale of cash
transactions. The dependent variable is the typical euro amount a person withdraws which is
derived from the face-to-face interviews. According to the Baumol-Tobin model, this amount
is proportional to average cash balances. A positive coefficient additionally implies less
frequent withdrawals, holding the total withdrawal amount per month constant.
The results confirm the main predictions of the Baumol-Tobin model – in fact, it is quite
striking that the transaction elasticity is very close to the predicted value of 0.5. This point
estimate is close to the findings of Lippi and Secchi (2009) and Stix (2004) but relatively far
away from the one reported in Bounie & Francois (2006), who report a point estimate of
around 0.1.21 As expected, a higher shadow value of time (household income) increases
average cash holdings and lowers the number of withdrawals. The time distance to the next
ATM or bank branch is not significant, but a higher network density of ATM terminals has a
clear negative effect on average cash balances. Fees for withdrawals also induce households
to withdraw higher amounts.
Our hypothesis that pocket watching affects withdrawal behavior is supported. POCKET
WATCHERS withdraw 11% less frequently and hold, ceteris paribus, 11% higher cash
balances.
5.2.2. Information Costs and Liquidity Constraints
According to our explanatory model, the group of “pocket watchers” (who profess to using
cash to monitor liquidity) and the group of restricted consumers should be largely
overlapping. The share of pocket watchers among restricted consumers is 39%. This is 15
percentage points higher than the share of pocket watchers in the full sample. In turn, 33% of
pocket watchers are restricted, with a share of 20% for the overall sample. The two groups are
not identical. However, as shown in Table 3, the socio-demographic characteristics are very
similar for both breakdowns. This indicates that both group indicators are proxies for the
same type of consumers, partly distorted by measurement error. We proceed to test whether
21 Moreover, the risk of cash holdings enters significantly in our equation, while it is not significant in Bounie & Francois (2006).
29ECB
Working Paper Series No 1385October 2011
pocket watchers have indeed higher information costs and are more liquidity constrained than
non-pocket watchers, as is claimed in our model.
Do Pocket Watchers Have the Predicted Characteristics?
The results of this validation exercise are summarized in Table 5. In particular, we run probit
regressions relating POCKET WATCHER to INTERVIEW LENGTH and NEED TO
MONITOR while controlling for income, age and education.
[See Table 5]
The results unambiguously provide support for our theoretical presumptions, since persons
with higher information costs and persons with higher costs of breaching their budget
constraint are significantly more likely to be pocket watchers. Additionally, we find that
persons with higher income are less likely to be pocket watchers, which additionally points to
the importance of liquidity constraints.
Restrictions and Payment Behavior
Building on these results, we again separate consumers into three groups using INTERVIEW
LENGTH and NEED TO MONITOR and repeat the reduced form regressions (Table 6).
Again, our interest is in the comparison of the polar groups, restricted versus unrestricted
consumers.
[See Table 6]
The estimation results support our propositions. In every single regression, restricted
consumers (i.e. long interview length and need to monitor) are found to have a significant
coefficient (relative to the reference group of unrestricted consumers). That is, we find that
restricted consumers use cash more intensively, use cards only at higher amounts, hold fewer
payment cards, withdraw less frequently and hence hold higher cash balances than
unrestricted consumers. In comparison to the group separation according to POCKET
WATCHER, the differences between groups are again accentuated.
The regressions summarized above use indicator variables for the joint prevalence of high
costs of information processing and storage and the need to monitor liquidity. The theoretical
argument requires both of these characteristics to be present, at least to some degree, in order
30ECBWorking Paper Series No 1385October 2011
to make pocket watching a meaningful behavior. However, in reality, both types of
restrictions are of a continuous nature; hence it is interesting to look at the contributions of the
two types of restrictions separately (results are summarized in the Appendix Table B2). In
each regression the interview length per question is found to be significant and has the
predicted sign. Although in general fewer significant results are obtained for NEED TO
MONITOR, we nevertheless find significant and correctly signed effects for the value share
of cash transactions, the threshold amount from which a person starts paying with cards, the
number of payment instruments in use and the withdrawal amount. Taken together, the results
from this additional test can be interpreted as strongly supportive of the idea that cash is used
as a monitoring device.
5.3. Correlation Structure of Endogenous Variables
All previous results rely on a partitioning of the sample into restricted and unrestricted
consumers. It is clear that any such separation will only be an approximation. By making use
of the fact that our model makes predictions about several dimensions of consumers’ payment
behavior and withdrawal behavior at the same time, we can propose a test which does not rely
on a separation of consumers into groups but which treats the group assignment itself as a
latent variable. In particular, we can compare the model-implied correlation structure among
variables with the correlation structure contained in the data.
This test builds on the following idea: a switch from a restricted to an unrestricted consumer
should result in a decline in the use of cash (both short-run and long-run), an increase in the
withdrawal frequency, a decline in the threshold up to which cash is used and an increase in
the number of payment instruments in use. Accordingly, it should be possible to observe the
following six correlations in the data:
• a negative correlation between cash usage and the frequency of withdrawals;
• a positive correlation between cash usage and the threshold up to which cash is used;
• a negative correlation between cash usage and the number of payment instruments in
use;
• a negative correlation between the frequency of withdrawals and the threshold up to
which cash is used;
• a negative correlation between the threshold up to which cash is used and the number
of payment instruments in use;
31ECB
Working Paper Series No 1385October 2011
• a positive correlation between the frequency of withdrawals and number of payment
instruments in use.
Existence of this correlation structure in the data can be interpreted as support for the
existence of the theoretically described consumer types.
Pairwise correlations among endogenous variables are shown in Table 7, along with the
theoretically predicted signs. In general, there are six correlations which we should observe.
However, since we have two empirical measures for the cash share (in value and volume
terms), this amounts to nine correlations. In all these nine cases, the pairwise correlations
have the predicted sign and are significant at the 1% level.
[See Table 7]
One interesting feature of this indirect test is that it can be applied to data from other
countries.22 In particular, the correlation analysis has been applied to payment data from
Austria. Moreover, we can also make use of the Bank of Italy’s “Survey on Household
Income and Wealth” to test for the correlation between the cash share and the withdrawal
frequency.23 The corresponding results are summarized in Table B3. Again, all pairwise
correlations have the predicted sign and are significant.
The predicted correlation between the share of cash expenditures and the withdrawal
frequency is also confirmed by another statistic. In particular, respondents in the Austrian and
Italian survey were asked about the average (typical) frequency with which debit card
payments are made (this information is not available in the German data). Table B4
summarizes the average withdrawal frequencies for various categorical debit card payment
frequencies – to control for the density of ATM and debit card terminals, we analyze only
those respondents who live in larger cities. The results show the expected positive correlation:
on average, consumers who use debit cards frequently also withdraw frequently and vice
versa.
22 This is not possible for the direct tests because they require availability of appropriate variables to measure the information processing costs of consumers and consumers’ need to monitor liquidity. 23 The Austrian and the Italian data sources are briefly described in the Appendix.
32ECBWorking Paper Series No 1385October 2011
6. Conclusions
The starting point for this paper was the question as to why some consumers still use cash
extensively although cashless payment alternatives are widely available. We provided an
argument that builds on the idea that consumers want to maintain control over their remaining
liquidity. Cash has the distinctive feature that it contains memory – the amount spent and the
remaining budget can easily be gathered by a glance into one’s pocket. For some consumers,
notably consumers who wish to monitor liquidity and for whom information processing is
relatively expensive, this feature of cash constitutes a crucial advantage of cash – these
consumers use cash because it is the payment instrument which provides the least costly way
of keeping control. In essence, therefore, our model explains why some consumers use cash
more extensively than others.
Testing the model with data from Germany yields broad support for our hypotheses. The need
to monitor liquidity does indeed seem to be an important explanation for cash usage. One
direct implication of our results is that cash is unlikely to lose much of its importance for
certain types of consumers. Even if non-cash payment instruments become cheaper relative to
cash, these consumers can be expected to continue to prefer cash. In the aggregate, this would
result in consumers reacting only sluggishly to changes in relative prices as long as other
payment instruments do not provide this feature.
Von Kalckreuth, Schmidt & Stix (2009) have shown that consumers do not use cash naively,
i.e. that high cash usage is not a direct consequence of habit persistence. Consumers evaluate
the relative costs and benefits of payment instruments, including non-pecuniary payment
instrument characteristics, and use payment instruments according to this evaluation. This
opens the backdoor for an indirect form of habit persistence. If some consumers are
acquainted with the use of cash to control their budget, then a shift to other payment
instruments might be relatively costly for them. In this view, the resulting slow reduction of
the percentage of cash in payments could be caused by the resistance to learning monitoring
techniques when using other payment instruments.
We provide some evidence on the validity of our model for countries other than Germany.
Supportive evidence is also presented by Arango, Huynh & Sabetti (2011) for Canada,
reporting that “fear of overspending” significantly increases the use of cash while reducing
the use of payment cards. Despite this broad support for our model, the question remains why
cash usage at the point of sale is much less important in some countries than in others. Do
consumers in the US, for example, have a lower preference for monitoring liquidity? While
33ECB
Working Paper Series No 1385October 2011
our paper focuses on the heterogeneity across consumers and not on differences in payment
habits across countries, some comments on this issue seem warranted. First, social norms
about the usage of payment instruments in general and standard transaction costs in particular
might dominate the monitoring advantages of cash: paying larger transaction amounts in cash
may be regarded as suspicious; carrying larger amounts of cash in one’s pocket might be
dangerous. The historical evolution of payment institutions might be essential as well. For
example, checks have been widely used in the US, whereas they are virtually unknown in
Germany. It is interesting that the strategy of writing checks and not using the credit card,
while at the same time keeping a record of every check transaction, is very similar to pocket
watching. Without having the possibility of pursuing this any further, it may be the case that
the type of person who would be a heavy cash user in Germany could in the US be seen either
clinging to a checkbook or using detailed registers to note down expenses in order to keep
track of expenses. The monitoring motive may thus also play an important role for the choice
among non-cash payment instruments. Supportive evidence has been presented by Fusaro
(2008) and Schuh & Stavins (2010) and can indirectly be deduced by the fact that consumers
who revolve credit card debt tend to use debit cards more often (Sprenger & Stavins, 2008;
Zinman, 2009).24 We think that this finding is consistent with our story. Finally, in reaction to
the fact that some US households are faced with accumulated credit card debt, an abundance
of advice on how to control overspending can be found on the internet. The bottom line of the
presented advice is simple – use cash.
24 The issue of maintaining control over liquidity when using several payment instruments is at the heart of the “proverbial wallet” idea of Kestner, Leithinger, Jung & Petersen (2009). The payment industry seems to be reacting to this. As a case in point, in 2011 VISA Inc. launched a management tool to help consumers budget. With this tool, consumers can set spending targets and they will be notified when a threshold has been reached.
34ECBWorking Paper Series No 1385October 2011
References
Alvarez, F. E. & Lippi, F. (2009). Financial Innovation and the Transactions Demand for
Cash, Econometrica 77(2), pp. 363-402.
Ameriks, J., Caplin, A. & Leahy, J. V. (2004). The Absent-Minded Consumer, NBER
Working Paper No. W10216.
Arango, C., Huynh, K. P. & Sabetti, L. (2011). Will that be Cash, Debit, or Credit? How
Canadians Pay, mimeo, paper presented at the ECB-OeNB Retail Payments Conference
(May, 12-13, 2011, Vienna).
Attanasio, O. P., Guiso, L. & Jappelli, T. (2002). The Demand for Money, Financial
Innova¬tion, and the Welfare Cost of Inflation: An Analysis with Household Data,
Journal of Political Economy 110(2), pp. 317-351.
Baumol, W. J. (1952). The Transaction Demand for Cash: An Inventory Theoretic Approach,
Quarterly Journal of Economics 66(3), pp. 545-556.
Bertaut, C., Haliassos, M. & Reiter, M. (2009). Credit Card Debt Puzzles and Debt Revolvers
for Self-Control, Review of Finance 13 (October), pp. 657-692.
Borzekowski, R. & Kiser, E. K. (2008). The Choice at the Checkout: Quantifying Demand
Across Payment Instruments, International Journal of Industrial Organization 26 (July
2008), pp. 889-902.
Borzekowski, R., Kiser, E. K. & Ahmed, S. (2008). Consumers' Use of Debit Cards: Patterns,
Preferences, and Price Response, Journal of Money, Credit, and Banking 40 (February
2008), pp. 149-172.
Bounie, D. & Francois, A. (2006). Is Baumol's 'Square Root Law' Still Relevant? Evidence
from Micro-Level Data, Applied Financial Economics 18(13), pp. 1091-1098.
Bounie, D., Francois, A. & Houy, N. (2007). The Demand for Currency Versus Debitable
Accounts: A Reconsideration, mimeo (available at SSRN:
http://ssrn.com/abstract=987375).
Bounie, D. & Houy, N. (2007). A Model of Demand for Cash and Deposits, mimeo (available
at SSRN: http://ssrn.com/abstract=991361).
Ching, A. T. & Hayashi, F. (2010). Payment Card Rewards Programs and Consumer Payment
Choice, Journal of Banking & Finance 34(8), pp. 1773-1787.
European Central Bank (2011). The Use of Euro Banknotes – Results of Two Surveys among
Households and Firms, ECB Monthly Bulletin April 2011, pp. 79-89.
Fusaro, M. A. (2008). Debit vs Credit: A Model of Self-Control with Evidence From
Checking Accounts, mimeo.
35ECB
Working Paper Series No 1385October 2011
Hoffmann, A., H. Wörlen, A. Friedrich, N. Knaust, U. Von Kalckreuth, and T. Schmidt
(2009). Payment Behavior in Germany - An Empirical Study of the Selection and
Utilisation of Payment Instruments in the Federal Republic of Germany, Deutsche
Bundesbank, Frankfurt am Main, Germany.
Jonker, N. (2007). Payment Instruments as Perceived by Consumers – Results from a
Household Survey, De Economist 155(3), pp. 271-303.
von Kalckreuth, U., Schmidt, T. & Stix, H. (2009). Choosing and Using Payment
Instruments: Evidence from German Microdata. ECB Working Paper No. 1141 and
Deutsche Bundesbank Working Paper No. 36.
Kestner, J., Leithinger, D., Jung, J. & Petersen, M. (2009). Proverbial wallet: tangible
interface for financial awareness, Proceedings of the 3rd International Conference on
Tangible and Embedded Interaction, pp. 55-56, 2009, doi:10.1145/1517664.1517683.
Klee, E. (2008). How People Pay: Evidence From Grocery Store Data. Journal of Monetary
Economics 55(3), pp. 526-541.
Kocherlakota, N. (1998). Money is Memory, Journal of Economic Theory 81(2), August, pp.
232-251.
Kocherlakota, N.R. and Wallace, N. (1998). Incomplete Record-Keeping and Optimal
Payment Arrangements, Journal of Economic Theory 81(2), August, pp. 272-289.
Lippi, F. & Secchi, A. (2009). Technological Change and the Households’ Demand for
Currency. Journal of Monetary Economics 56(2), pp. 222-230.
Mooslechner, P., Stix, H. & Wagner, K. (2006). How Are Payments Made in Austria? Results
of a Survey on the Structure of Austrian Households’ Use of Payment Means in the
Context of Monetary Policy Analysis, Monetary Policy & the Economy Q2, pp. 111-
134.
Prelec, D. and Simester, D. (2001). Always Leave Home Without It: A Further Investigation
of the Credit-Card Effect on Willingness to Pay, Marketing Letters 12(1), pp. 5-12.
Schuh, S. & Stavins, J. (2010). Why are (some) consumers (finally) writing fewer checks?
The role of payment characteristics, Journal of Banking & Finance 34(8), pp. 1745-1758.
Soman, D. (2001). Effects of Payment Mechanism on Spending Behavior: The Role of
Rehearsal and Immediacy of Payments, Journal of Consumer Research: An
Interdisciplinary Quarterly, University of Chicago Press, vol. 27(4), pp. 460-74.
Sprenger, C. & Stavins, J. (2008). Credit Card Debt and Payment Use. Federal Reserve Bank
of Boston Working Paper No. 08-2.
Stix, H. (2004). How Do Debit Cards Affect Cash Demand? Survey Data Evidence, Empirica
31(2-3), pp. 93-115.
36ECBWorking Paper Series No 1385October 2011
Tobin, J. (1956). The Interest Elasticity of Transactions Demand for Cash, Review of
Economics and Statistics 38(3), pp. 241-247.
Whitesell, W.C. (1992). Deposit Banks and the Market for Payment Media, Journal of
Money, Credit, and Banking 24(4), pp. 483-498.
Zinman, J. (2009). Debit or Credit?, Journal of Banking and Finance 33(2), pp. 358-366.
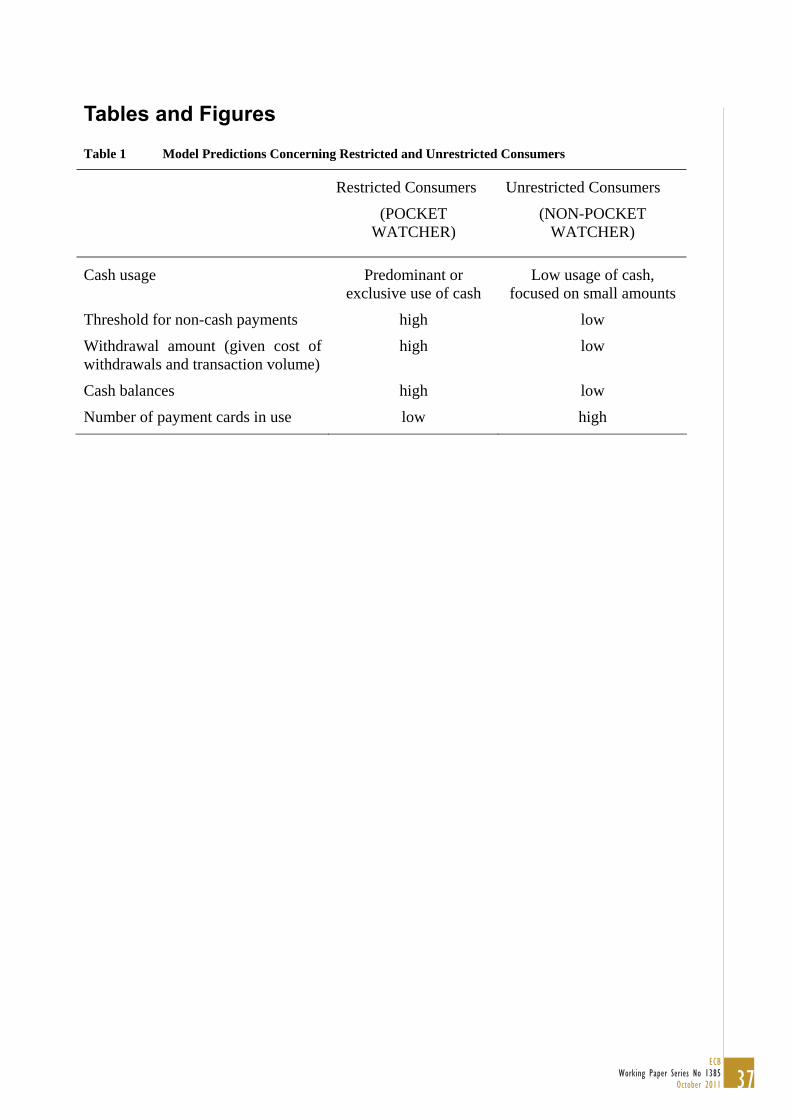
37ECB
Working Paper Series No 1385October 2011
Tables and Figures
Table 1 Model Predictions Concerning Restricted and Unrestricted Consumers
Restricted Consumers
(POCKET WATCHER)
Unrestricted Consumers
(NON-POCKET WATCHER)
Cash usage Predominant or exclusive use of cash
Low usage of cash, focused on small amounts
Threshold for non-cash payments high low
Withdrawal amount (given cost of withdrawals and transaction volume)
high low
Cash balances high low
Number of payment cards in use low high

38ECBWorking Paper Series No 1385October 2011
Tab
le 2
D
iffe
ren
ces
bet
wee
n R
estr
icte
d a
nd
Un
rest
rict
ed C
onsu
mer
s –
Tes
t S
tati
stic
s
Pre
d.
sign
of
effe
ct
P
OC
KE
T
WA
TC
HE
R
NO
N-
PO
CK
ET
W
AT
CH
ER
Res
tric
ted
Con
sum
ers
(nee
d to
m
onito
r an
d lo
ng
inte
rvie
w p
er
ques
tion)
Unr
estr
icte
d C
onsu
mer
s (n
o ne
ed to
m
onito
r an
d sh
ort
inte
rvie
w p
er
ques
tion)
mea
n m
ean
p-va
lue
m
ean
mea
n p-
valu
e
(1)
(2)
(3
)
Cas
h us
age
Per
son
alw
ays
pays
cas
h +
0.35
0.
15
0.00
0.47
0.
00
0.00
P
erso
n pa
ys c
ash:
ret
ail,
gas
stat
ion
and
for
serv
ices
con
sum
ed o
utsi
de h
ome
+
0.
69
0.52
0.
00
0.
73
0.41
0.
00
P
erso
n pa
ys c
ash
up to
100
eur
o +
0.74
0.
63
0.00
0.75
0.
54
0.00
S
hare
of
cash
tran
sact
ions
(vo
lum
e)
+
0.
76
0.63
0.
00
0.
74
0.59
0.
00
S
hare
of
cash
tran
sact
ions
(va
lue)
+
0.66
0.
52
0.00
0.66
0.
45
0.00
Pay
men
t str
uctu
re
Eur
o am
ount
at w
hich
the
pers
on s
tart
s pa
ying
with
car
ds
+
11
6.28
61
.56
0.00
95.6
5 50
.80
0.00
Pay
men
t ins
trum
ents
N
umbe
r of
dif
fere
nt p
aym
ent i
nstr
umen
ts
in u
se
-
1.68
2.
05
0.00
1.60
2.
24
0.00
W
ithdr
awal
beh
avio
r an
d ca
sh h
oldi
ngs
Ave
rage
am
ount
wit
hdra
wn
at e
ach
with
draw
al
+
22
3.96
19
5.20
0.
02
21
9.08
16
9.80
0.
00
A
vera
ge n
umbe
r of
with
draw
als
per
mon
th
-
3.43
4.
19
0.00
3.56
4.
54
0.00
Not
e: T
he ta
ble
show
s w
heth
er th
e da
ta f
rom
the
Ger
man
pay
men
t sur
vey
corr
espo
nds
with
the
theo
retic
al p
redi
ctio
ns. T
he p
redi
cted
sig
n is
sum
mar
ized
in c
ol. 1
. In
col.
2, r
espo
nden
ts a
re s
epar
ated
by
the
dum
my
vari
able
PO
CK
ET
WA
TC
HE
R. C
olum
n 3
refe
rs t
o a
com
pari
son
of r
estr
icte
d co
nsum
ers
wit
h un
rest
rict
ed c
onsu
mer
s ba
sed
on I
NT
ER
VIE
W L
EN
GT
H a
nd N
EE
D T
O M
ON
ITO
R. T
he s
ampl
e co
mpr
ises
onl
y de
bit c
ard
owne
rs. T
he p
-val
ues
refe
r to
a te
st o
f eq
ual m
eans
bet
wee
n th
e re
spec
tive
co
mpa
riso
n gr
oups
. A d
efin
ition
of
vari
able
s is
giv
en in
App
endi
x A
.
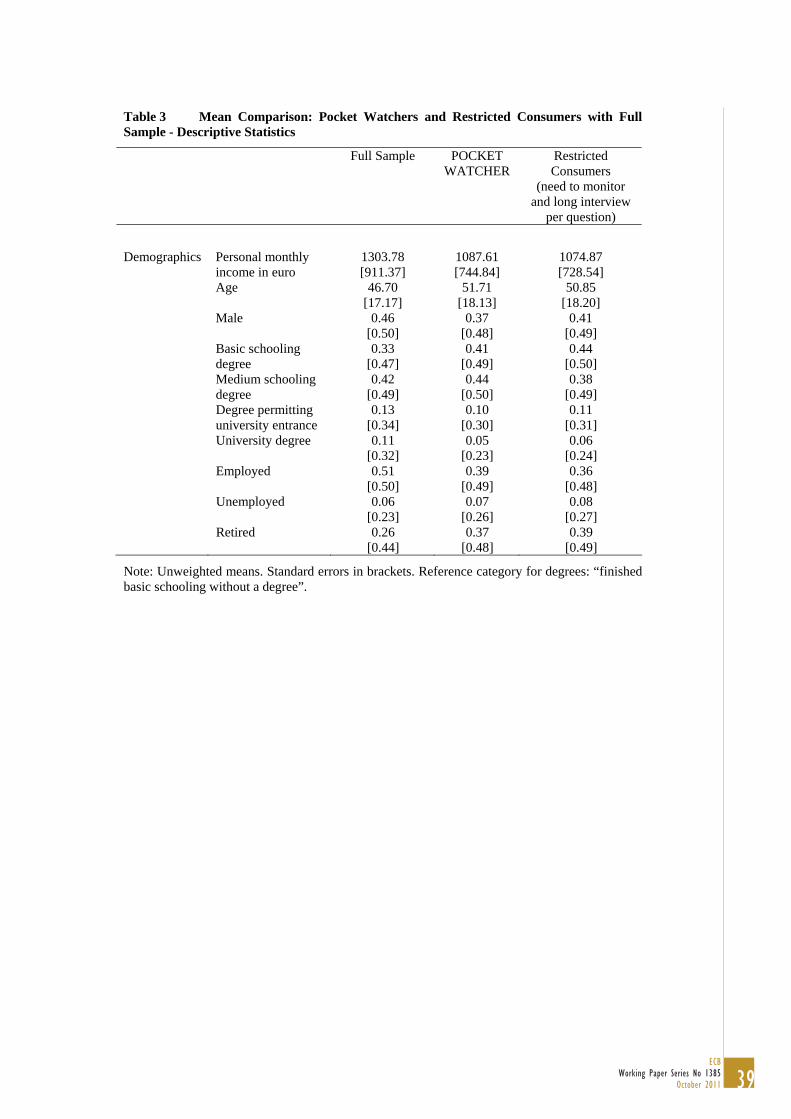
39ECB
Working Paper Series No 1385October 2011
Table 3 Mean Comparison: Pocket Watchers and Restricted Consumers with Full Sample - Descriptive Statistics
Full Sample POCKET WATCHER
Restricted Consumers
(need to monitor and long interview
per question)
Demographics Personal monthly income in euro
1303.78 [911.37]
1087.61 [744.84]
1074.87 [728.54]
Age 46.70 [17.17]
51.71 [18.13]
50.85 [18.20]
Male 0.46 [0.50]
0.37 [0.48]
0.41 [0.49]
Basic schooling degree
0.33 [0.47]
0.41 [0.49]
0.44 [0.50]
Medium schooling degree
0.42 [0.49]
0.44 [0.50]
0.38 [0.49]
Degree permitting university entrance
0.13 [0.34]
0.10 [0.30]
0.11 [0.31]
University degree 0.11 [0.32]
0.05 [0.23]
0.06 [0.24]
Employed 0.51 [0.50]
0.39 [0.49]
0.36 [0.48]
Unemployed 0.06 [0.23]
0.07 [0.26]
0.08 [0.27]
Retired 0.26 [0.44]
0.37 [0.48]
0.39 [0.49]
Note: Unweighted means. Standard errors in brackets. Reference category for degrees: “finished basic schooling without a degree”.
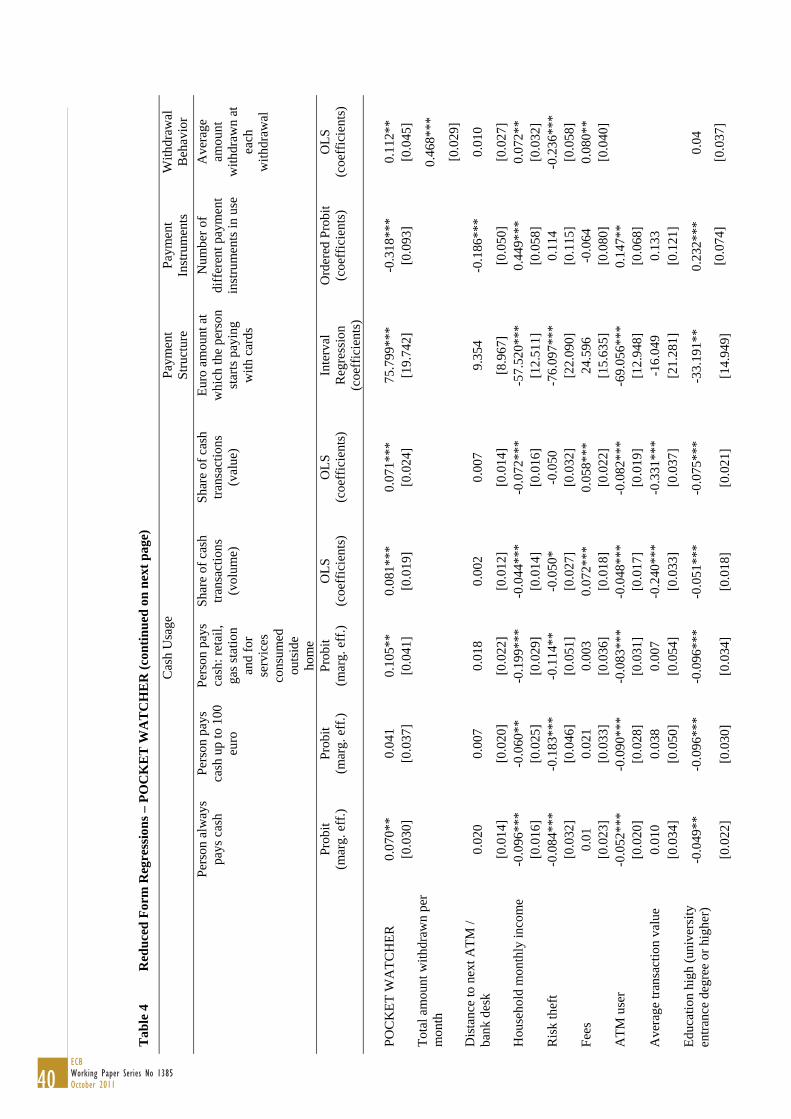
40ECBWorking Paper Series No 1385October 2011
Tab
le 4
R
edu
ced
For
m R
egre
ssio
ns
– P
OC
KE
T W
AT
CH
ER
(co
ntin
ued
on
nex
t pa
ge)
C
ash
Usa
ge
Pay
men
t S
truc
ture
P
aym
ent
Inst
rum
ents
W
ithdr
awal
B
ehav
ior
P
erso
n al
way
s pa
ys c
ash
Per
son
pays
ca
sh u
p to
100
eu
ro
Per
son
pays
ca
sh: r
etai
l, ga
s st
atio
n an
d fo
r se
rvic
es
cons
umed
ou
tsid
e ho
me
Sha
re o
f ca
sh
tran
sact
ions
(v
olum
e)
Sha
re o
f ca
sh
tran
sact
ions
(v
alue
)
Eur
o am
ount
at
whi
ch th
e pe
rson
st
arts
pay
ing
wit
h ca
rds
Num
ber
of
diff
eren
t pay
men
t in
stru
men
ts in
use
Ave
rage
am
ount
w
ithdr
awn
at
each
w
ithdr
awal
P
robi
t (m
arg.
eff
.)
Pro
bit
(mar
g. e
ff.)
P
robi
t (m
arg.
eff
.)
OL
S
(coe
ffic
ient
s)
OL
S
(coe
ffic
ient
s)
Inte
rval
R
egre
ssio
n (c
oeff
icie
nts)
Ord
ered
Pro
bit
(coe
ffic
ient
s)
OL
S
(coe
ffic
ient
s)
P
OC
KE
T W
AT
CH
ER
0.
070*
* 0.
041
0.10
5**
0.08
1***
0.
071*
**
75.7
99**
* -0
.318
***
0.11
2**
[0
.030
] [0
.037
] [0
.041
] [0
.019
] [0
.024
] [1
9.74
2]
[0.0
93]
[0.0
45]
Tot
al a
mou
nt w
ithdr
awn
per
mon
th
0.
468*
**
[0.0
29]
Dis
tanc
e to
nex
t AT
M /
bank
des
k 0.
020
0.00
7 0.
018
0.00
2 0.
007
9.35
4 -0
.186
***
0.01
0
[0
.014
] [0
.020
] [0
.022
] [0
.012
] [0
.014
] [8
.967
] [0
.050
] [0
.027
] H
ouse
hold
mon
thly
inco
me
-0.0
96**
* -0
.060
**
-0.1
99**
* -0
.044
***
-0.0
72**
* -5
7.52
0***
0.
449*
**
0.07
2**
[0
.016
] [0
.025
] [0
.029
] [0
.014
] [0
.016
] [1
2.51
1]
[0.0
58]
[0.0
32]
Ris
k th
eft
-0.0
84**
* -0
.183
***
-0.1
14**
-0
.050
* -0
.050
-7
6.09
7***
0.
114
-0.2
36**
*
[0.0
32]
[0.0
46]
[0.0
51]
[0.0
27]
[0.0
32]
[22.
090]
[0
.115
] [0
.058
] F
ees
0.01
0.
021
0.00
3 0.
072*
**
0.05
8***
24
.596
-0
.064
0.
080*
*
[0.0
23]
[0.0
33]
[0.0
36]
[0.0
18]
[0.0
22]
[15.
635]
[0
.080
] [0
.040
] A
TM
use
r -0
.052
***
-0.0
90**
* -0
.083
***
-0.0
48**
* -0
.082
***
-69.
056*
**
0.14
7**
[0.0
20]
[0.0
28]
[0.0
31]
[0.0
17]
[0.0
19]
[12.
948]
[0
.068
]
Ave
rage
tran
sact
ion
valu
e 0.
010
0.03
8 0.
007
-0.2
40**
* -0
.331
***
-16.
049
0.13
3
[0
.034
] [0
.050
] [0
.054
] [0
.033
] [0
.037
] [2
1.28
1]
[0.1
21]
E
duca
tion
high
(un
iver
sity
en
tran
ce d
egre
e or
hig
her)
-0
.049
**
-0.0
96**
* -0
.096
***
-0.0
51**
* -0
.075
***
-33.
191*
* 0.
232*
**
0.04
[0
.022
] [0
.030
] [0
.034
] [0
.018
] [0
.021
] [1
4.94
9]
[0.0
74]
[0.0
37]
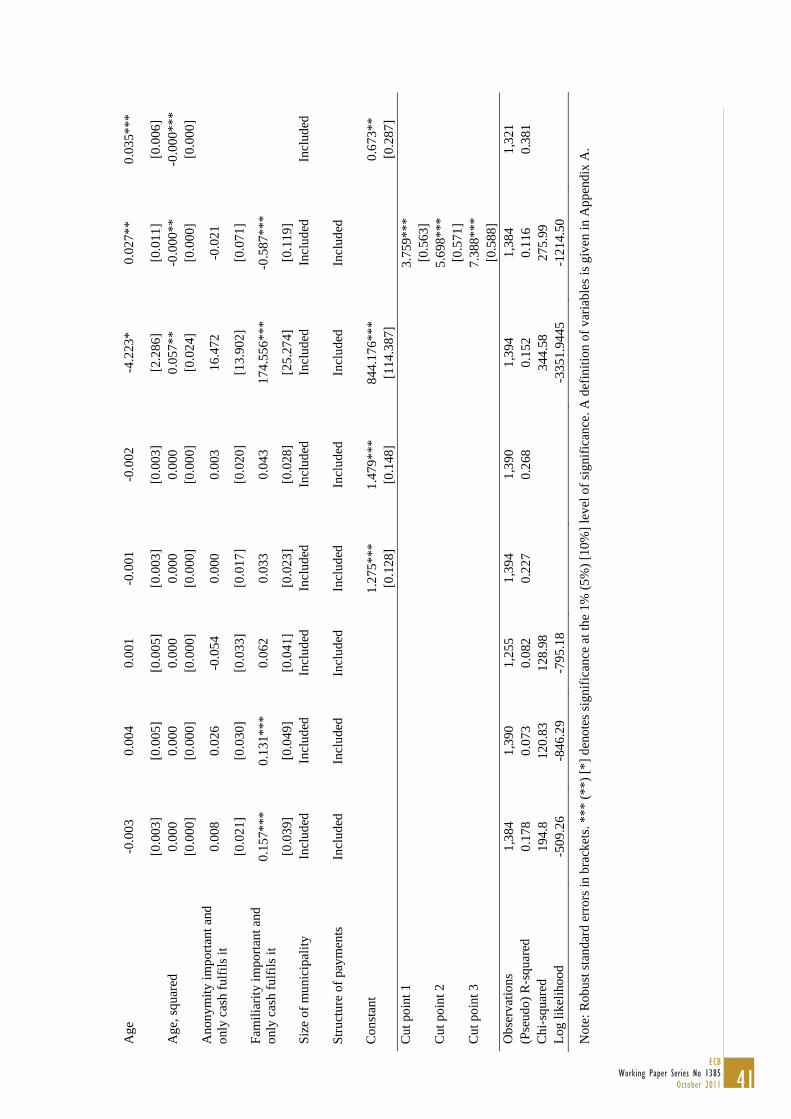
41ECB
Working Paper Series No 1385October 2011
Age
-0
.003
0.
004
0.00
1 -0
.001
-0
.002
-4
.223
* 0.
027*
* 0.
035*
**
[0
.003
] [0
.005
] [0
.005
] [0
.003
] [0
.003
] [2
.286
] [0
.011
] [0
.006
] A
ge, s
quar
ed
0.00
0 0.
000
0.00
0 0.
000
0.00
0 0.
057*
* -0
.000
**
-0.0
00**
*
[0.0
00]
[0.0
00]
[0.0
00]
[0.0
00]
[0.0
00]
[0.0
24]
[0.0
00]
[0.0
00]
Ano
nym
ity im
port
ant a
nd
only
cas
h fu
lfils
it
0.00
8 0.
026
-0.0
54
0.00
0 0.
003
16.4
72
-0.0
21
[0
.021
] [0
.030
] [0
.033
] [0
.017
] [0
.020
] [1
3.90
2]
[0.0
71]
F
amili
arit
y im
port
ant a
nd
only
cas
h fu
lfils
it
0.15
7***
0.
131*
**
0.06
2 0.
033
0.04
3 17
4.55
6***
-0
.587
***
[0
.039
] [0
.049
] [0
.041
] [0
.023
] [0
.028
] [2
5.27
4]
[0.1
19]
S
ize
of m
unic
ipal
ity
Incl
uded
In
clud
ed
Incl
uded
In
clud
ed
Incl
uded
In
clud
ed
Incl
uded
In
clud
ed
S
truc
ture
of
paym
ents
In
clud
ed
Incl
uded
In
clud
ed
Incl
uded
In
clud
ed
Incl
uded
In
clud
ed
Con
stan
t
1.27
5***
1.
479*
**
844.
176*
**
0.
673*
*
[0
.128
] [0
.148
] [1
14.3
87]
[0
.287
] C
ut p
oint
1
3.75
9***
[0
.563
]
Cut
poi
nt 2
5.
698*
**
[0.5
71]
C
ut p
oint
3
7.38
8***
[0
.588
]
Obs
erva
tions
1,
384
1,39
0 1,
255
1,39
4 1,
390
1,39
4 1,
384
1,32
1 (P
seud
o) R
-squ
ared
0.
178
0.07
3 0.
082
0.22
7 0.
268
0.15
2 0.
116
0.38
1 C
hi-s
quar
ed
194.
8 12
0.83
12
8.98
34
4.58
27
5.99
Log
like
lihoo
d -5
09.2
6 -8
46.2
9 -7
95.1
8
-3
351.
9445
-1
214.
50
Not
e: R
obus
t sta
ndar
d er
rors
in b
rack
ets.
***
(**
) [*
] de
note
s si
gnif
ican
ce a
t the
1%
(5%
) [1
0%]
leve
l of
sign
ific
ance
. A d
efin
ition
of
vari
able
s is
giv
en in
App
endi
x A
.
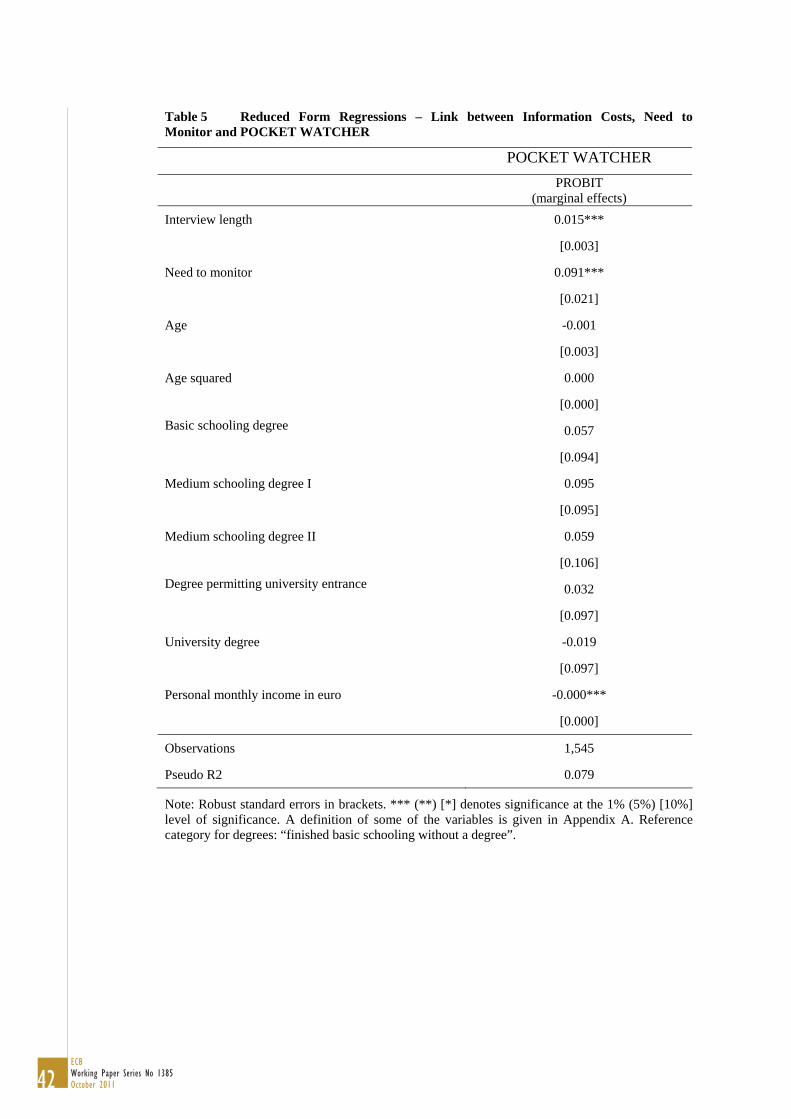
42ECBWorking Paper Series No 1385October 2011
Table 5 Reduced Form Regressions – Link between Information Costs, Need to Monitor and POCKET WATCHER
POCKET WATCHER
PROBIT (marginal effects)
Interview length 0.015***
[0.003]
Need to monitor 0.091***
[0.021]
Age -0.001
[0.003]
Age squared 0.000
[0.000]
Basic schooling degree 0.057
[0.094]
Medium schooling degree I 0.095
[0.095]
Medium schooling degree II 0.059
[0.106]
Degree permitting university entrance 0.032
[0.097]
University degree -0.019
[0.097]
Personal monthly income in euro -0.000***
[0.000]
Observations 1,545
Pseudo R2 0.079
Note: Robust standard errors in brackets. *** (**) [*] denotes significance at the 1% (5%) [10%] level of significance. A definition of some of the variables is given in Appendix A. Reference category for degrees: “finished basic schooling without a degree”.
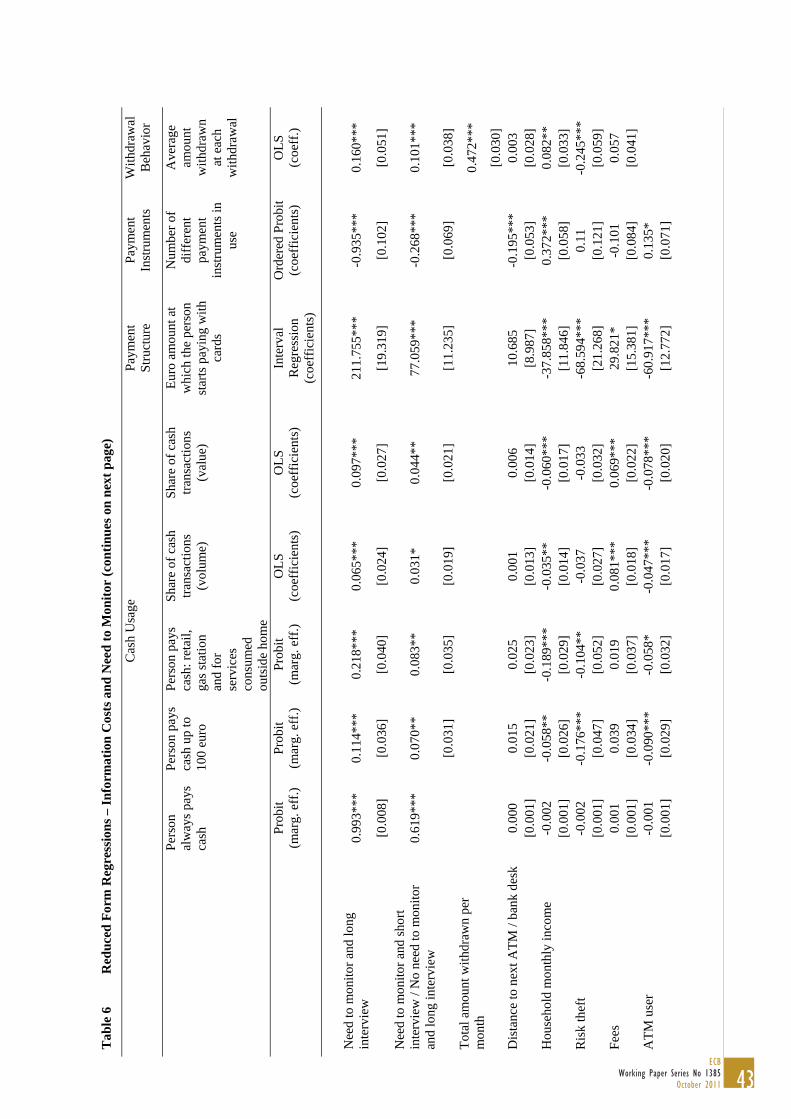
43ECB
Working Paper Series No 1385October 2011
Tab
le 6
R
edu
ced
For
m R
egre
ssio
ns
– In
form
atio
n C
osts
an
d N
eed
to
Mon
itor
(co
nti
nues
on
nex
t p
age)
C
ash
Usa
ge
Pay
men
t S
truc
ture
P
aym
ent
Inst
rum
ents
W
ithdr
awal
B
ehav
ior
P
erso
n al
way
s pa
ys
cash
Per
son
pays
ca
sh u
p to
10
0 eu
ro
Per
son
pays
ca
sh: r
etai
l, ga
s st
atio
n an
d fo
r se
rvic
es
cons
umed
ou
tsid
e ho
me
Sha
re o
f ca
sh
tran
sact
ions
(v
olum
e)
Sha
re o
f ca
sh
tran
sact
ions
(v
alue
)
Eur
o am
ount
at
whi
ch th
e pe
rson
st
arts
pay
ing
with
ca
rds
Num
ber
of
diff
eren
t pa
ymen
t in
stru
men
ts in
us
e
Ave
rage
am
ount
w
ithdr
awn
at e
ach
with
draw
al
P
robi
t (m
arg.
eff
.)
Pro
bit
(mar
g. e
ff.)
P
robi
t (m
arg.
eff
.)
OL
S
(coe
ffic
ient
s)
OL
S
(coe
ffic
ient
s)
Inte
rval
R
egre
ssio
n (c
oeff
icie
nts)
Ord
ered
Pro
bit
(coe
ffic
ient
s)
OL
S
(coe
ff.)
Nee
d to
mon
itor
and
long
in
terv
iew
0.
993*
**
0.11
4***
0.
218*
**
0.06
5***
0.
097*
**
211.
755*
**
-0.9
35**
* 0.
160*
**
[0
.008
] [0
.036
] [0
.040
] [0
.024
] [0
.027
] [1
9.31
9]
[0.1
02]
[0.0
51]
Nee
d to
mon
itor
and
shor
t in
terv
iew
/ N
o ne
ed to
mon
itor
an
d lo
ng in
terv
iew
0.
619*
**
0.07
0**
0.08
3**
0.03
1*
0.04
4**
77.0
59**
* -0
.268
***
0.10
1***
[0.0
31]
[0.0
35]
[0.0
19]
[0.0
21]
[11.
235]
[0
.069
] [0
.038
] T
otal
am
ount
with
draw
n pe
r m
onth
0.47
2***
[0.0
30]
Dis
tanc
e to
nex
t AT
M /
bank
des
k 0.
000
0.01
5 0.
025
0.00
1 0.
006
10.6
85
-0.1
95**
* 0.
003
[0
.001
] [0
.021
] [0
.023
] [0
.013
] [0
.014
] [8
.987
] [0
.053
] [0
.028
] H
ouse
hold
mon
thly
inco
me
-0.0
02
-0.0
58**
-0
.189
***
-0.0
35**
-0
.060
***
-37.
858*
**
0.37
2***
0.
082*
*
[0.0
01]
[0.0
26]
[0.0
29]
[0.0
14]
[0.0
17]
[11.
846]
[0
.058
] [0
.033
] R
isk
thef
t -0
.002
-0
.176
***
-0.1
04**
-0
.037
-0
.033
-6
8.59
4***
0.
11
-0.2
45**
*
[0.0
01]
[0.0
47]
[0.0
52]
[0.0
27]
[0.0
32]
[21.
268]
[0
.121
] [0
.059
] F
ees
0.00
1 0.
039
0.01
9 0.
081*
**
0.06
9***
29
.821
* -0
.101
0.
057
[0
.001
] [0
.034
] [0
.037
] [0
.018
] [0
.022
] [1
5.38
1]
[0.0
84]
[0.0
41]
AT
M u
ser
-0.0
01
-0.0
90**
* -0
.058
* -0
.047
***
-0.0
78**
* -6
0.91
7***
0.
135*
[0
.001
] [0
.029
] [0
.032
] [0
.017
] [0
.020
] [1
2.77
2]
[0.0
71]
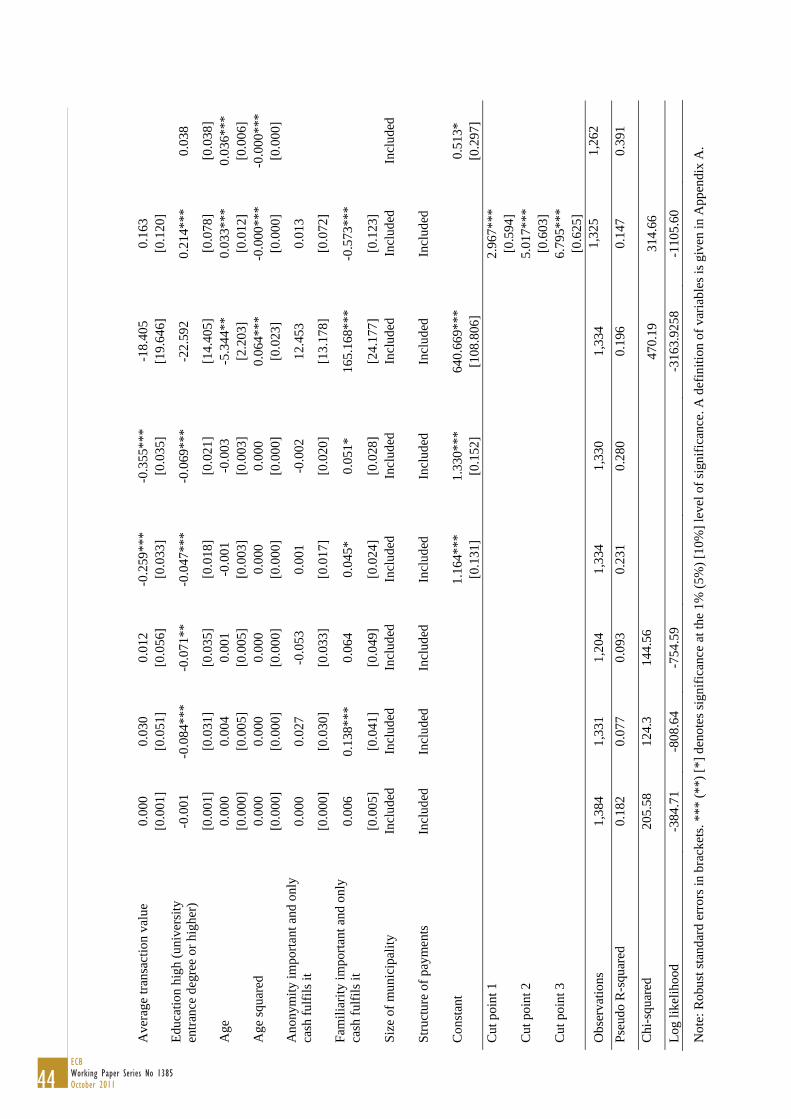
44ECBWorking Paper Series No 1385October 2011
Ave
rage
tran
sact
ion
valu
e 0.
000
0.03
0 0.
012
-0.2
59**
* -0
.355
***
-18.
405
0.16
3
[0
.001
] [0
.051
] [0
.056
] [0
.033
] [0
.035
] [1
9.64
6]
[0.1
20]
E
duca
tion
high
(un
iver
sity
en
tran
ce d
egre
e or
hig
her)
-0
.001
-0
.084
***
-0.0
71**
-0
.047
***
-0.0
69**
* -2
2.59
2 0.
214*
**
0.03
8
[0
.001
] [0
.031
] [0
.035
] [0
.018
] [0
.021
] [1
4.40
5]
[0.0
78]
[0.0
38]
Age
0.
000
0.00
4 0.
001
-0.0
01
-0.0
03
-5.3
44**
0.
033*
**
0.03
6***
[0.0
00]
[0.0
05]
[0.0
05]
[0.0
03]
[0.0
03]
[2.2
03]
[0.0
12]
[0.0
06]
Age
squ
ared
0.
000
0.00
0 0.
000
0.00
0 0.
000
0.06
4***
-0
.000
***
-0.0
00**
*
[0.0
00]
[0.0
00]
[0.0
00]
[0.0
00]
[0.0
00]
[0.0
23]
[0.0
00]
[0.0
00]
Ano
nym
ity im
port
ant a
nd o
nly
cash
ful
fils
it
0.00
0 0.
027
-0.0
53
0.00
1 -0
.002
12
.453
0.
013
[0
.000
] [0
.030
] [0
.033
] [0
.017
] [0
.020
] [1
3.17
8]
[0.0
72]
F
amili
arit
y im
port
ant a
nd o
nly
cash
ful
fils
it
0.00
6 0.
138*
**
0.06
4 0.
045*
0.
051*
16
5.16
8***
-0
.573
***
[0
.005
] [0
.041
] [0
.049
] [0
.024
] [0
.028
] [2
4.17
7]
[0.1
23]
S
ize
of m
unic
ipal
ity
Incl
uded
In
clud
ed
Incl
uded
In
clud
ed
Incl
uded
In
clud
ed
Incl
uded
In
clud
ed
S
truc
ture
of
paym
ents
In
clud
ed
Incl
uded
In
clud
ed
Incl
uded
In
clud
ed
Incl
uded
In
clud
ed
Con
stan
t
1.16
4***
1.
330*
**
640.
669*
**
0.
513*
[0
.131
] [0
.152
] [1
08.8
06]
[0
.297
] C
ut p
oint
1
2.96
7***
[0
.594
]
Cut
poi
nt 2
5.
017*
**
[0.6
03]
C
ut p
oint
3
6.79
5***
[0
.625
]
Obs
erva
tions
1,
384
1,33
1 1,
204
1,33
4 1,
330
1,33
4 1,
325
1,26
2
Pse
udo
R-s
quar
ed
0.18
2 0.
077
0.09
3 0.
231
0.28
0 0.
196
0.14
7 0.
391
Chi
-squ
ared
20
5.58
12
4.3
144.
56
470.
19
314.
66
Log
like
lihoo
d -3
84.7
1 -8
08.6
4 -7
54.5
9
-3
163.
9258
-1
105.
60
Not
e: R
obus
t sta
ndar
d er
rors
in b
rack
ets.
***
(**
) [*
] de
note
s si
gnif
ican
ce a
t the
1%
(5%
) [1
0%]
leve
l of
sign
ific
ance
. A d
efin
ition
of
vari
able
s is
giv
en in
App
endi
x A
.
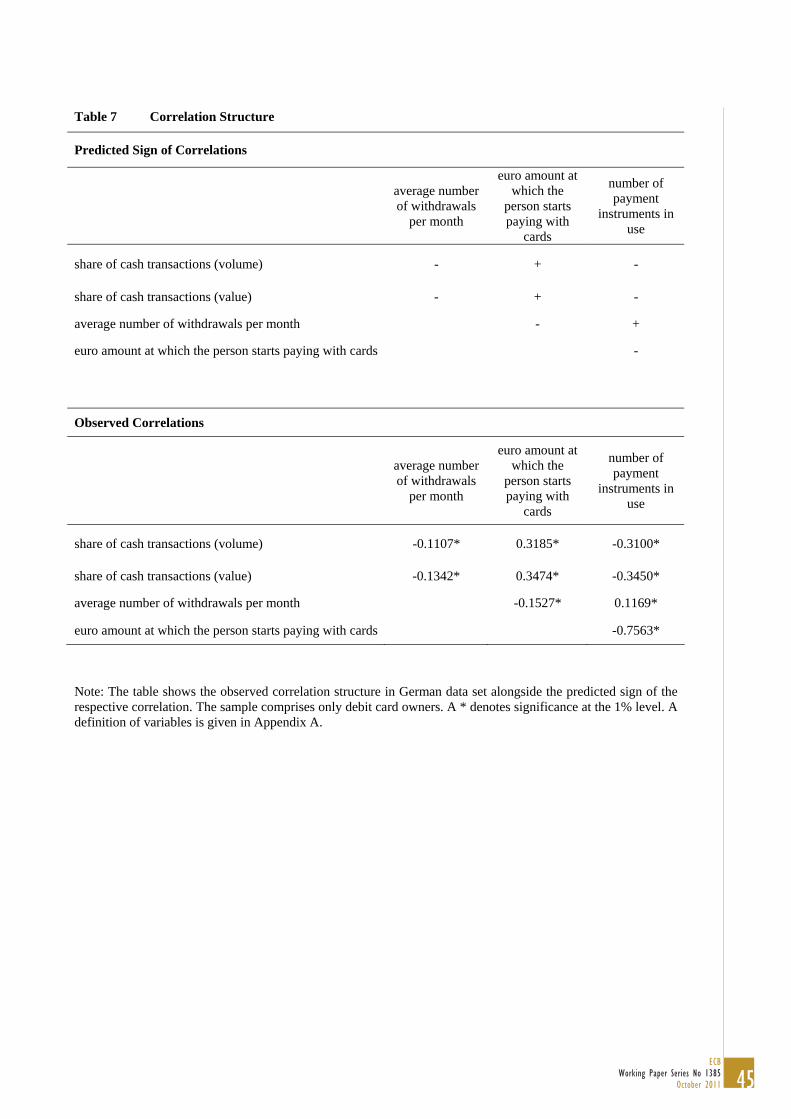
45ECB
Working Paper Series No 1385October 2011
Table 7 Correlation Structure
Predicted Sign of Correlations
average number of withdrawals
per month
euro amount at which the
person starts paying with
cards
number of payment
instruments in use
share of cash transactions (volume) - + -
share of cash transactions (value) - + -
average number of withdrawals per month - +
euro amount at which the person starts paying with cards -
Observed Correlations
average number of withdrawals
per month
euro amount at which the
person starts paying with
cards
number of payment
instruments in use
share of cash transactions (volume) -0.1107* 0.3185* -0.3100*
share of cash transactions (value) -0.1342* 0.3474* -0.3450*
average number of withdrawals per month -0.1527* 0.1169*
euro amount at which the person starts paying with cards -0.7563*
Note: The table shows the observed correlation structure in German data set alongside the predicted sign of the respective correlation. The sample comprises only debit card owners. A * denotes significance at the 1% level. A definition of variables is given in Appendix A.

46ECBWorking Paper Series No 1385October 2011
Appendix A. Variable Definition
Table A1 List of Payment Variables to Test the Hypotheses
Category Variable Description
Cash usage Person always pays cash
Dummy variable: one, if respondent answers that he/she always pays in cash, zero otherwise (derived from responses from the CAPI questionnaire).
Person pays cash: retail, gas stations and for services consumed outside home
Dummy variable: one, if respondent answers that he/she always pays in cash at retailers selling daily consumption goods, zero otherwise (derived from responses from the CAPI questionnaire)
Person pays cash up to 100 euro
Dummy variable: one, if respondent answers that he/she always pays in cash for amounts up to 100 euro, zero otherwise (derived from responses from the CAPI questionnaire).
Percentage of cash transactions (volume)
Percentage of cash transactions in volume terms derived from the payments diary.
Percentage of cash transactions (value)
Percentage of cash transaction in value terms derived from the payments diary.
Payment structure Euro amount at which the person starts paying by card
Derived from responses from the CAPI questionnaire.
Payment instruments
Number of different payment instruments in use
Derived from responses from the CAPI questionnaire.
Withdrawal behavior and cash holdings
Average number of withdrawals per month (scaled)
Respondents were asked about their typical behavior concerning the number of withdrawals per month at ATMs and bank desks (scaled by the square root of the average amount withdrawn per month).
Average number of withdrawals per month
Respondents were asked about their typical behavior concerning the number of withdrawals per month at ATMs and bank desks.
Average amount withdrawn at each withdrawal
Respondents were asked about their typical behavior concerning the average amount withdrawn per withdrawal at ATMs and bank desks.
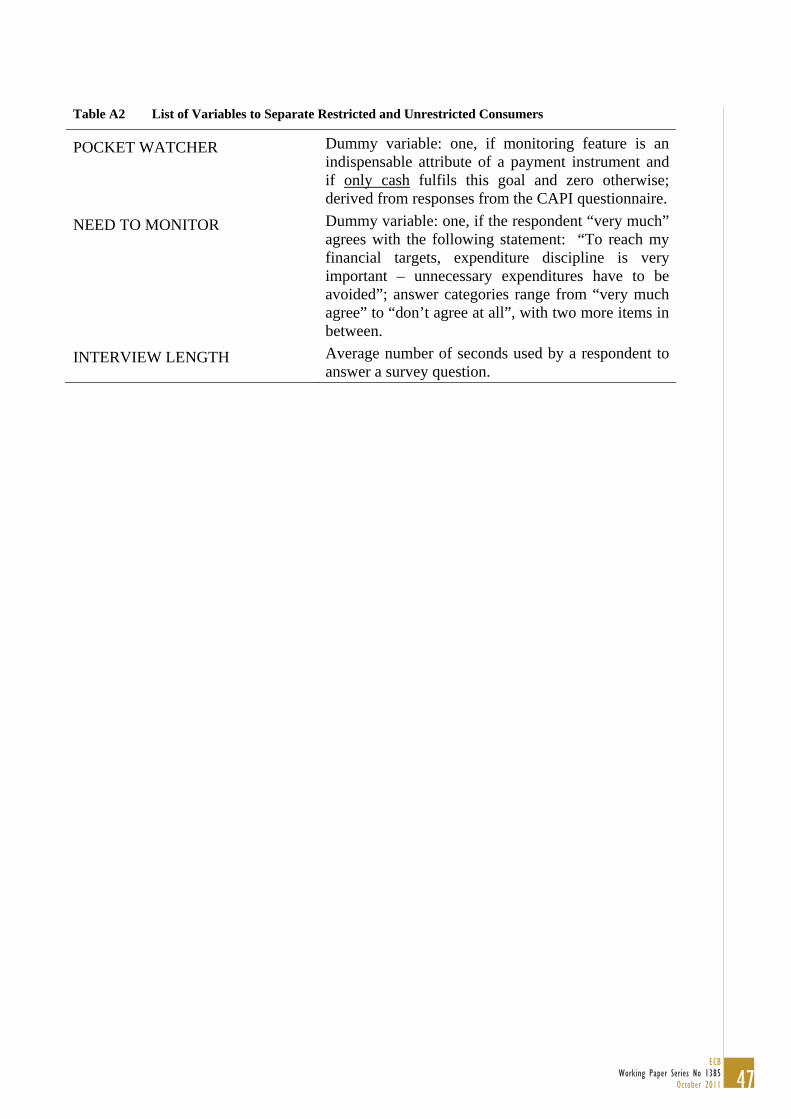
47ECB
Working Paper Series No 1385October 2011
Table A2 List of Variables to Separate Restricted and Unrestricted Consumers
POCKET WATCHER Dummy variable: one, if monitoring feature is an indispensable attribute of a payment instrument and if only cash fulfils this goal and zero otherwise; derived from responses from the CAPI questionnaire.
NEED TO MONITOR Dummy variable: one, if the respondent “very much” agrees with the following statement: “To reach my financial targets, expenditure discipline is very important – unnecessary expenditures have to be avoided”; answer categories range from “very much agree” to “don’t agree at all”, with two more items in between.
INTERVIEW LENGTH Average number of seconds used by a respondent to answer a survey question.
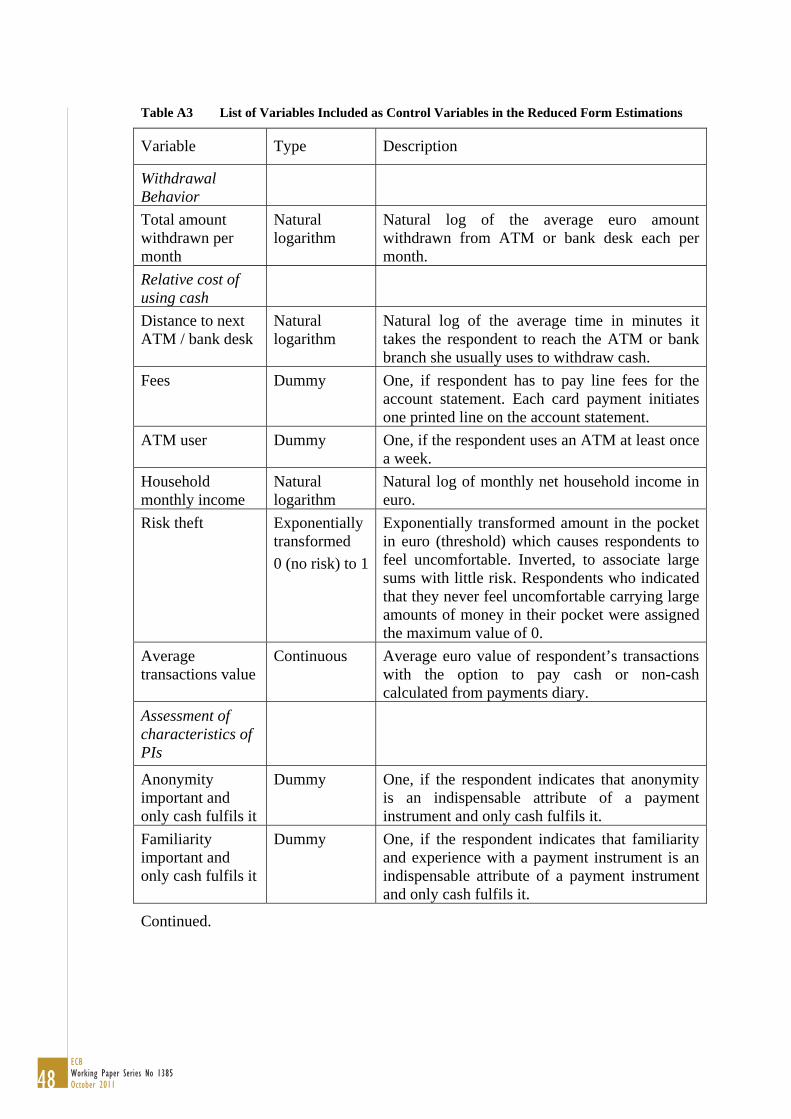
48ECBWorking Paper Series No 1385October 2011
Table A3 List of Variables Included as Control Variables in the Reduced Form Estimations
Variable Type Description
Withdrawal Behavior
Total amount withdrawn per month
Natural logarithm
Natural log of the average euro amount withdrawn from ATM or bank desk each per month.
Relative cost of using cash
Distance to next ATM / bank desk
Natural logarithm
Natural log of the average time in minutes it takes the respondent to reach the ATM or bank branch she usually uses to withdraw cash.
Fees Dummy One, if respondent has to pay line fees for the account statement. Each card payment initiates one printed line on the account statement.
ATM user Dummy One, if the respondent uses an ATM at least once a week.
Household monthly income
Natural logarithm
Natural log of monthly net household income in euro.
Risk theft Exponentially transformed
0 (no risk) to 1
Exponentially transformed amount in the pocket in euro (threshold) which causes respondents to feel uncomfortable. Inverted, to associate large sums with little risk. Respondents who indicated that they never feel uncomfortable carrying large amounts of money in their pocket were assigned the maximum value of 0.
Average transactions value
Continuous Average euro value of respondent’s transactions with the option to pay cash or non-cash calculated from payments diary.
Assessment of characteristics of PIs
Anonymity important and only cash fulfils it
Dummy One, if the respondent indicates that anonymity is an indispensable attribute of a payment instrument and only cash fulfils it.
Familiarity important and only cash fulfils it
Dummy One, if the respondent indicates that familiarity and experience with a payment instrument is an indispensable attribute of a payment instrument and only cash fulfils it.
Continued.
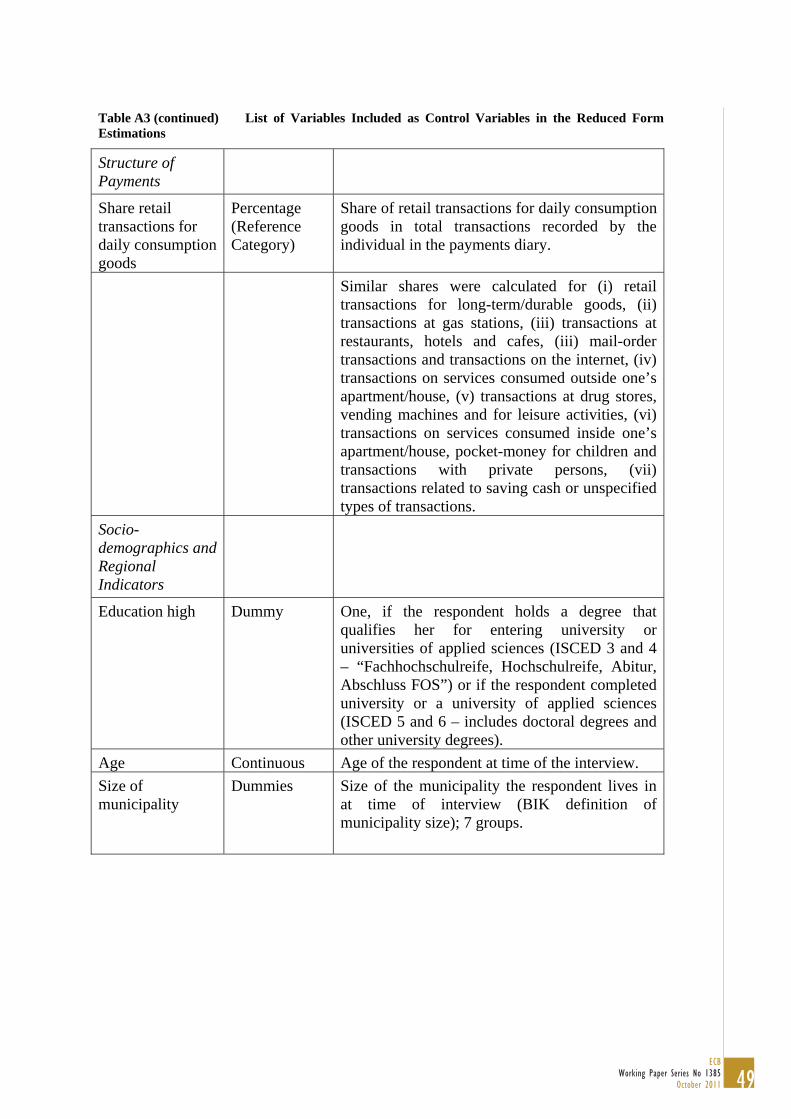
49ECB
Working Paper Series No 1385October 2011
Table A3 (continued) List of Variables Included as Control Variables in the Reduced Form Estimations
Structure of Payments
Share retail transactions for daily consumption goods
Percentage (Reference Category)
Share of retail transactions for daily consumption goods in total transactions recorded by the individual in the payments diary.
Similar shares were calculated for (i) retail transactions for long-term/durable goods, (ii) transactions at gas stations, (iii) transactions at restaurants, hotels and cafes, (iii) mail-order transactions and transactions on the internet, (iv) transactions on services consumed outside one’s apartment/house, (v) transactions at drug stores, vending machines and for leisure activities, (vi) transactions on services consumed inside one’s apartment/house, pocket-money for children and transactions with private persons, (vii) transactions related to saving cash or unspecified types of transactions.
Socio-demographics and Regional Indicators
Education high Dummy One, if the respondent holds a degree that qualifies her for entering university or universities of applied sciences (ISCED 3 and 4 – “Fachhochschulreife, Hochschulreife, Abitur, Abschluss FOS”) or if the respondent completed university or a university of applied sciences (ISCED 5 and 6 – includes doctoral degrees and other university degrees).
Age Continuous Age of the respondent at time of the interview.
Size of municipality
Dummies Size of the municipality the respondent lives in at time of interview (BIK definition of municipality size); 7 groups.
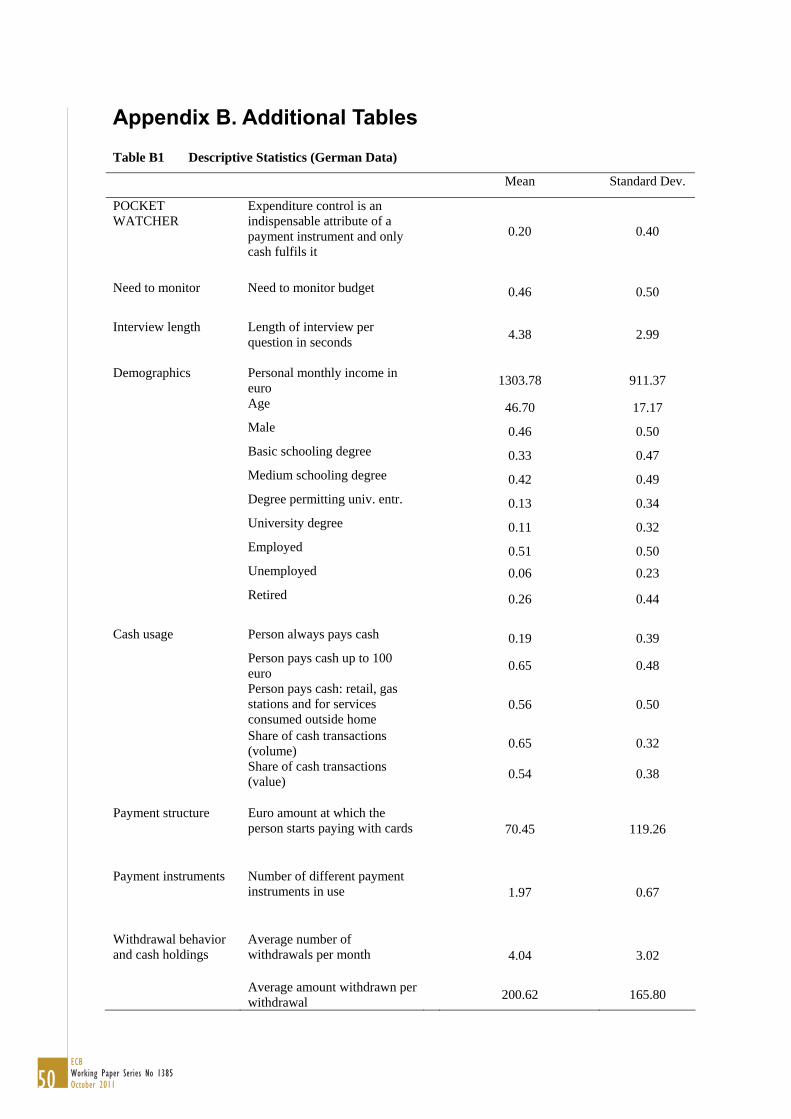
50ECBWorking Paper Series No 1385October 2011
Appendix B. Additional Tables
Table B1 Descriptive Statistics (German Data)
Mean Standard Dev.
POCKET WATCHER
Expenditure control is an indispensable attribute of a payment instrument and only cash fulfils it
0.20 0.40
Need to monitor Need to monitor budget 0.46 0.50
Interview length Length of interview per
question in seconds
4.38 2.99
Demographics Personal monthly income in
euro
1303.78 911.37
Age 46.70 17.17
Male 0.46 0.50
Basic schooling degree 0.33 0.47
Medium schooling degree 0.42 0.49
Degree permitting univ. entr. 0.13 0.34
University degree 0.11 0.32
Employed 0.51 0.50
Unemployed 0.06 0.23
Retired 0.26 0.44
Cash usage Person always pays cash 0.19 0.39
Person pays cash up to 100 euro
0.65 0.48
Person pays cash: retail, gas stations and for services consumed outside home
0.56 0.50
Share of cash transactions (volume)
0.65 0.32
Share of cash transactions (value)
0.54 0.38
Payment structure Euro amount at which the
person starts paying with cards
70.45 119.26
Payment instruments Number of different payment
instruments in use
1.97 0.67
Withdrawal behavior and cash holdings
Average number of withdrawals per month
4.04 3.02
Average amount withdrawn per withdrawal
200.62 165.80

51ECB
Working Paper Series No 1385October 2011
Tab
le B
2
Red
uce
d F
orm
Reg
ress
ion
s –
Info
rmat
ion
Cos
ts a
nd
Nee
d t
o M
onit
or s
epar
atel
y (c
onti
nued
on
next
pag
e)
C
ash
Usa
ge
Pay
men
t S
truc
ture
P
aym
ent
Inst
rum
ents
W
ithdr
awal
B
ehav
ior
P
erso
n al
way
s pa
ys c
ash
Per
son
pays
ca
sh u
p to
10
0 eu
ro
Per
son
pays
ca
sh: r
etai
l, ga
s st
atio
n an
d fo
r se
rvic
es
cons
umed
ou
tsid
e ho
me
Sha
re o
f ca
sh
tran
sact
ions
(v
olum
e)
Sha
re o
f ca
sh
tran
sact
ions
(v
alue
)
Eur
o am
ount
at
whi
ch th
e pe
rson
sta
rts
payi
ng w
ith
card
s
Num
ber
of
diff
eren
t pa
ymen
t in
stru
men
ts
in u
se
Ave
rage
am
ount
w
ithdr
awn
at
each
w
ithdr
awal
P
robi
t (m
arg.
eff
.)
Pro
bit
(mar
g. e
ff.)
P
robi
t (m
arg.
eff
.)
OL
S
(coe
ffic
ient
s)
OL
S
(coe
ffic
ient
s)
Inte
rval
R
egre
ssio
n (c
oeff
icie
nts)
Ord
ered
P
robi
t (c
oeff
.)
OL
S
(coe
ffic
ient
s)
N
eed
to m
onito
r 0.
008
-0.0
05
0.02
4 0.
021
0.04
5**
37.1
43**
* -0
.166
**
0.09
1**
[0
.009
] [0
.029
] [0
.032
] [0
.017
] [0
.019
] [1
0.64
3]
[0.0
73]
[0.0
36]
Inte
rvie
w le
ngth
0.
049*
**
0.04
8***
0.
072*
**
0.01
1***
0.
013*
**
69.3
1***
-0
.364
***
0.02
2***
[0.0
10]
[0.0
09]
[0.0
11]
[0.0
03]
[0.0
04]
[3.2
23]
[0.0
22]
[0.0
07]
Tot
al a
mou
nt w
ithdr
awn
per
mon
th
0.
470*
**
[0.0
30]
Dis
tanc
e to
nex
t AT
M /
bank
des
k 0.
001
0.00
9 0.
019
0.00
1 0.
006
7.78
0 -0
.213
***
0.00
5
[0.0
07]
[0.0
21]
[0.0
23]
[0.0
13]
[0.0
14]
[7.6
68]
[0.0
57]
[0.0
28]
Hou
seho
ld m
onth
ly in
com
e -0
.037
***
-0.0
54**
-0
.188
***
-0.0
34**
-0
.059
***
-30.
370*
**
0.40
1***
0.
090*
**
[0
.009
] [0
.025
] [0
.029
] [0
.014
] [0
.017
] [1
0.20
2]
[0.0
63]
[0.0
33]
Ris
k th
eft
-0.0
19
-0.1
52**
* -0
.072
-0
.033
-0
.031
-4
0.47
3**
-0.0
22
-0.2
46**
*
[0.0
14]
[0.0
47]
[0.0
53]
[0.0
27]
[0.0
32]
[18.
459]
[0
.127
] [0
.060
] F
ees
0.02
8 0.
042
0.02
6 0.
081*
**
0.06
9***
28
.601
**
-0.1
05
0.05
7
[0.0
18]
[0.0
33]
[0.0
37]
[0.0
18]
[0.0
22]
[12.
451]
[0
.089
] [0
.041
]
AT
M u
ser
-0.0
02
-0.0
82**
* -0
.044
-0
.045
**
-0.0
75**
* -4
5.43
4***
0.
078
[0.0
09]
[0.0
29]
[0.0
33]
[0.0
17]
[0.0
20]
[10.
957]
[0
.075
]
Ave
rage
tran
sact
ion
valu
e 0.
004
0.01
3 -0
.028
-0
.268
***
-0.3
63**
* -4
3.18
0***
0.
358*
**
[0.0
22]
[0.0
52]
[0.0
60]
[0.0
33]
[0.0
35]
[16.
234]
[0
.132
]
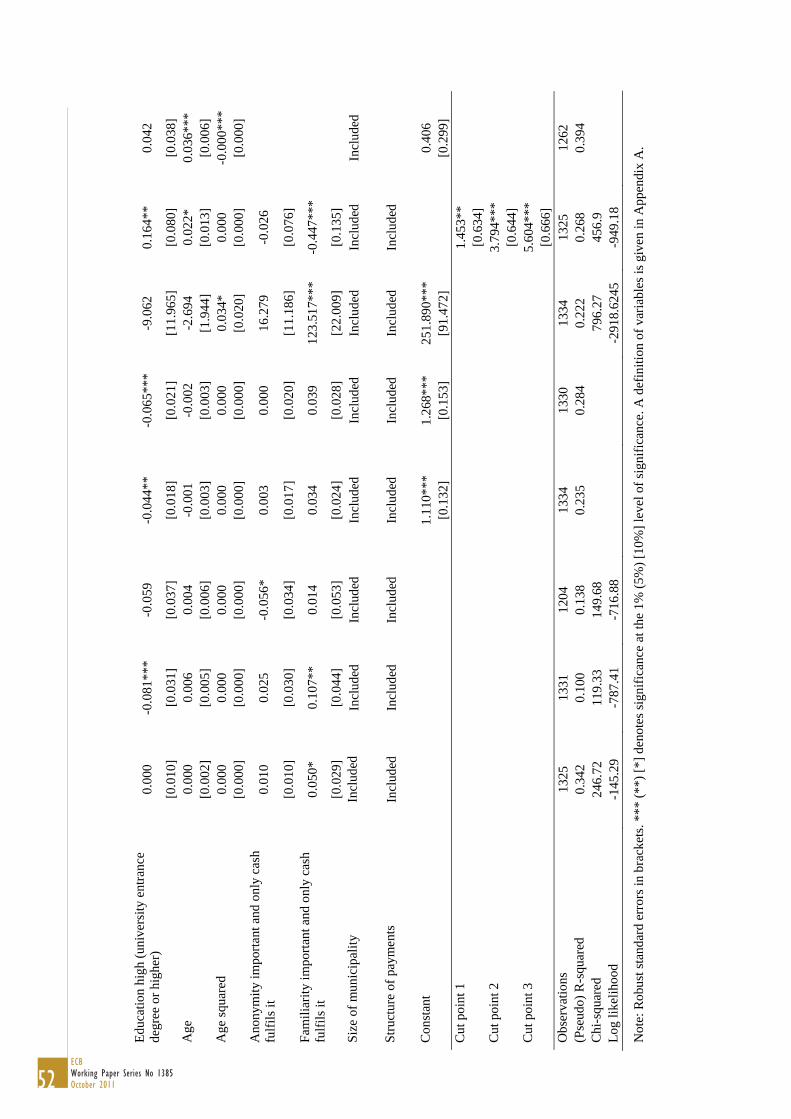
52ECBWorking Paper Series No 1385October 2011
Edu
catio
n hi
gh (
univ
ersi
ty e
ntra
nce
degr
ee o
r hi
gher
) 0.
000
-0.0
81**
* -0
.059
-0
.044
**
-0.0
65**
* -9
.062
0.
164*
* 0.
042
[0
.010
] [0
.031
] [0
.037
] [0
.018
] [0
.021
] [1
1.96
5]
[0.0
80]
[0.0
38]
Age
0.
000
0.00
6 0.
004
-0.0
01
-0.0
02
-2.6
94
0.02
2*
0.03
6***
[0.0
02]
[0.0
05]
[0.0
06]
[0.0
03]
[0.0
03]
[1.9
44]
[0.0
13]
[0.0
06]
Age
squ
ared
0.
000
0.00
0 0.
000
0.00
0 0.
000
0.03
4*
0.00
0 -0
.000
***
[0
.000
] [0
.000
] [0
.000
] [0
.000
] [0
.000
] [0
.020
] [0
.000
] [0
.000
] A
nony
mity
impo
rtan
t and
onl
y ca
sh
fulf
ils
it
0.01
0 0.
025
-0.0
56*
0.00
3 0.
000
16.2
79
-0.0
26
[0
.010
] [0
.030
] [0
.034
] [0
.017
] [0
.020
] [1
1.18
6]
[0.0
76]
F
amili
arit
y im
port
ant a
nd o
nly
cash
fu
lfil
s it
0.
050*
0.
107*
* 0.
014
0.03
4 0.
039
123.
517*
**
-0.4
47**
*
[0
.029
] [0
.044
] [0
.053
] [0
.024
] [0
.028
] [2
2.00
9]
[0.1
35]
S
ize
of m
unic
ipal
ity
Incl
uded
In
clud
ed
Incl
uded
In
clud
ed
Incl
uded
In
clud
ed
Incl
uded
In
clud
ed
S
truc
ture
of
paym
ents
In
clud
ed
Incl
uded
In
clud
ed
Incl
uded
In
clud
ed
Incl
uded
In
clud
ed
Con
stan
t
1.11
0***
1.
268*
**
251.
890*
**
0.
406
[0.1
32]
[0.1
53]
[91.
472]
[0.2
99]
Cut
poi
nt 1
1.
453*
*
[0
.634
]
Cut
poi
nt 2
3.
794*
**
[0.6
44]
C
ut p
oint
3
5.60
4***
[0
.666
]
Obs
erva
tions
13
25
1331
12
04
1334
13
30
1334
13
25
1262
(P
seud
o) R
-squ
ared
0.
342
0.10
0 0.
138
0.23
5 0.
284
0.22
2 0.
268
0.39
4 C
hi-s
quar
ed
246.
72
119.
33
149.
68
796.
27
456.
9
Log
like
lihoo
d -1
45.2
9 -7
87.4
1 -7
16.8
8
-2
918.
6245
-9
49.1
8
Not
e: R
obus
t sta
ndar
d er
rors
in b
rack
ets.
***
(**
) [*
] de
note
s si
gnif
ican
ce a
t the
1%
(5%
) [1
0%]
leve
l of
sign
ific
ance
. A d
efin
ition
of
vari
able
s is
giv
en in
App
endi
x A
.
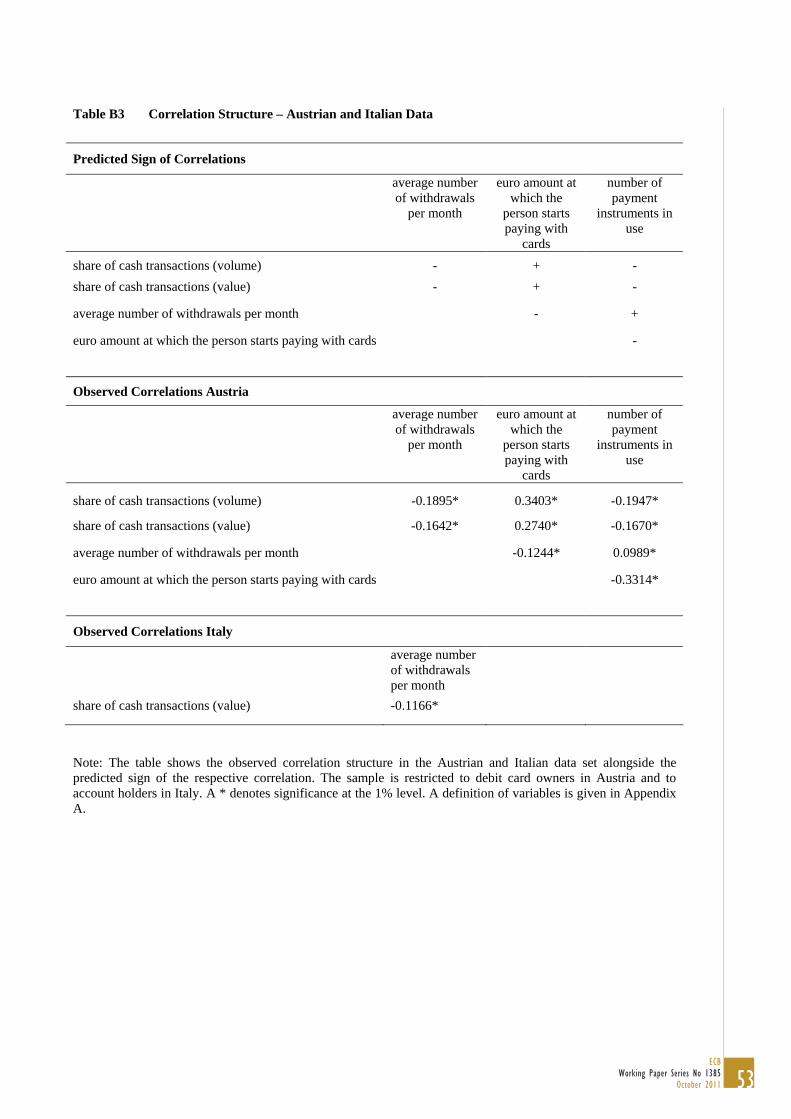
53ECB
Working Paper Series No 1385October 2011
Table B3 Correlation Structure – Austrian and Italian Data
Predicted Sign of Correlations
average number of withdrawals
per month
euro amount at which the
person starts paying with
cards
number of payment
instruments in use
share of cash transactions (volume) - + -
share of cash transactions (value) - + -
average number of withdrawals per month - +
euro amount at which the person starts paying with cards -
Observed Correlations Austria
average number of withdrawals
per month
euro amount at which the
person starts paying with
cards
number of payment
instruments in use
share of cash transactions (volume) -0.1895* 0.3403* -0.1947*
share of cash transactions (value) -0.1642* 0.2740* -0.1670*
average number of withdrawals per month -0.1244* 0.0989*
euro amount at which the person starts paying with cards -0.3314*
Observed Correlations Italy
average number of withdrawals per month
share of cash transactions (value) -0.1166*
Note: The table shows the observed correlation structure in the Austrian and Italian data set alongside the predicted sign of the respective correlation. The sample is restricted to debit card owners in Austria and to account holders in Italy. A * denotes significance at the 1% level. A definition of variables is given in Appendix A.
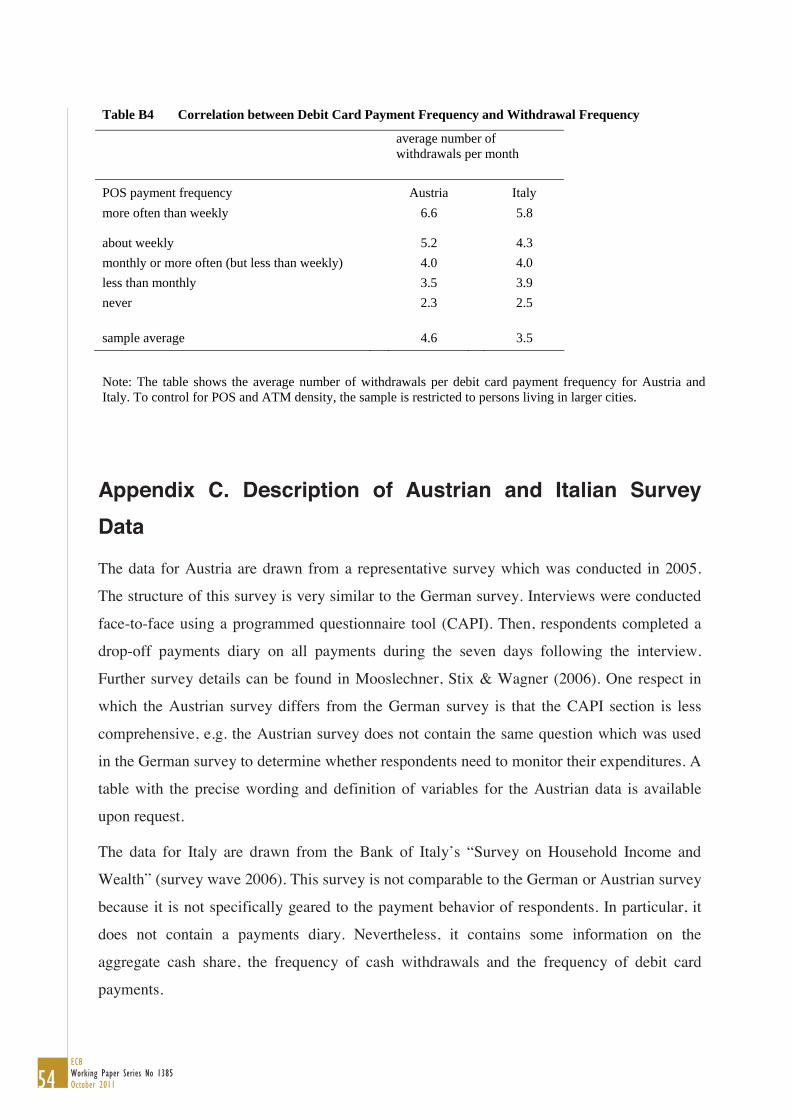
54ECBWorking Paper Series No 1385October 2011
Appendix C. Description of Austrian and Italian Survey
Data
The data for Austria are drawn from a representative survey which was conducted in 2005.
The structure of this survey is very similar to the German survey. Interviews were conducted
face-to-face using a programmed questionnaire tool (CAPI). Then, respondents completed a
drop-off payments diary on all payments during the seven days following the interview.
Further survey details can be found in Mooslechner, Stix & Wagner (2006). One respect in
which the Austrian survey differs from the German survey is that the CAPI section is less
comprehensive, e.g. the Austrian survey does not contain the same question which was used
in the German survey to determine whether respondents need to monitor their expenditures. A
table with the precise wording and definition of variables for the Austrian data is available
upon request.
The data for Italy are drawn from the Bank of Italy’s “Survey on Household Income and
Wealth” (survey wave 2006). This survey is not comparable to the German or Austrian survey
because it is not specifically geared to the payment behavior of respondents. In particular, it
does not contain a payments diary. Nevertheless, it contains some information on the
aggregate cash share, the frequency of cash withdrawals and the frequency of debit card
payments.
Table B4 Correlation between Debit Card Payment Frequency and Withdrawal Frequency
average number of withdrawals per month
POS payment frequency Austria Italy
more often than weekly 6.6 5.8
about weekly 5.2 4.3
monthly or more often (but less than weekly) 4.0 4.0
less than monthly 3.5 3.9
never 2.3 2.5
sample average 4.6 3.5
Note: The table shows the average number of withdrawals per debit card payment frequency for Austria and Italy. To control for POS and ATM density, the sample is restricted to persons living in larger cities.

Work ing PaPer Ser i e Sno 1118 / november 2009
DiScretionary FiScal PolicieS over the cycle
neW eviDence baSeD on the eScb DiSaggregateD aPProach
by Luca Agnello and Jacopo Cimadomo