Embed Size (px)
Citation preview

Using astronomical photographs to investigate misconceptions about galaxies and spectra:Question development for clicker use
Hyunju Lee1,* and Stephen E. Schneider21Department of Teacher Education and Curriculum Studies, University of Massachusetts,
Amherst, Massachusetts 01002, USA2Department of Astronomy, University of Massachusetts, Amherst, Massachusetts 01002, USA
(Received 20 January 2015; published 13 July 2015)
Many topics in introductory astronomy at the college or high-school level rely implicitly on usingastronomical photographs and visual data in class. However, students bring many preconceptions to theirunderstanding of these materials that ultimately lead to misconceptions, and research about students’interpretation of astronomical images has been scarcely conducted. In this study we probed collegestudents’ understanding of astronomical photographs and visual data about galaxies and spectra, anddeveloped a set of concept questions based on their common misconceptions. The study was conductedmainly in three successive surveys: (i) open-ended questions looking for students’ ideas and commonmisconceptions, (ii) combined multiple-choice and open-ended questions seeking to explore studentreasoning and to improve concept questions for clickers, and (iii) a finalized version of the conceptquestions used to investigate the strength of each misconception among the students in introductoryastronomy courses. This study reports on the procedures and the development of the concept questions withthe investigated common misconceptions about galaxies and spectra. We also provide the set of developedquestions for teachers and instructors seeking to implement in their classes for the purpose of formativeassessment with the use of classroom response systems. These questions would help them recognize thegap between their teaching and students’ understanding, and ultimately improve teaching of the concepts.
DOI: 10.1103/PhysRevSTPER.11.020101 PACS numbers: 01.40.Fk, 01.40.gb, 01.50.ht
I. INTRODUCTION
The Hubble Space Telescope (HST) has produced thou-sands of remarkable photographic images over the past20 years. The HST images have had an important role inproviding valuable scientific information to astrophysicists.In science classrooms, they are often used to attract students’attention to the beauty of theUniverse or to illustrate celestialphenomena, but students often have little guidance abouthow to examine astronomical images as data or how tointerpret them. For example, students often gain the impres-sion that galaxies are far more dense than they are in reality,they have little understanding of galaxy sizes and separa-tions, and theymisinterpret colors (sometimes false colors) inthe images. In this study, we investigate how college studentsinterpret photographic images of galaxies across the electro-magnetic spectrum and we seek to understand their mis-conceptions. Based on the findings, we developed conceptquestions that may be used with clickers in an introductoryastronomy course to illuminate how students misinterpret
astronomical images. Throughout this paper we use the termimage as the meaning of visual data that contains physicalinformation, often in the form of a photograph that is thecommon usage in the field of astronomy.
II. THEORETICAL FRAMEWORK
A. Photographs and misconceptions in astronomy
Students bring ideas that have formed from their dailyexperiences to their learning environment [1]. This kind ofprior idea is called a preconception, defined as “a conceptionin a certain area that is present in a student prior toinstruction” ([2], p. 1241). Preconceptions often lead tomisconceptions “that can conflict with currently acceptedscientific theory” ([2], p. 1241). Many studies have inves-tigated students’ misconceptions in science. There areseveral studies in astronomy as well, but they are relativelylimited in the topic areas they examine [3]. The astronomicalconcepts that have been most studied are the shape of Earthand its gravity [4], day and night [5–7], cause of seasonalchange [5,6,8,9], and phases of the moon [10]. Lelliott andRollnick [11] reviewed 103 peer-reviewed astronomy edu-cation studies published between 1974 and 2008 and foundthat over 80% of the studies examined just five topics: Earth,gravity, the day and night cycle, the seasons, and the Earth-Sun-moon system, and only the remaining 20%of the studiesexamined other topics such as stars, the solar system, and
*Present address: Leiden Observatory, Leiden University,Leiden, [email protected]; [email protected]
Published by the American Physical Society under the terms ofthe Creative Commons Attribution 3.0 License. Further distri-bution of this work must maintain attribution to the author(s) andthe published article’s title, journal citation, and DOI.
PHYSICAL REVIEW SPECIAL TOPICS - PHYSICS EDUCATION RESEARCH 11, 020101 (2015)
1554-9178=15=11(2)=020101(11) 020101-1 Published by the American Physical Society

their sizes and distances. A few recent studies have begun tolook at broader topics in astronomy [12] such the big bangtheory [13] or cosmology [14], but misconceptions heldabout many topics in astronomy are largely unexplored.As students construct preconceptions from their daily
experiences, they also form preconceptions from photo-graphs and bring them to their science classes. Whilestudies have long reported misconceptions in many sciencedisciplines, only recently have they begun to investigate thepotential role of image interpretation in forming thesemisconceptions. For example, Pozzer and Roth [15] exam-ined four categories of illustrations in high school biologytextbooks identified according to whether or not there was acaption, relevant information, and/or further explanation.They then investigated how high school students inter-preted photographs of each functional category [16].Another recent study used photographs to examine highschool students’ and pre-service teachers’ understanding ofNewton’s third law [17]. However, studies about photo-graphs in science learning are relatively scarce compared tostudies of other types of visual materials [18].In professional scientific research, interpreting photo-
graphs is a fundamental and important procedure. This isespecially true in astronomy, where photographs andspectra often provide our only clues to solving mysteriesabout astronomical objects and the universe. Striking, eye-catching photographs of stars or galaxies are commonlyseen in daily life, and many students may have formedvarious preconceptions and misconceptions about astro-nomical concepts through photographs before learningabout the subject in classes. What do they understandfrom astronomical photographs? How do they interpretthem? Little is known about the answers to these questions.
B. Classroom response systems and concept questions
Introductory astronomy classes at universities and col-leges often have more than a hundred students, making itchallenging for an instructor to communicate with thestudents. Instructors in such large classes often cannot helpbut do frontal teaching, simply conveying information totheir students. Educators’ efforts have been aided over thelast decade by educational technologies such as classroomresponse systems (CRSs, or simply clickers). CRSs allow aninstructor to present simple numerical or multiple-choicequestions to a class. Students then enter their answers usingthe devices, and the system instantly collects their responses.The students’ responses are presented as a histogram,allowing the instructor and the students to see the class’scumulative results. This technology can play various roles inclass such as checking student attendance or gatheringstudent responses on exams; however, it is most valuablewhen it is used by instructors to perform formative assess-ment and to understand students’ various ideas in classroomdiscussion [19]. In simple terms, instructors can decide bylooking at the histogram of responses whether they need to
revisit the topic or can move to the next one. Instructors canhelp students scaffold learningwhen they knowwhether theirstudents understand scientific concepts and what they arestruggling with. In addition, CRS technology can attractstudents into active participation, helping them overcomemisconceptions by making them conscious of their ownbackground knowledge and preconceptions, by revealinggaps and contradictions in students’ understanding, and byidentifying flaws in students’ logic [20].To be successful in formative assessment with CRS
technology, it is important to use well-designed conceptquestions. Concept questions are a form of multiple-choiceor simple questions that are designed to explore students’understanding of scientific concepts [21,22]. Mazur [22]suggested in his book, Peer Instruction, that “Instead ofpresenting the level of detail covered in the textbook orlecture notes, lectures consist of a number of short presenta-tions on key points, each followed by a ConcepTest—shortconceptual questions on the subject being discussed” (p. 10).He argued that those questions should satisfy the followingcriteria: “focus on a single concept; not be solved by relyingon equations; have adequate multiple-choice answers; beunambiguously worded; and be neither too easy nor toodifficult” (p, 26). Good concept questions represent probablestudents’ conceptions and reveal their misconceptions [22],so instructors can assess whether the students understand ascientific concept and help themwork through the issues thatthey misunderstand. Therefore, it is necessary to determinestudent ideas and misconceptions in order to develop usefulconcept questions.Over the last several decades, concept questions have
been developed in many science topics (see, e.g., Refs.[23–28]). There are several sets of concept questionsdeveloped in astronomy as well, such as the AstronomyDiagnostic Test [29], the Light and Spectroscopy ConceptInventory [30], and the Star Properties Concept Inventory[31]. Notably, Green [32] assembled approximately 400questions over all general astronomy topics. However, thosequestions are mostly based on texts and/or diagrams, andthey do not probe understanding of astronomical images.Astronomy is an observational science that gathers informa-tion mostly from light over a range of wavelengths.Therefore, visualization is an important starting point tounderstanding astronomical concepts. Green noted,“Visualization, with its emphasis on observation, is espe-cially relevant for astronomy. The addition of graphics andfigures to the ConcepTest Library is therefore an importantgoal for the future” ([32], p. 36).Our study investigates college students’ interpretations of
astronomical photographs and their misconceptions aboutgalaxies and spectra, which are fundamental topics inintroductory astronomy at the college and high-school level.Based on the findings of a series of surveys to uncovermisconceptions, we developedmultiple-choice concept ques-tions that are applicable to introductory astronomy courses or
HYUNJU LEE AND STEPHEN E. SCHNEIDER PHYS. REV. ST PHYS. EDUC. RES 11, 020101 (2015)
020101-2

high school physics classes. In addition, the final version ofquestions was surveyed with college students in two intro-ductory astronomy courses to understand how frequentlystudents retained each misconception after instruction.
III. METHODS
A. Context and data collection
This study was conducted primarily through threesuccessive surveys. Survey 1 consisted of 23 questions,all open-ended except for one multiple-choice question,exploring various ideas about the photographs of galaxiesand spectra. This survey was completed by college studentsin an introductory astronomy course for nonmajors inSpring 2011. The course covered general topics inastronomy including stars, spectra, galaxies, and modernastronomy. Because we wanted to understand students’prior knowledge, survey 1 was conducted early in thesemester before instruction on the topics of galaxies andspectra. Because of the length of the survey, it was split intotwo parts and conducted in two different times on thecourse website; 117 students participated in survey 1 part 1,and 149 students in survey 1 part 2. Students’ responses onsurvey 1 informed us about a variety of their misconcep-tions about galaxies and spectra.Based on what was found from survey 1, we developed a
2-tier concept survey instrument that consisted of tentativemultiple-choice concept questions and follow-up open-endedquestions (survey 2). Students were asked to select theiranswer choices from among the multiple-choice answers(selecting more than one answer choice was allowed), andthen to write reasons for their answer choices in open-endedquestions. Survey 2 was conducted with the same students assurvey 1 in the same class in late spring 2011 near the end ofthe semester, sowe could learnwhatmisconceptions they stillheld after instruction. Survey 2was also divided into twopartsdue to its length; 198 students participated in survey 2 part 1,and 162 students in survey 2 part 2.The questionsweremodified based on the information that
we gained from the students’ responses on survey 2. Some ofthe questions were combined or removed andwordings wererevised, and 41 multiple-choice concept questions weredeveloped. Those questions were sent for review and to testcontent validity to two faculty members who were teachingintroductory astronomy in two different universities. Contentvalidity is a nonstatistical type of validity study that estimateshowwell the items represent the specific intended domain ofcontent. The faculty members reviewed the questions andprovided comments on whether they covered topics appro-priate for an introductory astronomy class and whether theirwording was scientifically accurate. In addition, the facultymembers were asked to identify any misconceptions theyknew of relating to each question. Based on their comments,the questions were further modified.As a result, we finalized survey 3 with 38 concept
questions. Survey 3 was used with students in two
introductory astronomy classes at the end of fall 2011 (classA: 93 students completed) and at the end of spring 2012 (classB: 121 students completed). Survey 3 was used to find outhow commonly and consistently the misconceptions wereheld among the students in two additional classes. Survey 3was conducted through the course websites. The studentswere allowed to choose only one answer choice in eachmultiple-choice question. All the surveys were takenanonymously.The participating students throughout the surveys were
mostly freshmen (68.4%) and sophomore (20.4%). Moststudents (80.9%) did not major in science. The introductoryastronomy course that they enrolled in was the firstastronomy class ever for most students (83.8%). Only asmall number of students (11.6%) had experience of learningastronomy in either middle or high school, and even fewer(4.6%) had previously taken another astronomy course incollege.
B. Analysis
The students’ responses on each survey were analyzed inseveral ways. For example, survey 1 data were analyzedqualitatively. The students’ responses were read thoroughlyand similar responses were grouped together. In that way,common themes of misconceptions were identified for eachscientific concept. On the other hand, survey 2 data wereanalyzed using mixed methods. The numerical data frommultiple-choice questions were analyzed using descriptivestatistics and the strength of responses was measured foreach answer choice. In the following open-ended questions,students’ common reasons for their answer choices werecategorized. Based on the results from survey 2, we refinedthe concept questions to better represent students’ various,yet common and strong, misconceptions. Finally, propor-tional similarity was measured for survey 3 data from thetwo introductory courses. This was done to understand howwell the developed concept questions represent students’common misconceptions. Proportional similarity, alsocalled percentage similarity [33], is defined as
PSðU;VÞ ¼XC
i¼1
minðfUi; fViÞ
[34]. In simple terms, the proportional similarity is the sumof the lowest percent values between groups divided by100, and it tells the degree of similarity in the percentagesof items (answer choices in our study) between groups.It is a desirable method to measure similarity betweendistributions [35].
IV. RESULTS
A. Student ideas and misconceptions
The findings reported in this section are based on students’open-ended responses to survey 1 and survey 2. Here wepresent some of the most common misconceptions observed
USING ASTRONOMICAL PHOTOGRAPHS TO … PHYS. REV. ST PHYS. EDUC. RES 11, 020101 (2015)
020101-3

among the students’various ideas about galaxies and spectra.In student quotes, S represents a student number.
1. Radio waves
Students’ interpretations of the images of the Milky Waymade from observations at radio, infrared, and opticalwavelengths (Fig. 1) revealed various misconceptions aboutradio waves, infrared emission, and the dust clouds in ourgalaxy. The question asked, “Why do you think the colors inthe radio image look much different from the ones in theinfrared or optical images?” Radio waves are longer wave-length light than optical and infrared light.While radiowavescannot be seen with our eyes, the intensity and wavelengthdata recorded by radio detectors contain similar informationto that recorded in visible-wavelength images. Therefore,radio images such as shown in Fig. 1 are presented with falsecolors.Many students, however, thought that the radio imagelooked different because radiowaves are not light but sound.For example, “The radio waves shows the images of thesounds of the milky way” (S11, survey 1, part 1). Somestudents thought that different wavelengths of light havedifferent speeds, for example, “The radio image might lookdifferent because the radio frequency is much different thaninfrared and optical where it is much faster” (S54, survey 1,part 1). This aligns with the well-known misconception thatoptical light is thought to travel faster than radio waves[36,37]. In reality, the speed of light is the same for allwavelengths of electromagnetic radiation.
2. Infrared
While radio waves are commonly thought of as sound,infrared is commonly thought of as heat. The misconceptionhere ismore subtle in thatmany hot sources do emit primarilyat infrared wavelengths, but students’ responses seemed tointerpret infrared radiation as something quite distinct fromelectromagnetic radiation and solely related to thermalemission. For example, “Because the infrared image picks
up on heat waves while the optical image is just what themilky way actually looks like” (S20, survey 1, part 1), and“The radio picture is looking at thewavelengths. The infraredis looking for heat and energy. The optical image is looking atwhere there is a lot of stars together” (S16, survey 1, part 1).This misconception may have come from students’ famili-arity with the use of infrared cameras that capture thermalimages for night vision.In general, the misconceptions about the Milky Way
images at different wavelengths are summarized as radioshows its sound, infrared shows its heat and energy, andoptical shows its light and reality, as can be seen in thefollowing responses: “The radiowaves show the soundwhilethe infrared shows a heat perspective while displaying theentire MWand the optical view shows a realistic view of thegalaxy” (S82, survey 1, part 1), and “One is measuring heatand the other is looking at light” (S101, survey 1, part 1).
3. Dust in the Milky Way
The following question was asked with regard to Fig. 1,“Why do you think there is a bright horizontal band in theinfrared image where the optical image mostly looks dark?”The dark horizontal band in the optical image is produced bydust clouds in our Galaxy. When starlight meets dust it isscattered and absorbed.At visiblewavelengths the effect is sostrong that a dark band is formed in the optical image acrossthe region where the star density is actually highest. Becauseinfrared radiation has a longer wavelength than visible light,the scattering is much weaker. Therefore, infrared lightpasses through dust clouds and reaches our infrared cameras,allowing us to see the strong concentration of stars shown bythe bright band in the infrared image.Students’ interpretations of the images revealed several
misconceptions. Some believed that the dark features in theoptical image were caused by dark matter, for example, “itmay have to do with the amount of dark matter present, it isinvisible to the naked eye however dark matter gives off a lotof energy” (S5, survey 1, part 1). This appears to be a literalinterpretation of the term dark, which astronomers andphysicists use to mean invisible or unseen when referringto dark matter, and perhaps some confusion with the idea ofdark energy. However, it is an interesting idea that darkregions in the optical image look bright in the infrared imagebecause infrared cannot detect dark matter as optical does.Some students thought itwas clouds blocking theview, but
did not understand the nature or mechanism of obscurationby clouds. For example, “The infrared is picking up on lightwhereas the optical doesn’t have the same attention to detail,because there are clouds blocking the view” (S43, survey 1,part 1). Some thought that the band looked dark due to themixture of various colors: “The optical image shows thespectrum of visible colors that the eye can see. The darkimage is due to a mixture of colors that make it look dark”(S11, survey 1, part 1). This misconception appears to be
FIG. 1. The Milky Way observed at radio, infrared, and optical.Following open-ended questions were asked: These images areeach of the same part of the Milky Way made from observationsat radio, infrared and optical wavelengths. Why do you think thecolors in the radio image look much different from the ones in theinfrared or optical images?; Why do you think there is a brighthorizontal band in the infrared image where the optical imagemostly looks dark?; and, Why do you think the structures in thethree images are different?
HYUNJU LEE AND STEPHEN E. SCHNEIDER PHYS. REV. ST PHYS. EDUC. RES 11, 020101 (2015)
020101-4
linked to a preconception about mixing paint colors (sub-tractive color mixing) learned by children.Another interesting misconception with regard to Fig. 1
is that the images look different because each showsdifferent layers of the Milky Way: “The structures of theimages are different because they are each different layersof the galaxy. The optical image is the first layer, like theskin, of the galaxy. The infrared image is a layer below that,showing more of the innards of the galaxy. The radio imageis the overall form of the galaxy, without major details oranything, only showing that the galaxy as a whole is in thatshape” (S14, survey 1, part 1).Some others thought that the images look different
because of the direction from which the picture was taken,“Because of the angles and distances from where thepictures were taken” (S9, survey 1, part 1); or it was takenat different places and different times, “The Milky Waylooks different in the three images because they werephotographed from different places at different times onEarth” (S25, survey 1, part 1). These statements suggest thatthe students believe the Milky Way is so small that we havethe ability to view it from different directions, rather than anobject so vast that it is tens ofmillions of times larger than thegreatest distance any space probes have traveled.
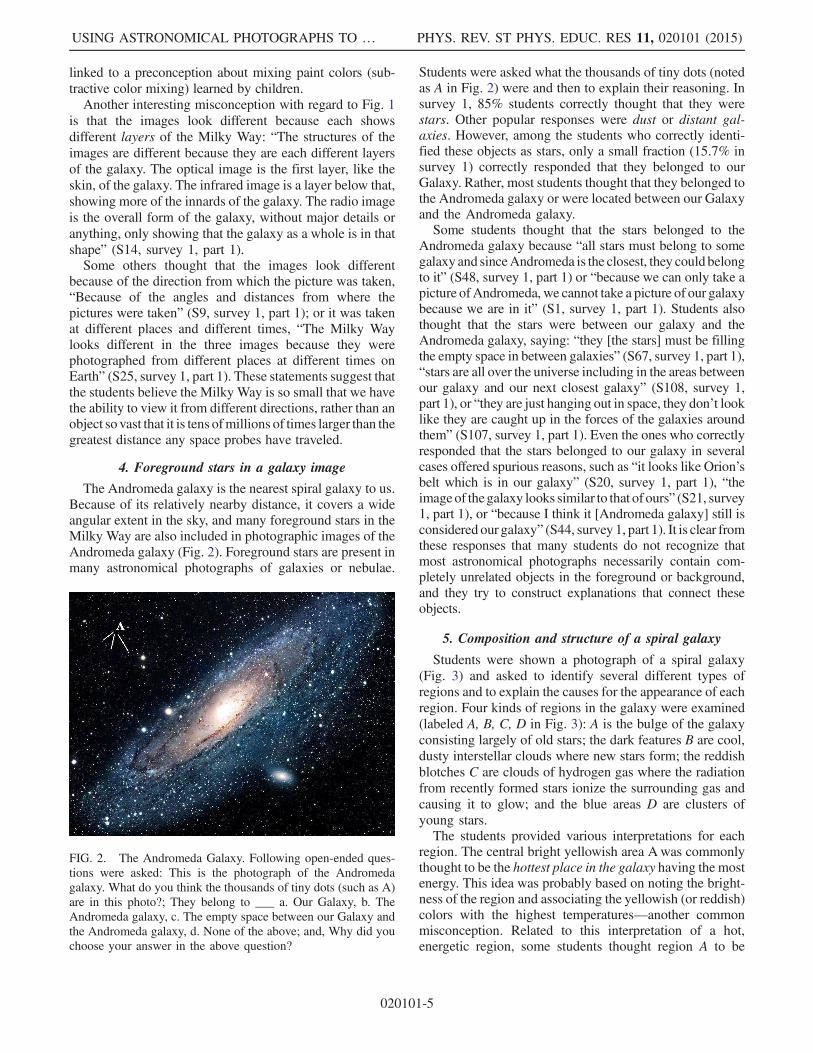
4. Foreground stars in a galaxy image
The Andromeda galaxy is the nearest spiral galaxy to us.Because of its relatively nearby distance, it covers a wideangular extent in the sky, and many foreground stars in theMilky Way are also included in photographic images of theAndromeda galaxy (Fig. 2). Foreground stars are present inmany astronomical photographs of galaxies or nebulae.
Students were asked what the thousands of tiny dots (notedas A in Fig. 2) were and then to explain their reasoning. Insurvey 1, 85% students correctly thought that they werestars. Other popular responses were dust or distant gal-axies. However, among the students who correctly identi-fied these objects as stars, only a small fraction (15.7% insurvey 1) correctly responded that they belonged to ourGalaxy. Rather, most students thought that they belonged tothe Andromeda galaxy or were located between our Galaxyand the Andromeda galaxy.Some students thought that the stars belonged to the
Andromeda galaxy because “all stars must belong to somegalaxy and sinceAndromeda is the closest, they couldbelongto it” (S48, survey 1, part 1) or “because we can only take apicture ofAndromeda, we cannot take a picture of our galaxybecause we are in it” (S1, survey 1, part 1). Students alsothought that the stars were between our galaxy and theAndromeda galaxy, saying: “they [the stars] must be fillingthe empty space in between galaxies” (S67, survey 1, part 1),“stars are all over the universe including in the areas betweenour galaxy and our next closest galaxy” (S108, survey 1,part 1), or “they are just hanging out in space, they don’t looklike they are caught up in the forces of the galaxies aroundthem” (S107, survey 1, part 1). Even the ones who correctlyresponded that the stars belonged to our galaxy in severalcases offered spurious reasons, such as “it looks like Orion’sbelt which is in our galaxy” (S20, survey 1, part 1), “theimageof thegalaxy looks similar to that of ours” (S21, survey1, part 1), or “because I think it [Andromeda galaxy] still isconsidered our galaxy” (S44, survey 1, part 1). It is clear fromthese responses that many students do not recognize thatmost astronomical photographs necessarily contain com-pletely unrelated objects in the foreground or background,and they try to construct explanations that connect theseobjects.
5. Composition and structure of a spiral galaxy
Students were shown a photograph of a spiral galaxy(Fig. 3) and asked to identify several different types ofregions and to explain the causes for the appearance of eachregion. Four kinds of regions in the galaxy were examined(labeled A, B, C, D in Fig. 3): A is the bulge of the galaxyconsisting largely of old stars; the dark features B are cool,dusty interstellar clouds where new stars form; the reddishblotches C are clouds of hydrogen gas where the radiationfrom recently formed stars ionize the surrounding gas andcausing it to glow; and the blue areas D are clusters ofyoung stars.The students provided various interpretations for each
region. The central bright yellowish area Awas commonlythought to be the hottest place in the galaxy having the mostenergy. This idea was probably based on noting the bright-ness of the region and associating the yellowish (or reddish)colors with the highest temperatures—another commonmisconception. Related to this interpretation of a hot,energetic region, some students thought region A to be
FIG. 2. The Andromeda Galaxy. Following open-ended ques-tions were asked: This is the photograph of the Andromedagalaxy. What do you think the thousands of tiny dots (such as A)are in this photo?; They belong to ___ a. Our Galaxy, b. TheAndromeda galaxy, c. The empty space between our Galaxy andthe Andromeda galaxy, d. None of the above; and, Why did youchoose your answer in the above question?
USING ASTRONOMICAL PHOTOGRAPHS TO … PHYS. REV. ST PHYS. EDUC. RES 11, 020101 (2015)
020101-5

the Sun, a massive star, the center of the solar system, dust,or gas clouds undergoing interactions, the stellar nurserywhere most new stars are born in the galaxy, or wherenumerous stars are being sucked into a black hole. The darkfeatures Bwere thought to be dark matter, black holes, voidspace, planets, or asteroids, all objects that students expectdo not emit much light, regardless of scale. The reddishblotches C were commonly thought to be red giant stars ordying stars, very bright and hot stars, solar system, flames,heat waves, or smaller galaxies. The pale blue areasDwerethought to be dust, gas clouds, water, oceans, or planets.Most of these explanations seem to rely on passing famili-arity with astronomical objects in relation to their colors, buttheir ideas are not scientifically accurate in terms of eitherthe scale of objects in the image or a physical mechanismthat could give rise to the appearance of these regions.Students were additionally asked to explain the structure
of a spiral galaxy. Most thought that the spiral structure wascreated by a strong gravitational force pulling matteraround it towards its center, such as by black holes, forexample, “Because the gravity of the black hole in thecenter of the galaxy is pulling everything toward it” (S96,survey 1, part 1). While their ideas about gravitationalattraction are partly on the right track, there seems to be anunderlying notion that the overall spiral structure arisesfrom a rapid swirling motion of matter into a central blackhole expressed most clearly as follows: “Its image is a spiralso given whatever is in the middle of the structure, it issimilar to that of a drain, it is sucking all things around it
into its center creating the image shown” (S5, survey 1,part 1).The student’s reasoning seems to be recalled from their
prior experience of seeing the spiral pattern in drainingwater, or perhaps even textbooks or simulations showingthe spiraling pattern of gas outside a black hole. While it iscorrect that there is a massive black hole at the center oflarge galaxies, it is not the reason for the spiral arms whichoccur over a vastly larger scale. Spiral arms are generallyproduced by gravitational interactions between orbitingstars and interstellar clouds or with another galaxy.
6. Elliptical galaxies and spiral galaxies
Students were shown images of the two major types ofgalaxies (Fig. 4) and asked to explain the reasons for thedifference of colors and shapes. Type A in the figure is anelliptical galaxy and looks yellow because it mostlyconsists of old stars. On the other hand, type B is a spiralgalaxy and its spiral arms look blue because of hot, youngstars. Although elliptical galaxies consist of mostly oldstars, it does not mean that they are actually older thanspiral galaxies. Rather, most elliptical galaxies have usedup or lost their interstellar gas due to collisions with othergalaxies, so they can no longer form new stars—whichinclude the short-lived, very luminous blue stars. Bothelliptical and spiral galaxies are believed to have massiveblack holes at their centers, although these are not detect-able except through detailed analysis of orbital velocitiesnear the very center of the galaxy.Several misconceptions were found about the different
colors and structures of the galaxies. One of the commonmisconceptions was that the galaxies looked differentbecause they were in different stages of their life. Thisis actually what many astronomers, including EdwinHubble, believed in the early 1900s when they beganmaking some of the first deep photographs of galaxies.Today the appearance of a galaxy and changes to it areunderstood to result in a complex way from the history ofinteractions and mergers with other galaxies. The shape andtype may change as a result of these interactions.
FIG. 4. Elliptical galaxy (type A) and Spiral galaxy (type B).Following open-ended questions were asked: The photographsshow two different types of galaxy. Why do you think their colorslook different?; and,Why do you think they have different shapes?
FIG. 3. Spiral Galaxy. Following open-ended questions wereasked: This is a galaxy imaged by the Hubble Space Telescope.What is theyellowishareaAin thephoto?Whatcauses it tohave thisappearance?; What are the dark features B? What causes them tohave this appearance?; What are the reddish blotches C? Whatcauses them to have this appearance?;What are the pale blue areasD?What causes them to have this appearance?; and, In the galaxyimage, why do you think this object has the structure it does?
HYUNJU LEE AND STEPHEN E. SCHNEIDER PHYS. REV. ST PHYS. EDUC. RES 11, 020101 (2015)
020101-6

Other common misconceptions about the difference intheir appearance were that it was a matter of distance, forexample, type A is closer and type B is further; that it was amatter of the existence of a black hole at its center, forexample, type B has a black hole causing its spiral arms buttype A does not have it; or that it was because they weredifferent objects, for example, type A was actually a starwhile type B was a galaxy. Some thought that the imageshad different colors because of the way the photograph wastaken: with different cameras, lenses, or filters, or becauseof the angle at which the galaxy was viewed.Another interesting misconception was that the colors
were interpreted as spectrally redshifted or blueshifted,with the type A galaxy moving away and the type B galaxycoming toward us: “The object type A is moving away fromus causing a longer wavelength towards the red side of thecolor spectrum whereas in type B the object is movingtowards us causing shorter wavelengths giving it the colorof the blue side of the color spectrum” (S71, survey 1,part 2).This confusion appears to have arisen as students
grappled with the idea of Doppler shift, illustrating howstudents actively seek to construct an understanding ofnew ideas with their prior knowledge. As we will examinenext, interpreting spectra also introduced a variety of othermisconceptions.
7. Spectra
It is essential to understand spectra in order to compre-hend how astronomers derive information about elements,temperatures, distances, and motions of galaxies. Studentshad a general understanding about the functions of spectra,but they showed a variety of misconceptions in theirinterpretation. For example, one question asked aboutthe difference between spectra (a) and (b) in Fig. 5. Thisquestion probes the concept of redshift, with the spectrallines shifted to longer (redder) wavelengths because themore-distant galaxy (b) is moving away from us faster.However, many students incorrectly thought the spectraindicated that the objects had different temperature,contained different elements, or had different ages.
8. Distances of galaxies based upon spectra.
An image of several hypothetical galaxy spectra (Fig. 6)was given to students with the information that the spectrawere obtained from four different galaxies. The studentswere asked whether or not they could arrange the distancesof the galaxies from us with the information seen in thespectra, and why or why not. The astronomical explanationis that the farther the galaxy, the faster it is moving awayfrom us, therefore the more its spectral lines are redshifted.So the galaxy that has the least redshift to its lines is theclosest to us and the galaxy that has the most redshift is thefarthest from us. Therefore, the correct answer is (b-c-d-a),from closest to farthest.Students who responded that the distances could not be
arranged with the given information mostly thought thatspectra were only used to understand an object’s compo-sition, for example, “No, these are to tell what kind ofmaterials are in them, not distance” (S23, survey 1, part 2).Although many students responded that the spectra
could be used to tell the relative distances of galaxiesand correctly arranged the distance, their reasoning showedseveral misconceptions in the interpretation of the spectra.For example, they thought that the number of absorptionlines and their widths are related to the galaxy’s distance:“b-c-d-a, more black lines and wider they are, the furtheraway they are” (S98, survey 1, part 2). In addition, manystudents seemed to correctly arrange the distances bysimple guesswork, choosing the one that started the lineclosest to the left edge of the spectrum and so on, “b-c-d-a,when the lines start to closer to the beginning of the line
FIG. 6. Spectra: Distance of galaxies. Following open-endedquestion was asked: These are spectra that were obtained fromfour different galaxies. Do you think with these spectra imagesyou can arrange them by distances from nearest to furthest fromus? If so, please do so and explain why you arranged them in sucha way. If not, please explain why you can not do with theseimages.
FIG. 5. Spectra: Red-shift. Following open-ended question wasasked: (a) is the spectrum that was obtained looking at a nearbygalaxy. (b) is the spectrum that was obtained from a distantgalaxy. What explains the difference between spectrum (a) andspectrum (b)?
USING ASTRONOMICAL PHOTOGRAPHS TO … PHYS. REV. ST PHYS. EDUC. RES 11, 020101 (2015)
020101-7

spectra the closer the galaxy” (S118, survey 1, part 2). Afew students referred to brightness of the spectra inconsidering the distance to the galaxies, “I’m guessingthat you can tell how far they are by seeing their brightnessfrom these spectra” (S49, survey 1, part 2); or number ofabsorption lines in the red part of spectra, “the closer thegalaxy the hotter it will be and the more absorption wouldoccur in the red zone” (S50, survey 1, part 2).
9. Temperatures from spectra
To further understand the students’ interpretation ofspectra, spectra and wavelength-intensity graphs ofthree different stars (Fig. 7) were presented with aquestion asking about their relative temperature. In nature,the hotter the star, the higher the intensity it will have atshorter wavelength (brighter at the blue end of a visible lightspectrum), therefore (a) is the hottest while (b) is the coolest.Some students thought that the star (c) had the highest
temperature because it has a high intensity most uniformlyacross the spectrum. Some students thought that the star (b)was the hottest because it has more fluctuations on theintensity graph representing more activity, because it hasmore absorption lines in certain parts of the spectrum thanthe others, or because its intensity graph is higher in thered part of the spectrum. The last one concurs with thepreviously reported misconception, which studentsbelieved blue as indicating low temperature and red asindicating high temperature [38].
B. Concept questions
So far, we have reported misconceptions found in survey1 and survey 2 that were common to the students.Additional misconceptions were found in the surveys thatwere unique to one or a small number of students. Thequestions and their answer choices on survey 3 were allconstructed from the students’ responses from survey 1and survey 2. In other words, misconceptions that werecommonly found among the students became the choices ofthe concept questions.The questions basically ask about 12 concepts relating
to galaxies and spectra (Table I). The mean scores of thestudents’ performance on the survey 3were 12.4 for the classA and 9.2 for the class B. The distribution of their scoresshowed a similar bell shapewith peaked at the range of 6–10between the two classes (Fig. 8). Although the students tookthe survey at the end of the semester after the instructions,their performances were mostly in the range of low scores.Considering the pure guessing score of the survey is 8.9 thatwould be achieved purely by chance, their performance onthe survey is generally quite low.Popular misconceptions were still observed among many
students and their tendency was similar between the twoclasses. Among the 38 questions, 30 questions had theproportional similarity larger than 0.8 between the twoclasses where the survey was administered. The lowestproportional similarity was 0.691 and it was the onlyquestion that was lower than 0.7. On average for all 38questions, the proportional similarity between the twoclasses was 0.844, which indicates that the percentagesof students who chose certain misconceptions are similar inboth classes, even though the students were drawn fromdifferent classes taught by different instructors. The sim-ilarity of incorrect answers between the two classessuggests that they are founded on common preconceptionsthat lead to persistent misconceptions and these
FIG. 7. Spectra: Stellar temperature. Following open-endedquestion was asked: These are spectra that were obtained fromthree different stars in our galaxy. Do you think with these spectraimages you can arrange them by temperature from hottest tocoolest? If so, please do so and explain the reason why youarranged them in such a way. If not, please explain why you cannot do with these images.
TABLE I. Topics of concept questions.
Question number Concepts
Q1, Q2, Q3, Q4 Fundamental characteristics of lightQ5, Q6, Q7, Q8, Q13 Radio waves and infraredQ9, Q10, Q11, Q12 Compositions of a spiral galaxyQ14 Foreground starsQ15, Q16, Q17, Q18,Q19, Q20
Galaxies on the Hubble DeepField image
Q21,Q22, Q23, Q24 Elliptical vs spiral galaxiesQ25, Q26, Q27 Composition of spiral arms and the
movement of disk stars of aspiral galaxy
Q28, Q29, Q34 Spectra: IntensityQ30, Q31 Spectra: Broadening effectQ32, Q33, Q35 Spectra: Distance of galaxies
& Hubble’s lawQ36, Q37 Milky Way observed on EarthQ38 Gravitational lensing
HYUNJU LEE AND STEPHEN E. SCHNEIDER PHYS. REV. ST PHYS. EDUC. RES 11, 020101 (2015)
020101-8

misconceptions may be generally common among studentseven after taking an introductory astronomy course.
C. Conclusions
This study investigated college students’misconceptionsabout galaxies and spectra with the use of astronomicalphotographs and spectral images and developed a set ofmultiple-choice concept questions. Some examples ofmisconceptions found in this study are radio waves aresound, and travel slower than optical light; infraredmeans heat; the horizontal band of the Milky Way looksdark in the optical image due to its dark matter; thespiral structure of a spiral galaxy is due to a stronggravitational force at the center, and it is created by a blackhole; and different colors between elliptical galaxies andspiral galaxies are because of one being redshifted and theother blueshifted. Students also believed that the fore-ground stars taken in the photograph of the Andromedagalaxy belonged to the Andromeda, not to our galaxy;misinterpreted colors of objects and the compositions of agalaxy on the photograph, and misunderstood the infor-mation that spectral images represent in regard to itsabsorption lines and strength. Based on the findings wedeveloped 38 concept questions, whose answer choiceswere all constructed from the common misconceptionsand that would be useful in introductory astronomycourses.See the Supplemental Material at [39] for the set of
developed concept questions.
V. DISCUSSION AND IMPLICATIONSOF THE STUDY
In general, introductory astronomy courses are popularand they are often large, with more than a hundred students.Very few of the students we surveyed had receivedinstruction in astronomy in middle or high school, andfor most students the introductory course at college was
their first astronomy class. Therefore, they had not hadmuch opportunity to learn astronomy in a formal setting,although they certainly had seen images of galaxies andspectra and had developed some preconceptions beforetaking the course. Even after instruction, many preconcep-tions persisted as misconceptions, and this may reflect thatthe students had little opportunity to understand the contextof objects that they were presented in such a way on thephotographs. However, it is still not clear why studentscreated such misconceptions and it remains as ourfuture work.Misconceptions, when instructors recognize them in a
timely manner, can be a good starting point for organizinginstructional approaches to help overcome students’ con-fusion and provide them with proper foundations. Becauseof the high number of students in many introductoryastronomy courses, however, it is often difficult to recog-nize and address students’ preconceptions. Moreover, littlehas been studied about misconceptions of more advancedtopics such as galaxies and spectra. Therefore, the conceptquestions constructed from common misconceptions foundin this study should prove useful in introductory astronomycourses that explore these topics. This type of question isnot only helpful for instructors to recognize students’misconceptions, but they also can be used with CRSs orother techniques to directly address the points of confusionduring class and to help the students construct a betterfoundational understanding. Therefore, it is more useful touse these questions for the purpose of formative assessmentthan of summative assessment that simply checks students’knowledge. It is desirable that instructors present thequestions, give students time to think as a small group(or individually), and receive their answer choices withtheir own explanations. Then, instructors facilitate wholeclassroom discussion where students can share their variousideas. In that way instructors have opportunities to hearstudents’ reasoning and find the gap between their teachingand the students’ understanding. This also helps students
FIG. 8. Students’ performance on the Survey 3 at two introductory astronomy courses.
USING ASTRONOMICAL PHOTOGRAPHS TO … PHYS. REV. ST PHYS. EDUC. RES 11, 020101 (2015)
020101-9

learn from different perspectives and develop their thinkingto become sound reasoning. This can be done without theuse of CRSs, but it is certainly a good assist for instructorsto manage classroom discussion as well as for students tobe much engaged in discussion when using CRSs through-out the process.Developing good concept questions is challenging [40],
but they are useful when employed with CRSs for thepurpose of formative assessment in classroom discussion.CRSs are particularly useful in a large class becauseotherwise it is difficult to engage every student. This papersuggests one way of developing concept questions byinvestigating common misconceptions among students ina large class by first gathering open-ended writtenresponses from the students; second, categorizing theminto several themes of misconceptions and measuring thestrength of each misconception with two-tier questions thatconsist of multiple-choice and follow-up open-ended ques-tions that do not limit students to choose only one answer;and, finally, modifying and tightening the concept ques-tions to be as scientifically rigorous as possible whileremaining appropriate for the level of the course by havingreviews from colleagues who are experienced at teachingintroductory astronomy.
Finally, we offer some remarks about the use of photo-graphs and visual data in science education. This studyshowed that a variety of misconceptions were identified inthe interpretation of photographs. In astronomy, photo-graphs contain important data for scientific research, sohelping students analyze and interpret visual data is acritical part of their education. At the same time, it is clearthat students approach scientific images with a variety ofpreconceived ideas about how to interpret them. Therefore,it is essential that we understand how students interpretthese visual data so we can find better ways of providinginstruction to improve students’ learning in astronomy.Photographs and their interpretation should be examinedmore thoroughly in studies of student learning in scienceclasses, especially in astronomy.
ACKNOWLEDGMENTS
This work is supported by NASA HST Education andPublic Outreach Grant No. HST-EO-12198.04. We thankProfessor Daniela Calzetti and Professor Jessica Rosenbergfor their reviews and comments about the concept ques-tions. We also thank Professor Kathleen Davis for heradvice in research. Most of all, we thank the participatingcollege students.
[1] R. Driver and B. Bell, Students’ thinking and the learningof science: A constructivist view, Sch. Sci. Rev. 67, 443(1986).
[2] J. Clement, Using bridging analogies and anchoringintuitions to deal with students’ preconceptions in physics,J. Res. Sci. Teach. 30, 1241 (1993).
[3] J. M. Bailey and T. F. Slater, A review of astronomyeducation research, Astron. Educ. Rev. 2, 20 (2004).
[4] J. Nussbaum and J. D. Novak, An assessment of children’sconcepts of the earth utilizing structured interviews, Sci.Educ. 60, 535 (1976).
[5] J. Baxter, Children’s understanding of familiar astronomi-cal events, Int. J. Sci. Educ. 11, 502 (1989).
[6] J. Dunlop, How children observe the universe, Pub. Astron.Soc. Aust. 17, 194 (2000).
[7] S. Vosniadou, Capturing and modeling the process ofconceptual change, Learn. Instr. 4, 45 (1994).
[8] R. K. Atwood and V. A. Atwood, Preservice elementaryteachers’ conceptions of the cause of seasons, J. Res. Sci.Teach. 33, 553 (1996).
[9] M. Schneps and P. Sadler, A Private Universe, CDproduced by the Harvard Smithsonian Center forAstrophysics, funded by the National Science Foundationand Annenberg/CPB (1998).
[10] T. M. Fanetti, Master’s thesis, Iowa State University, Ames,2001.
[11] A. Lelliott and M. Rollnick, Big ideas: A review ofastronomy education research 1974–2008, Int. J. Sci. Educ.32, 1771 (2010).
[12] E. E. Prather, T. F. Slater, J. P. Adams, and G. Brissenden,Lecture-Tutorials for Introductory Astronomy, 3rd ed.(Addison-Wesley, Boston, 2012).
[13] E. E. Prather, T. F. Slater, and E. G. Offerdahl, Hints of afundamental misconception in cosmology, Astron. Educ.Rev. 1, 28 (2002).
[14] C. S. Wallace, E. E. Prather, and E. K. Duncan, A study ofgeneral education astronomy students’ understandings ofcosmology. Part V. The effects of a new suite of cosmologyleture-tutorials on students’ conceptual knowledge, Int. J.Sci. Educ. 34, 1297 (2012).
[15] L. L. Pozzer and W.-M. Roth, Prevalence, function, andstructure of photographs in high school biology textbooks,J. Res. Sci. Teach. 40, 1089 (2003).
[16] L. Pozzer-Ardenghi and W.-M. Roth, Making sense ofphotographs, Sci. Educ. 89, 219 (2005).
[17] H. Eshach, Using photographs to probe students’ under-standing of physical concepts: The case of Newton’s 3rdlaw, Res. Sci. Educ. 40, 589 (2010).
[18] J. K.Gilbert, Visualization: An emergent field of practice andenquiry in science education, in Visualization: Theory andPractice in Science Education, edited by J. K. Gilbert, M.Reinber, and M. Nakhleh (Springer, New York, 2008), p. 3.
HYUNJU LEE AND STEPHEN E. SCHNEIDER PHYS. REV. ST PHYS. EDUC. RES 11, 020101 (2015)
020101-10

[19] A. Feldman and B. Capobianco, Teacher learning oftechnology enhanced formative assessment, J. Sci. Educ.Technol. 17, 82 (2008).
[20] I. D. Beatty, Transforming students learning with class-room communication systems, Educause Center forApplied Research. Retrieved from http://arxiv.org/abs/physics/0508129 (2004).
[21] I. D. Beatty and W. J. Gerace, Technology-enhancedformative assessment pedagogy for teaching science withclassroom response technology, J. Sci. Educ. Technol. 18,146 (2009).
[22] E. Mazur, Peer Instruction: A User’s Manual (Prentice-Hall, Upper Saddle River, NJ, 1997).
[23] D. Hestenes, M. Wells, and G. Swackhamer, Force conceptinventory, Phys. Teach. 30, 141 (1992).
[24] A. Lightman and P. Sadler, Teacher predictions versusactual student gains, Phys. Teach. 31, 162 (1993).
[25] A. L.OdomandL. H.Barrow,Development and applicationof a two-tier diagnostic test measuring college biologystudents’ understanding of diffusion and osmosis aftera course of instruction, J. Res. Sci. Teach. 32, 45 (1995).
[26] A. A. Russell, A rationally designed general chemistrydiagnostic test, J. Chem. Educ. 71, 314 (1994).
[27] D. F. Treagust, Development and use of diagnostic tests toevaluate students’ misconceptions in science, Int. J. Sci.Educ. 10, 159 (1988).
[28] J. H. Wandersee, J. J. Mintzes, and J. D. Novak, Researchon Alternative Conceptions in Science, in Handbook ofResearch of Science Teaching and Learning, edited byD. L. Gabel (Macmillan Publishing, New York, NY, 1994),p. 177.
[29] J. Adams, R. L. Adrian, C. Brick, G. Brissenden, G.Deming, B. Hufnagel, T. Slater, and M. Zeilik, AstronomyDiagnostic Test. An electronic version is available at http://solar.physics.montana.edu/aae/adt/ (1999).
[30] E. M. Bardar, E. E. Prather, K. Brecher, and T. F. Slater,Development and validation of the light and spectroscopyconcept inventory, Astron. Educ. Rev. 5, 103 (2007).
[31] J. M. Bailey, Development of a concept inventory to assessstudents’ understanding and reasoning difficulties aboutthe properties and formation of stars, Astron. Educ. Rev. 6,133 (2008).
[32] P. Green, Peer Instruction for Astronomy (PearsonEducation, Upper Saddle River, NY, 2003).
[33] V. Huhta, Evaluation of different similarity indicesas measures of succession in arthropod communitiesof the forest floor after clear-cutting, Oecologia 41, 11(1979).
[34] O. Renkonen, Statistisch-ökologische Untersuchungenüber die terrestrische Käferwelt der finnischenBruchmoore,Doctoral dissertation, Societas zoological-botanica Fenn-ica Vanamo (1938).
[35] J. Vegelius, S. Janson, and F. Johansson, Measures ofsimilarity between distributions, Quality and Quantity 20,437 (1986).
[36] M. Zeilik, C. Schau, and N. Mattern, Misconceptions andtheir change in university-level astronomy courses, Phys.Teach. 36, 104 (1998).
[37] H. Lee, Misconceptions University Students have inAstronomy, Proceeding paper presented at the annualinternational meeting of National Association of Researchin Science Teaching, Baltimore, MD, retrieved from https://www.narst.org/annualconference/annualprogram08_final.pdf.
[38] X. C. Cid, R. E. Lopez, and S. M. Lazarus, Issues regardingstudent interpretation of color as a third dimension ongraphical representations, J. Geosci. Educ. 57, 372 (2009).
[39] See Supplemental Material at http://link.aps.org/supplemental/10.1103/PhysRevSTPER.11.020101 for thefinal set of the concept questions developed in this study.
[40] H. Lee, A. Feldman, and I. D. Beatty, Factors that affectscience and mathematics teachers’ initial implementationof technology-enhanced formative assessment using aclassroom response system, J. Sci. Educ. Technol. 21,523 (2012).
USING ASTRONOMICAL PHOTOGRAPHS TO … PHYS. REV. ST PHYS. EDUC. RES 11, 020101 (2015)
020101-11