Embed Size (px)
Citation preview

40 NEW ZEALAND JOURNAL OF ECOLOGY, VOL. 33, NO. 1, 2009
New Zealand Journal of Ecology (2009) 33(1): 40-51 ©New Zealand Ecological Society
Available on-line at: http://www.newzealandecology.org/nzje/
Using artificial nests to predict nest survival at reintroduction sites
Rebecca M. Lewis1,2*, Doug P. Armstrong1, Michael K. Joy1, Yvan Richard1, Don Ravine3, Åsa Berggren1 and Rebecca L. Boulton1
1Wildlife Ecology Group, Institute of Natural Resources, Massey University, Private Bag 11 222, Palmerston North 5320, New Zealand2Current address: Department of Conservation, PO Box 11010, Palmerston North, New Zealand3Department of Conservation, PO Box 11010, Palmerston North, New Zealand*Author for correspondence (Email: [email protected])
Published on-line: 12 March 2009
___________________________________________________________________________________________________________________________________
Abstract: Artificial nests are frequently used to assess factors affecting survival of natural bird nests. We tested the potential for artificial nests to be used in a novel application, the prediction of nest predation rates at potential reintroduction sites where exotic predators are being controlled. We collected artificial nest data from nine sites with different predator control regimes around the North Island of New Zealand, and compared the nest survival rates with those of North Island robin (Petroica longipes) nests at the same sites. Most of the robin populations had been reintroduced in the last 10 years, and were known to vary in nest survival and status (increasing/stable or declining). We derived estimates of robin nest survival for each site based on Stanley estimates of daily survival probabilities and the known incubation and brooding periods of robins. Estimates of artificial nest survival for each site were derived using the known fate model in MARK. We identified the imprints on the clay eggs in the artificial nests, and obtained different estimates of artificial nest survival based on imprints made by different potential predators. We then compared the value of these estimates for predicting natural nest survival, assuming a relationship of the form s = αpβ, where s is natural nest survival and p is artificial nest survival. Artificial nest survival estimates based on imprints made by rats (Rattus spp.) and brushtail possums (Trichosurus vulpecula) were clearly the best predictors (based on AICc), and explained 64% of the variation in robin nest survival among sites. Inclusion of bird imprints in the artificial nest survival estimates substantially reduced their predictive value. We suggest that artificial nests may provide a useful tool for predicting the suitability of potential reintroduction sites for New Zealand forest birds as long as imprints on clay eggs are correctly identified.___________________________________________________________________________________________________________________________________
Keywords: nest predation; North Island robin; predator control; survival modelling
IntroductionArtificial nests have been used in over 400 studies (Moore & Robinson 2004), the earliest dating back to the 1960s (Matschke 1965; Henry 1969). Most of these studies used artificial nests to assess potential factors affecting survival of natural bird nests. These factors include edge effects and habitat fragmentation (Lahti 2001; Chalfoun et al. 2002a,b; Batáry & Báldi 2004) nest sites (Martin 1993a,b; Wada 1994; Sloan et al. 1998), or vegetation characteristics (Dion et al. 2000; Schneider 2001; Stuart-Smith & Hayes 2003; Batáry & Báldi 2004). In contrast to natural nests, artificial nests are amenable to experimental manipulation (Villard & Pärt 2004), and can be made in large quantities to facilitate statistical inference (Major & Kendal 1996). Use of artificial nests avoids the huge time commitment needed to search for natural nests, avoids biases involved in detection of natural nests (Martin & Geupel 1993),
and avoids predators being attracted to natural nests by human activity (Tryjanowski & Kuzniak 1999; Gutzwiller et al. 2002). Imprints on clay eggs used in artificial nests also provide a more reliable method of identifying nest predators than signs left at natural nests (Major 1991; Marini & Melo 1998; Larivière 1999).
A potential problem with artificial nest studies is that the results obtained may not reflect patterns in natural bird nests (Loiselle & Hoppes 1983; Wilcove 1985; Willebrand & Marcström 1988; Paton 1994; Reitsma & Whelan 2000). Studies comparing natural and artificial nests have produced disparate results, with some studies strongly supporting the reliability of the technique and others rejecting it (Moore & Robinson 2004). At least part of this disparity may be due to variation in methodology, as results have been shown to be affected by nest construction materials (Martin 1987; Møller, 1987; Martin & Roper 1988; Major & Kendal 1996; Rangen et al. 2000) and by

41LEWIS ET AL.: PREDICTING NEST SURVIVAL
placement and concealment of nests (Janzen 1978; Martin 1987; Yahner & Cypher 1987; Yahner et al. 1989) resulting in overestimation of the role of particular predators (Storaas 1988; Willebrand & Marcström 1988). Different results might also potentially be obtained with real and artificial eggs due to differences in olfactory cues (Whelan et al. 1994; Rangen et al. 2000). Reliability of artificial nest results can be improved by mimicking natural materials and nest placement as closely as possible (Moore & Robinson 2004). Thus it remains necessary to test the reliability of artificial nests in any new situation where they are being used.
Here we investigate the potential for artificial nests to be used in a novel application, the prediction of nest predation rates at potential reintroduction sites. Nest predation by exotic mammals has played a key role in declines of New Zealand bird species (James & Clout 1996; Innes et al. 1999, Moorhouse et al. 2003), hence predator control is often a prerequisite to reintroduction (Armstrong & McLean 1995). If predators have been reduced at a site, but not eradicated, some index is needed to assess whether the reduction is sufficient to allow successful reintroduction of a particular species. The standard procedure in New Zealand is to use baited footprint tracking tunnels to index activity of rodents and mustelids, and proceed with reintroduction if tracking rates are below some ad hoc limit. Attacks on artificial nests potentially provide a more meaningful index, because the attacks may closely mimic natural nest predation processes and therefore can be used to predict nest survival following reintroduction. Although tracking rates can also be used to predict changes in nest survival at a site (Armstrong et al. 2006a), tracking rates are strongly influenced by habitat so are difficult to compare among sites (Blackwell et al. 2002). For example, because tracking tunnels are normally placed on the ground, variation in tracking rates among sites may reflect differences in the amount of time predators spend on the ground rather than differences in the level of threat to nesting birds. Because artificial nests are designed to directly assess threat to nesting birds, the reliability of the index should be less confounded by habitat differences. However, we recognise that, used in tandem, these methods would provide a year-round indication of nest success rather than just through the breeding season when artificial nests are best utilised.
Testing the reliability of artificial nests to predict nest survival among sites requires a different design from those normally used in artificial nest studies. Some previous studies comparing natural and artificial nest survival have been conducted on a single site, allowing potential confounding factors to be minimised (Ortega et al. 1998; Mezquida & Marone 2003). In contrast, tests of intersite reliability must deliberately incorporate variability
that could confound intersite comparisons. Sources of variability could include intersite differences in climate, topography, habitat structure, size of habitat fragment, and management or other land use. The number of sites studied must therefore be large enough to incorporate this variability, and to allow nest sites to be treated as units of replication.
We collected artificial nest data from nine sites around the North Island of New Zealand, and compared the nest survival rates to those of North Island robin (Petroica longipes1) nests at the same sites. We aimed to: (1) obtain estimates of artificial nest survival based on marks made by different potential predator species; (2) model the relationship between survival of artificial and natural nests based on each set of estimates; (3) obtain the most parsimonious model for predicting nest survival of North Island robins at a site based on artificial nest data; and (4) quantify the uncertainty around the artificial–natural nest survivorship relationship.
MethodsStudy areaNine sites encompassed the original geographic range of the North Island robin (Table 1). Robins had naturally persisted at two of the sites, Waimanoa and Waipapa, which are near the centre of the North Island, and had been reintroduced to the seven other sites. Two sites have had mammalian predators eradicated, and have barriers against reinvasion (Tiritiri Matangi Island and the predator-fenced Karori Sanctuary). The other sites have a suite of exotic mammalian predators including ship rats (Rattus rattus), brushtail possums (Trichosurus vulpecula), stoats (Mustela erminea) and domestic cats (Felis catus), all of which prey on arboreal birds’ nests (Dilks et al. 1996; Brown et al. 1998; Innes et al. 1999; Woods et al. 2003). All sites other than Tiritiri Matangi have house mice (Mus musculus), but these are not known to prey on North Island robin nests. Predator control had been instigated at all of these sites, but had been discontinued at three sites at the time of our study and appeared to be ineffective at one site (Table 1). Nest survival was therefore expected to vary substantially among the nine sites. All sites had broadleaved or broadleaved–podocarp forest; however, the amount and structure of forest varied, with two sites having forest fragments of 0.1 to 25 ha, and the others having continuous forest blocks of at least 80 ha. Sites also varied in age and species composition of the forest, and had climatic differences associated with geographical location (northern sites warmer and eastern sites drier).
___________________________________________________________________________________________________________________________________1 It was formerly considered a subspecies of the New Zealand robin along with the South Island robin (P. australis), but Holdaway et al. (2001) classified these as separate species.
42 NEW ZEALAND JOURNAL OF ECOLOGY, VOL. 33, NO. 1, 2009
Model speciesNorth Island robins are the first species being reintroduced as part of mainland restoration programmes in New Zealand, and have already been reintroduced to 15 different mainland locations with predator control (Armstrong 2000, http://www.massey.ac.nz/~darmstro/nz_projects.htm). They were therefore the obvious model species to assess the reliability of artificial nests for predicting nest survival at reintroduction sites. In addition, methods for monitoring and modelling nest survival of robins had been developed prior to the study (Armstrong & Ewen 2002; Armstrong et al. 2002).
The North Island robin is a small (26–32 g) insectivorous forest passerine in the family Petroicidae. Robins lay clutches of 2–3 eggs in cup nests, which are usually built in tree forks or branches 2–20 m from the ground (Armstrong et al. 2000). Robin nests are known to be preyed on by ship rats (Brown et al. 1998), stoats (N. McArthur, pers. comm.), and the native morepork owl (Ninox novaeseelandiae) (Brown et al. 1998). They may have multiple nesting attempts over their breeding season, which extends from September to February.
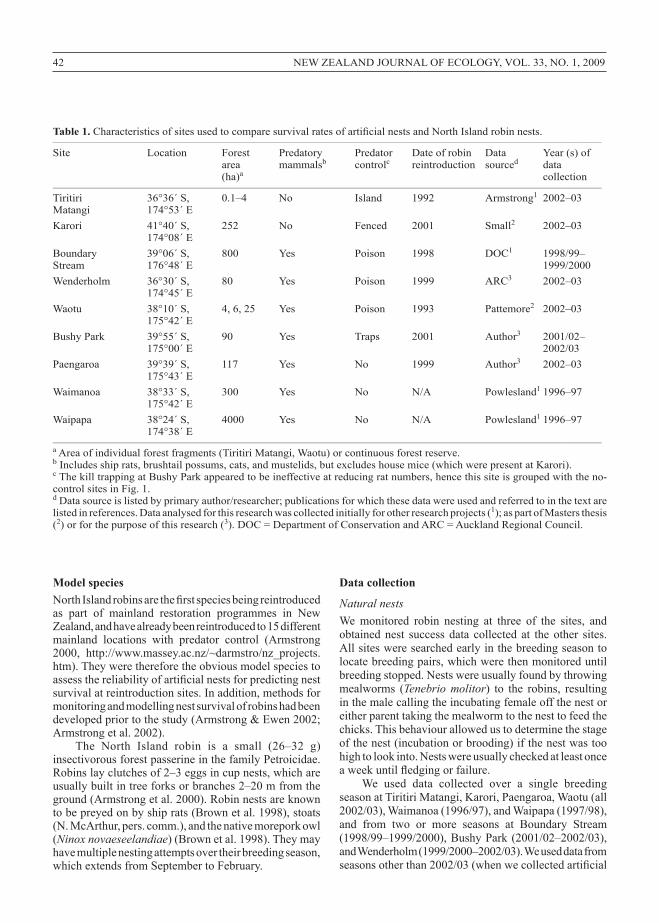
Table 1. Characteristics of sites used to compare survival rates of artificial nests and North Island robin nests.___________________________________________________________________________________________________________________________________
Site Location Forest Predatory Predator Date of robin Data Year (s) of area mammalsb controlc reintroduction sourced data (ha)a collection___________________________________________________________________________________________________________________________________
Tiritiri 36°36´ S, 0.1–4 No Island 1992 Armstrong1 2002–03 Matangi 174°53´ EKarori 41°40´ S, 252 No Fenced 2001 Small2 2002–03 174°08´ EBoundary 39°06´ S, 800 Yes Poison 1998 DOC1 1998/99– Stream 176°48´ E 1999/2000Wenderholm 36°30´ S, 80 Yes Poison 1999 ARC3 2002–03 174°45´ EWaotu 38°10´ S, 4, 6, 25 Yes Poison 1993 Pattemore2 2002–03 175°42´ EBushy Park 39°55´ S, 90 Yes Traps 2001 Author3 2001/02– 175°00´ E 2002/03Paengaroa 39°39´ S, 117 Yes No 1999 Author3 2002–03 175°43´ EWaimanoa 38°33´ S, 300 Yes No N/A Powlesland1 1996–97 175°42´ EWaipapa 38°24´ S, 4000 Yes No N/A Powlesland1 1996–97 174°38´ E___________________________________________________________________________________________________________________________________a Area of individual forest fragments (Tiritiri Matangi, Waotu) or continuous forest reserve.b Includes ship rats, brushtail possums, cats, and mustelids, but excludes house mice (which were present at Karori).c The kill trapping at Bushy Park appeared to be ineffective at reducing rat numbers, hence this site is grouped with the no-control sites in Fig. 1.d Data source is listed by primary author/researcher; publications for which these data were used and referred to in the text are listed in references. Data analysed for this research was collected initially for other research projects (1); as part of Masters thesis (2) or for the purpose of this research (3). DOC = Department of Conservation and ARC = Auckland Regional Council.
Data collection
Natural nestsWe monitored robin nesting at three of the sites, and obtained nest success data collected at the other sites. All sites were searched early in the breeding season to locate breeding pairs, which were then monitored until breeding stopped. Nests were usually found by throwing mealworms (Tenebrio molitor) to the robins, resulting in the male calling the incubating female off the nest or either parent taking the mealworm to the nest to feed the chicks. This behaviour allowed us to determine the stage of the nest (incubation or brooding) if the nest was too high to look into. Nests were usually checked at least once a week until fledging or failure.
We used data collected over a single breeding season at Tiritiri Matangi, Karori, Paengaroa, Waotu (all 2002/03), Waimanoa (1996/97), and Waipapa (1997/98), and from two or more seasons at Boundary Stream (1998/99–1999/2000), Bushy Park (2001/02–2002/03), and Wenderholm (1999/2000–2002/03). We used data from seasons other than 2002/03 (when we collected artificial
43LEWIS ET AL.: PREDICTING NEST SURVIVAL
nest data) if no data were available for that season or if the sample size was small. However, we excluded data if the predator control regime was not identical to that in place in 2002/03 or data showed significant variation between years.
Artificial nestsWe put 30 artificial nests out at each site early in the 2002/03 breeding season, and left them for up to 4 weeks (sites were chosen on the basis that they were similar to natural nest sites). We then repeated this procedure during the middle and late stages of the breeding season, with a 3-week interval between each exposure period. We moved the nests 10 m on each occasion, both to simulate the behaviour of robins and to avoid creating tracks that would lead predators to nests (Yahner & Mahan 1999; Buler & Hamilton 2000). We attached nests 1.5 m from the ground in locations that were as realistic as possible, and spaced them at 75-m intervals along transects (large reserves) or in grids (small reserves). This spacing was based on robin territory sizes on Tiritiri Matangi (Armstrong & Ewen 2002). We designed the artificial nests to resemble North Island robin nests and used natural materials collected at each site. We bound leaf litter together using garden mesh and twine, and lined the nest with moss and fern scales supported by a plastic cup with the bottom removed (fresh lining was used for each exposure period). Each nest contained two eggs made from Sculpy™ odour-free polymer modelling clay, or one clay egg and one quail egg (we included the latter treatment to test whether attack rates were affected by the inclusion of a natural egg, but found this was not the case, results not shown). We designed the clay eggs to resemble North Island robin eggs in size (19 × 22 mm) and colour (light grey), and attached them to nests using nylon thread to prevent removal by predators. We wore surgical gloves to avoid transferring human odour to all materials used, and washed quail eggs using Virkon™ surgical soap to avoid transmitting egg-borne pathogens.
Artificial nests were checked weekly during each 4-week exposure period, and all eggs removed when one or more of them were found marked or missing. The eggs were then stored in a freezer until the end of the breeding season, at which time the marks were checked to identify the animals that made them (rat, possum, mouse, bird, or insect). We assigned a random number to each egg during the procedure so that the observer (RML) was blind to its origin. To establish a set of bite marks and damage done from potential predators, we used a number of techniques. For mice, we put quail and clay eggs in an enclosure with wild mice overnight and compared the results to marks made using skulls on the eggs. For rats and possums, we used skulls to make indentations in eggs. For small birds, we used skulls and also observed a robin attacking a clay egg, saving the damaged egg for comparison. Rat and mouse tooth marks were distinguished by measurements
(teeth and gape), with criteria established through discriminant function analysis on 25 sets of measurements for each species. This set of prints was then used to help identify the marks made on the collected eggs.
Analysis
Natural nest survivalWe derived estimates of natural nest survival probability based on Stanley’s (2000) estimates of daily survival probabilities at each site and the typical incubation (19 days) and brooding (21 day) periods of North Island robins (Powlesland 1997). Unlike other current methods for estimating daily nest survival probabilities, Stanley’s (2000) procedure includes an optimisation routine that allows stage-specific probabilities to be estimated without knowing exact transition times between stages (Jehle et al. 2004). For each site, we initially fitted four candidate models (Table 2) to the data to assess the effects of stage (incubation versus brooding) and season (early versus late, divided according to median laying date). We compared the models based on Akaike’s Information Criterion corrected for small sample size bias (AICc ), with the number of nests treated as the sample size. We then derived the probability of a nest surviving to fledging under the best model, and used the delta method to calculate the approximate standard error for this derived estimate. Armstrong et al. (2002) explain methods for modelling North Island robin data using Stanley’s (2000) procedure, and for deriving estimates and standard errors for nest survival probability.
Artificial nest survivalFor each site, we derived separate estimates of artificial nest survival based on marks made by four groups of species: (1) rats and possums; (2) rats, possums, and mice; (3) rats, possums, and birds; and (4) all marks. Rats and possums were included in all groups because they are both known arboreal nest predators, and because there were too few possum marks (see results) to treat them separately. When obtaining an estimate for a group, we considered a nest to be preyed on if marked by a member of that group, otherwise to have survived the week. As for natural nest survival, we initially modelled the effects of season (early, middle, late) and stage (1st, 2nd, 3rd or 4th week) on daily survival probability (Table 2). However, we were able to use the known fate procedure in program MARK (White & Burnham 1999) for the artificial nest data because nest checks were synchronised and transition times were known. Use of this procedure allowed parallel effects of stage and season to be included, hence one additional model to be considered (Table 2). We selected the best model based on AICc as above, derived the probability of a nest surviving for 4 weeks under that model, and used the delta method to obtain the standard error.

44 NEW ZEALAND JOURNAL OF ECOLOGY, VOL. 33, NO. 1, 2009
Table 2. Best candidate models for estimating daily survival of natural and artificial nests, and sites where different models were selected based on Akaike’s Information Criterion.___________________________________________________________________________________________________________________________________
Model Natural nests Artificial nests k a Sites b k a Sites (prp) b, c Sites (pa) b, d___________________________________________________________________________________________________________________________________
Constant 1 TM, WE 1 TM, KA, WE, WO TM, KA, WE, WO, BSSeason 2 BS, PA 3 BS Stage 3 BP, WA 4 BP, WP, PA BP, PA, WP, WASeason + Stage 6 WA Season × Stage 6 KA, WP, WO 12 ___________________________________________________________________________________________________________________________________a Number of parameters.b TM, Tiritiri Matangi; KA, Karori; WE, Wenderholm; BS, Boundary Stream; WO, Waotu; BP, Bushy Park; WP, Waipapa; WA, Waimanoa; PA, Paengaroa.c Nest survival estimated based on rats and possum tooth imprints.d Nest survival estimated based on all marks.
Relationship between artificial and natural nest survivalWe expected the relationship between survival of natural and artificial nests to take the form:
s = αpβ, (1)
where s is the probability that a nest survives until fledging, α is probability that a nest survives if there are no predators, p is the probability that an artificial nest will survive for 4 weeks, and β determines the rate that s declines as p declines (β partially reflects the time frame over which p is measured). Taking logarithms of both sides of Eqn 1 gives the linear model
log(s) = log(α) + βlog(p) . (2)
We considered four versions of this model, where the estimate of p was changed based on marks made by the different sets of species (Table 3). We also considered a fifth model where natural nest survival was taken to be constant with respect to artificial nest survival.
We fitted each model by linear regression on the log-transformed s and p estimates for the nine sites, and compared the models based on AICc. The relative AICc values for linear models are given by
(3)
where RSS is the residual sum of squares, k is the number of parameters, and n is the sample size (Burnham & Anderson 2002).
( )1122)ln(−−−
++=knkkk
nRSSnAICc
Table 3. Comparison of candidate models for predicting survival of North Island robin nests at a site, based on artificial nest data.___________________________________________________________________________________________________________________________________
Model a a b r2 k b ∆AICc c wi d___________________________________________________________________________________________________________________________________
ln(s) = ln(a) + bln(prp) 0.52 1.16 0.64 3 0.00 0.52ln(s) = ln(a) + bln(prpm) 0.54 1.09 0.54 3 1.76 0.22ln(s) = ln(a) 0.34 2 3.26 0.10ln(s) = ln(a) + bln(prpb) 0.57 0.86 0.41 3 3.57 0.09ln(s) = ln(a) + bln(pall) 0.65 0.87 0.39 3 3.95 0.07___________________________________________________________________________________________________________________________________a s, probability that a robin nest survives until fledging; prp, probability that an artificial nest is not attacked by rats or possums; prpm, probability that an artificial nest is not attacked by rats, possums, or mice; prpb, probability that an artificial nest is not attacked by rats, possums, or birds; pall, probability that an artificial nest is not marked by anything.b Number of parameters estimated (a, b plus the variance).c Difference in Akaike’s Information Criterion (AICc) from that of the best model.d Akaike weight indicating relative support for the model.

45LEWIS ET AL.: PREDICTING NEST SURVIVAL
Because s and p were both estimated with error, we conducted parametric bootstrapping to obtain a confidence interval around each linear model. This involved conducting regressions on 10 000 sets of s and p values that were randomly sampled from logit-normal distributions defined by their estimates and standard errors. We obtained these random values using the NORMINV and RAND() functions in Microsoft Excel.
ResultsNatural nest survivalThe estimated survival of North Island robin nests ranged from >80% at Karori, the site enclosed by a predator-proof fence, to <15% at Waimanoa and Bushy Park. Natural nest survival was highest at two of the sites where exotic mammalian predators were absent or controlled (Fig. 1). However, the estimated nest survival was only 33% on Tiritiri Matangi despite the absence of mammalian predators and 35% at Waotu where predator control was conducted in small forest fragments.
The best model for estimating natural nest survival varied among sites (Table 2). Daily nest survival probability changed between seasons (early or late) and/or stages (eggs or nestlings) at most sites, so these factors needed to be taken into account when estimating overall nest survival. The two sites where daily survival probability appeared to be constant had no (Tiritiri Matangi) or few (Wenderholm) predatory mammals.
Artificial nest survivalOne or more eggs were marked in 389 of the 810 artificial nests put out at the nine sites (55%). The marks could not be identified in 18 cases, but we suspect that most of
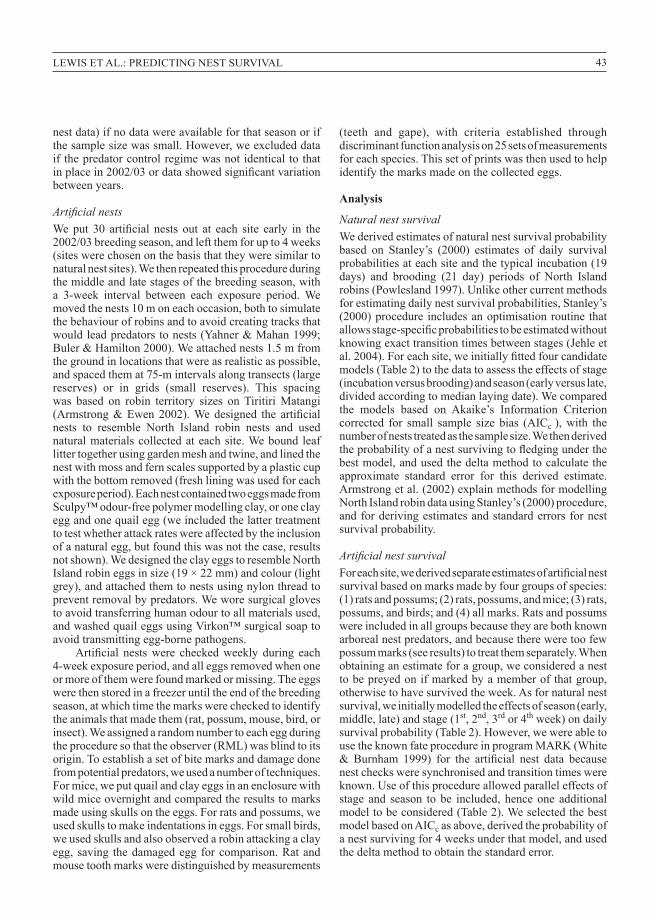
Figure 1. Relationship between survival of artificial nests and North Island robin nests among sites, when artificial nest survival based on (a) marks made on eggs by rats and possums; (b) marks made by rats, possums and birds; (c) marks made by rats, possums and mice; and d) all marks made on eggs. Points show the estimated probabilities (and standard errors) of an artificial nest surviving for 4 weeks and a robin nest surviving to fledging. Points are white if there were no rats or possums at the site (TM, Tiritiri Matangi; KA, Karori), grey if these species were controlled by poisoning (WE, Wenderholm; BS, Boundary Stream; WO, Waotu), and black if control was absent or ineffective (BP, Bushy Park; WP, Waipapa; WA, Waimanoa; PA, Paengaroa). Solid lines show the fitted log-log relationships between the estimates (Table 3), and broken lines show 95% confidence limits around these relationships based on parametric bootstrapping (10 000 regressions performed on values obtained by sampling from logit-normal distributions defined by the estimates and standard errors).Survival of artificial nests
Sur
viva
l of r
eal n
ests

46 NEW ZEALAND JOURNAL OF ECOLOGY, VOL. 33, NO. 1, 2009
these marks were from debris falling into the nests. The remainder had clear imprints of teeth, beaks or mandibles on the clay eggs. Of these, we judged that 174 (47%) were marked by rats, 6 (2%) by possums, 41 (11%) by mice, 127 (34%) by birds, and 23 (6%) by insects. The discriminant function analysis on marks from rat and mouse skulls suggested that 95% of rat marks would be correctly identified and 83% of mouse marks would be correctly identified. Most bird imprints were similar to those made by a robin we observed attacking an artificial nest, but there were some large imprints that may have been made by predatory birds such as morepork.
The pattern of artificial nest survival among reserves was strongly affected by the predator group considered (Fig. 1). When survival was defined by marks made by rats and possums, the sites fell into two clear groups – sites where mammalian predators were absent (100% survival) or controlled (>90% survival), and sites where there was no or ineffective control (<60% survival). The inclusion of mouse marks made little difference to this pattern, the main effect being to reduce the survival at Karori (where mice but not rats are present) to below 100%. However, the inclusion of bird marks had a major effect. Attack rates by birds were highest at the sites with no mammalian predators. Consequently, when marks by rats, possums and birds were included, artificial survival was low at sites where mammalian predators were absent or abundant (i.e. not controlled), and highest where these species were present but controlled (Fig. 1). Defining survival based on all marks gave the same pattern.
The best model for estimating artificial nest survival depended on the site and also predator group considered (Table 2). Survival varied among stages (weeks 1–4) for the four sites with high attack rates from rats and possums, with the highest attack rate always occurring in the first week, whereas no such effect was detected in the other five sites. Survival varied among seasons (early, middle, late) for some sites and predator groups, but was generally relatively constant between seasons.
Relationship between artificial and natural nest survivalThe best predictor of natural nest survival at a site was the estimate of artificial nest survival based on rat and possum imprints (Fig. 1a, Table 3). The main outliers to the fitted relationship were the three sites with the highest artificial nest survival estimates, particularly the two sites where there were no rats or possums hence 100% artificial nest survival. Whereas natural nest survival was estimated to be 53% at such sites under the model, it ranged from 33% at Tiritiri Matangi to 83% at Karori.
Three of the five alternative predictors did not have substantial support (i.e. ∆AICc > 2, Table 3). The estimate of artificial nest survival based on rat, possum, and mouse imprints was the second best predictor, but this reflects the fact that, compared with rats, mice attacked far fewer
eggs, so had little effect on the estimates (Fig. 1a,b). Inclusion of bird imprints in the artificial nest survival estimate substantially weakened the correlation with natural nest survival, (Fig. 1c, Table 3) and this estimate has no more predictive value than assuming natural nest survival is constant among sites (i.e. there is no decrease in AICc, Table 3). Inclusion of all imprints gave a similar result (Fig. 1d, Table 3).
DiscussionThe results showed that artificial nest survival was a reasonable predictor of North Island robin nest survival at a site, despite the differences in vegetation structure, area and geographic location among the nine sites. It was also a good predictor of the status of the robin populations. The four sites with low (<60%) artificial nest survival based on rat and possum imprints had robin populations that were either clearly in decline (Paengaroa, Bushy Park – Armstrong et al. 2006b; T. O’Connor, Bushy Park ranger, pers. comm.) or appeared to be in decline (Waimanoa, Waipapa – R. Powlesland, DOC, pers. comm.) at the time of the study. Of the five sites with high (>90%) artificial nest survival, four were increasing or stable, although one of these (Wenderholm) has a low density due to dispersal of juveniles from the site (Andrews 2007). The exception was Waotu, which was declining toward extinction (Pattemore 2003).
To obtain the relationship between artificial and natural nest survival, it was necessary to be able to identify the animals attacking artificial nests. We identified most of the animals through imprints on clay eggs (a small number of quail eggs were clearly punctured by bird beaks), so the use of clay eggs was critical.
Inclusion of marks other than those made by rats and possums reduced the predictive value of artificial nest survival estimates. It is not surprising that rat imprints produced the strongest relationship with natural nest survival, given the known impact of rats on New Zealand bird species (Moors 1983; Innes & Hay 1991; Brown et al. 1998; Atkinson 2001). Although brushtail possums are also known to prey on New Zealand birds’ nests (Brown et al. 1996), there were too few possum imprints in our samples to assess whether their inclusion increased or decreased the predictive value of the estimates.
House mice were also responsible for a small proportion of imprints, but their inclusion reduced the predictive value of artificial nest survival estimates. Mice have been observed preying on nests of other bird species (Maxson & Oring 1978; Guillory 1987). However, it is unlikely that mice are important predators of North Island robin nests given that (1) our three sites with the highest mouse attack rates on artificial eggs (Karori, Boundary Stream, Wenderholm) were those with highest robin nest survival and (2) robins have thrived on islands such as
47LEWIS ET AL.: PREDICTING NEST SURVIVAL
Mana and Mokoia where mice are abundant (Armstrong 2000).
It was bird imprints that were the most important factor to exclude from models. Birds attacked a large proportion of the artificial eggs, as has been observed in previous studies (Major et al. 1996; Matthews et al. 1999; Buler & Hamilton 2000), but inclusion of these marks substantially reduced the predictive value of artificial nest survival estimates in this study.
Comparison of robin nest survival among sites (Fig. 1) suggests that artificial nest survival gave a good predictor of failure rates due to mammalian predation, and that the outliers resulted from variance in nest failure rates due to other factors. Most of the unexplained variance in natural nest survival was among the sites with high artificial nest survival, particularly the two sites where there were no mammalian predators at all. Differences in nest survival between sites such as Tiritiri Matangi and Karori could potentially be due to a range of factors. However, robin nest monitoring at Tiritiri Matangi (Armstrong et al. 2000) has shown that few nest failures were the result of factors such as storms or starvation, and that the consistently low nest survival (Armstrong & Ewan 2002) appears to be largely due to predation, presumably by birds. Tiritiri Matangi had the highest rate of bird attacks on artificial nests (67%) among the nine sites, and inclusion of bird imprints gave an accurate prediction of the high failure rate of robin nests on Tiritiri Matangi (Fig. 1). In contrast, Karori had the second highest rate of bird attacks on artificial nests (36%), but did not have a correspondingly high nest failure rate. Given that we saw an artificial nest being attacked by a robin, which is not known to be a nest predator, we suspect that many of the bird imprints on clay eggs were made by species that would not normally attack nests. A high frequency of imprints by such species would account for the poor predictive value of artificial nest survival estimates that included bird imprints.
One factor that could account for some of the unexplained variance in nest survival is fragmentation. As well as being an island, the factor that distinguishes Tiritiri Matangi from most of the other sites is that it has only a small amount of forest (c. 20 ha) divided into fragments ranging from 0.1 to 4 ha. The remainder of the island consists mainly of regenerating forest that was formerly farmland. The other fragmented site is Waotu, which consists of three small forest fragments (4, 6, and 25 ha) surrounded by farmland. Both sites stand out as having low natural nest survival that is not predicted by attack rates of rats and possums on artificial nests.
Forest fragmentation is often associated with high rates of nest predation, mainly due to predatory birds that favour farmland or edge habitats (Rowley 1973; Andrén et al. 1985; Wilcove 1985; Andrén & Angelstam 1988; Andrén 1992). Such birds in New Zealand could include exotic Indian mynas (Acridotheres tristis) and starlings (Sturnus vulgaris), and Australasian harrier hawks (Circus
approximans), all of which are common at both Tiritiri Matangi and Waotu. However, the idea that robins’ nests at Waotu had a high rate of bird predation is difficult to reconcile with the fact that no artificial nests at that site were attacked by birds (Fig. 1). The fragmentation of the forest also decreases the amount of suitable habitat available by increasing the edge to area ratio. As a result, birds may be forced to build nests nearer to the edge, increasing exposure, which may exacerbate the effects of severe weather and decrease food availability.
The lack of mammalian predators on Tiritiri Matangi has allowed an increase in the number and diversity of small birds in this reserve, increasing competition for space and resources. It is possible that the birds responsible for predation ignore artificial nests. It is also possible that the low nest survival at Waotu was due to domestic cats (Felis catus), which were not targeted by predator control but were present in the area (G. Stephenson, pers. comm.), or other factors. Domestic cats are known to prey on nestlings, so cat predation could account for the reduction in survival at the nestling stage at Waotu where the smaller area and fragmentation may increase vulnerability to these predators. Regardless of the reasons for low nest survival at the two sites with fragmented forest, the relationship between survival of artificial and natural nests is much tighter when these sites are excluded (r2 = 0.77) than when they are included (r2 = 0.64).
It is possible that the relationship between artificial and natural nest survival would be tighter if more precise estimates were obtained. The difference between natural and artificial nest success values within individual reserves was not consistent across all reserves. This inconsistency weakened the relationship between artificial and natural nest success by reducing the strength of the correlation. This difference could be accounted for by the use of data collected from previous years, which would not account for any changes in nest mortality during the year of artificial nest data collection.
However, it is inevitable that there will be unexplained variation in nest survival among sites. Nest survival will vary for reasons unrelated to predation, and methods such as artificial nest monitoring will never completely reflect natural predation processes. Cues such as the smell (Schaub et al. 1992) and begging calls (Haskell 1994; Roulin 2001a,b; Leonard et al. 2005) of chicks, and movements of parents to and from the nest (Martin et al. 2000; Ghalambor & Martin 2001) are absent from artificial nests. Nor is there is any parental guarding (King et al. 1999). Attacks on artificial nests are therefore biased toward species that detect nests visually and species that might normally be repelled by parents.
Attempting to replicate such features may only increase the confounding factors introduced. For example, attempting to mimic olfactory cues by spraying odours (e.g. diluted mixture of faeces) may inadvertently attract more predators to the nest site (Pärt & Wretenberg 2002).
48 NEW ZEALAND JOURNAL OF ECOLOGY, VOL. 33, NO. 1, 2009
Likewise, attaching artificial robins to the nests, although presumed to mimic depredation risk associated with adult presence at nests, inaccurately reflects adult presence at the nest site, as in natural nests adults are not present 100% of the time.
The addition of cameras may also affect nest survival due to the increased human presence at nest sites (MacIvor et al. 1990; Gutzwiller et al. 2002). Cameras used to identify predators have been found to increase or decrease predator activity as some species are attracted or deterred by the presence of cameras (i.e. ‘novelty factor’) (Yahner & Wright 1985; Angelstam 1986; Hernandez et al. 1997). In addition to this, overcomplication of methods and increased financial input through the use of sophisticated equipment, i.e. cameras and artificial robins (Brown et al. 1998; King et al. 2001), may make the artificial nests too time consuming and less affordable for those wishing to use them as a monitoring technique.
The predator community must be considered when relying on the results from artificial nest results. While the results of this study show that predation during the incubation stage can provide a good indicator of overall nest success, this method cannot account for loss during the nestling stage. Known nest predators such as mustelids take eggs, nestlings and adult robins, especially during incubation and nestling stages when the adults are on the nest (Moors 1983; Murphy et al. 1998). No depredation event on an artificial nest was identified as mustelid through marking on the clay eggs, even though stoats, weasels (Mustela nivalis) and/or ferrets (M. furo) were known to be present at the sites with no predator control (revealed through tracking tunnel records and trap catch). Hence an entire predator group may be missed by using artificial nests and this should be taken into consideration when using this technique. Given the inherent biases mentioned above, it is perhaps surprising that artificial nests appear to provide a useful predictor of predation by nocturnal mammals in New Zealand forests. This is an important result, given that most studies of artificial nests have involved systems dominated by avian predators (Söderström 1999; Buler & Hamilton 2000; Zanette 2002; Fulton & Ford 2003).
Artificial nests appear to provide a useful indication of rates of nest predation by rats in New Zealand forest reserves, as long as imprints made by other species are disregarded. While there were too few possum imprints in our samples to assess whether their inclusion increased or decreased the predictive value of the estimates they were included in the rp model, as a depredation event by a possum was deemed to result in egg failure (in both artificial and natural nests). Artificial nests do not appear to give a reliable indication of rates of nest predation by birds and hence may only be applicable to New Zealand systems where mammals are the main nest predators. Our results suggest that if a site has artificial nest survival of <60% over 4 weeks, then North Island robins reintroduced to the
site will have <35% nest survival and will probably decline. Nest survival may be variable for robins reintroduced to sites with high artificial nest survival. However, if small forest fragments are excluded, our results suggest that robins reintroduced to sites with high (> 90%) artificial nest survival will have reasonably high (> 45%) nest survival and will probably persist. Similar patterns will probably apply to other New Zealand forest birds, but with different levels of artificial nest survival required to ensure persistence.
AcknowledgementsWe thank A. Hoffman, D. Small, M. Howard, T. Lovegrove, D. Pattemore, T. O’Connor and R. Powlesland for sharing data used to estimate nest survival of North Island robins. I would especially like to thank T. Lovegrove for his help with the Wenderholm site. We thank K. Richardson, W. Sullivan, M. Low, A. Hewit, A. Rimmer, A. Kent, D. Durpoix and P. Turner for help with nest construction, nest checks or comments on the early drafts. We thank A. Noble for suggesting the use of parametric bootstrapping, and M. Potter, J. Innes, C. Lehnebach and V. McGlynn for constructive comments on the manuscript. We thank the Department of Conservation, Karori Sanctuary, the Auckland Regional Council, Bushy Park Trust, and G. and C. Stephenson for access to the sites, and G. and C. Stephenson for their hospitality. Financial support was provided by Marsden Fund Grant MAU003, Auckland Regional Council, Horizons Regional Council, Supporters of Tiritiri Matangi, and Waikato Forest and Bird.
ReferencesAndrén H 1992. Corvid density and nest predation
in relation to forest fragmentation: a landscape perspective. Ecology 73: 794–804.
Andrén H, Angelstam P 1988. Elevated predation rates as an edge effect in habitat islands: experimental evidence. Ecology 69: 544–547.
Andrén H, Angelstam P, Lindström E, Widén P 1985. Differences in predation pressure in relation to habitat fragmentation: an experiment. Oikos 45: 273–277.
Andrews J 2007. Factors affecting the survival of North Island robins (Petroica australis longipes) at Wenderholm Regional Park: dispersal, habitat preferences and population viability. Unpublished MSc thesis, University of Auckland, Auckland, New Zealand.
Angelstam P 1986. Predation on ground nesting birds’ nests in relation to predator densities and habitat edge. Oikos 47: 365–373.
Armstrong DP 2000. Re-introductions of New Zealand robins: a key component of ecological restoration.
49LEWIS ET AL.: PREDICTING NEST SURVIVAL
Reintroduction News 19: 44–47.Armstrong DP, Ewen JG 2002. Dynamics and viability
of a New Zealand robin population reintroduced to regenerating fragmented habitat. Conservation Biology 16: 1074–1085.
Armstrong DP, McLean IG 1995. New Zealand translocations: theory and practice. Pacific Conservation Biology 2: 39–54.
Armstrong DP, Ewen JG, Dimond WJ, Lovegrove TG, Bergstrom A, Walter B 2000. Breeding biology of North Island robins (Petroica australis longipes) on Tiritiri Matangi Island, Hauraki Gulf, New Zealand. Notornis 47: 106–118.
Armstrong DP, Raeburn EH, Powlesland RG, Howard M, Christensen B, Ewen JG 2002. Obtaining meaningful comparisons of nest success: data from New Zealand robin (Petroica australis) populations. New Zealand Journal of Ecology 26: 1–13.
Armstrong DP, Raeburn EH, Lewis RM, Ravine D 2006a. Modeling vital rates of a reintroduced New Zealand robin population as a function of predator control. Journal of Wildlife Management 70: 1028–1036.
Armstrong DP, Raeburn EH, Lewis RM, Ravine D 2006b. Estimating the viability of a reintroduced New Zealand robin population as a function of predator control. Journal of Wildlife Management 70: 1020–1027.
Atkinson IAE 2001. Introduced mammals and models for restoration. Biological Conservation 99: 81–96.
Batáry P, Báldi A 2004. Evidence of an edge effect on avian nest success. Conservation Biology 18: 389–400.
Blackwell GL, Potter MA, McLennan JA 2002. Rodent density indices from tracking tunnels, snap-traps and Fenn traps: do they tell the same story? New Zealand Journal of Ecology 26: 43–51.
Brown KP, Moller H, Innes J 1996. Sign left by brushtail possums after feeding on bird eggs and chicks. New Zealand Journal of Ecology 20: 277–284.
Brown KP, Moller H, Innes J, Jansen P 1998. Identifying predators at nests of small birds in a New Zealand forest. Ibis 140: 274–279.
Buler JJ, Hamilton RB 2000. Predation of natural and artificial nests in a southern pine forest. Auk 117: 739–747.
Burnham KP, Anderson DR 2002. Model selection and multimodel inference: a practical information-theoretic approach. 2nd edn. New York, Springer-Verlag.
Chalfoun AD, Ratnaswamy MJ, Thompson III FR 2002a. Songbird nest predators in forest–pasture edge and forest interior in a fragmented landscape. Ecological Applications 12: 858–867.
Chalfoun AD, Thompson III FR, Ratnaswamy MJ 2002b. Nest predators and fragmentation: a review and meta-analysis. Conservation Biology 16: 306–318.
Dilks PJ, O’Donnell CFJ, Elliott GP, Phillipson SM
1996. The effect of bait type, tunnel design, and trap position on stoat control operations for conservation management. New Zealand Journal of Zoology 23: 295–306.
Dion N, Hobson KA, Larivière S 2000. Interactive effects of vegetation and predators on the success of natural and simulated nests of grassland songbirds. The Condor 102: 629–634.
Fulton GR, Ford HA 2003. Quail eggs, modelling clay eggs, imprints and small mammals in an Australian woodland. Emu 103: 255–258.
Ghalambor CK, Martin TE 2001. Fecundity-survival trade-offs and parental risk-taking in birds. Science 292: 494–497.
Guillory HD 1987. Cavity competition and suspected predation on Prothonotary Warblers by Peromyscus spp. Journal of Field Ornithology 58: 425–427.
Gutzwiller KJ, Riffell SK, Anderson SH 2002. Repeated human intrusion and the potential for nest predation by gray jays. Journal of Wildlife Management 66: 372–380.
Haskell D 1994. Experimental-evidence that nestling begging behaviour incurs a cost due to nest predation. Proceedings of the Royal Society of London B 257: 161–164.
Henry VG 1969. Predation on dummy nests of ground-nesting birds in the southern Appalachians. Journal of Wildlife Management 33: 169–172.
Hernandez F, Rollins D, Cantu R 1997. Evaluating evidence to identify ground-nest predators in west Texas. Wildlife Society Bulletin 25: 826–831.
Holdaway RN, Worthy TH, Tennyson AJD 2001. A working list of breeding bird species of the New Zealand region at first human contact. New Zealand Journal of Zoology 28: 119–187.
Innes JG, Hay JR 1991. The interactions of New Zealand forest birds with introduced fauna. Acta XX Congressus Internationalis Ornithologici 4: 2523–2533.
Innes J, Hay R, Flux I, Bradfield P, Speed H, Jansen P 1999. Successful recovery of North Island kokako Callaeas cinerea wilsoni populations, by adaptive management. Biological Conservation 87: 201–214.
James RE, Clout MN 1996. Nesting success of New Zealand pigeons (Hemiphaga novaeseelandiae) in response to a rat (Rattus rattus) poisoning programme at Wenderholm Regional Park. New Zealand Journal of Ecology 20: 45–51.
Janzen DH 1978. Predation intensity on eggs on the ground in two Costa Rican forests. American Midland Naturalist 100: 467–470.
Jehle G, Yackel Adams AA, Savidge JA, Skagen SK 2004. Nest survival estimation: a review of alternatives to the Mayfield estimator. The Condor 106: 472–484.
King DI, DeGraaf RM, Griffin CR, Maier TJ 1999. Do predation rates on artificial nests accurately reflect
50 NEW ZEALAND JOURNAL OF ECOLOGY, VOL. 33, NO. 1, 2009
predation rates on natural bird nests? Journal of Field Ornithology 70: 257–262.
King DI, DeGraaf RM, Champlin PJ, Champlin TB 2001. A new method for wireless video monitoring of bird nests. Wildlife Society Bulletin 29: 349–353.
Lahti DC 2001. The “edge effect on nest predation” hypothesis after twenty years. Biological Conservation 99: 365–374.
Larivière S 1999. Reasons why predators cannot be inferred from nest remains. The Condor 101: 718–721.
Leonard ML, Horn AG, Mukhida A 2005. False alarms and begging in nestling birds. Animal Behaviour 69: 701–708.
Loiselle BA, Hoppes WG 1983. Nest predation in insular and mainland lowland rainforest in Panama. The Condor 85: 93–95.
MacIvor LH, Melvin SM, Griffin CR 1990. Effects of research activity on piping plover nest predation. Journal of Wildlife Management 54: 443–447.
Major RE 1991. Identification of nest predators by photography, dummy eggs, and adhesive tape. Auk 108: 190–195.
Major RE, Kendal CE 1996. The contribution of artificial nest experiments to understanding avian reproductive success: a review of methods and conclusions. Ibis 138: 298–307.
Major RE, Gowing G, Kendal CE 1996. Nest predation in Australian urban environments and the role of the pied currawong, Strepera graculina. Australian Journal of Ecology 21: 399–409.
Marini MA, Melo C 1998. Predators of quail eggs, and the evidence of the remains: Implications for nest predation studies. The Condor 100: 395–399.
Martin TE 1987. Artificial nest experiments: effects of nest appearance and type of predator. The Condor 89: 925–928.
Martin TE 1993a. Nest predation among vegetation layers and habitat types: devising the dogmas. American Naturalist 141: 897–913.
Martin TE 1993b. Nest predation and nest sites – new perspectives on old patterns. Bioscience 43: 523–532.
Martin TE, Geupel GR 1993. Nest-monitoring plots: Methods for locating nests and monitoring success. Journal of Field Ornithology 64: 507–519.
Martin TE, Roper JJ 1988. Nest predation and nest-site selection of a western population of the hermit thrush. The Condor 90: 51–57.
Martin TE, Scott J, Menge C 2000. Nest predation increases with parental activity: separating nest site and parental activity effects. Proceedings of the Royal Society of London B 267: 2287–2293.
Matschke G 1965. Predation by European wild hogs on dummy nests of ground nesting birds. Proceedings of the Annual Conference Southeastern Association. Game and Fish Commissioners 18: 154–156.
Matthews A, Dickman CR, Major RE 1999. The influence of fragment size and edge on nest predation in urban bushland. Ecography 22: 349–356.
Maxson SJ, Oring LW 1978. Mice as a source of egg loss among ground-nesting birds. Auk 95: 582–584.
Mezquida ET, Marone L 2003. Are results of artificial nest experiments a valid indicator of success of natural nests? Wilson Bulletin 115: 270–276.
Møller AP 1987. Egg predation as a selective factor for nest design: an experiment. Oikos 50: 91–94.
Moore RP, Robinson WD 2004. Artificial bird nests, external validity, and bias in ecological field studies. Ecology 85: 1562–1567.
Moorhouse R, Greene T, Dilks P, Powlesland R, Moran L, Taylor G, Jones A, Knegtmans J, Wills D, Pryde M, Fraser I, August A, August C 2003. Control of introduced mammalian predators improves kaka Nestor meridionalis breeding success: reversing the decline of a threatened New Zealand parrot. Biological Conservation 110: 33–44.
Moors PJ 1983. Predation by mustelids and rodents on the eggs and chicks of native and introduced birds in Kowhai Bush, New Zealand. Ibis 125: 137–154.
Murphy EC, Clapperton BK, Bradfield PMF, Speed HJ 1998. Effects of rat-poisoning operations on abundance and diet of mustelids in New Zealand podocarp forests. New Zealand Journal of Zoology 25: 315–328.
Ortega CP, Ortega JC, Rapp CA, Backensto SA 1998. Validating the use of artificial nests in predation experiments. Journal of Wildlife Management 62: 925–932.
Pärt T, Wretenberg J 2002. Do artificial nests reveal relative nest predation risk for real nests? Journal of Avian Biology 33: 39–46.
Paton PWC 1994. The effect of edge on avian nest success: how strong is the evidence. Conservation Biology 8: 17–26.
Pattemore DE 2003. Translocations of North Island robins (Petroica australis longipes) to mainland reserves: breeding success, dispersal and habitat preference. Unpublished MSc thesis, University of Auckland, Auckland, New Zealand.
Powlesland RG 1997. Protocols for monitoring New Zealand robins (Petroica astralis). DOC Technical Series 13. Wellington, Department of Conservation.
Rangen SA, Clark RG, Hobson KA 2000. Visual and olfactory attributes of artificial nests. Auk 117: 136–146.
Reitsma LR, Whelan CJ 2000. Does vertical partitioning of nest sites decrease nest predation? Auk 117: 409–415.
Roulin A 2001a. On the cost of begging vocalization: implications of vigilance. Behavioral Ecology 12: 506–511.

51LEWIS ET AL.: PREDICTING NEST SURVIVAL
Roulin A 2001b. Screaming as a strategy to reduce the predation risk incurred by begging? Behaviour 138: 615–627.
Rowley I 1973. The comparative ecology of Australian Corvids II. Social organization and behaviour. CSIRO Wildlife Research 18: 25–65.
Schaub R, Mumme RL, Woolfenden GE 1992. Predation on the eggs and nestlings of Florida scrub jays. Auk 109: 585–593.
Schneider MF 2001. Habitat loss, fragmentation and predator impact: spatial implications for prey conservation. Journal of Applied Ecology 38: 720–735.
Sloan SS, Holmes RT, Sherry TW 1998. Depredation rates and predators at artificial bird nests in an unfragmented northern hardwoods forest. Journal of Wildlife Management 62: 529–539.
Söderström B 1999. Artificial nest predation rates in tropical and temperate forests: a review of the effects of edge and nest site. Ecography 22: 455–463.
Stanley TR 2000. Modeling and estimation of stage-specific daily survival probabilities of nests. Ecology 81: 2048-2053.
Storaas T 1988. A comparison of losses in artificial and naturally occurring Capercaillie nests. Journal of Wildlife Management 52: 123–126.
Stuart-Smith AK, Hayes JP 2003. Influence of residual tree density on predation of artificial and natural songbird nests. Forest Ecology and Management 183: 159–176.
Tryjanowski P, Kuzniak S 1999. Effect of research activity on the success of Red-backed Shrike Lanius collurio nests. Ornis Fennica 76: 41–43.
Villard M-A, Pärt T 2004. Don’t put all your eggs in real nests: a sequel to Faaborg. Conservation Biology 18: 371–372.
Wada T 1994. Effects of height of neighboring nests on nest predation in the rufous turtle-dove (Streptopelia orientalis). The Condor 96: 812–816.
Whelan CJ, Dilger ML, Robson D, Hallyn N, Dilger S 1994. Effects of olfactory cues on artificial-nest experiments. Auk 111: 945–952.
White GC, Burnham KP 1999. Program MARK: survival estimation from populations of marked animals. Bird Study 46: 120–139.
Wilcove DS 1985. Nest predation in forest tracts and the decline of migratory songbirds. Ecology 66: 1211–1214.
Willebrand T, Marcström V 1988. On the danger of using dummy nests to study predation. Auk 105: 378–379.
Woods M, McDonald RA, Harris S 2003. Predation of wildlife by domestic cats Felis catus in Great Britian. Mammal Review 33: 174–188.
Yahner RH, Cypher BL 1987. Effects of nest location on depredation of artificial arboreal nests. Journal of Wildlife Management 51. 178–181.
Yahner RH, Mahan CG 1999. Potential for predator learning of artificial arboreal nest locations. Wilson Bulletin 111: 536–540.
Yahner RH, Wright AL 1985. Depredation on artificial ground nests: effects of edge and plot age. Journal of Wildlife Management 49: 508–513.
Yahner RH, Morrell TE, Rachael JS 1989. Effects of edge contrast on depredation of artificial avian nests. Journal of Wildlife Management 53: 1135–1138.
Zanette L 2002. What do artificial nests tells us about nest predation? Biological Conservation 103: 323–329.
Editorial Board member: Kay ClappertonReceived 3 July 2008; accepted 5 November 2008