Embed Size (px)
Citation preview
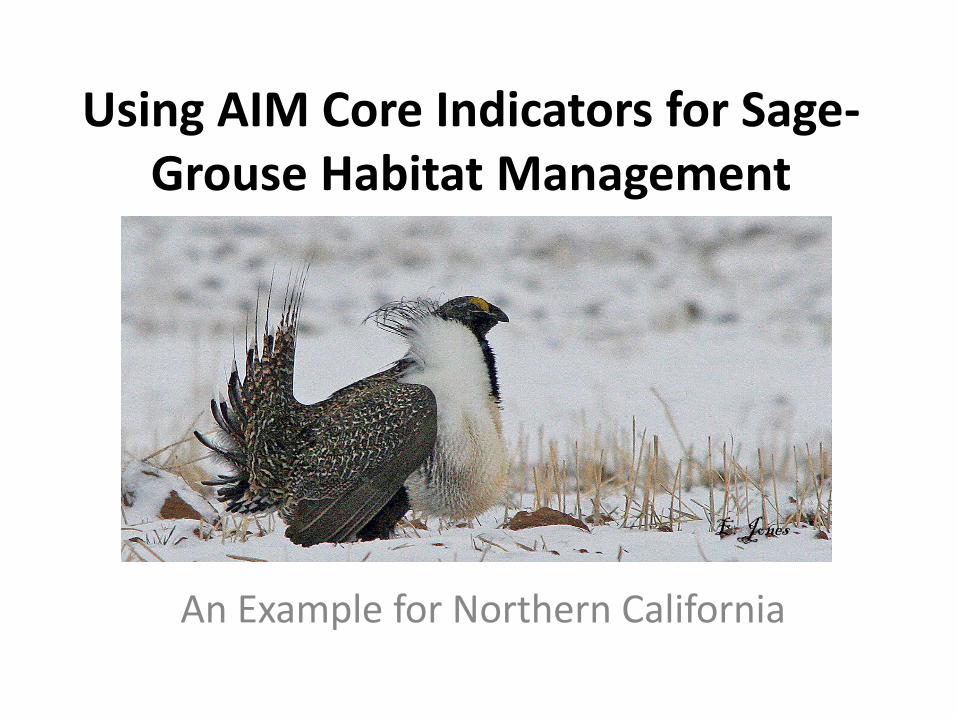
Using AIM Core Indicators for Sage-Grouse Habitat Management
An Example for Northern California
E. Jones
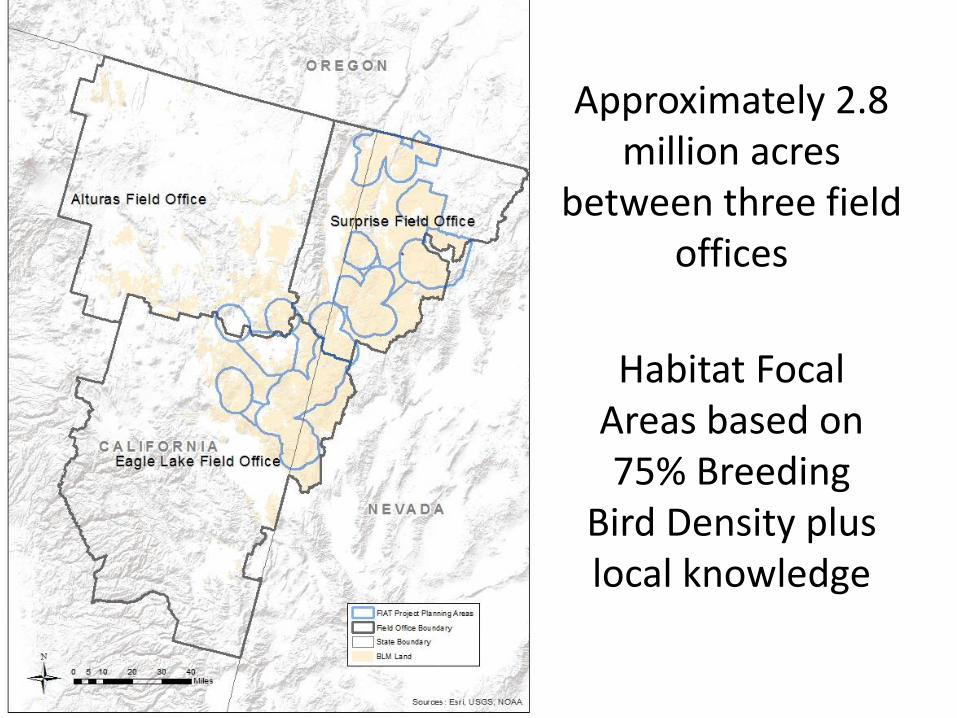
Approximately 2.8 million acres
between three field offices
Habitat Focal Areas based on 75% Breeding
Bird Density plus local knowledge
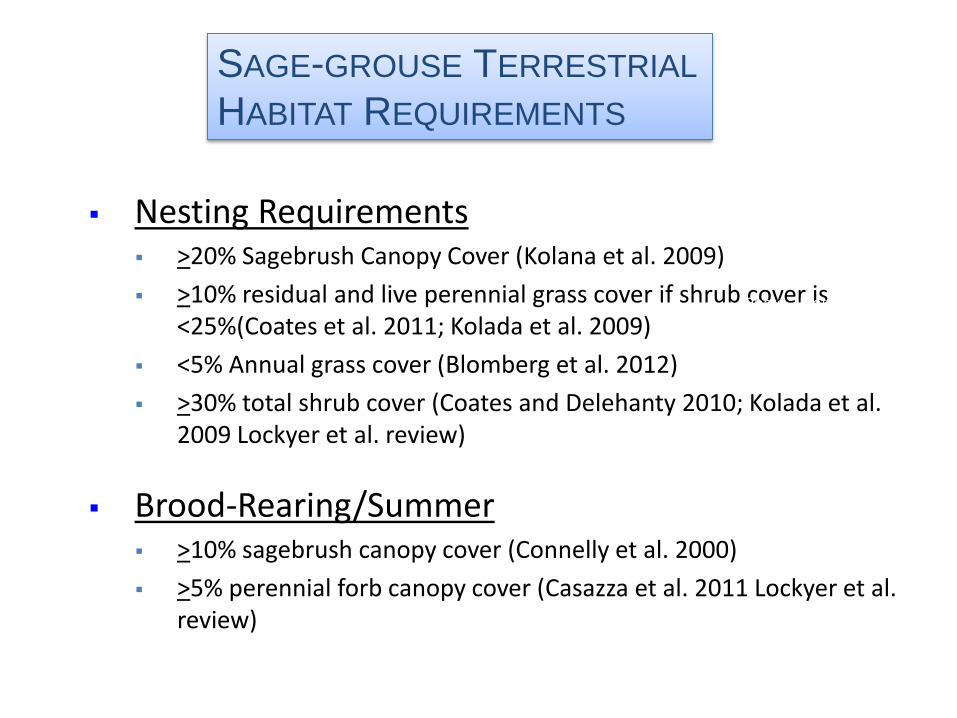
SAGE-GROUSE TERRESTRIAL
HABITAT REQUIREMENTS
Nesting Requirements >20% Sagebrush Canopy Cover (Kolana et al. 2009)
>10% residual and live perennial grass cover if shrub cover is <25%(Coates et al. 2011; Kolada et al. 2009)
<5% Annual grass cover (Blomberg et al. 2012)
>30% total shrub cover (Coates and Delehanty 2010; Kolada et al. 2009 Lockyer et al. review)
Brood-Rearing/Summer >10% sagebrush canopy cover (Connelly et al. 2000)
>5% perennial forb canopy cover (Casazza et al. 2011 Lockyer et al. review)
Photo - Matt Lee
Photo - Matt Lee

Winter >10% sagebrush canopy cover (Connelly et al. 2000)
>9.8 inches (25 cm) sagebrush height (Connelly et al. 2000)
Photo - Matt Lee
Photo - Matt Lee
SAGE-GROUSE TERRESTRIAL
HABITAT REQUIREMENTS
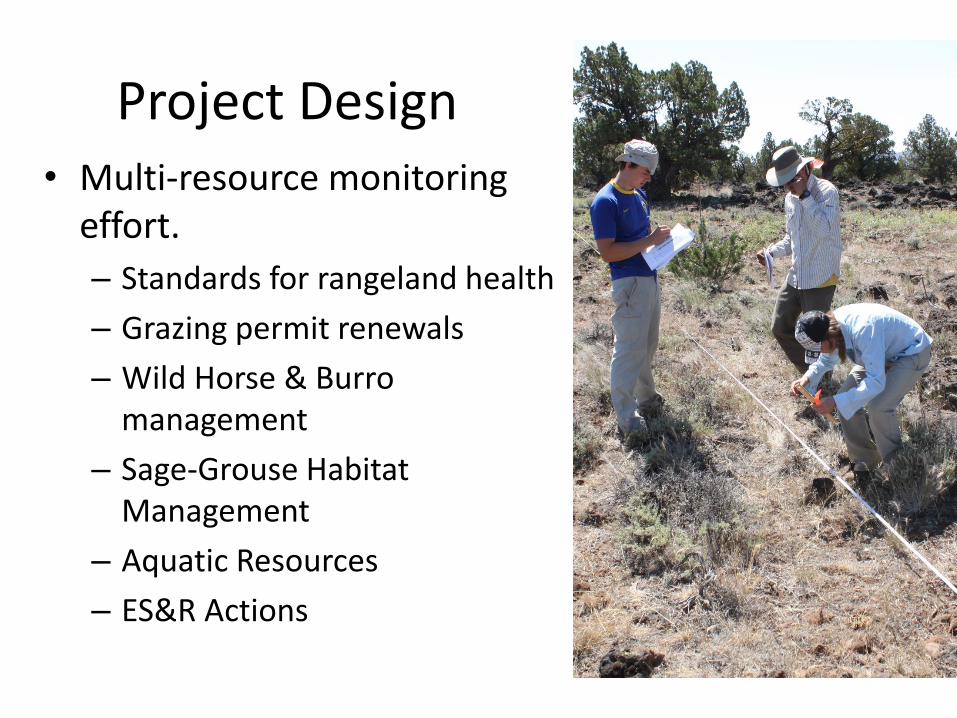
Project Design • Multi-resource monitoring
effort.
– Standards for rangeland health
– Grazing permit renewals
– Wild Horse & Burro management
– Sage-Grouse Habitat Management
– Aquatic Resources
– ES&R Actions
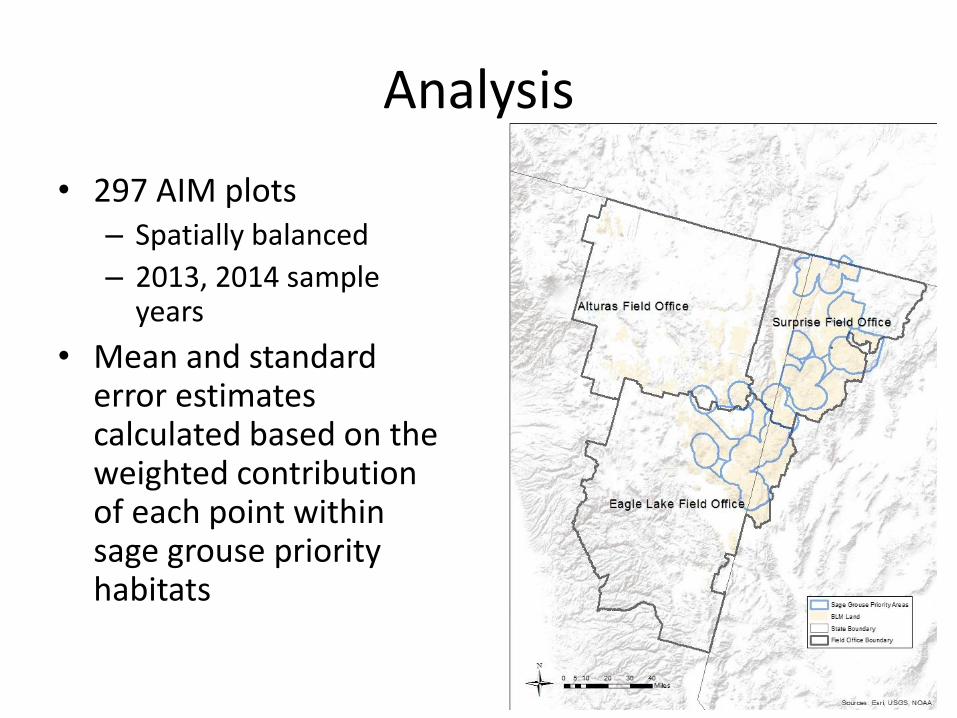
Analysis
• 297 AIM plots – Spatially balanced
– 2013, 2014 sample years
• Mean and standard error estimates calculated based on the weighted contribution of each point within sage grouse priority habitats
Analysis
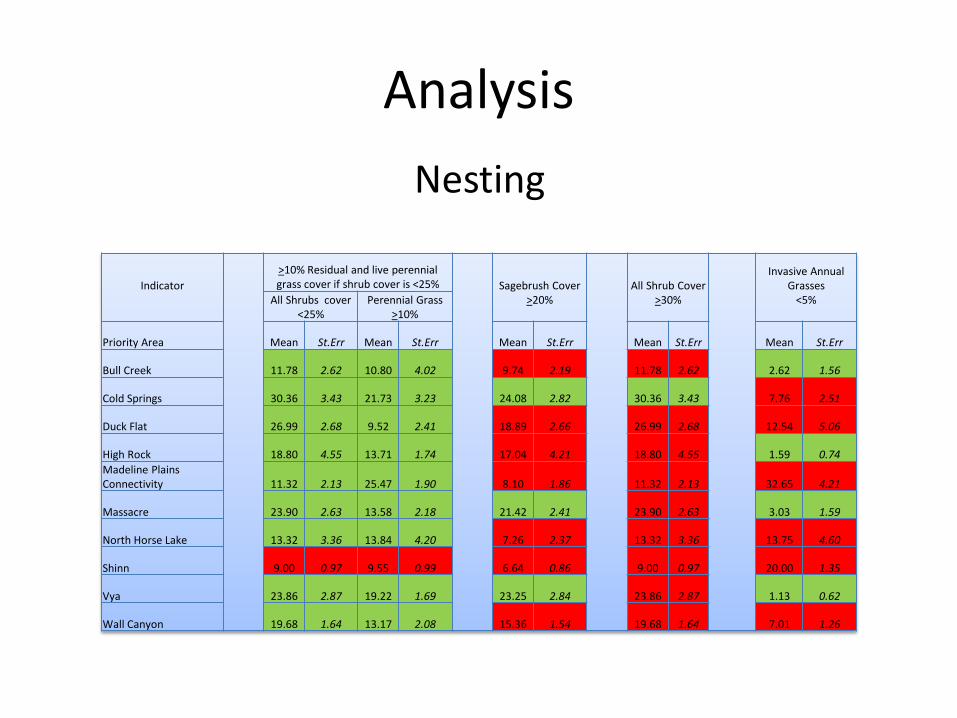
Nesting
Indicator
>10% Residual and live perennial grass cover if shrub cover is <25% Sagebrush Cover
>20%
All Shrub Cover >30%
Invasive Annual Grasses
<5%
All Shrubs cover <25%
Perennial Grass >10%
Priority Area Mean St.Err Mean St.Err Mean St.Err Mean St.Err Mean St.Err
Bull Creek 11.78 2.62 10.80 4.02 9.74 2.19 11.78 2.62 2.62 1.56
Cold Springs 30.36 3.43 21.73 3.23 24.08 2.82 30.36 3.43 7.76 2.51
Duck Flat 26.99 2.68 9.52 2.41 18.89 2.66 26.99 2.68 12.54 5.06
High Rock 18.80 4.55 13.71 1.74 17.04 4.21 18.80 4.55 1.59 0.74
Madeline Plains Connectivity 11.32 2.13 25.47 1.90 8.10 1.86 11.32 2.13 32.65 4.21
Massacre 23.90 2.63 13.58 2.18 21.42 2.41 23.90 2.63 3.03 1.59
North Horse Lake 13.32 3.36 13.84 4.20 7.26 2.37 13.32 3.36 13.75 4.60
Shinn 9.00 0.97 9.55 0.99 6.64 0.86 9.00 0.97 20.00 1.35
Vya 23.86 2.87 19.22 1.69 23.25 2.84 23.86 2.87 1.13 0.62
Wall Canyon 19.68 1.64 13.17 2.08 15.36 1.54 19.68 1.64 7.01 1.26
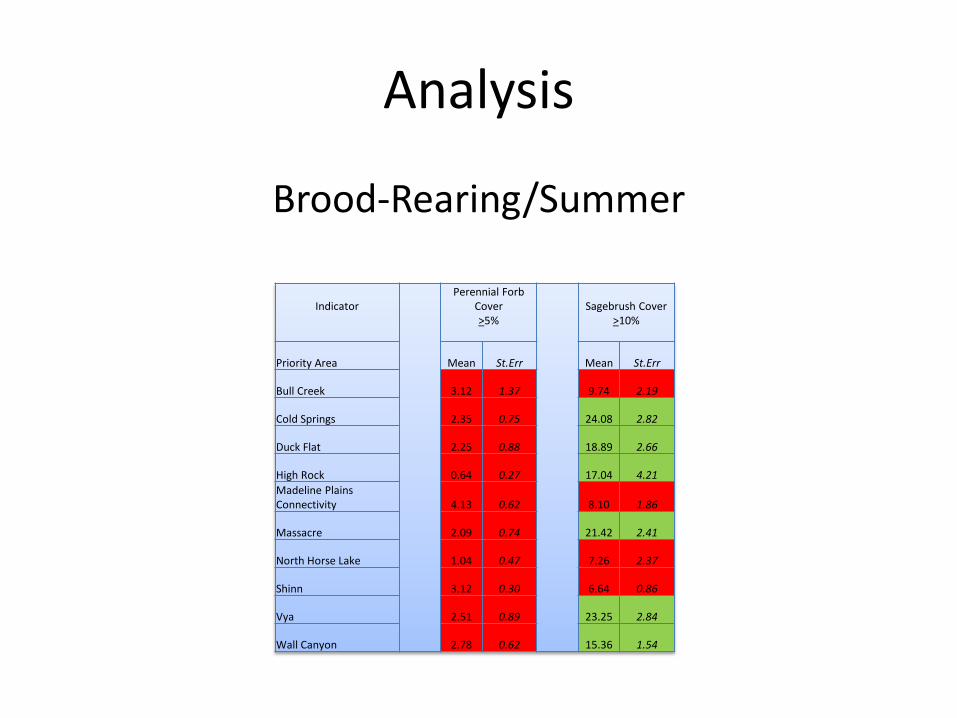
Analysis
Brood-Rearing/Summer
Indicator
Perennial Forb Cover >5%
Sagebrush Cover >10%
Priority Area Mean St.Err Mean St.Err
Bull Creek 3.12 1.37 9.74 2.19
Cold Springs 2.35 0.75 24.08 2.82
Duck Flat 2.25 0.88 18.89 2.66
High Rock 0.64 0.27 17.04 4.21
Madeline Plains Connectivity 4.13 0.62 8.10 1.86
Massacre 2.09 0.74 21.42 2.41
North Horse Lake 1.04 0.47 7.26 2.37
Shinn 3.12 0.30 6.64 0.86
Vya 2.51 0.89 23.25 2.84
Wall Canyon 2.78 0.62 15.36 1.54
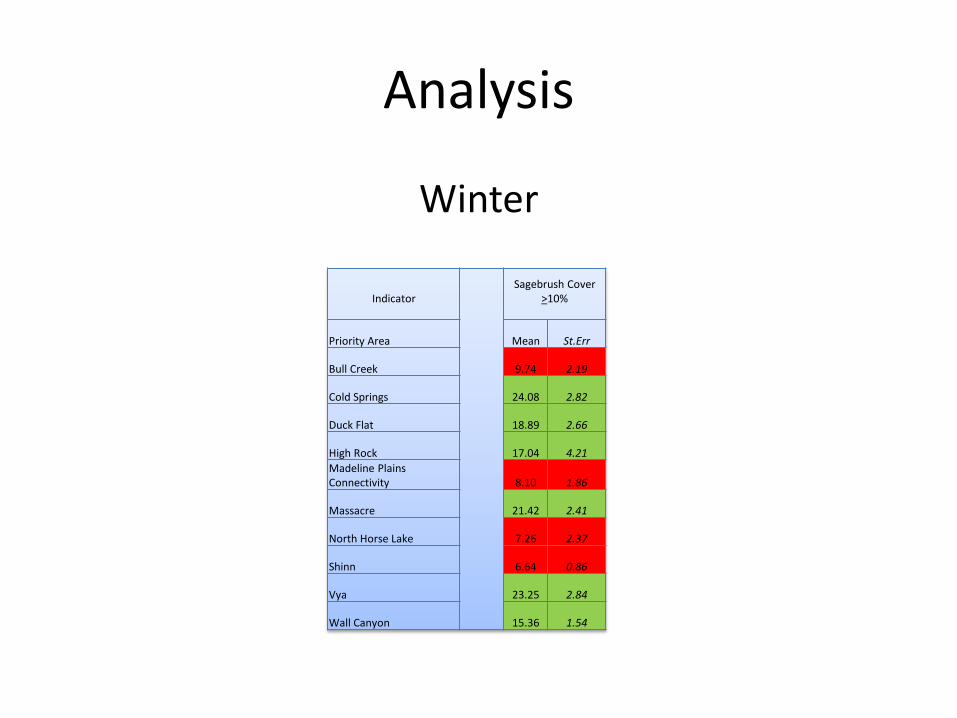
Analysis
Winter
Indicator
Sagebrush Cover >10%
Priority Area Mean St.Err
Bull Creek 9.74 2.19
Cold Springs 24.08 2.82
Duck Flat 18.89 2.66
High Rock 17.04 4.21
Madeline Plains Connectivity 8.10 1.86
Massacre 21.42 2.41
North Horse Lake 7.26 2.37
Shinn 6.64 0.86
Vya 23.25 2.84
Wall Canyon 15.36 1.54

Management Actions
• Fire protection priorities and fuel breaks
• Emergency Stabilization and Rehab activities
• Invasive annual grass control
• Restoration activities (sage-brush, shrubs, forbs, invasive annual grasses)
• Grazing management
• Wild horse and burro management
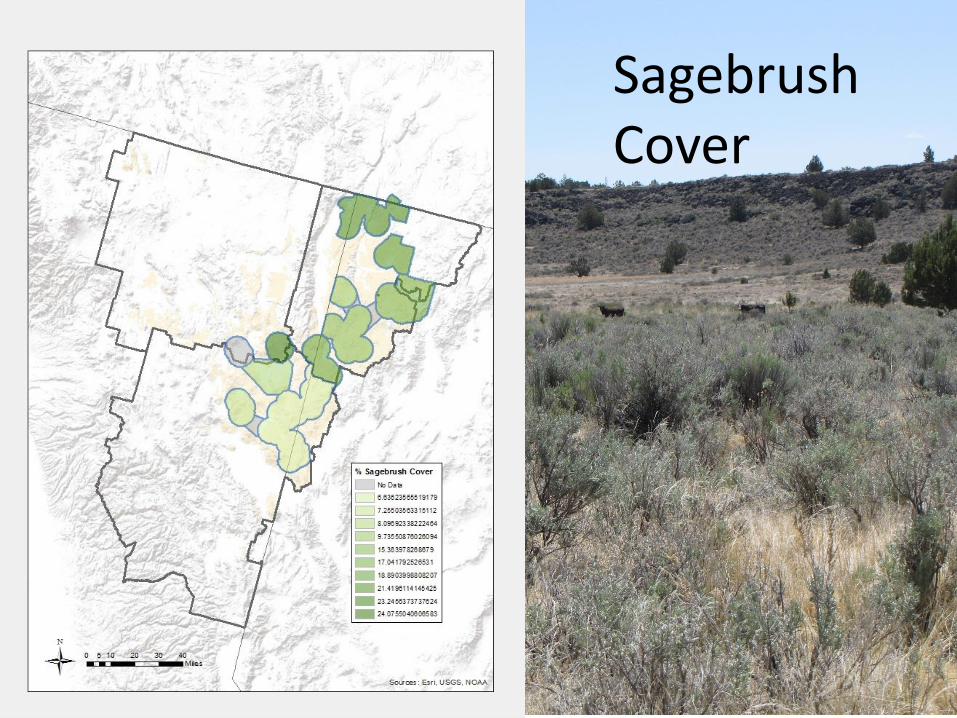
Sagebrush Cover
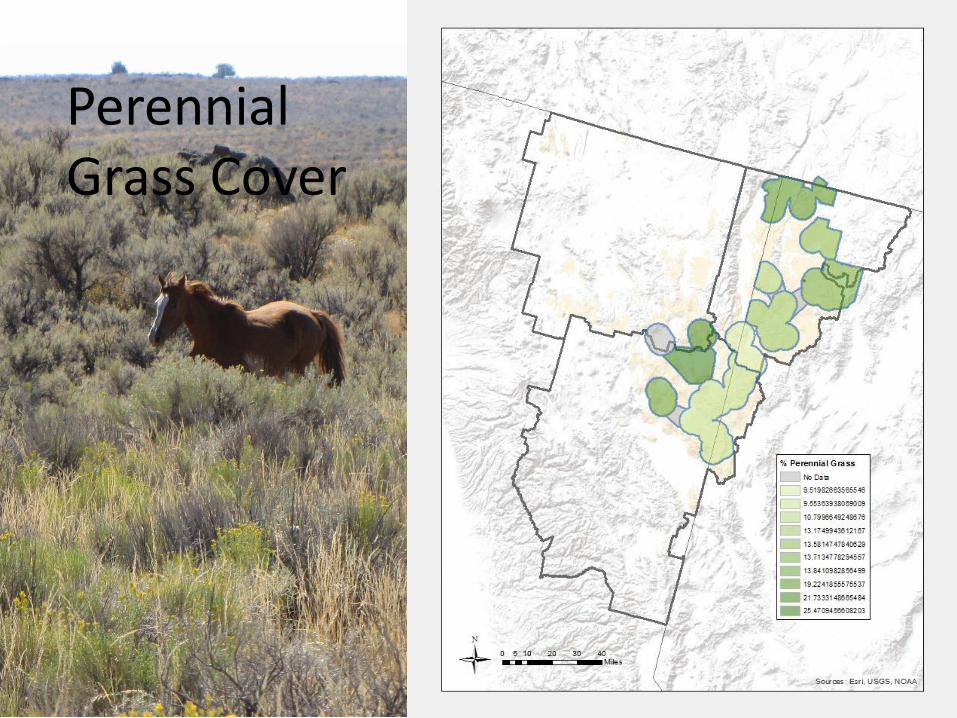
Perennial Grass Cover

Total Shrub Cover
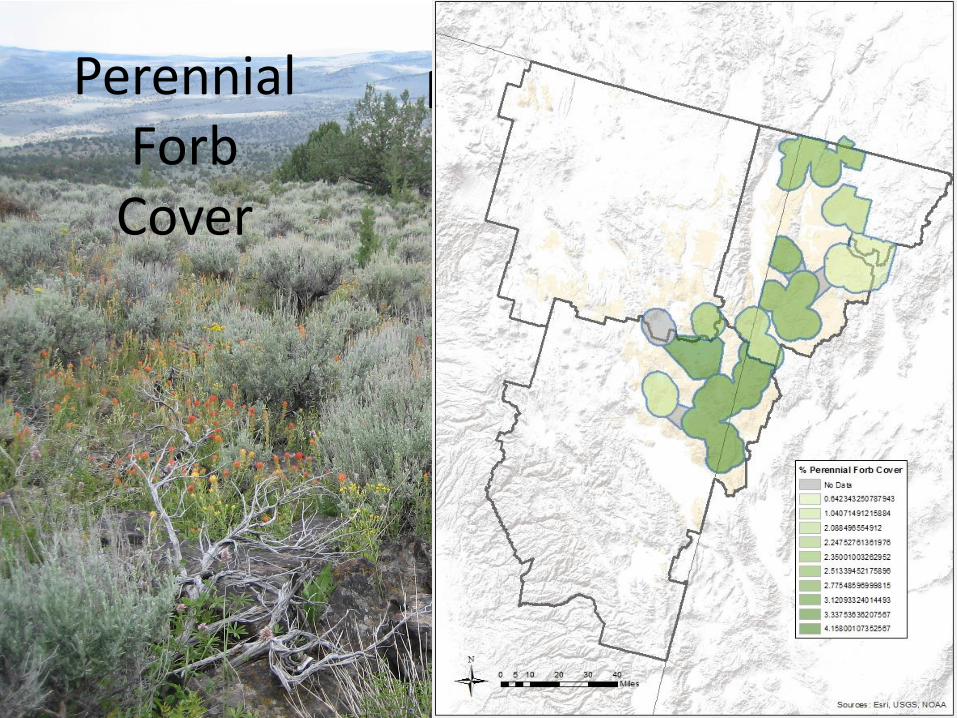
Map Perennial Forb
Cover
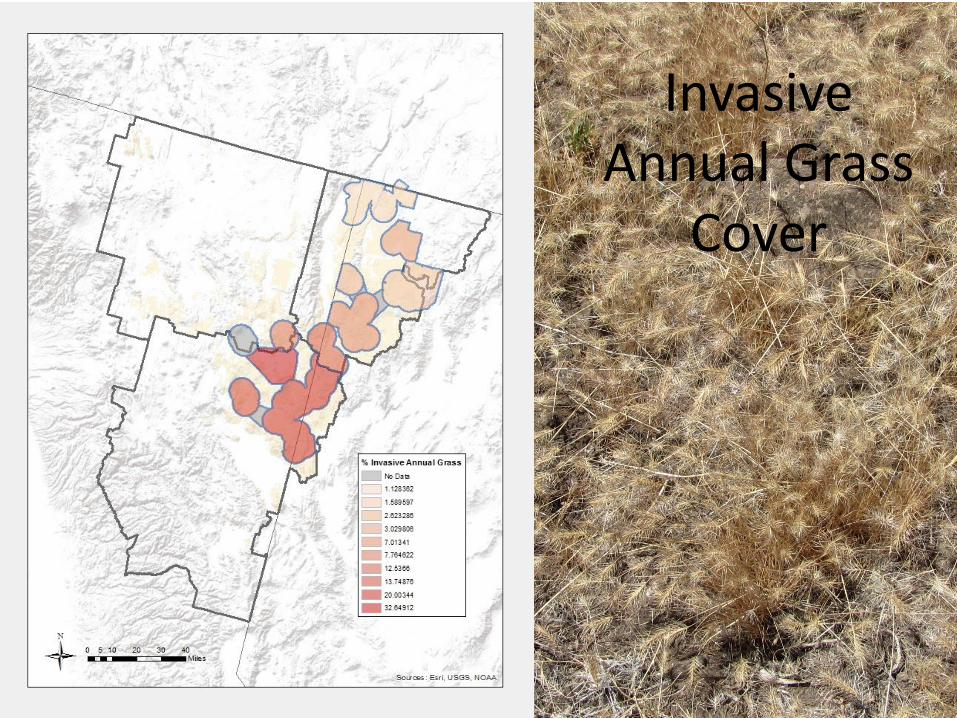
Invasive Annual Grass
Cover
Next Steps
• Continue collecting aquatic and terrestrial core indicators for the 2015 field season
• Include collection of supplemental indicators for riparian vegetation in 2015
• Utilize remote sensing and aquatic core indicators to answer management questions
Special Thanks
• Field Offices – Eagle Lake, Alturas, & Surprise
• ARS Jornada – Sarah McCord and Jason Karl
• NOC – Emily Kachergis, Matthew Bobo, Sarah Lamagna
• WO – Gordon Toevs
• USGS