Embed Size (px)
Citation preview
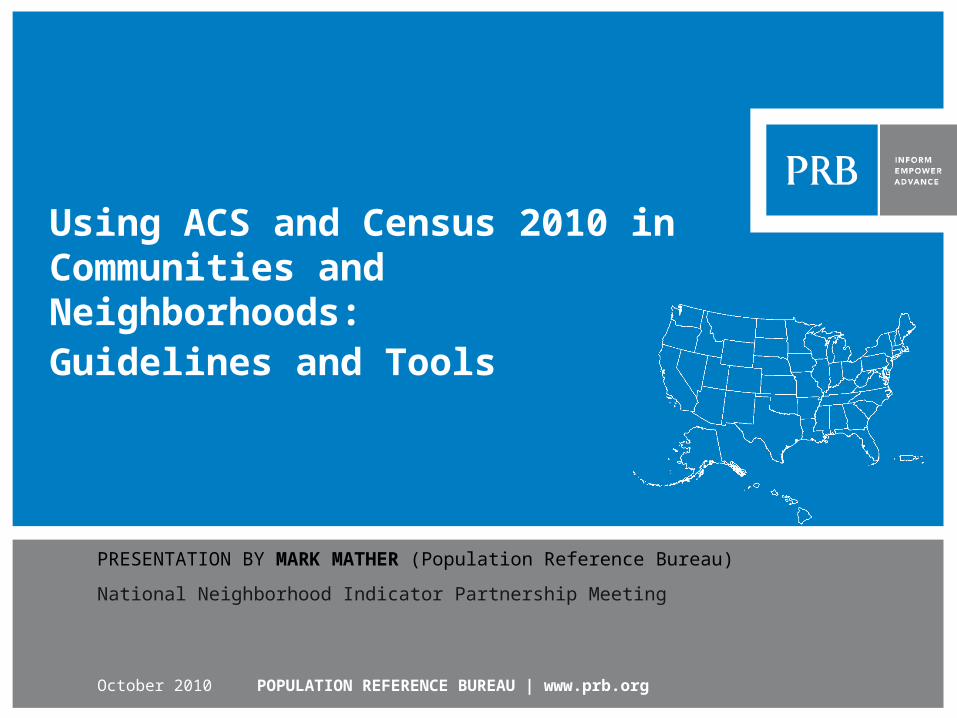
Using ACS and Census 2010 in Communities and Neighborhoods: Guidelines and Tools
POPULATION REFERENCE BUREAU | www.prb.org
PRESENTATION BY MARK MATHER (Population Reference Bureau)
National Neighborhood Indicator Partnership Meeting
October 2010
© 2010 Population Reference Bureau. All rights reserved. www.prb.org
Focus of Presentation New data from the ACS and 2010 Census:
What’s coming out and when?
Issues around data accuracy and comparability
Some practical guidelines for working with ACS data
A new online tutorial for ACS data users
© 2010 Population Reference Bureau. All rights reserved. www.prb.org
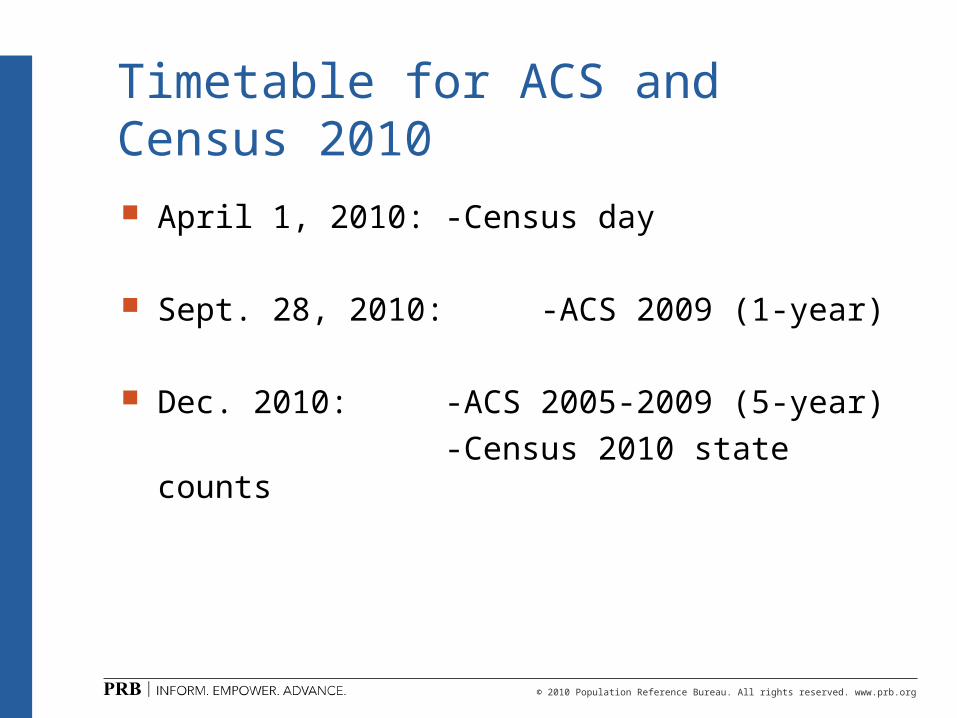
Timetable for ACS and Census 2010
April 1, 2010: -Census day
Sept. 28, 2010: -ACS 2009 (1-year)
Dec. 2010: -ACS 2005-2009 (5-year)
-Census 2010 state counts
© 2010 Population Reference Bureau. All rights reserved. www.prb.org
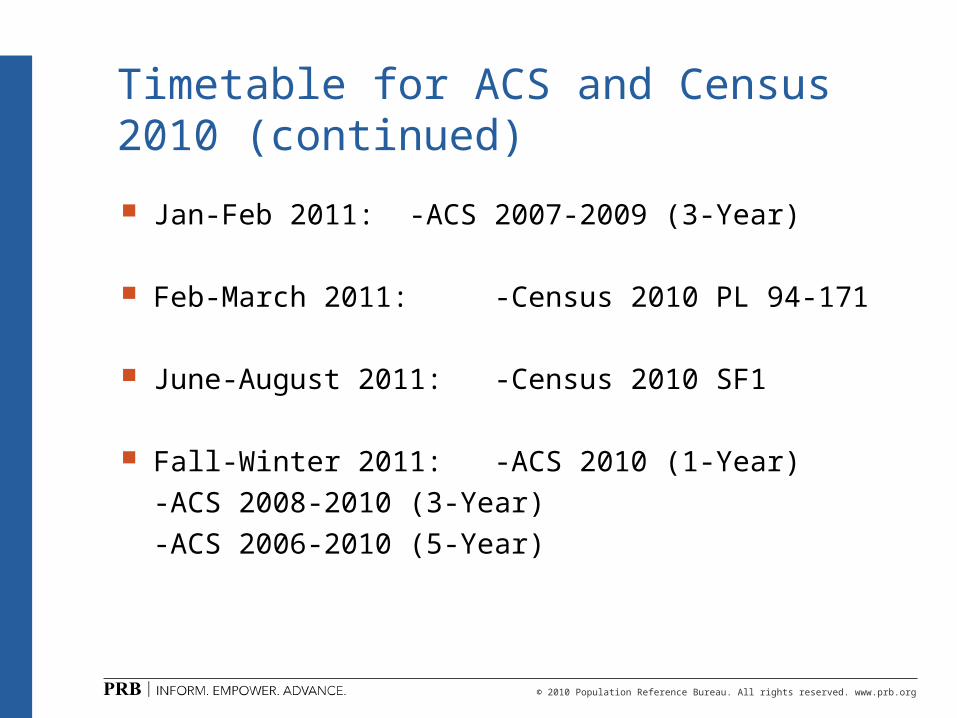
Timetable for ACS and Census 2010 (continued)
Jan-Feb 2011: -ACS 2007-2009 (3-Year)
Feb-March 2011: -Census 2010 PL 94-171
June-August 2011: -Census 2010 SF1
Fall-Winter 2011: -ACS 2010 (1-Year)
-ACS 2008-2010 (3-Year)
-ACS 2006-2010 (5-Year)
© 2010 Population Reference Bureau. All rights reserved. www.prb.org
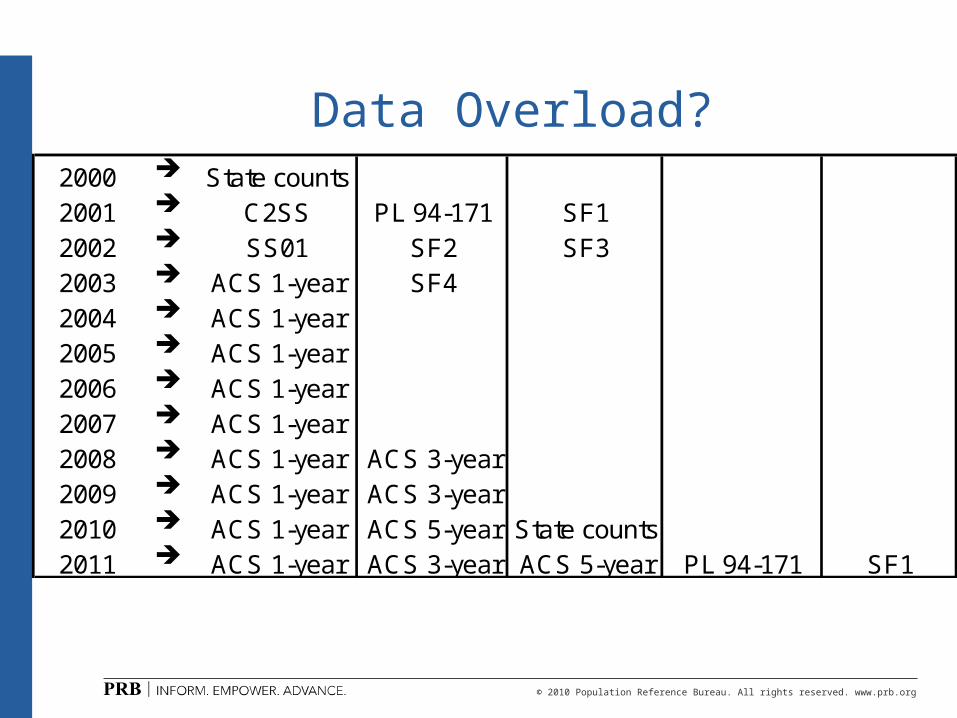
Data Overload?2000 State counts2001 C2SS PL 94-171 SF12002 SS01 SF2 SF32003 ACS 1-year SF42004 ACS 1-year2005 ACS 1-year2006 ACS 1-year2007 ACS 1-year2008 ACS 1-year ACS 3-year2009 ACS 1-year ACS 3-year2010 ACS 1-year ACS 5-year State counts2011 ACS 1-year ACS 3-year ACS 5-year PL 94-171 SF1

© 2010 Population Reference Bureau. All rights reserved. www.prb.org
Accuracy of ACS Estimates (Nonsampling Error)
ACS population and housing totals are controlled to official population estimates: National, state, and county estimates by age, sex,
race, and Hispanic origin
Estimates are only as accurate as the decennial census counts on which they are based
Estimates become less accurate over the decade

© 2010 Population Reference Bureau. All rights reserved. www.prb.org
U.S. Population Trends, 1990-2010
Source: U.S. Census Bureau.
220,000
230,000
240,000
250,000
260,000
270,000
280,000
290,000
300,000
310,000
320,000
1990 1992 1994 1996 1998 2000 2002 2004 2006 2008 2010
U.S. population, in thousands
Census 2000
Census 2010?

© 2010 Population Reference Bureau. All rights reserved. www.prb.org
A Low Census Count in 2010?
Will we pay the price for a high count in 2000?
Expanded efforts to reduce duplicate records
Declining immigration levels
Potentially lower participation rates of immigrants in census

© 2010 Population Reference Bureau. All rights reserved. www.prb.org
Implications for ACS Comparisons
2009 ACS 2009 ACS estimates controlled to Census 2000 (or
population estimates based on Census 2000) Numbers may be inconsistent with Census 2010
2010 ACS estimates 2010 ACS estimates controlled to Census 2010 Numbers may be inconsistent with previous ACS
estimates
Counts are more likely to cause problems than characteristics (percents)
© 2010 Population Reference Bureau. All rights reserved. www.prb.org
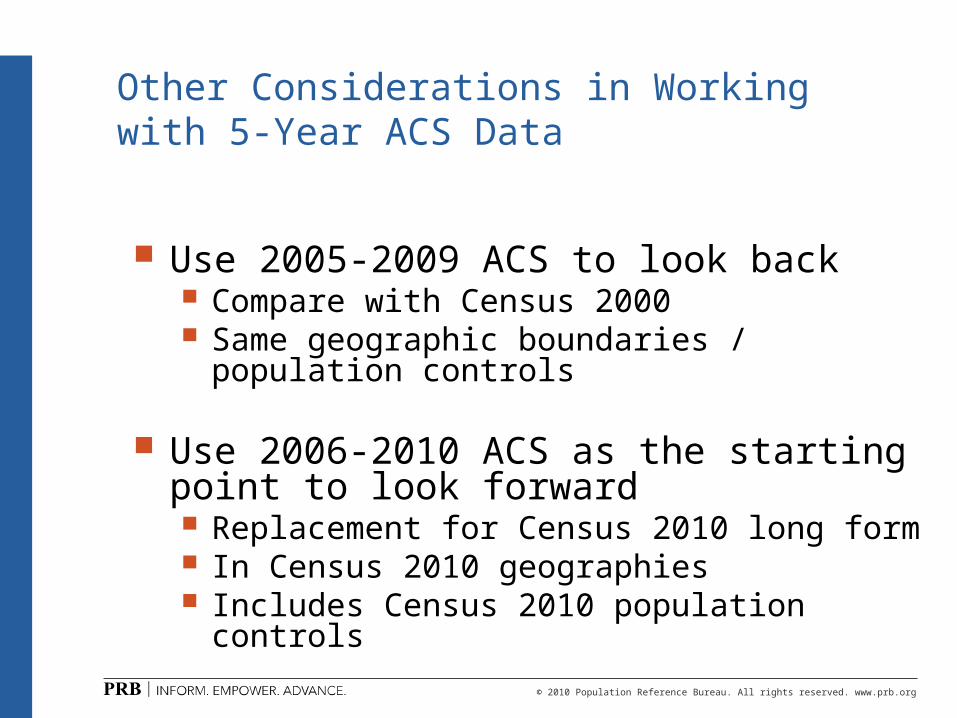
Other Considerations in Working with 5-Year ACS Data
Use 2005-2009 ACS to look back Compare with Census 2000 Same geographic boundaries / population controls
Use 2006-2010 ACS as the starting point to look forward Replacement for Census 2010 long form In Census 2010 geographies Includes Census 2010 population controls
© 2010 Population Reference Bureau. All rights reserved. www.prb.org
Other Considerations in Making Comparisons
Use caution in making comparisons with 2005 and earlier ACS, which excluded group quarters
When comparing ACS estimates, use the same period length for each estimate
Use caution in comparing multiyear estimates with overlapping years
© 2010 Population Reference Bureau. All rights reserved. www.prb.org
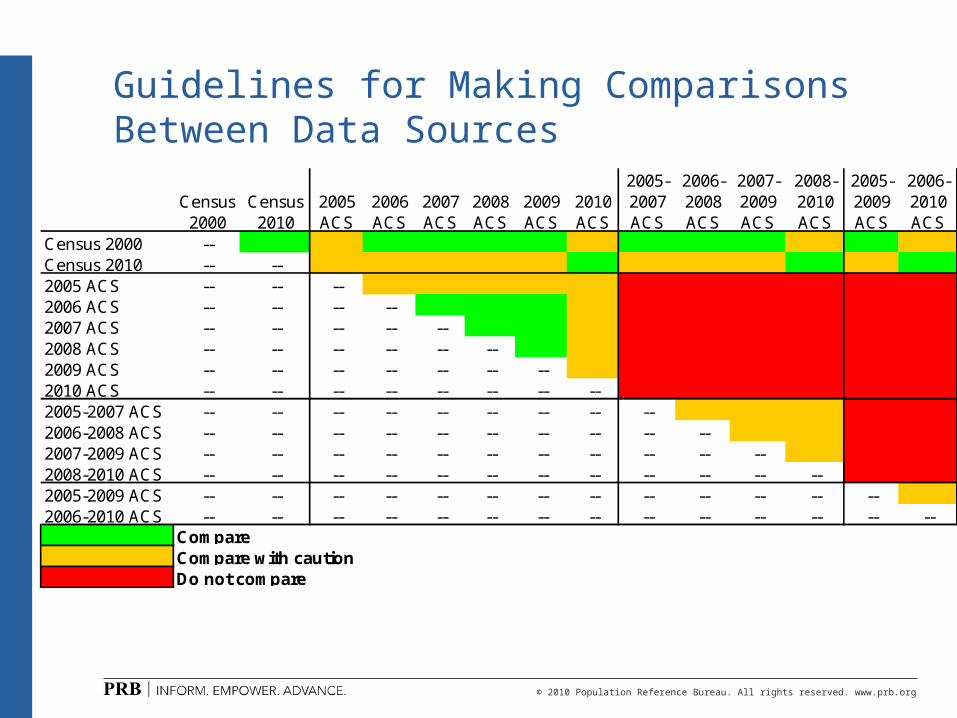
Guidelines for Making Comparisons Between Data Sources
Census 2000
Census 2010
2005 ACS
2006 ACS
2007 ACS
2008 ACS
2009 ACS
2010 ACS
2005-2007 ACS
2006-2008 ACS
2007-2009 ACS
2008-2010 ACS
2005-2009 ACS
2006-2010 ACS
Census 2000 --Census 2010 -- --2005 ACS -- -- --2006 ACS -- -- -- --2007 ACS -- -- -- -- --2008 ACS -- -- -- -- -- --2009 ACS -- -- -- -- -- -- --2010 ACS -- -- -- -- -- -- -- --2005-2007 ACS -- -- -- -- -- -- -- -- --2006-2008 ACS -- -- -- -- -- -- -- -- -- --2007-2009 ACS -- -- -- -- -- -- -- -- -- -- --2008-2010 ACS -- -- -- -- -- -- -- -- -- -- -- --2005-2009 ACS -- -- -- -- -- -- -- -- -- -- -- -- --2006-2010 ACS -- -- -- -- -- -- -- -- -- -- -- -- -- --
CompareCompare with cautionDo not compare

© 2010 Population Reference Bureau. All rights reserved. www.prb.org
Accuracy of ACS Estimates (Sampling Error)
Census 2000 ACS 5-Year
Initial Addresses
18 million 14.5 million
Final interviews
16.4 million 10 million
HH Sampling Rate
1-in-6 1-in-9
© 2010 Population Reference Bureau. All rights reserved. www.prb.org
14
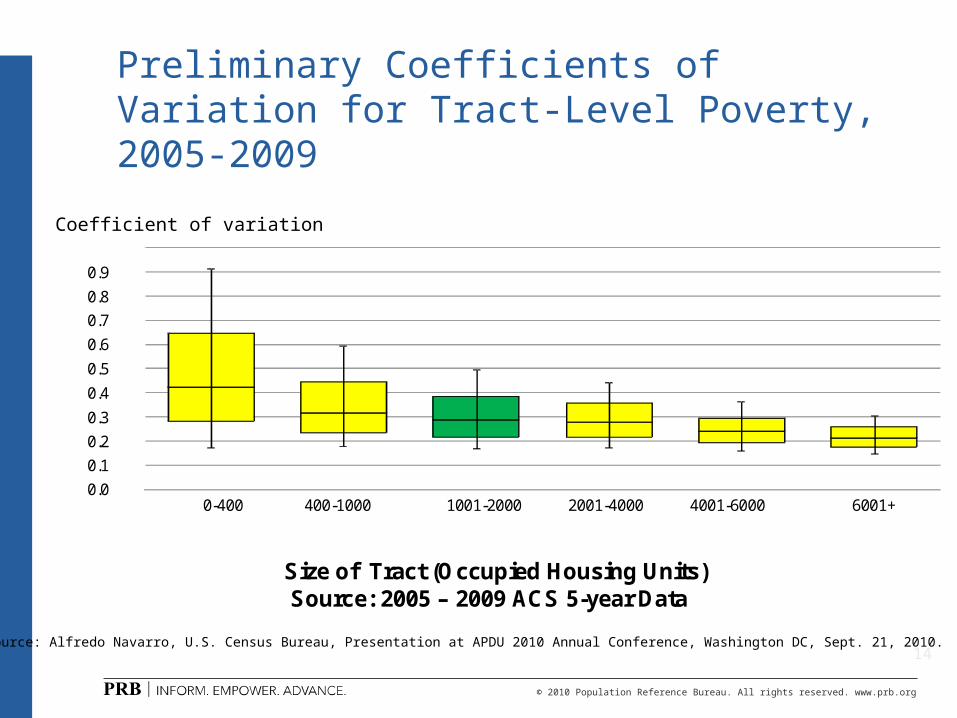
Preliminary Coefficients of Variation for Tract-Level Poverty, 2005-2009
0.0 0.1 0.2 0.3 0.4 0.5 0.6 0.7 0.8 0.9 1.0
0 - 0-400 400-1000 - 1001-2000 2001-4000 - 4001-6000 6001+
CV
Size of Tract (Occupied Housing Units) Source: 2005 – 2009 ACS 5-year Data
Distribution %
Coefficient of variation
Source: Alfredo Navarro, U.S. Census Bureau, Presentation at APDU 2010 Annual Conference, Washington DC, Sept. 21, 2010.

© 2010 Population Reference Bureau. All rights reserved. www.prb.org
15
Hypothetical Confidence Intervals For Tract-Level Poverty Rates, 2005-2009
ScenarioPoverty
RateCoefficient of Variation
Confidence Interval
Best Case 14 0.2 (9.4 - 18.6)Typical Case 14 0.3 (7.1 - 20.9)Worst Case 14 0.4 (4.8 - 23.2)Note: Data represent a typical tract with between 1,000-2,000 occupied housing units.
© 2010 Population Reference Bureau. All rights reserved. www.prb.org
Options for Dealing with Small Numbers
Ignore the potential error (not recommended)
Present measures of reliability (MOEs are best for nontechnical audiences)
Suppress unreliable estimates
Aggregate data across geographic areas

© 2010 Population Reference Bureau. All rights reserved. www.prb.org
Accessing 5-Year ACS Data
American FactFinder Data available down to tract level No table restrictions based on reliability Selected Population Profiles not available
Consider using ACS Summary Files as alternative source Includes all Detailed Tables in one place Only source for block-group level data (~300
tables) Need SAS / SPSS / Powerful PC or Server
© 2010 Population Reference Bureau. All rights reserved. www.prb.org
Potential Improvements to ACS
Increase in ACS sample size
Improved sampling techniques to reduce error for small areas
Improved population controls for small geographic areas
© 2010 Population Reference Bureau. All rights reserved. www.prb.org
Final Thoughts
The ACS has its limitations but it’s all that we have and has a lot of potential
Continued funding is critical for tracking social and economic change
We need to use the ACS data and advocate for it’s continuation and expansion: Larger sample size
© 2010 Population Reference Bureau. All rights reserved. www.prb.org
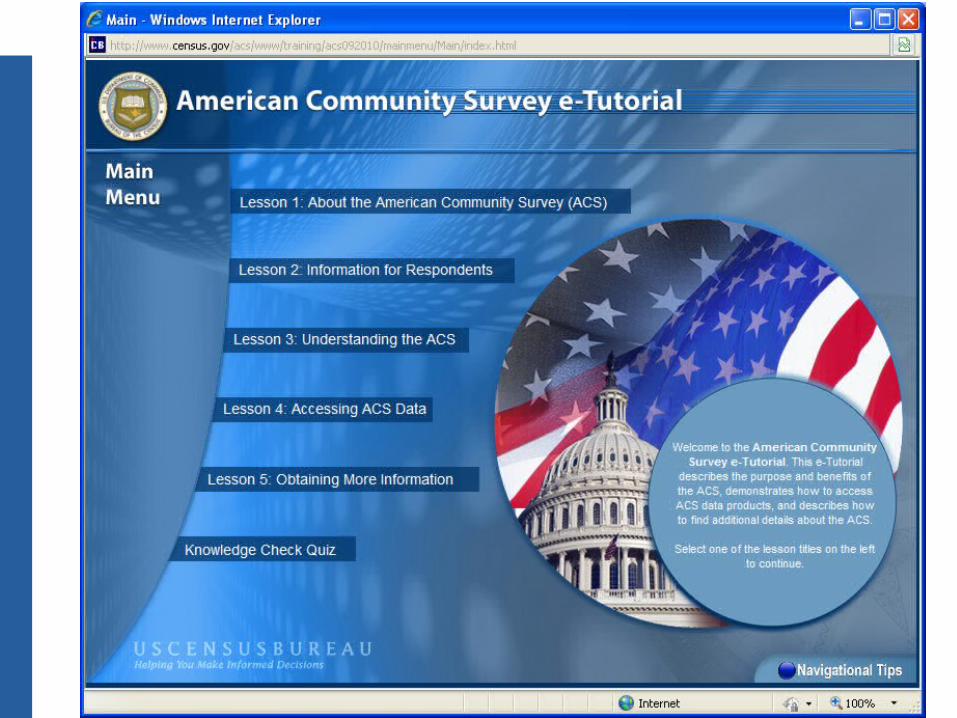
Two New Online Tutorials
U.S. Census Bureau E-Tutorial (http://www.census.gov/acs/www/guidance_for_data_users/e_tutorial/)
ACS basics How to access data
PRB Online Tutorial(http://www.icadmedia.com/PopRefBureau/intro_basics.html) ACS basics Issues around multiyear estimates, making
comparisons, differences from Census 2000 How to access data Feedback wanted!
© 2010 Population Reference Bureau. All rights reserved. www.prb.org
Two New Online Tutorials
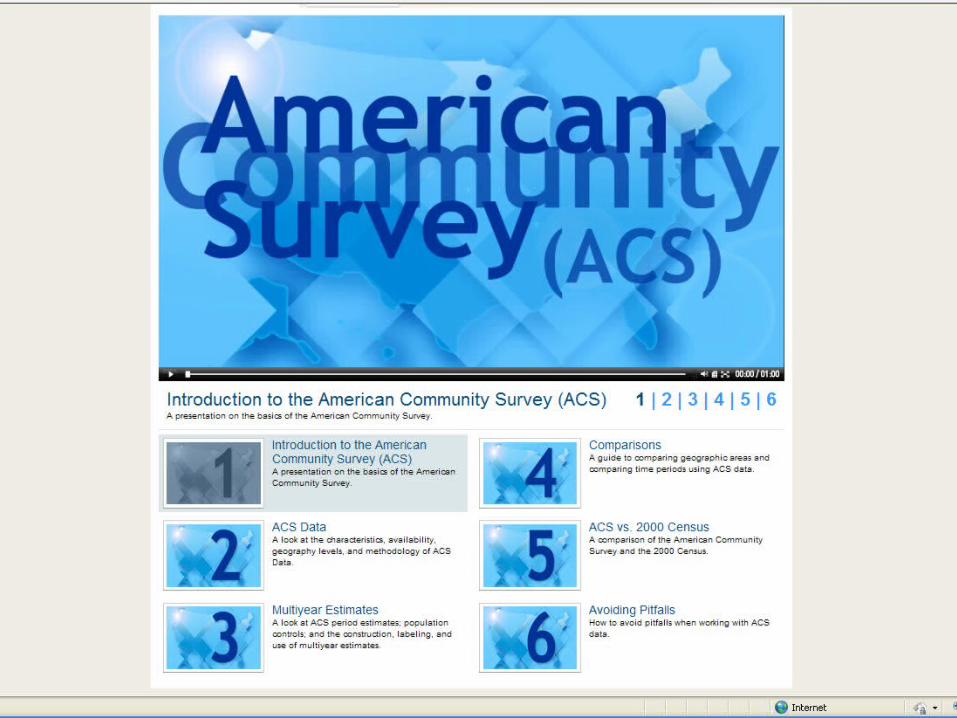
© 2010 Population Reference Bureau. All rights reserved. www.prb.org
Two New Online Tutorials
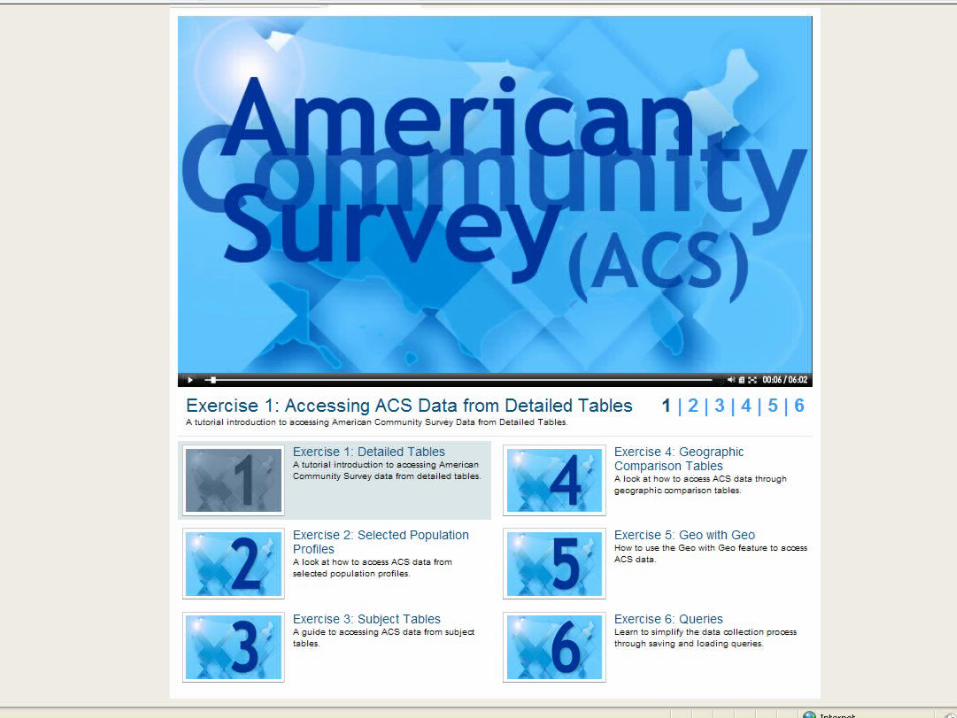
© 2010 Population Reference Bureau. All rights reserved. www.prb.org
Two New Online Tutorials

© 2010 Population Reference Bureau. All rights reserved. www.prb.org
For More Information…
Mark [email protected]