Embed Size (px)
Citation preview

using 3Dand visualising 3D

“sculptural” window elements
• highlighting
• drop shadows
• may help distinguish features– figure ground separation– e.g. X Motif – everything in
sculpture!
• improve affordances– buttons are for pushing

scientific visualisation (I)
• 3D graphs for non 3D data– 3D histograms etc.– hard to see 3D for static pictures– use colour as redundant cue– use movement– allow user controlled rotation etc.

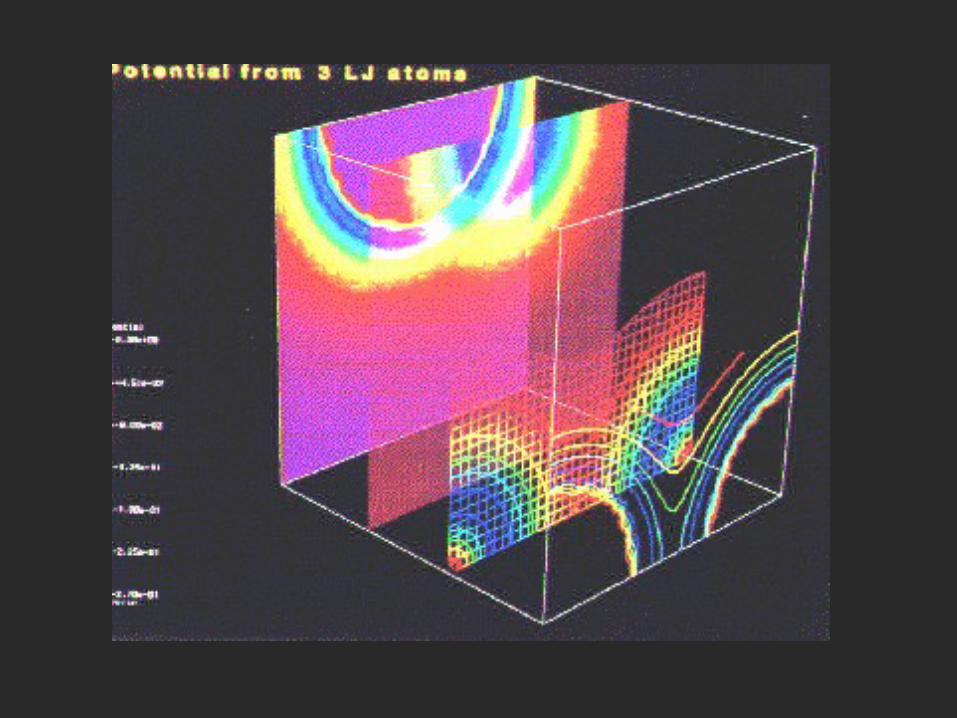
scientific visualisation (II)real 3 D data
• scalar data– temperature, density, pressure
• vector data– wind flows, electromagnetic fields


seeing inside?
• Problem - we only see the surface
• Solution - reduce ‘density’ of data– points OK (stars) - show samples only– translucence– slices– lines

seeing inside - use interaction!
• move in the environment– look around the back!
• manipulate things– pick up, open up
• control cuts, density etc.
• insert markers– virtual bubbles, smoke


information visualisation
• abstract data
• use 3D to increase virtual space
• humans understand physical world


Hierarchical data


Temporal fusion
• moving changing images
• successive images
• parallel changes