Embed Size (px)
Citation preview

Catalog of Earthquake Hypocenters at Alaskan Volcanoes: January 1 through December 31, 2005
By James P. Dixon1, Scott D. Stihler2, John A. Power1, Guy Tytgat2, Steve Estes2, and Stephen R. McNutt2
Open-File Report 2006-1264 2006 Any use of trade, firm, or product names is for descriptive purposes only and does not imply endorsement by the U.S. Government. U.S. DEPARTMENT OF THE INTERIOR U.S. GEOLOGICAL SURVEY 1 U. S. Geological Survey Alaska Science Center, Alaska Volcano Observatory 4200 University Drive, Anchorage, AK 99508-4667 2 University of Alaska Fairbanks - Geophysical Institute, 903 Koyukuk Drive, Fairbanks, AK 99775-7320

2
CONTENTS Introduction...................................................................................................3 Instrumentation .............................................................................................5 Data Acquisition and Reduction ...................................................................9 Seismic Velocity Models .............................................................................11 Seismicity.....................................................................................................12 Summary ......................................................................................................15 References....................................................................................................16 Appendix A: Maps of the earthquakes located in 2005...............................18 Appendix B: Parameters for all AVO seismograph stations .......................47 Appendix C: Maps of permanent AVO seismograph stations.....................52 Appendix D: Station operational status .......................................................66 Appendix E: Seismic Velocity models ........................................................71 Appendix F: Maps showing volcanic zones modeled using cylinders .......75 Appendix G: Previous AVO Earthquake Catalogs .....................................77 Appendix H: Selected AVO papers published in 2005 ...............................78

3
Introduction
The Alaska Volcano Observatory (AVO), a cooperative program of the U.S.
Geological Survey, the Geophysical Institute of the University of Alaska Fairbanks, and the
Alaska Division of Geological and Geophysical Surveys, has maintained seismic
monitoring networks at historically active volcanoes in Alaska since 1988 (Figure 1). The
primary objectives of the seismic program are the real-time seismic monitoring of active,
potentially hazardous, Alaskan volcanoes and the investigation of seismic processes
associated with active volcanism. This catalog presents calculated earthquake hypocenters
and seismic phase arrival data, and details changes in the seismic monitoring program for
the period January 1 through December 31, 2005. A list of previous catalogs can be found
in Appendix G.
Figure 1. Orange squares show the location of all Alaskan volcanoes seismically
instrumented by AVO as of 2005. Volcanoes with no documented historical unrest but still considered hazardous, based on late Holocene eruptive activity are italicized.

4
The AVO seismograph network was used to monitor the seismic activity at thirty-
two volcanoes within Alaska in 2005 (Figure 1). The network was augmented by two new
subnetworks to monitor the Semisopochnoi Island volcanoes and Little Sitkin Volcano.
Seismicity at these volcanoes was still being studied at the end of 2005 and has not yet been
added to the list of permanently monitored volcanoes in the AVO weekly update. Following
an extended period of monitoring to determine the background seismicity at the Mount
Peulik, Ukinrek Maars, and Korovin Volcano, formal monitoring of these volcanoes began
in 2005. AVO located 9,012 earthquakes in 2005 (Table 1).
Table 1: Number of earthquakes located per year by AVO for the last ten years.
Year Earthquakes located per year Volcanoes with seismograph networks 1996 6,466 15 1997 2,930 17 1998 2,873 19 1999 2,769 21 2000 1,551 21 2001 1,427 23 2002 7,242 24 2003 3,911 27 2004 6,928 28 2005 9,012 32
Monitoring highlights in 2005 include: (1) seismicity at Mount Spurr remaining
above background, starting in February 2004, through the end of the year and into 2006; (2)
an increase in seismicity at Augustine Volcano starting in May 2005, and continuing
through the end of the year into 2006; (3) volcanic tremor and seismicity related to low-
level strombolian activity at Mount Veniaminof in January to March and September; and
(4) a seismic swarm at Tanaga Volcano in October and November (Table 2).
This catalog includes: (1) descriptions and locations of seismic instrumentation
deployed in the field in 2005; (2) a description of earthquake detection, recording, analysis,
and data archival systems; (3) a description of seismic velocity models used for earthquake
locations; (4) a summary of earthquakes located in 2005; and (5) an accompanying UNIX
tar-file with a summary of earthquake origin times, hypocenters, magnitudes, phase arrival
5
times, and location quality statistics; daily station usage statistics; and all HYPOELLIPSE
(Lahr, 1999) files used to determine the earthquake locations in 2005.
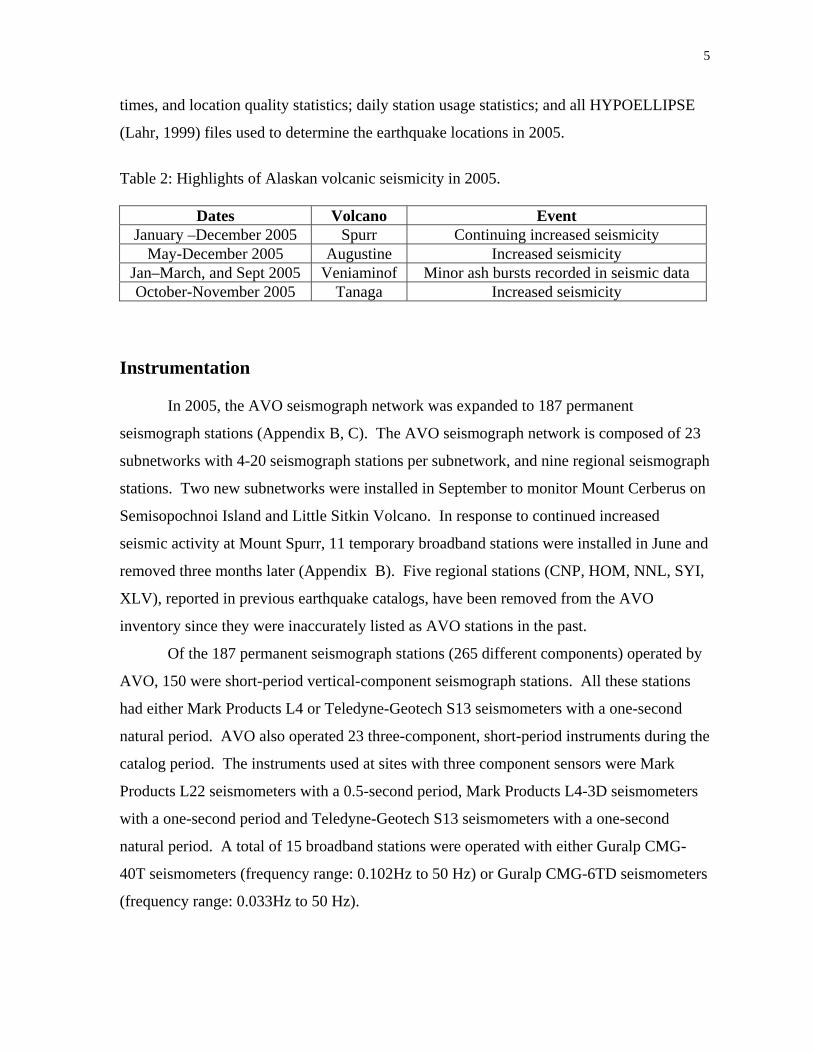
Table 2: Highlights of Alaskan volcanic seismicity in 2005.
Dates Volcano Event
January –December 2005 Spurr Continuing increased seismicity May-December 2005 Augustine Increased seismicity
Jan–March, and Sept 2005 Veniaminof Minor ash bursts recorded in seismic data October-November 2005 Tanaga Increased seismicity
Instrumentation
In 2005, the AVO seismograph network was expanded to 187 permanent
seismograph stations (Appendix B, C). The AVO seismograph network is composed of 23
subnetworks with 4-20 seismograph stations per subnetwork, and nine regional seismograph
stations. Two new subnetworks were installed in September to monitor Mount Cerberus on
Semisopochnoi Island and Little Sitkin Volcano. In response to continued increased
seismic activity at Mount Spurr, 11 temporary broadband stations were installed in June and
removed three months later (Appendix B). Five regional stations (CNP, HOM, NNL, SYI,
XLV), reported in previous earthquake catalogs, have been removed from the AVO
inventory since they were inaccurately listed as AVO stations in the past.
Of the 187 permanent seismograph stations (265 different components) operated by
AVO, 150 were short-period vertical-component seismograph stations. All these stations
had either Mark Products L4 or Teledyne-Geotech S13 seismometers with a one-second
natural period. AVO also operated 23 three-component, short-period instruments during the
catalog period. The instruments used at sites with three component sensors were Mark
Products L22 seismometers with a 0.5-second period, Mark Products L4-3D seismometers
with a one-second period and Teledyne-Geotech S13 seismometers with a one-second
natural period. A total of 15 broadband stations were operated with either Guralp CMG-
40T seismometers (frequency range: 0.102Hz to 50 Hz) or Guralp CMG-6TD seismometers
(frequency range: 0.033Hz to 50 Hz).
6
The majority of the short-period stations were digitized at 100 samples/second (sps).
The Semisopochnoi and Little Sitkin subnetworks were recorded at 50 sps due to limitations
in the broadband telemetry between the recording hub and Anchorage. Broadband stations
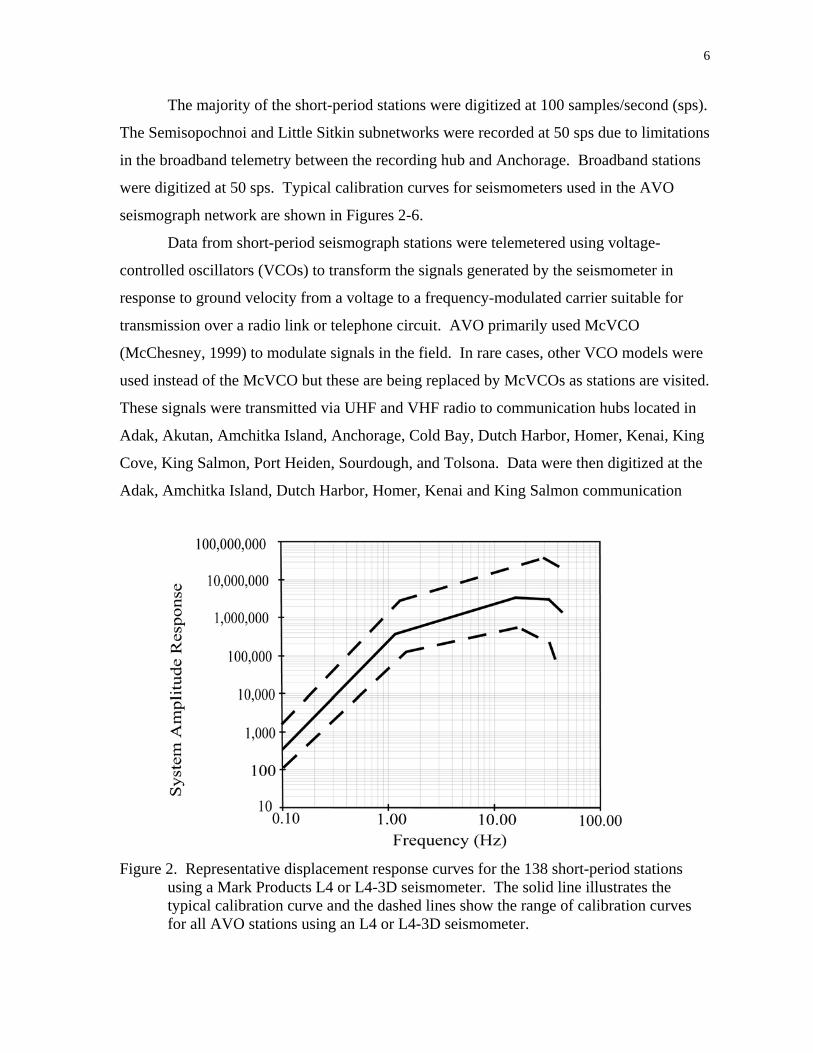
were digitized at 50 sps. Typical calibration curves for seismometers used in the AVO
seismograph network are shown in Figures 2-6.
Data from short-period seismograph stations were telemetered using voltage-
controlled oscillators (VCOs) to transform the signals generated by the seismometer in
response to ground velocity from a voltage to a frequency-modulated carrier suitable for
transmission over a radio link or telephone circuit. AVO primarily used McVCO
(McChesney, 1999) to modulate signals in the field. In rare cases, other VCO models were
used instead of the McVCO but these are being replaced by McVCOs as stations are visited.
These signals were transmitted via UHF and VHF radio to communication hubs located in
Adak, Akutan, Amchitka Island, Anchorage, Cold Bay, Dutch Harbor, Homer, Kenai, King
Cove, King Salmon, Port Heiden, Sourdough, and Tolsona. Data were then digitized at the
Adak, Amchitka Island, Dutch Harbor, Homer, Kenai and King Salmon communication
Figure 2. Representative displacement response curves for the 138 short-period stations
using a Mark Products L4 or L4-3D seismometer. The solid line illustrates the typical calibration curve and the dashed lines show the range of calibration curves for all AVO stations using an L4 or L4-3D seismometer.

7
Figure 3. Representative displacement response curves for the 17 short-period stations
using a Mark Products L22 seismometer. The solid line illustrates the typical calibration curve and the dashed lines show the range of calibration curves for all AVO stations using an L22 seismometer.
Figure 4. Representative displacement response curves for the 16 short-period stations
using a Teledyne-Geotech S13 seismometer. The solid line illustrates the typical calibration curve and the dashed lines show the range of calibration curves for all AVO stations using an S13 seismometer.

8
Figure 5. Representative displacement response curves for the two broadband stations using a Guralp CMG-40T seismometer. The solid line illustrates the typical calibration curve and the dashed lines show the range of calibration curves for all AVO stations using a Guralp CMG-40T seismometer.
Figure 6. Representative displacement response curves for the 24 broadband stations using a Guralp CMG-6TD seismometer. The solid line illustrates the typical calibration curve and the dashed lines show the range of calibration curves for all AVO stations using a Guralp CMG-6TD seismometer.

9
hubs and directed to AVO offices via high speed digital circuits. From all other hubs,
signals were relayed via leased telephone circuits to AVO offices in Anchorage and
Fairbanks where the signals were digitized. Data from broadband seismograph stations
were digitized at the seismograph station site and transmitted digitally using
spread-spectrum radios to communication hubs in Akutan, Anchorage, Dutch Harbor,
Homer, and King Salmon. These data were forwarded to AVO offices in Fairbanks and
Anchorage via leased telephone circuits.
Locations and descriptions for all AVO stations operated during 2005 are contained
in Appendix B. Maps showing the locations of permanent stations with respect to
individual volcanoes are contained in Appendix C. Estimates of each station's operational
status for the catalog period are shown in Appendix D. Other station information, such as
calibration information contained in the file CALDATA.PRM, is available within the
associated compressed UNIX tar-file.
Data Acquisition and Reduction
Data acquisition for the AVO seismograph network was accomplished with
duplicate EARTHWORM systems (Johnson, 1995) located at AVO offices in Anchorage
and Fairbanks, providing a backup in case of failure at either location. Data were recorded
in continuous and event detected modes. Event detected data were collected using the
EARTHWORM modules, ‘Carlstatrig’ and ‘Carlsubtrig’. The ‘Carlstatrig’ parameters were
set as follows: Long-term-average (LTA) time = 8 seconds, Ratio = 2.3, and Quiet = 4.
‘Carlsubtrig’ was modified such that a two-letter code was appended to the filename of each
trigger to identify which subnetwork triggered or if the event was a regional trigger. If four
or more subnetworks triggered on the same event, all data were saved in a single trigger.
These network codes are summarized in Table 3. All data are saved in Seismic Analysis
Code (SAC) (Goldstein and others, 1999) format.
Event triggers were processed daily using the interactive seismic data analysis
program XPICK (Robinson, 1990), and the earthquake location program HYPOELLIPSE
(Lahr, 1999). Each event trigger was visually inspected and false triggers were deleted.

10
Table 3: Volcano Subnetwork Designators
Volcano Subnetwork Network Code Akutan ak
Aniakchak an Augustine au
Semisopochnoi ce Dutton dt Iliamna il Gareloi ga
Great Sitkin gs Kanaga ki Katmai ka Volcano ko
Little Sitkin ls Makushin ma
Okmok ok Pavlof pv Peulik pl
Redoubt rd Regional Event rg
Shishaldin sh Spurr sp
Tanaga ta Veniaminof vn Westdahl we Wrangell wa
Each subsequent event was identified by a classification code (Table 4) and stored as a
comment in the event location pick file. This classification system was modeled after that
described by Lahr and others (1994). Earthquakes with a P and S-wave separation of
greater than five seconds on the closest station were assumed to come from non-volcanic
sources and were typically discarded. Each hypocenter was checked using a computer
algorithm that identified events that did not meet the following minimum parameters: three
P-phases, two S-phases, and standard hypocentral errors less than 15 km. If upon
revaluation, the minimum parameters could not be met, the event was removed from the
final catalog listing. For all the 2005 earthquakes in the AVO catalog, the average root-
mean-square travel-time error was 0.126 seconds.

11
Table 4: Classification codes
Event Classification Classification Code Volcano-Tectonic (VT) a Low-Frequency (LF) b
Hybrid h Regional-Tectonic E
Teleseismic T Shore-Ice i
Calibrations C Other non-seismic o Cause unknown x
Seismic Velocity Models
During 2005, AVO employed 11 local seismic velocity models and one regional
seismic velocity model (Appendix E) to locate earthquakes at monitored volcanoes. All
velocity models were one-dimensional models utilizing horizontal layers to approximate the
local seismic velocity structures. Each model, with one exception, assumed a series of
constant velocity layers. The single exception was the Akutan velocity model (Power and
others, 1996), which had a velocity gradient in the top layer overlying a half-space of
constant velocity.
One or more vertical cylinders were used to model the volcanic source zones on all
volcanoes where a local volcano-specific velocity model was used. Earthquakes within
these cylindrical volumes were located with a local model and earthquakes outside of the
cylindrical volumes were located with the regional model. All cylindrical volumes had a
radius of 20 km with the exception of the cylinders centered on Shishaldin Volcano and
Mount Veniaminof. The cylinder centered on Shishaldin Volcano had a radius of 30 km in
order to encompass Isanotski Peaks. The cylinder centered on Mount Veniaminof also had
a radius of 30 km because of the large size of the volcanic edifice. The top of each cylinder
is set at three km above sea level and the bottom is set at a depth of 50 km with respect to
sea level.
The Akutan, Augustine (Power, 1988), Iliamna (Roman and others, 2001), Tanaga
(Power, personal communication, 2005), Veniaminof (Sánchez, 2005) and Westdahl
(Dixon, 2005) velocity models were used to locate hypocenters that fell within cylindrical

12
volumes described above, centered on each respective volcano. The Cold Bay velocity
model (McNutt and Jacob, 1986) was used to locate earthquakes that fell within single
cylindrical volumes centered on Mount Dutton and Pavlof Volcano. Earthquakes on Fisher
Caldera, Isanotski Peaks, and Shishaldin Volcano that fell within the cylindrical regions
centered on Shishaldin Volcano were also located using the Cold Bay velocity model. Five
overlapping cylinders defined the area in which the Spurr velocity model (Jolly and others,
1994) was used, four overlapping cylinders defined the area in which the Redoubt velocity
model (Lahr and others, 1994) was used, and four overlapping cylinders defined the area in
which the Katmai model (Searcy, 2003) was used. The Andreanof velocity model (Toth
and Kisslinger, 1984) was used to locate earthquakes within a volume defined by three
cylinders centered on Kanaga Volcano, Mount Moffet, and Great Sitkin Volcano. Specific
velocity models for Aniakchak Crater, Mount Gareloi, Korovin Volcano, Makushin
Volcano, Okmok Volcano, Mount Peulik, and Mount Wrangell were not available in 2005
and the regional velocity model (Fogleman and others, 1993) was used to locate
earthquakes near these volcanoes. The cylindrical model parameters, regional velocity
model, and volcano-specific models used to locate earthquakes in this report are
summarized in Appendix E. Figures showing the volcanic source zones modeled by
multiple cylinders are shown in Appendix F.
Seismicity
The 9,012 earthquakes located in 2005 represent the highest annual total determined
by AVO in the last ten calendar years and an increase from the 6,928 earthquakes located in
2004 (Dixon, 2005). Of the earthquakes located in the last two years, a total of 6,105
earthquakes in 2004 and 8,146 earthquakes in 2005 were located within 20 km of an active
volcanic center. The numbers of located events at volcanic centers in the last two years, by
seismograph subnetwork, are shown in Table 5.
Using the 2005 earthquake catalog, the magnitude of completeness (Mc) for each
subnetwork was calculated (Table 5). The Mc is the lowest magnitude at which we are
reasonably certain that all events with a magnitude greater than or equal to the Mc were
detected. The Mc was determined using a maximum likelihood estimate of the inflection
13
point in the frequency magnitude distribution using the seismology analysis software
ZMAP (Weimer, 2001).
Four volcanoes, Mount Spurr, Augustine Volcano, Mount Veniaminof and Tanaga
Volcano, showed significant unrest in 2005 and the level of concern color code for each was
raised above green. Of these volcanic centers, Mount Veniaminof and Mount Spurr did not
have an increased level of activity compared to the seismicity in 2004. At Mount
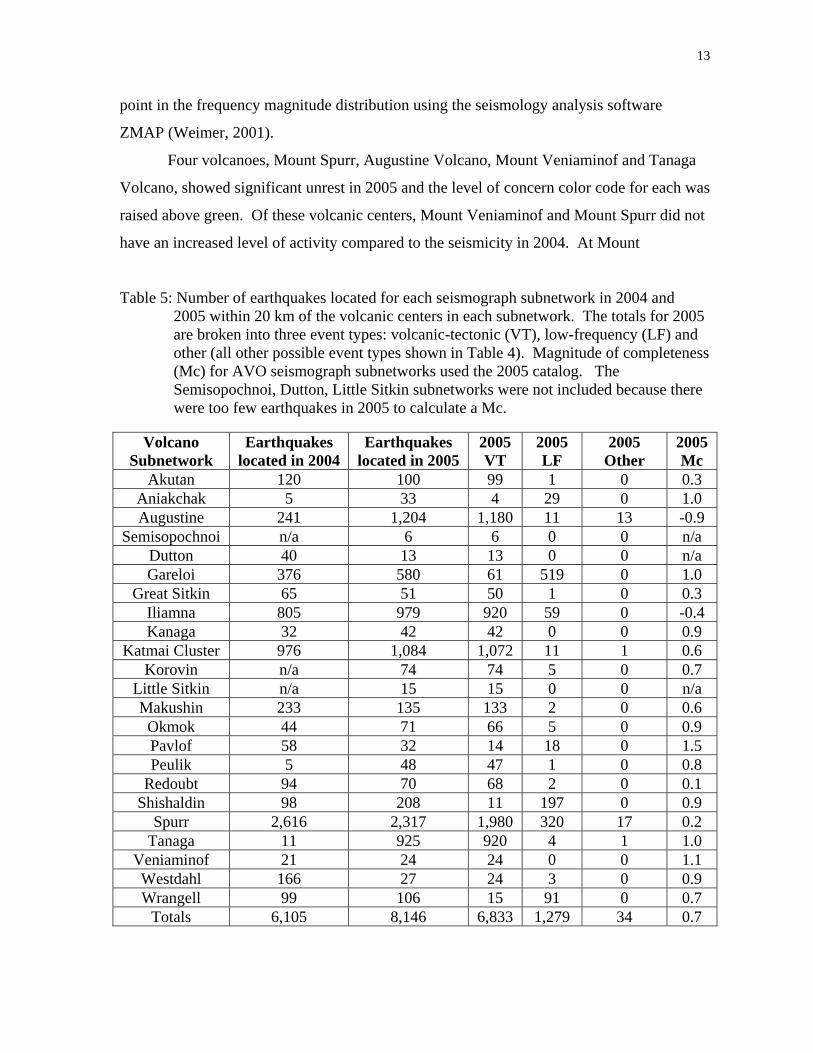
Table 5: Number of earthquakes located for each seismograph subnetwork in 2004 and 2005 within 20 km of the volcanic centers in each subnetwork. The totals for 2005 are broken into three event types: volcanic-tectonic (VT), low-frequency (LF) and other (all other possible event types shown in Table 4). Magnitude of completeness (Mc) for AVO seismograph subnetworks used the 2005 catalog. The Semisopochnoi, Dutton, Little Sitkin subnetworks were not included because there were too few earthquakes in 2005 to calculate a Mc.
Volcano
Subnetwork Earthquakes
located in 2004 Earthquakes
located in 2005 2005 VT
2005 LF
2005 Other
2005 Mc
Akutan 120 100 99 1 0 0.3 Aniakchak 5 33 4 29 0 1.0 Augustine 241 1,204 1,180 11 13 -0.9
Semisopochnoi n/a 6 6 0 0 n/a Dutton 40 13 13 0 0 n/a Gareloi 376 580 61 519 0 1.0
Great Sitkin 65 51 50 1 0 0.3 Iliamna 805 979 920 59 0 -0.4 Kanaga 32 42 42 0 0 0.9
Katmai Cluster 976 1,084 1,072 11 1 0.6 Korovin n/a 74 74 5 0 0.7
Little Sitkin n/a 15 15 0 0 n/a Makushin 233 135 133 2 0 0.6
Okmok 44 71 66 5 0 0.9 Pavlof 58 32 14 18 0 1.5 Peulik 5 48 47 1 0 0.8
Redoubt 94 70 68 2 0 0.1 Shishaldin 98 208 11 197 0 0.9
Spurr 2,616 2,317 1,980 320 17 0.2 Tanaga 11 925 920 4 1 1.0
Veniaminof 21 24 24 0 0 1.1 Westdahl 166 27 24 3 0 0.9 Wrangell 99 106 15 91 0 0.7
Totals 6,105 8,146 6,833 1,279 34 0.7

14
Veniaminof, the seismic activity is dominated by non-locatable tremor and low-frequency
events. The seismicity in 2005 at Mount Spurr is similar to that in 2004 (Power, 2004)
because the volcanic unrest started in mid 2004 and continued through 2005. At Augustine
Volcano an increase in the seismicity above background was first noted in May 2005. By
the end of 2005 the seismicity was well above background due to an episode of unrest
continuing into 2006. The majority of the seismicity at Tanaga Volcano occurred in
October and November 2005. By the end of 2005, the level of seismicity at Tanaga
Volcano had returned to background levels.
The subnetworks at Iliamna and Aniakchak showed increased seismic activity. The
number of earthquakes was elevated for Iliamna compared to background for the first half
of 2005 but remained at background for the last part of 2005. At Aniakchak Crater, there
were three small burst of activity (one in January, two in December) accounting for the
increased seismicity at this volcanic center. The seismicity at Shishaldin Volcano and
Mount Gareloi also increased from that in 2004. The seismicity at both volcanic centers is
dominated by low-frequency events that are near the limits of detection. Small changes in
factors like background noise or volcanic activity can cause widely varying apparent
seismicity rates.
The seismicity in the Katmai volcanic cluster for 2005 was similar to that in 2004.
Several volcanic centers (Trident Volcano, Mount Katmai and Mount Martin) showed
elevated seismic activity at times in 2005. The seismicity at Trident Volcano was
consistently higher than normal through most of 2005. Declines in seismicity were noted at
Novarupta, Mount Martin and Mount Mageik in regular AVO staff reports. Novarupta was
the only volcanic center that consistently showed lower levels of seismicity in 2005.
Seismicity rates at the Wrangell, Redoubt, Pavlof, Akutan, Okmok, Kanaga, and Great
Sitkin subnetworks, were also similar to that in 2004.
Seismicity at Mount Dutton, Makushin Volcano and Westdahl Peak in 2005
declined compared to that in 2004. Near Mount Dutton, the rate of seismicity is low but
highly variable. No station outages are responsible for the apparent decrease in seismicity.
The decrease in seismicity at Makushin Volcano is related in part to several long-lived
station outages lasting six months or longer. The seismicity at Westdahl Peak would show

15
no change to the previous year if a cluster of activity in January 2004 is removed from the
earthquake totals.
The subnetwork at Mount Peulik was installed in mid-2004 and the subnetworks at
Korovin, Semisopochnoi and Little Sitkin were established in 2005. No comparisons could
be made for these four subnetworks.
Summary
Between January 1 and December 31, 2005, AVO located 9,012 earthquakes of
which 8,146 occurred at or near volcanoes in Alaska. Monitoring highlights in 2005
include: elevated seismicity and low level tremor at Mount Veniaminof, and an increase in
seismicity at Mount Spurr, Augustine Volcano and Tanaga Volcano, all related to episodes
of volcanic unrest. New seismic subnetworks were installed on Semisopochnoi Island and
Little Sitkin Volcano.
Available for download with this report is a compressed Unix tar-file containing a
summary listing of earthquake hypocenters and all the necessary HYPOELLIPSE input files
to recalculate the hypocenters including station locations and calibrations, seismic velocity
models, and phase information. The reader should refer to Lahr (1999) for information on
file formats and instructions for configuring and running the location program
HYPOELLIPSE. Archives of waveform data are maintained on DVD-ROM at AVO
offices in Fairbanks and Anchorage.
Acknowledgements The contents of this report reflect a great deal of hard work by a large number of people
including AVO, AEIC, and USGS personnel and various students, interns and volunteers.
We thank Silvio DeAngelis and Mike Thorne for formal reviews of the text and figures.

16
References Dixon, J. P., J. A. Power, and S. D. Stihler (2005). Seismic Observations of Westdahl volcano and Western Unimak Island Alaska: 1999-2005, Eos Trans. AGU, 86, no. 52, Fall Meeting Suppl. Abstract S11b-0169. Fogleman, K. A., J. C. Lahr, C. D. Stephens, and R. A. Page (1993). Earthquake locations determined by the southern Alaska seismograph network for October 1971 through May 1989, U.S. Geol. Surv. Open-File Rept. 93-309, 54 p. Goldstein, P., D. Dodge, and M. Firpo (1999). SAC2000: Signal processing and analysis tools for seismologists and engineers, in International Handbook of Engineers and Engineering Seismology, Lee W.H.K , Kanamori, H., Jennings, P.P, Kisslinger, C. (Editors), v. 81B, Academic Press, San Diego, CA, 1613-1614. Johnson, C. E., A. Bittenbinder, D. Bogaert, L. Dietz, and W. Kohler (1995). EARTHWORM: A Flexible Approach to Seismograph network Processing, IRIS Newsletter, 14, no. 2, 1-4. Jolly, A. D., R. A. Page, and J. A. Power (1994). Seismicity and stress in the vicinity of Mt. Spurr volcano, south-central Alaska, J. Geophys. Res., 99, 15305-15318. Lahr, J. C, B. A. Chouet, C. D. Stephens, J. A. Power, and R. A. Page (1994). Earthquake classification, location, and error analysis in a volcanic environment: Implications for the magmatic system of the 1989-90 eruptions at Redoubt Volcano, Alaska, J. Volc. Geotherm. Res., 62, 137–152. Lahr, J. C. (1999). HYPOELLIPSE: A Computer Program for Determining Local Earthquake Hypocentral Parameters, Magnitude, and First Motion Pattern, U.S. Geol. Surv. Open-File Rept. 99-23, 116 pp. McChesney, P. J. (1999). McVCO Handbook 1999, U.S. Geol. Surv. Open-File Rept. 99-361, 48 p. McNutt, S. R., and K. H. Jacob (1986). Determination of large-scale velocity structure of the crust and upper mantle in the vicinity of Pavlof volcano, Alaska: J. of Geophys. Res., 91, 5013-5022. Power, J. A. (1988). Seismicity associated with the 1986 eruption of Augustine Volcano, Alaska, Masters Thesis, University of Alaska Fairbanks, 149 p. Power, J. A., J. F. Paskievitch, D. H. Richter, R. G. McGimsey, P. Stelling, A. D. Jolly, and H. J. Fletcher (1996). 1996 seismicity and ground deformation at Akutan Volcano, Eos Trans. AGU, 77, F514.

17
Power, J. A. (2004). Renewed unrest at Mount Spurr Volcano, Alaska, Eos Trans. AGU, 85, 434. Robinson, M. (1990). XPICK users manual, version 2.7: Seismology Lab, Geophysical Institute, University of Alaska Fairbanks, 93 p. Rogers, J. A., S. Maslak, and J. C. Lahr (1980). A seismic electronic system with automatic calibration and crystal reference, U.S. Geol. Surv. Open-File Rept. 80-324, 130 p. Roman, D. C., J. A. Power, S. C. Moran, K. V. Cashman, S. D. Stihler (2001). Unrest at Iliamna Volcano, Alaska in 1996, Evidence for a magmatic intrusion, Eos Trans. AGU, v. 82, F1329. Sánchez, J. J. (2005). Volcano Seismology from around the World: Case Studies from Mount Pinatubo (Philippines), Galeras (Columbia), Mount Wrangell and Mount Veniaminof (Alaska), Ph.D. Dissertation, University of Alaska Fairbanks, 208 p. Searcy, C. K. (2003). Station Corrections for the Katmai Region Seismograph network, U.S. Geol. Surv. Open-File Rept. 03-403, 16 p. Toth, T., and C. Kisslinger (1984). Revised focal depths and velocity model for local earthquakes in the Adak seismic zone, Bull. Seism. Soc. Am., 74, 1349-1360. Wiemer, S. (2001). A software package to analyze seismicity: ZMAP, Seism. Res. Lett., 72, 373-382.

18
Appendix A: Maps showing the locations of the earthquakes located in 2005.
Figure A1. Summary plots of 116 earthquakes located near Mount Wrangell in 2005. Open circles show hypocenter locations shallower than 20 km and open triangles show hypocenters with depths of 20 km and deeper. Hypocenter symbols are scaled with magnitude. Seismograph stations are shown by open squares and labeled by station code. Solid triangles are used to show volcanic centers and solid squares are used to show other points of interest. See Appendix B for station information.
19
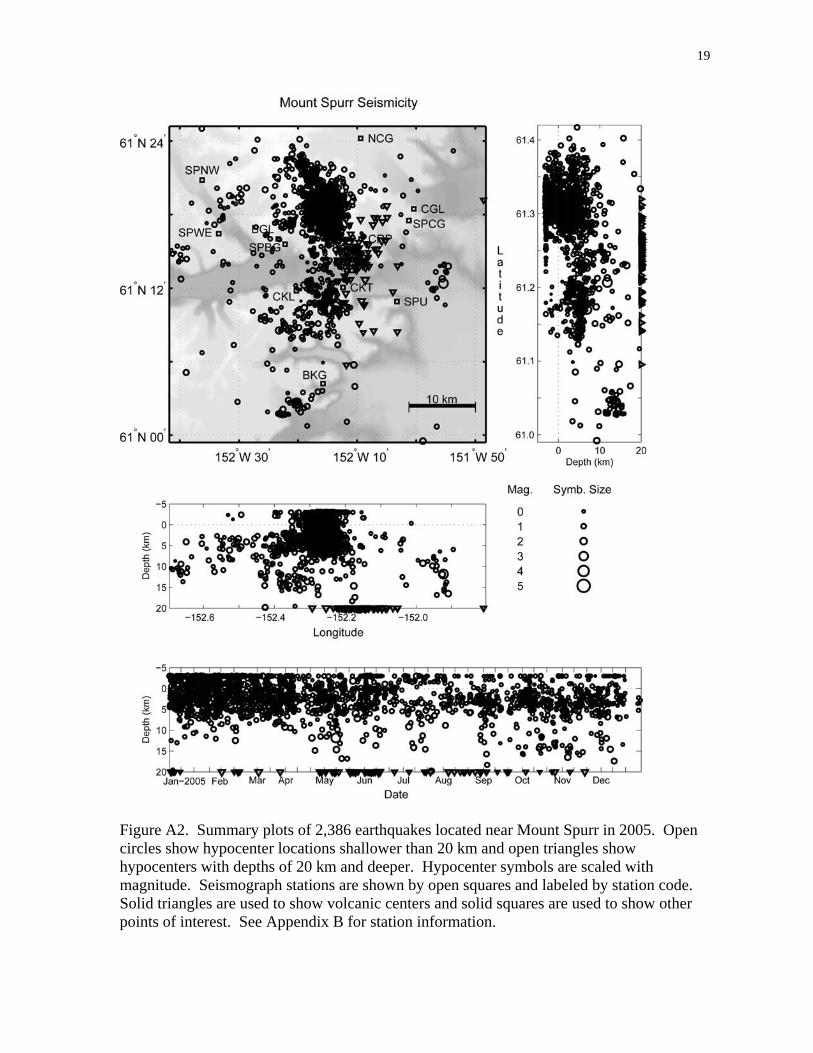
Figure A2. Summary plots of 2,386 earthquakes located near Mount Spurr in 2005. Open circles show hypocenter locations shallower than 20 km and open triangles show hypocenters with depths of 20 km and deeper. Hypocenter symbols are scaled with magnitude. Seismograph stations are shown by open squares and labeled by station code. Solid triangles are used to show volcanic centers and solid squares are used to show other points of interest. See Appendix B for station information.

20
Figure A3. Summary plots of 68 earthquakes located near Redoubt Volcano in 2005. Open circles show hypocenter locations shallower than 20 km and open triangles show hypocenters with depths of 20 km and deeper. Hypocenter symbols are scaled with magnitude. Seismograph stations are shown by open squares and labeled by station code. Solid triangles are used to show volcanic centers and solid squares are used to show other points of interest. See Appendix B for station information.

21
Figure A4. Summary plots of 995 earthquakes located near Iliamna Volcano in 2005. Open circles show hypocenter locations shallower than 20 km and open triangles show hypocenters with depths of 20 km and deeper. Hypocenter symbols are scaled with magnitude. Seismograph stations are shown by open squares and labeled by station code. Solid triangles are used to show volcanic centers and solid squares are used to show other points of interest. See Appendix B for station information.

22
Figure A5. Summary plots of 1,189 earthquakes located near Augustine Volcano in 2005. Open circles show hypocenter locations shallower than 20 km and open triangles show hypocenters with depths of 20 km and deeper. Hypocenter symbols are scaled with magnitude. Seismograph stations are shown by open squares and labeled by station code. Solid triangles are used to show volcanic centers and solid squares are used to show other points of interest. See Appendix B for station information.
23
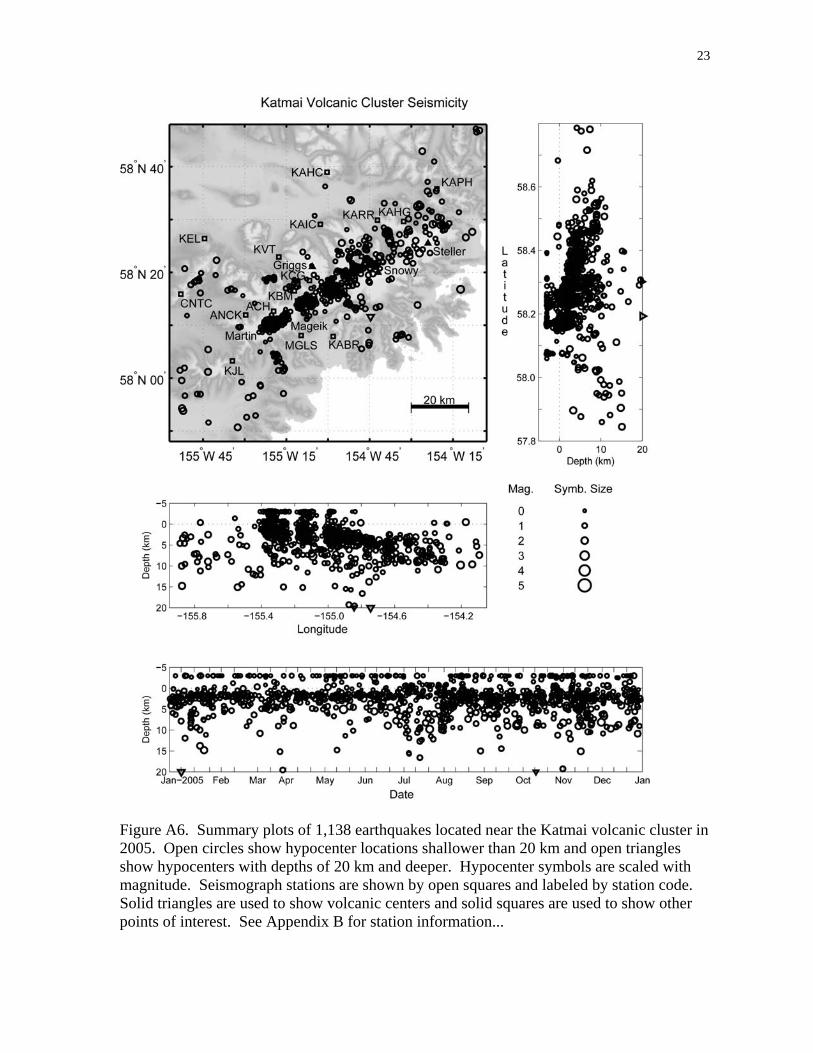
Figure A6. Summary plots of 1,138 earthquakes located near the Katmai volcanic cluster in 2005. Open circles show hypocenter locations shallower than 20 km and open triangles show hypocenters with depths of 20 km and deeper. Hypocenter symbols are scaled with magnitude. Seismograph stations are shown by open squares and labeled by station code. Solid triangles are used to show volcanic centers and solid squares are used to show other points of interest. See Appendix B for station information...

24
Figure A7. Summary plots of 145 earthquakes located near Snowy Mountain in the Katmai volcanic cluster in 2005. Open circles show hypocenter locations shallower than 20 km and open triangles show hypocenters with depths of 20 km and deeper. Hypocenter symbols are scaled with magnitude. Seismograph stations are shown by open squares and labeled by station code. (See Appendix B for station information). Solid triangles are used to show volcanic centers and solid squares are used to show other points of interest.

25
Figure A8. Summary plots of 47 earthquakes located near Mount Griggs in the Katmai volcanic cluster in 2005. Open circles show hypocenter locations shallower than 20 km and open triangles show hypocenters with depths of 20 km and deeper. Hypocenter symbols are scaled with magnitude. Seismograph stations are shown by open squares and labeled by station code. Solid triangles are used to show volcanic centers and solid squares are used to show other points of interest. See Appendix B for station information. Several earthquakes that appear on this figure appear on other figures.
26
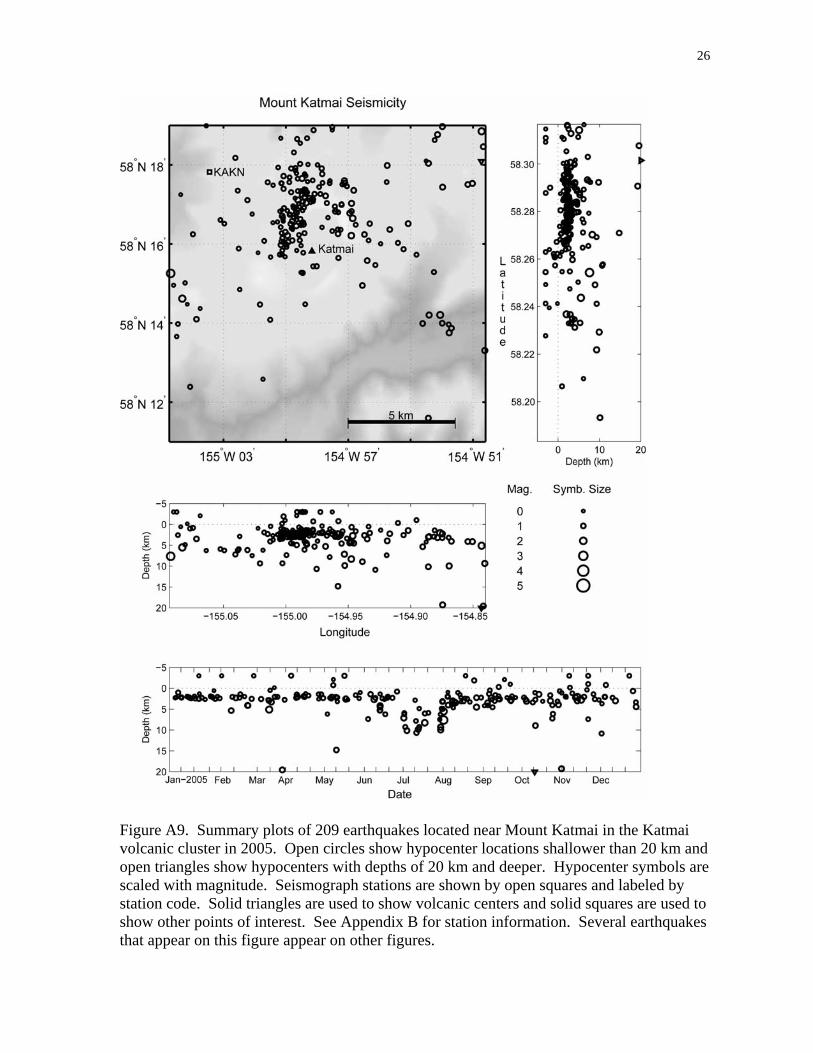
Figure A9. Summary plots of 209 earthquakes located near Mount Katmai in the Katmai volcanic cluster in 2005. Open circles show hypocenter locations shallower than 20 km and open triangles show hypocenters with depths of 20 km and deeper. Hypocenter symbols are scaled with magnitude. Seismograph stations are shown by open squares and labeled by station code. Solid triangles are used to show volcanic centers and solid squares are used to show other points of interest. See Appendix B for station information. Several earthquakes that appear on this figure appear on other figures.

27
Figure A10. Summary plots of 287 earthquakes located near Novarupta and Trident Volcano in the Katmai volcanic cluster in 2005. Open circles show hypocenter locations shallower than 20 km and open triangles show hypocenters with depths of 20 km and deeper. Hypocenter symbols are scaled with magnitude. Seismograph stations are shown by open squares and labeled by station code. Solid triangles are used to show volcanic centers and solid squares are used to show other points of interest. See Appendix B for station information. Several earthquakes that appear on this figure appear on other figures.

28
Figure A11. Summary plots of 495 earthquakes located near Mount Mageik and Mount Martin in the Katmai volcanic cluster in 2005. Open circles scaled with magnitude show hypocenter locations. Seismograph stations are shown by open squares and labeled by station code. Solid triangles are used to show volcanic centers and solid squares are used to show other points of interest. See Appendix B for station information. Several earthquakes that appear on this figure appear on other figures.
29
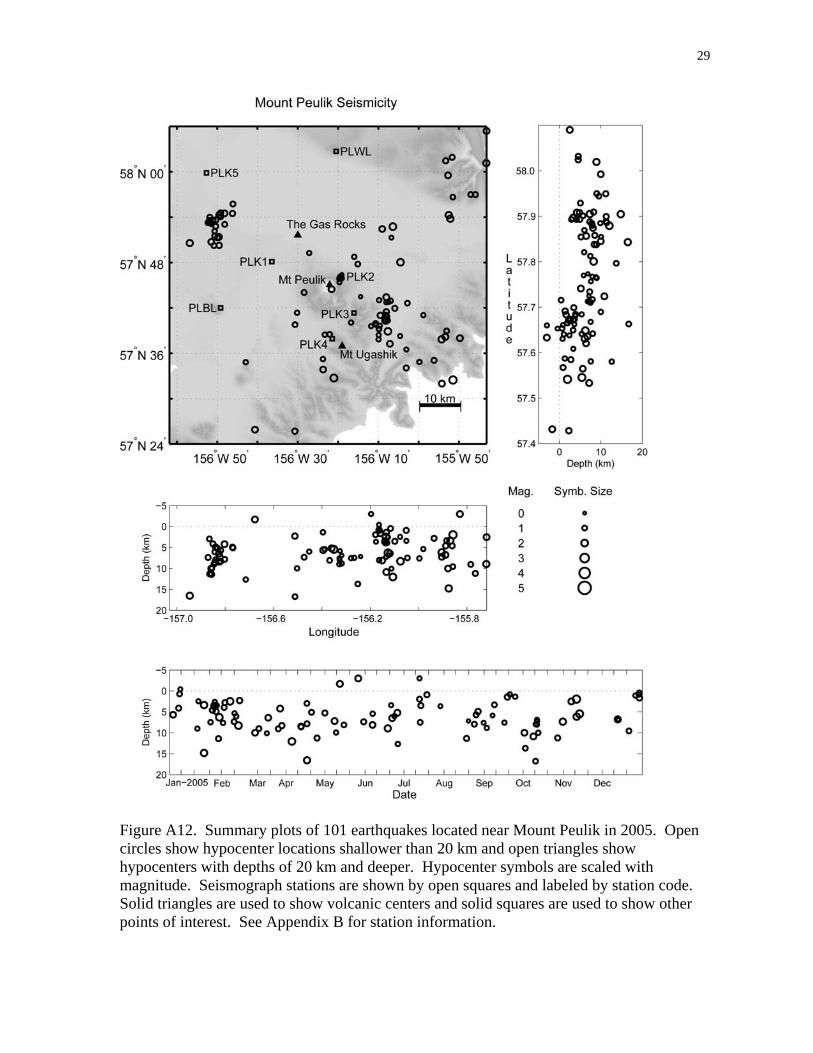
Figure A12. Summary plots of 101 earthquakes located near Mount Peulik in 2005. Open circles show hypocenter locations shallower than 20 km and open triangles show hypocenters with depths of 20 km and deeper. Hypocenter symbols are scaled with magnitude. Seismograph stations are shown by open squares and labeled by station code. Solid triangles are used to show volcanic centers and solid squares are used to show other points of interest. See Appendix B for station information.

30
Figure A13. Summary plots of 33 earthquakes located near Aniakchak Crater in 2005. Open circles show hypocenter locations shallower than 20 km and open triangles show hypocenters with depths of 20 km and deeper. Hypocenter symbols are scaled with magnitude. Seismograph stations are shown by open squares and labeled by station code. Solid triangles are used to show volcanic centers and solid squares are used to show other points of interest. See Appendix B for station information.
31
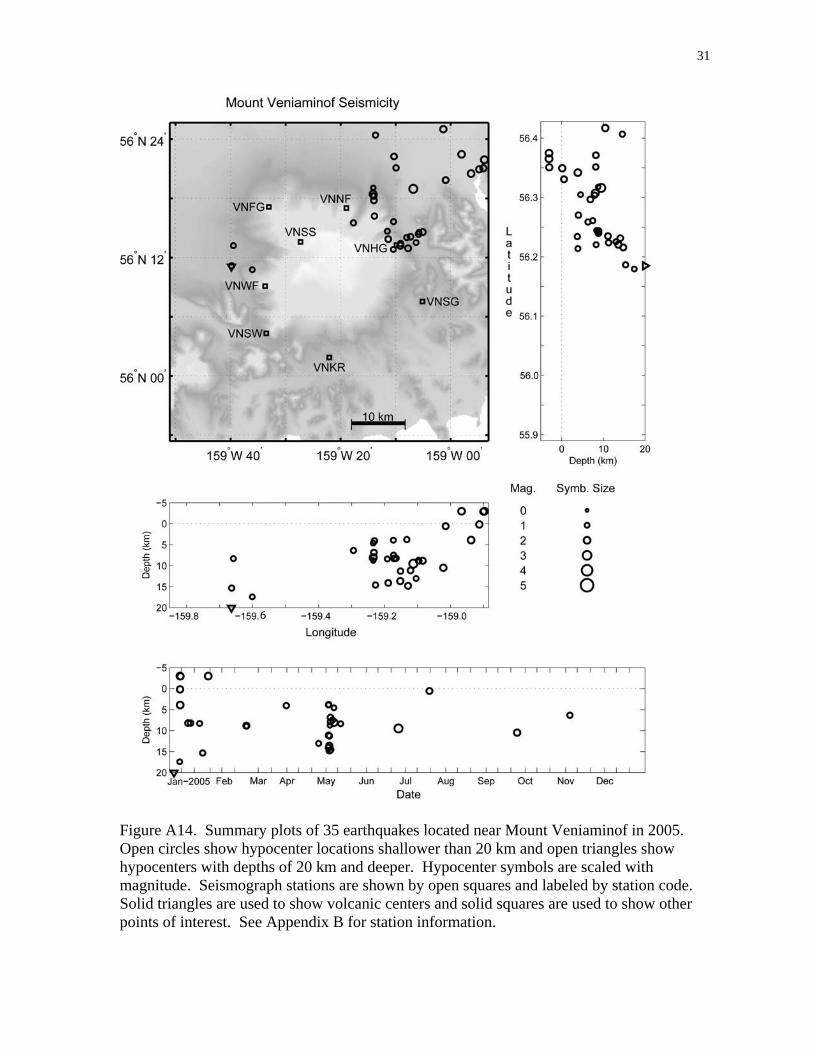
Figure A14. Summary plots of 35 earthquakes located near Mount Veniaminof in 2005. Open circles show hypocenter locations shallower than 20 km and open triangles show hypocenters with depths of 20 km and deeper. Hypocenter symbols are scaled with magnitude. Seismograph stations are shown by open squares and labeled by station code. Solid triangles are used to show volcanic centers and solid squares are used to show other points of interest. See Appendix B for station information.

32
Figure A15. Summary plots of 29 earthquakes located near Pavlof Volcano in 2005. Open circles show hypocenter locations shallower than 20 km and open triangles show hypocenters with depths of 20 km and deeper. Hypocenter symbols are scaled with magnitude. Seismograph stations are shown by open squares and labeled by station code. Solid triangles are used to show volcanic centers and solid squares are used to show other points of interest. See Appendix B for station information.
33
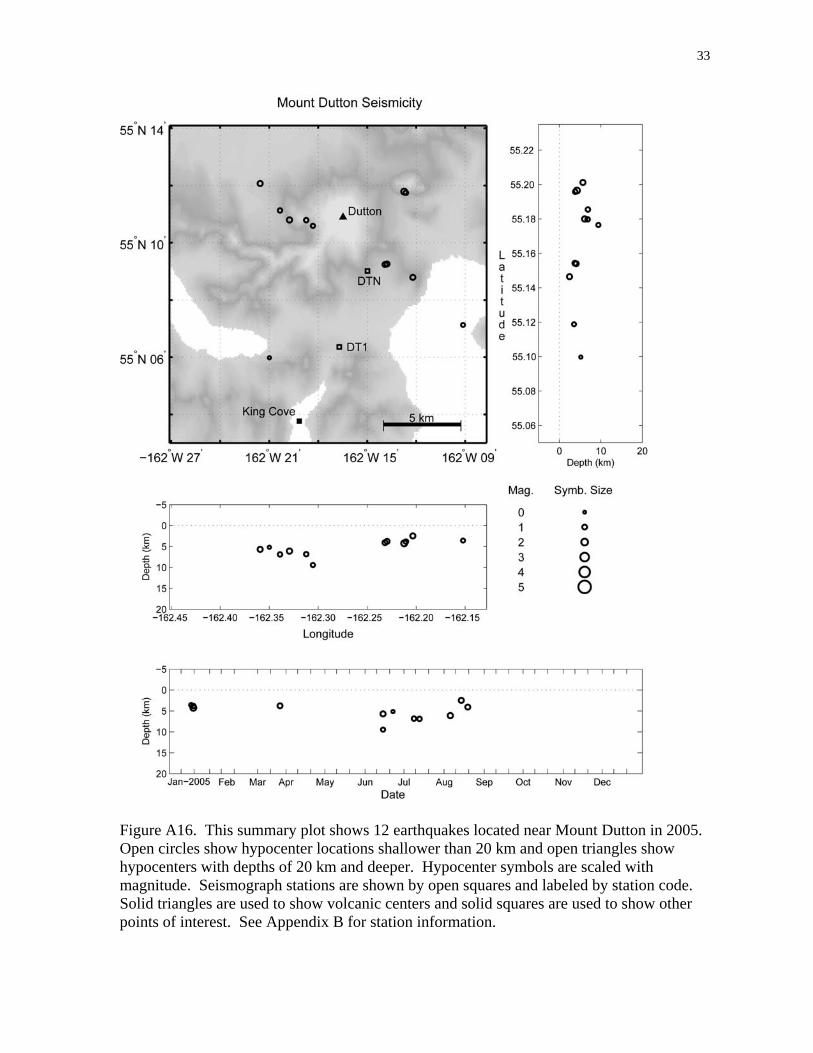
Figure A16. This summary plot shows 12 earthquakes located near Mount Dutton in 2005. Open circles show hypocenter locations shallower than 20 km and open triangles show hypocenters with depths of 20 km and deeper. Hypocenter symbols are scaled with magnitude. Seismograph stations are shown by open squares and labeled by station code. Solid triangles are used to show volcanic centers and solid squares are used to show other points of interest. See Appendix B for station information.
34
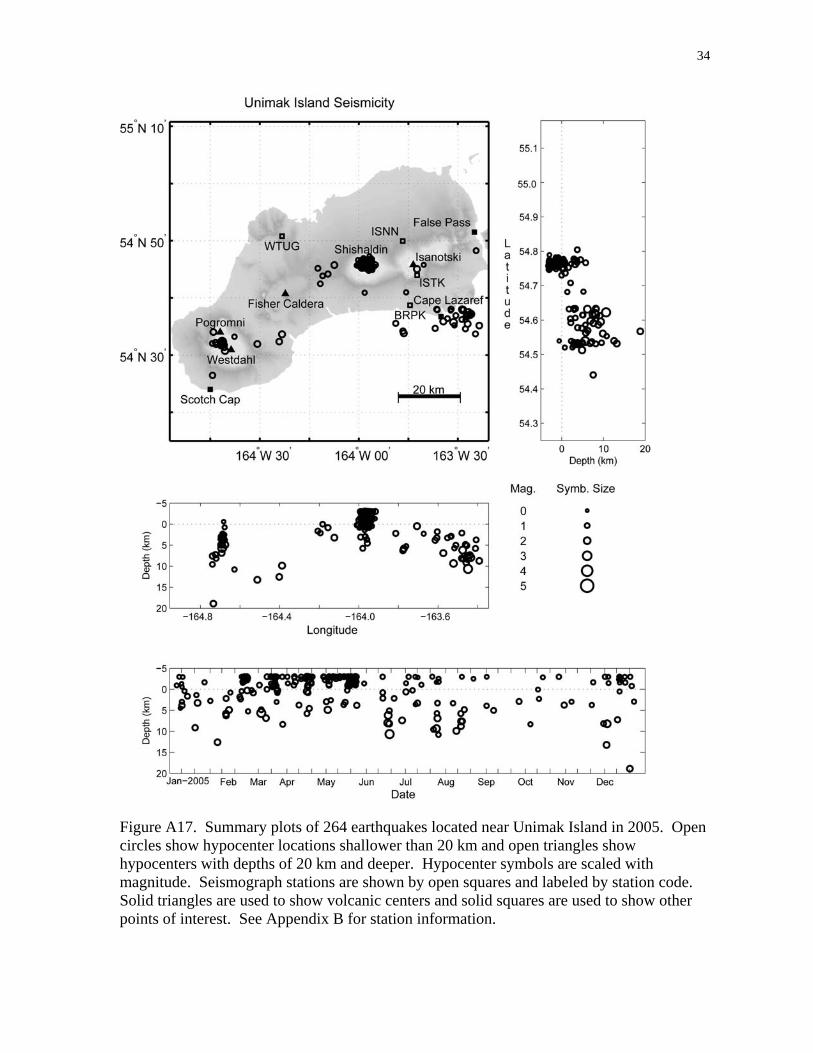
Figure A17. Summary plots of 264 earthquakes located near Unimak Island in 2005. Open circles show hypocenter locations shallower than 20 km and open triangles show hypocenters with depths of 20 km and deeper. Hypocenter symbols are scaled with magnitude. Seismograph stations are shown by open squares and labeled by station code. Solid triangles are used to show volcanic centers and solid squares are used to show other points of interest. See Appendix B for station information.
35
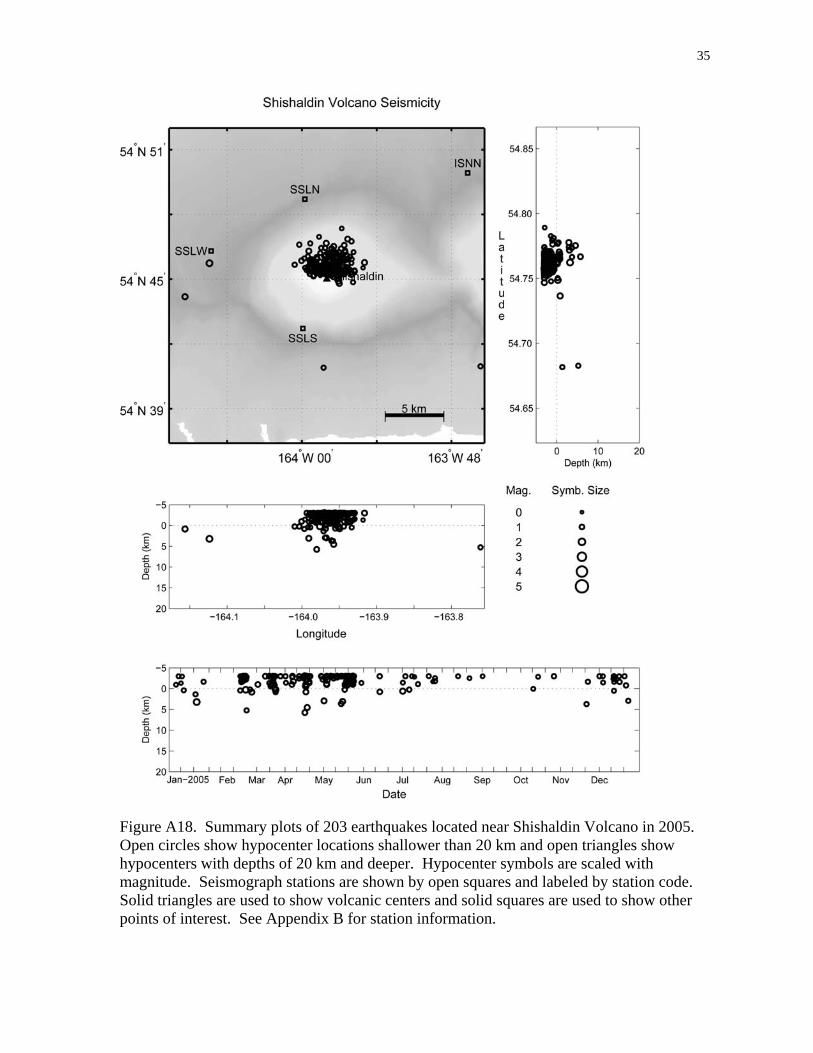
Figure A18. Summary plots of 203 earthquakes located near Shishaldin Volcano in 2005. Open circles show hypocenter locations shallower than 20 km and open triangles show hypocenters with depths of 20 km and deeper. Hypocenter symbols are scaled with magnitude. Seismograph stations are shown by open squares and labeled by station code. Solid triangles are used to show volcanic centers and solid squares are used to show other points of interest. See Appendix B for station information.

36
Figure A19. Summary plots of 25 earthquakes located near Westdahl Peak in 2005. Open circles show hypocenter locations shallower than 20 km and open triangles show hypocenters with depths of 20 km and deeper. Hypocenter symbols are scaled with magnitude. Seismograph stations are shown by open squares and labeled by station code. Solid triangles are used to show volcanic centers and solid squares are used to show other points of interest. See Appendix B for station information.

37
Figure A20. Summary plots of 100 earthquakes located near Akutan Peak in 2005. Open circles show hypocenter locations shallower than 20 km and open triangles show hypocenters with depths of 20 km and deeper. Hypocenter symbols are scaled with magnitude. Seismograph stations are shown by open squares and labeled by station code. Solid triangles are used to show volcanic centers and solid squares are used to show other points of interest. See Appendix B for station information.

38
Figure A21. Summary plots of 175 earthquakes located near Makushin Volcano in 2005. Open circles show hypocenter locations shallower than 20 km and open triangles show hypocenters with depths of 20 km and deeper. Hypocenter symbols are scaled with magnitude. Seismograph stations are shown by open squares and labeled by station code. Solid triangles are used to show volcanic centers and solid squares are used to show other points of interest. See Appendix B for station information.

39
Figure A22. Summary plots of 123 earthquakes located near Okmok Caldera in 2005. Open circles show hypocenter locations shallower than 20 km and open triangles show hypocenters with depths of 20 km and deeper. Hypocenter symbols are scaled with magnitude. Seismograph stations are shown by open squares and labeled by station code. Solid triangles are used to show volcanic centers and solid squares are used to show other points of interest. See Appendix B for station information.

40
Figure A23. Summary plots of 74 earthquakes located near Korovin Volcano in 2005. Open circles show hypocenter locations shallower than 20 km and open triangles show hypocenters with depths of 20 km and deeper. Hypocenter symbols are scaled with magnitude. Seismograph stations are shown by open squares and labeled by station code. Solid triangles are used to show volcanic centers and solid squares are used to show other points of interest. See Appendix B for station information.
41
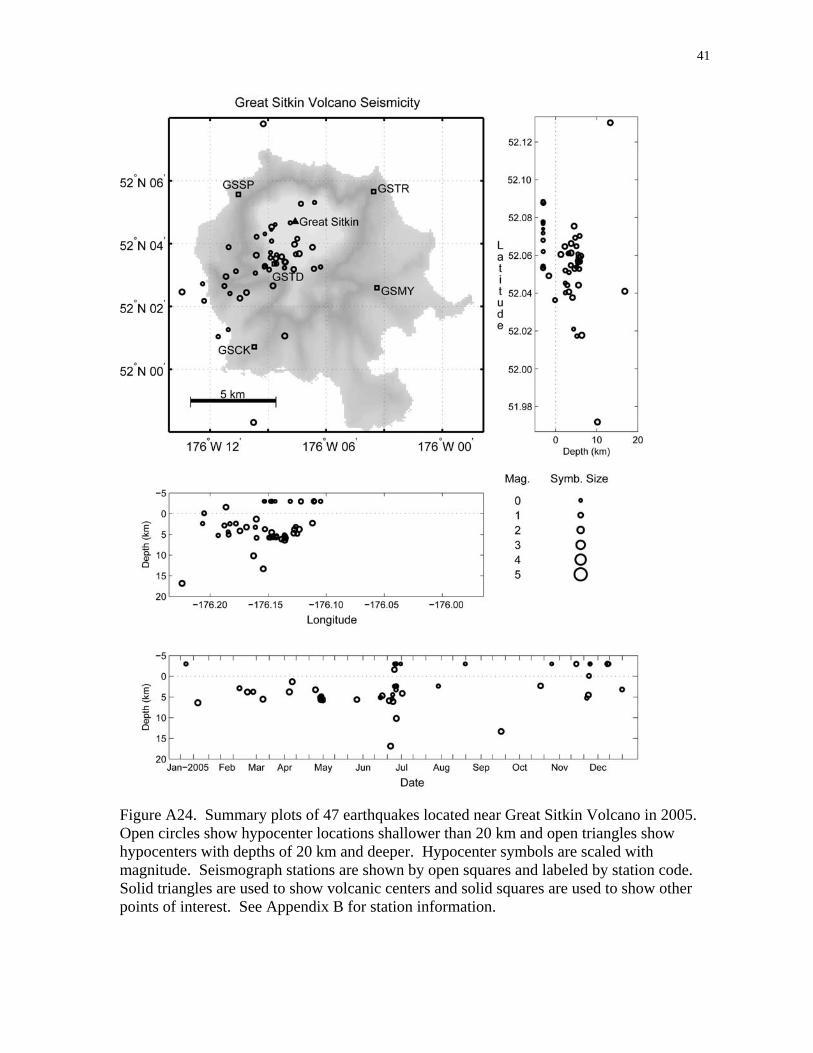
Figure A24. Summary plots of 47 earthquakes located near Great Sitkin Volcano in 2005. Open circles show hypocenter locations shallower than 20 km and open triangles show hypocenters with depths of 20 km and deeper. Hypocenter symbols are scaled with magnitude. Seismograph stations are shown by open squares and labeled by station code. Solid triangles are used to show volcanic centers and solid squares are used to show other points of interest. See Appendix B for station information.

42
Figure A25. Summary plots of 22 earthquakes located near Kanaga Volcano in 2005. Open circles show hypocenter locations shallower than 20 km and open triangles show hypocenters with depths of 20 km and deeper. Hypocenter symbols are scaled with magnitude. Seismograph stations are shown by open squares and labeled by station code. Solid triangles are used to show volcanic centers and solid squares are used to show other points of interest. See Appendix B for station information.
43
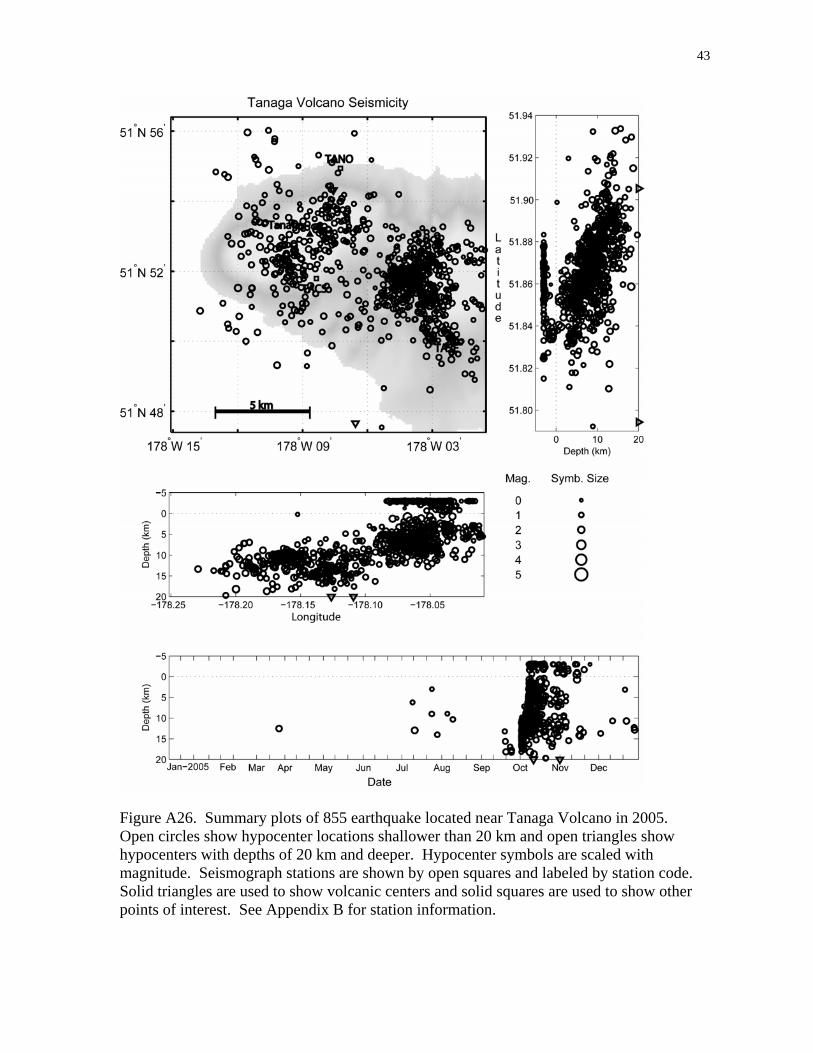
Figure A26. Summary plots of 855 earthquake located near Tanaga Volcano in 2005. Open circles show hypocenter locations shallower than 20 km and open triangles show hypocenters with depths of 20 km and deeper. Hypocenter symbols are scaled with magnitude. Seismograph stations are shown by open squares and labeled by station code. Solid triangles are used to show volcanic centers and solid squares are used to show other points of interest. See Appendix B for station information.

44
Figure A27. Summary plots of 547 earthquakes located near Mount Gareloi in 2005. Open circles show hypocenter locations shallower than 20 km and open triangles show hypocenters with depths of 20 km and deeper. Hypocenter symbols are scaled with magnitude. Seismograph stations are shown by open squares and labeled by station code. Solid triangles are used to show volcanic centers and solid squares are used to show other points of interest. See Appendix B for station information.

45
Figure A28. Summary plots of six earthquakes located on Semisopochnoi Island in 2005. Open circles show hypocenter locations shallower than 20 km and open triangles show hypocenters with depths of 20 km and deeper. Hypocenter symbols are scaled with magnitude. Seismograph stations are shown by open squares and labeled by station code. Solid triangles are used to show volcanic centers and solid squares are used to show other points of interest. See Appendix B for station information.

46
Figure A29. Summary plots of eight earthquakes located on Little Sitkin Island in 2005. Open circles show hypocenter locations shallower than 20 km and open triangles show hypocenters with depths of 20 km and deeper. Hypocenter symbols are scaled with magnitude. Seismograph stations are shown by open squares and labeled by station code. Solid triangles are used to show volcanic centers and solid squares are used to show other points of interest. See Appendix B for station information.

47
Appendix B: Parameters for AVO seismograph stations (datum NAD27) in 2005 Station Latitude (N) Longitude (E) Elevation (m) Seismometer Station open date Akutan Peak subnet (11 stations - 23 components) AHB 54 06.916 -165 48.943 447 L4 1996/07/24 AKGG3 54 11.930 -165 59.495 326 CMG-6TD 2003/06/27 AKLV3 54 09.762 -165 57.336 551 CMG-6TD 2003/07/02 AKMO3 54 05.471 -166 00.634 277 CMG-6TD 2003/06/25 AKRB3 54 07.803 -166 04.125 334 CMG-6TD 2003/06/29 AKS3 54 06.624 -165 41.803 213 L22 1996/07/24 AKT3 54 08.15 -165 46.2 12 CMG-40T 1996/03/18 AKV 54 07.571 -165 57.763 863 L4 1996/07/24 HSB 54 11.205 -165 54.743 497 L4 1996/07/24 LVA 54 09.655 -166 02.025 457 L4 1996/07/24 ZRO 54 05.494 -165 58.678 446 L4 1996/07/24 Aniakchak Crater subnet (6 stations - 8 components) ANNE 56 54.763 -158 03.534 705 L4 1997/07/18 ANNW 56 57.986 -158 12.895 816 L4 1997/07/18 ANON3 56 55.188 -158 10.293 445 L22 2000/07/10 ANPB 56 48.141 -158 16.847 658 L4 1997/07/18 ANPK 56 50.499 -158 07.572 972 L4 1997/07/18 AZAC 56 53.727 -158 13.841 1,057 L4 2003/07/12 Augustine Volcano subnet (8 stations - 15 components) AUE3 59 22.308 -153 22.504 168 S13 1980/10/29 AUH 59 21.833 -153 26.591 890 S13 1978/12/01 AUI3 59 20.11 -153 25.66 293 S13 1978/04/06 AUL 59 22.937 -153 26.142 360 S13 1980/10/29 AUL3 59 22.937 -153 26.142 360 CMG-40T 1997/08/27 AUP 59 21.805 -153 25.210 1,033 S13 1977/09/22 AUR 59 21.766 -153 25.876 1,225 L4 1995/11/01 AUS 59 21.599 -153 25.840 1,226 L4 1990/09/01 AUW 59 22.205 -153 28.249 276 S13 1976/10/17
Mount Dutton subnet (5 stations - 5 components) BLDY 55 11.670 -162 47.018 259 L4 1996/07/11 DOL 55 08.960 -161 51.683 442 L4 1996/07/11 DRR3 54 58.014 -162 15.665 457 L4 1996/07/11 DT1 55 06.427 -162 16.859 198 L4 1991/06/21 DTN 55 08.744 -162 15.419 396 S13 1988/07/16 Gareloi Volcano subnet (6 stations - 8 components) GAEA 51 46.980 -178 44.810 326 L4 2003/08/30 GAKI 51 33.267 -178 48.725 99 L4 2003/09/01 GALA 51 45.704 -178 46.292 315 L4 2003/08/30 GANE 51 49.135 -178 46.603 325 L4 2003/09/02 GANO 51 49.220 -178 48.230 451 L4 2003/09/02 GASW3 51 46.731 -178 51.276 248 L22 2003/08/30

48
Station Latitude (N) Longitude (E) Elevation (m) Seismometer Station open date
Great Sitkin Volcano subnet (6 stations - 8 components) GSCK 52 00.712 -176 09.718 384 L4 1999/09/15 GSIG 51 59.181 -175 55.502 407 L4 1999/09/03 GSMY 52 02.594 -176 03.376 418 L4 1999/09/03 GSSP 52 05.566 -176 10.541 295 L4 1999/09/15 GSTD3 52 03.356 -176 08.685 873 L22 1999/09/03 GSTR 52 05.655 -176 03.546 536 L4 1999/09/03 Iliamna Volcano subnet (6 stations - 8 components) ILI 60 04.877 -152 57.502 771 L4 1987/09/15 ILS 59 57.454 -153 04.083 1,125 S13 1996/08/28 ILW 60 03.585 -153 08.222 1,646 S13 1994/09/09 INE 60 03.65 -153 03.75 1,585 S13 1990/08/29 IVE3 60 01.014 -153 00.981 1,173 S13,L22 1996/09/19 IVS 60 00.55 -153 04.85 2,332 S13 1990/08/29 Kanaga Volcano subnet (6 stations - 6 components) KICM 51 55.136 -177 11.718 183 L4 1999/09/15 KIKV 51 52.730 -177 10.223 411 L4 1999/09/15 KIMD 51 45.697 -177 14.093 183 L4 1999/09/15 KINC 51 55.884 -177 07.657 198 L4 1999/09/15 KIRH 51 53.976 -177 05.611 309 L4 1999/09/03 KIWB 51 51.183 -177 09.049 244 L4 1999/09/03
Katmai Volcanic Cluster subnet (20 stations - 30 components) ACH3 58 12.64 -155 19.56 960 L22 1996/07/25 ANCK 58 11.93 -155 29.64 869 L4 1996/07/25 CAHL 58 03.15 -155 18.09 807 L4 1996/07/25 CNTC 58 15.87 -155 53.02 1,158 L4 1996/07/25 KABR 58 07.87 -154 58.15 884 L4 1998/08/12 KABU3 58 16.225 -155 16.934 1,065 CMT-6TD 2004/08/01 KAHC 58 38.94 -155 00.36 1,250 L4 1998/10/12 KAHG 58 29.64 -154 32.78 923 L4 1998/10/12 KAIC 58 29.10 -155 02.75 734 L4 1998/10/12 KAKN3 58 17.819 -155 03.668 1,049 CMG-6TD 2004/08/01 KAPH3 58 35.81 -154 20.81 907 L22 1998/10/12 KARR 58 29.87 -154 42.20 610 L4 1998/10/12 KAWH 58 23.02 -154 47.95 777 L4 1998/10/12 KBM 58 16.50 -155 12.10 732 L4 1991/07/22 KCE 58 14.60 -155 11.00 777 L4 1991/07/22 KCG3 58 18.457 -155 06.684 762 L22 1988/08/01 KEL 58 26.401 -155 44.442 975 L4 1988/08/01 KJL 58 03.24 -155 34.39 792 L4 1996/07/25 KVT 58 22.90 -155 17.70 457 L4 1988/08/01 MGLS 58 08.06 -155 09.65 472 L4 1996/07/25 Korovin Volcano subnet (7 stations - 9 components) KOFP 53 57.08 -166 53.51 662 L4 2004/07/02 KOKL 53 47.68 -166 52.35 758 L4 2004/07/05 KOKV3 53 53.03 -166 41.00 776 L22 2004/07/05 KONE 53 48.629 -166 44.736 253 L4 2004/07/10 KONW 53 48.978 -166 56.187 334 L4 2004/07/04 KOSE 53 54.88 -166 46.96 625 L4 2004/07/07 KOWE 53 58.16 -166 40.71 527 L4 2004/07/06

49
Station Latitude (N) Longitude (E) Elevation (m) Seismometer Station open date
Little Sitkin subnet (4 stations - 6 components) LSNW 51 58.232 178 31.011 290 L4 2005/09/30 LSPA3 51 57.413 178 34.405 335 L4-3D 2005/09/30 LSSSA 51 56.973 178 30.793 549 L4 2005/09/28 LSSE 51 55.993 178 34.139 335 L4 2005/09/27 Makushin Volcano subnet (7 stations - 9 components) MCIR 53 57.086 -166 53.529 800 L4 1996/07/25 MGOD 53 47.683 -166 52.561 650 L4 1996/07/25 MNAT 53 53.028 -166 41.016 397 L4 1996/07/25 MREP 53 48.629 -166 44.736 785 L4 2002/01/01 MSOM 53 48.978 -166 56.187 146 L4 1996/07/25 MSW3 53 54.929 -166 47.186 418 L22 1996/07/25 MTBL 53 58.136 -166 40.760 810 L4 1996/07/25 Okmok Volcano subnet (13 stations - 21 components) OKAS 53 24.319 -168 21.686 270 L4 2003/01/09 OKCD3 53 25.818 -168 06.737 459 CMG-6TD 2003/01/09 OKCE3 53 25.622 -168 09.858 515 CMG-6TD 2003/01/09 OKCF 53 23.749 -168 08.175 685 L4 2003/01/09 OKER 53 27.278 -168 02.960 956 L4 2003/01/09 OKFG3 53 24.702 -167 54.568 201 CMG-6TD 2003/01/09 OKID 53 28.645 -167 48.972 437 L4 2003/01/09 OKRE 53 31.215 -168 09.846 422 L4 2003/01/09 OKSO3 53 21.447 -168 09.591 460 CMG-6TD 2004/09/01 OKSP 53 15.156 -168 17.431 608 L4 2003/01/09 OKTU 53 23.035 -168 02.466 646 L4 2003/01/09 OKWE 53 28.328 -168 14.388 445 L4 2003/01/09 OKWR 53 26.084 -168 12.333 1,017 L4 2003/01/09 Pavlof Volcano subnet (7 stations - 9 components) BLHA 55 42.227 -162 03.907 411 L4 1996/07/11 HAG 55 19.068 -161 54.150 503 L4 1996/07/11 PN7A 55 26.020 -161 59.713 838 L4 1996/07/11 PS1A 55 25.321 -161 44.425 293 L4 1996/07/11 PS4A 55 20.811 -161 51.233 322 L4 1996/07/11 PV63 55 27.217 -161 55.112 747 L22 1996/07/11 PVV 55 22.438 -161 47.396 161 L4 1996/07/11 Mount Peulik subnet (7 stations - 9 components) PLBL 57 41.990 -156 49.131 461 L4 2004/08/01 PLK1 57 48.114 -156 36.433 78 L4 2004/08/01 PLK2 57 45.852 -156 19.458 401 L4 2004/08/01 PLK33 57 41.320 -156 16.044 494 L22 2004/08/01 PLK4 57 37.928 -156 21.464 1,031 L4 2004/08/01 PLK5 57 59.864 -156 52.662 49 L4 2004/08/01 PLWL 58 02.696 -156 20.479 585 L4 2004/08/01

50
Station Latitude (N) Longitude (E) Elevation (m) Seismometer Station open date Redoubt Volcano subnet (7 stations - 12 components) DFR 60 35.514 -152 41.160 1,090 L4 1988/08/15 NCT 60 33.789 -152 55.568 1,079 L4 1988/08/14 RDN 60 31.377 -152 44.273 1,400 L4 1988/08/13 RDT 60 34.394 -152 24.315 930 L4 1971/08/09 RED3 60 25.192 -152 46.308 1,064 L4 1990/08/30 REF3* 60 29.35 -152 42.10 1,801 L22 1992/07/27 RSO 60 27.73 -152 45.23 1,921 L4 1990/03/01
Semisopochnoi Island subnet (6 stations - 8 components) CEAP 52 00.146 179 47.018 244 L4 2005/09/17 CEPE 51 57.948 179 51.683 335 L4 2005/09/17 CERA 51 54.419 179 15.665 305 L4 2005/09/26 CERB3 51 55.886 179 16.859 305 L4-3D 2005/09/18 CESW 51 54.060 179 15.419 238 L4 2005/09/18 CETU 51 57.965 179 15.419 335 L4 2005/09/22 Shishaldin Volcano subnet (6 stations - 8 components) BRPK 54 38.730 -163 44.449 393 L4 1997/07/27 ISNN 54 49.937 -163 46.706 466 L4 1997/07/27 ISTK 54 43.929 -163 42.376 704 L4 1997/07/27 SSLN 54 48.709 -163 59.756 637 L4 1997/07/27 SSLS3 54 42.718 -163 59.926 817 L22 1997/07/27 SSLW 54 46.307 -164 07.282 628 L4 1997/07/27 Mount Spurr subnet (26 stations - 56 components; Perm. Stations only: 15 stations - 23 components) BGL 61 16.012 -152 23.340 1,127 L4 1989/08/13 BKG 61 04.21 -152 15.76 1,009 L4 1991/07/01 CGL 61 18.46 -152 00.40 1,082 L4 1981/09/22 CKL 61 11.782 -152 20.268 1,281 L4 1989/08/05 CKN 61 13.44 -152 10.89 735 L4 1991/08/19 CKT 61 12.05 -152 12.37 975 L4 1992/09/16 CP2 61 15.85 -152 14.51 1,981 L4 1992/10/23 CRP3 61 16.02 -152 09.33 1,622 L4 1981/08/26 NCG 61 24.22 -152 09.40 1,244 L4 1989/08/06 SP023 61 10.616 -152 03.481 821 CMG-6TD 2005/06/16** SP033 61 08.208 -152 02.815 882 CMG-6TD 2005/06/16** SP043 61 08.014 -152 15.394 946 CMG-6TD 2005/06/16** SP053 61 20.793 -152 05.296 893 CMG-6TD 2005/06/16** SP063 61 15.586 -152 11.053 1,192 CMG-6TD 2005/06/16** SP073 61 20.781 -151 57.842 1,113 CMG-6TD 2005/06/16** SP083 61 19.956 -152 26.700 1,545 CMG-6TD 2005/06/16** SP093 61 14.137 -151 47.920 814 CMG-6TD 2005/06/16** SP103 61 22.465 -152 30.981 1,429 CMG-6TD 2005/06/16** SP113 61 10.780 -152 37.253 921 CMG-6TD 2005/06/16** SP123 61 23.627 -152 07.974 1,034 CMG-6TD 2005/06/16** SPBG3 61 15.583 -152 22.194 1,087 CMG-6TD 2004/09/09 SPCG3 61 17.512 -152 01.228 1,329 CMG-6TD 2004/09/08 SPCR3 61 12.051 -152 12.409 984 CMG-6TD 2004/09/08 SPNW 61 20.826 -152 36.236 1,040 L4 2004/08/17 SPU 61 10.90 -152 03.26 800 L4 1971/08/10 SPWE 61 16.405 -152 33.545 1,327 L4 2004/08/18

51
Station Latitude (N) Longitude (E) Elevation (m) Seismometer Station open date Tanaga Volcano subnet (6 stations - 8 components) TACS 51 51.792 -178 08.363 918 L4 2003/08/28 TAFL 51 45.396 -177 53.867 186 L4 2003/08/28 TAFP3 51 54.003 -177 58.997 440 L22 2003/08/27 TANO 51 54.942 -178 07.249 269 L4 2003/08/24 TAPA 51 48.932 -177 48.770 640 L4 2003/08/27 TASE 51 50.099 -178 02.222 682 L4 2003/08/24 Mount Veniaminof subnet (9 stations - 9 components) BPBC 56 35.383 -158 27.153 584 L4 2002/10/03 VNFG 56 17.140 -159 33.066 1,068 L4 2002/02/06 VNHG 56 13.267 -159 09.853 966 L4 2002/02/06 VNKR 56 01.871 -159 22.068 620 L4 2002/02/06 VNNF 56 17.022 -159 18.961 1,153 L4 2002/06/20 VNSG 56 07.549 -159 05.121 761 L4 2002/02/06 VNSS 56 13.600 -159 27.290 1,733 L4 2002/02/06 VNSW 56 04.317 -159 33.508 716 L4 2002/06/20 VNWF 56 09.104 -159 33.733 1,095 L4 2002/02/06 Westdahl Peak subnet (6 stations - 8 components) WESE 54 28.389 -164 35.038 953 L4 1998/08/28 WESN 54 34.600 -164 34.703 549 L4 1998/10/17 WESS3 54 28.828 -164 43.333 908 L22 1998/08/28 WFAR 54 32.029 -164 46.567 640 L4 1998/08/28 WPOG 54 35.837 -164 44.606 445 L4 1998/10/17 WTUG 54 50.847 -164 23.117 636 L4 1998/10/17 Mount Wrangell subnet (4 stations - 6 components) WACK3 61 59.178 -144 19.703 2,280 L22 2000/07/31 WANC 62 00.189 -144 4.195 4,190 L4 2000/07/31 WASW 61 55.692 -144 10.346 2,196 L4 2001/08/03 WAZA 62 04.506 -144 9.132 2,531 L4 2001/08/03 Regional stations (9 stations - 9 components) ADAG 51 58.812 -176 36.104 286 L4 1999/09/15 BGM 59 23.56 -155 13.76 625 L4 1978/09/08 BGR 60 45.45 -152 25.06 985 L4 1991/07/01 CDD 58 55.771 -153 38.558 622 S13 1981/08/17 ETKA 51 51.712 -176 24.351 290 L4 1999/09/15 MMN 59 11.11 -154 20.20 442 S13 1981/08/22 OPT 59 39.192 -153 13.796 634 S13 1974/00/00 PDB 59 47.27 -154 11.55 305 S13 1978/09/09 STLK 61 29.926 -151 49.963 945 L4 1997/09/01 Station Codes: 3 Three-component station * REF also has a low-gain vertical component. ** Temporary stations removed on 2005/09/14 Seismometer Codes: CMG-40T Guralp CMG-40T 60 second natural period three-component broadband seismometer CMG-6TD: Guralp CMG-6TD 30 second natural period three-component broadband seismometer L4 Mark Products L4 one second natural period single-component seismometer L4-3D: Mark Products L4-3D one second natural period three-component seismometer L22: Mark Products L22 0.5 second natural period three-component seismometer S13: Teledyne Geotech S13 one second natural period single-component seismometer

52
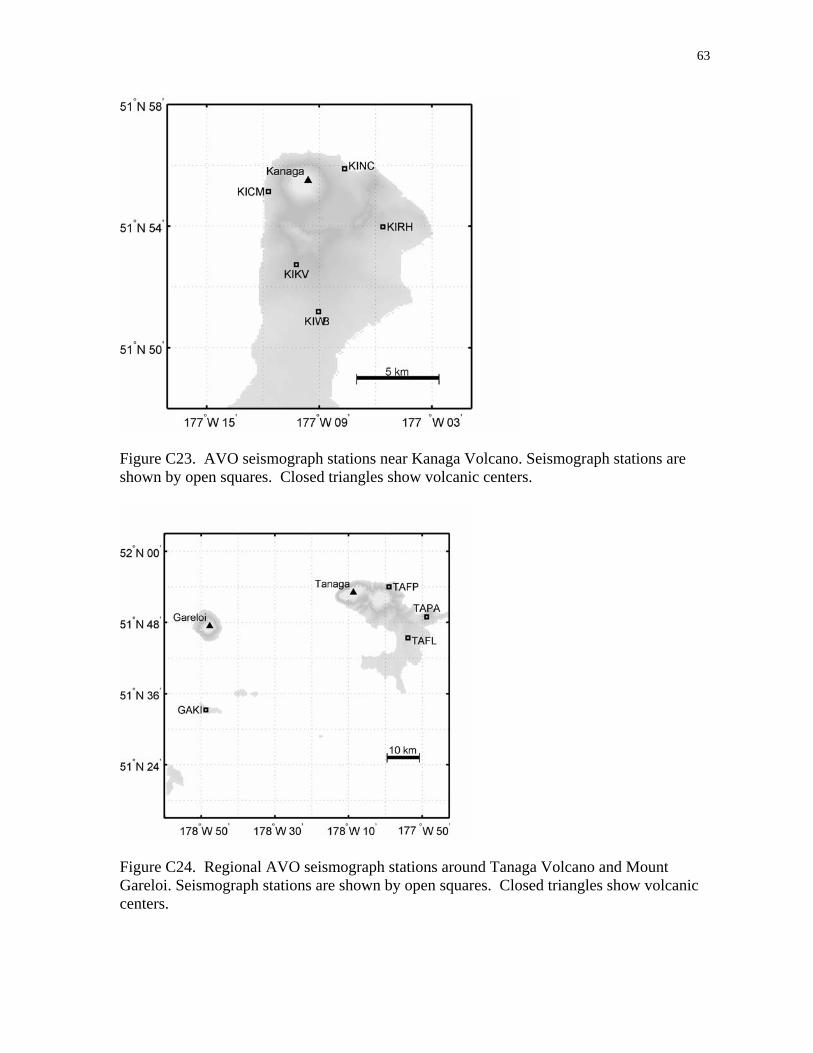
Appendix C: Figures showing the locations of the permanent AVO regional and volcano-specific seismograph stations in 2005. In all figures, closed triangles show volcanic centers and open squares show seismograph stations.
Figure C1. Regional AVO seismograph stations in Cook Inlet. Seismograph stations are shown by open squares. Closed triangles show volcanic centers.
Figure C2. AVO seismograph stations near Mount Wrangell. Seismograph stations are shown by open squares. Closed triangles show volcanic centers.

53
Figure C3. AVO seismograph stations near Mount Spurr. Seismograph stations are shown by open squares. Closed triangles show volcanic centers.
Figure C4. AVO seismograph stations near Redoubt Volcano. Seismograph stations are shown by open squares. Closed triangles show volcanic centers.

54
Figure C5. AVO seismograph stations near Iliamna Volcano. Seismograph stations are shown by open squares. Closed triangles show volcanic centers.
Figure C6. AVO seismograph stations near Augustine Volcano. Seismograph stations are shown by open squares. Closed triangles show volcanic centers.

55
Figure C7. AVO seismograph stations near the Katmai volcanic cluster. Seismograph stations are shown by open squares. Closed triangles show volcanic centers.
Figure C8. AVO seismograph stations near the Mount Peulik. Seismograph stations are shown by open squares. Closed triangles show volcanic centers.

56
Figure C9. AVO seismograph stations near Aniakchak Crater. Seismograph stations are shown by open squares. Closed triangles show volcanic centers.
Figure C10. AVO seismograph stations near Mount Veniaminof. Seismograph station BPBC is not shown and is located 70 km northeast of Mount Veniaminof. Seismograph stations are shown by open squares. Closed triangles show volcanic centers.

57
Figure C11. Regional AVO seismograph stations on the western end of the Alaska Peninsula. Seismograph stations are shown by open squares. Closed triangles show volcanic centers.
Figure C12. AVO seismograph stations near Pavlof Volcano. Seismograph stations are shown by open squares. Closed triangles show volcanic centers.
58
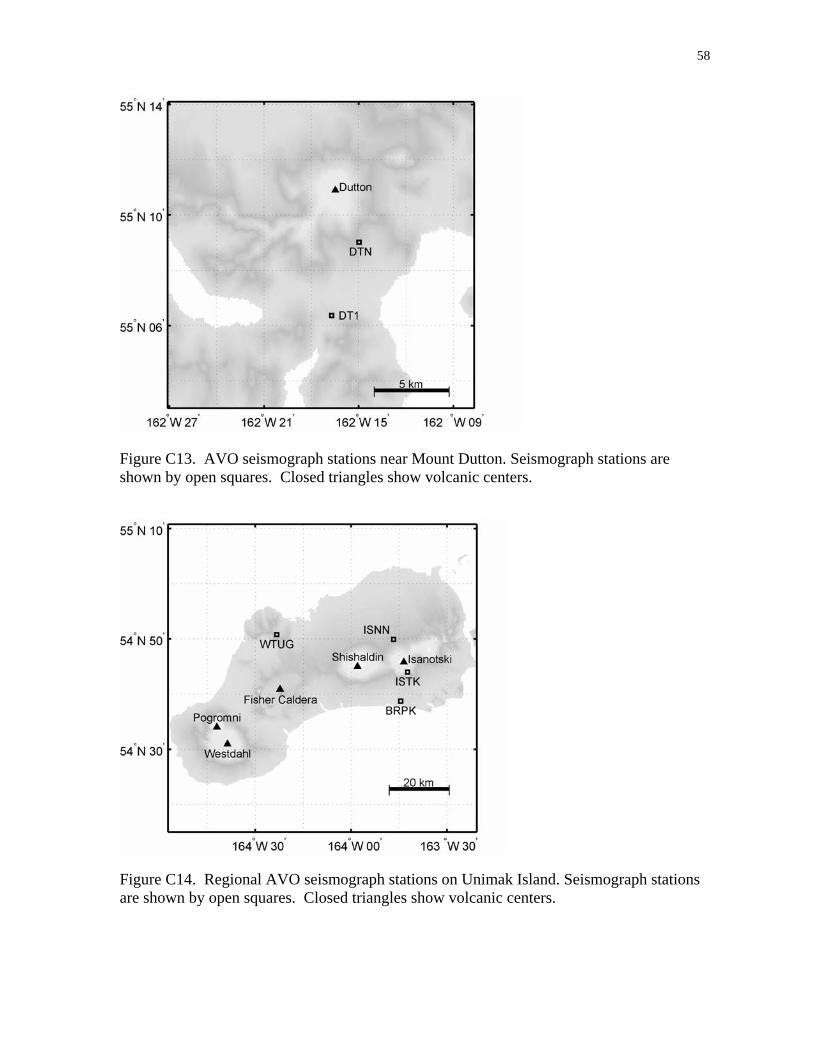
Figure C13. AVO seismograph stations near Mount Dutton. Seismograph stations are shown by open squares. Closed triangles show volcanic centers.
Figure C14. Regional AVO seismograph stations on Unimak Island. Seismograph stations are shown by open squares. Closed triangles show volcanic centers.
59
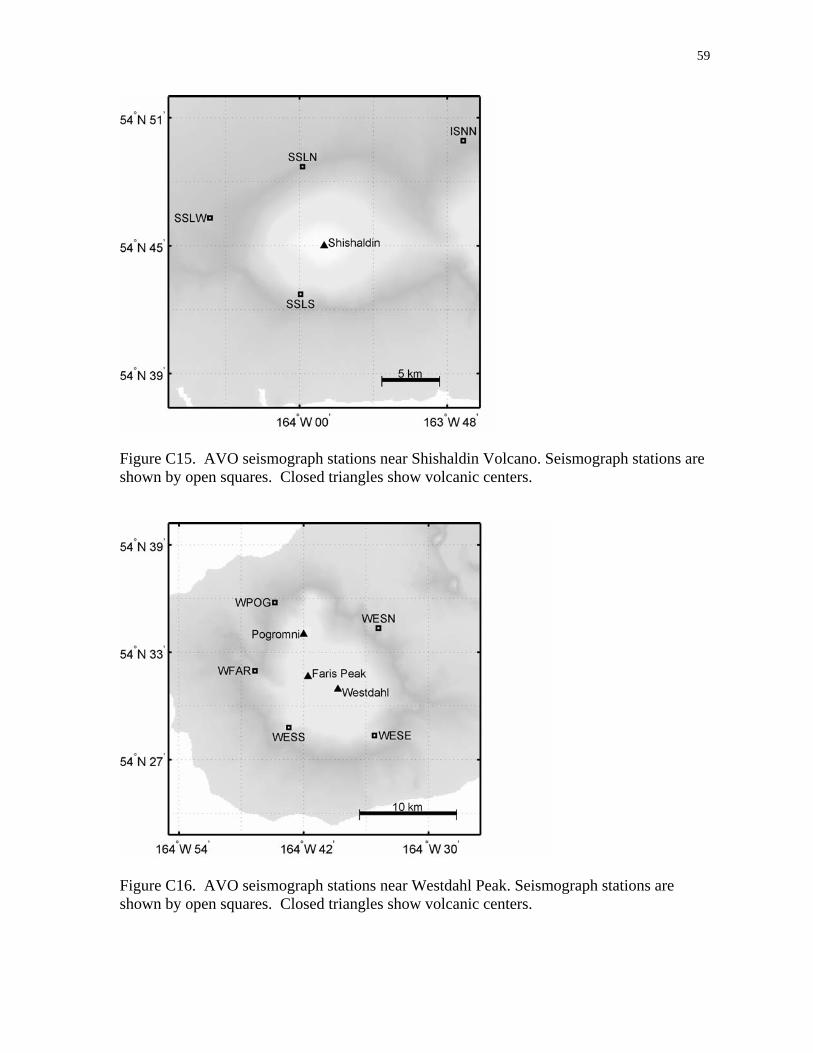
Figure C15. AVO seismograph stations near Shishaldin Volcano. Seismograph stations are shown by open squares. Closed triangles show volcanic centers.
Figure C16. AVO seismograph stations near Westdahl Peak. Seismograph stations are shown by open squares. Closed triangles show volcanic centers.

60
Figure C17. AVO seismograph stations near Akutan Peak. Seismograph stations are shown by open squares. Closed triangles show volcanic centers.
Figure C18. AVO seismograph stations near Makushin Volcano. Seismograph stations are shown by open squares. Closed triangles show volcanic centers.

61
Figure C19. AVO seismograph stations near Okmok Volcano. Seismograph stations are shown by open squares. Closed triangles show volcanic centers.
Figure C20. AVO seismograph stations near Korovin Volcano. Seismograph stations are shown by open squares. Closed triangles show volcanic centers.

62
Figure C21. Regional AVO seismograph stations around Adak Island. Seismograph stations are shown by open squares. Closed triangles show volcanic centers.
Figure C22. AVO seismograph stations near Great Sitkin Volcano. Seismograph stations are shown by open squares. Closed triangles show volcanic centers.
63
Figure C23. AVO seismograph stations near Kanaga Volcano. Seismograph stations are shown by open squares. Closed triangles show volcanic centers.
Figure C24. Regional AVO seismograph stations around Tanaga Volcano and Mount Gareloi. Seismograph stations are shown by open squares. Closed triangles show volcanic centers.
64
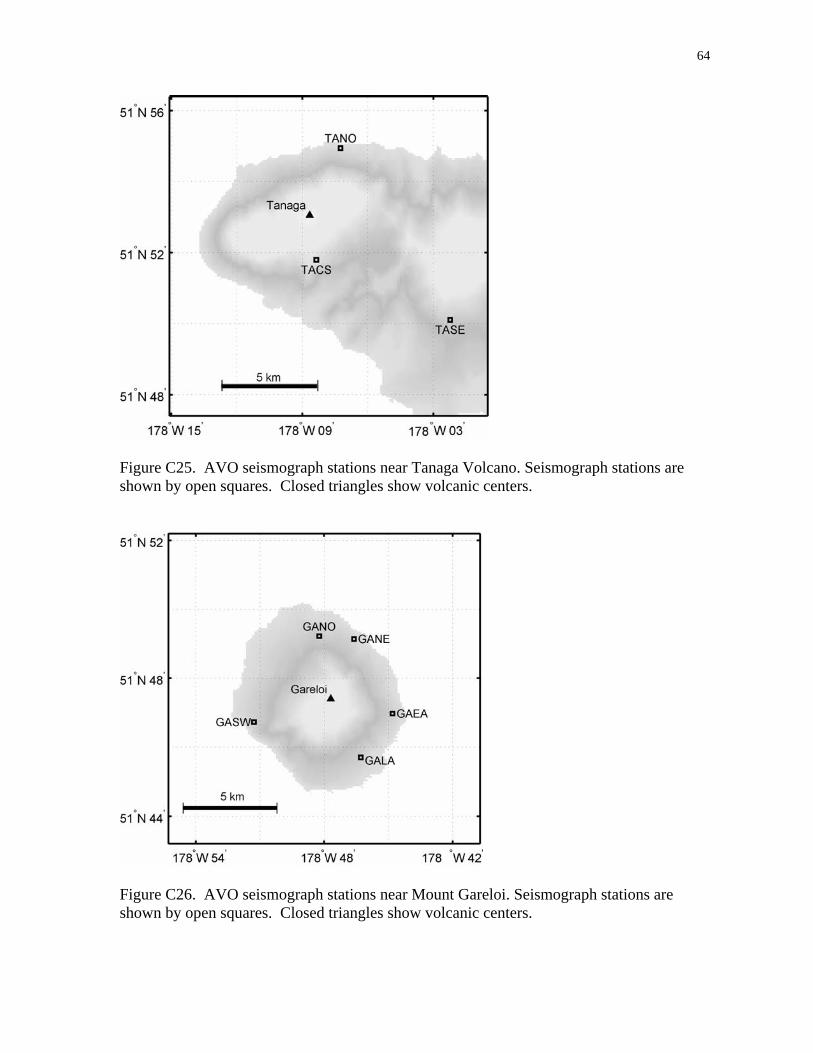
Figure C25. AVO seismograph stations near Tanaga Volcano. Seismograph stations are shown by open squares. Closed triangles show volcanic centers.
Figure C26. AVO seismograph stations near Mount Gareloi. Seismograph stations are shown by open squares. Closed triangles show volcanic centers.

65
Figure C27. AVO seismograph stations on Semisopochnoi Island. Seismograph stations are shown by open squares. Closed triangles show volcanic centers.
Figure C28. AVO seismograph stations on Little Sitkin Island. Seismograph stations are shown by open squares. Closed triangles show volcanic centers.
66
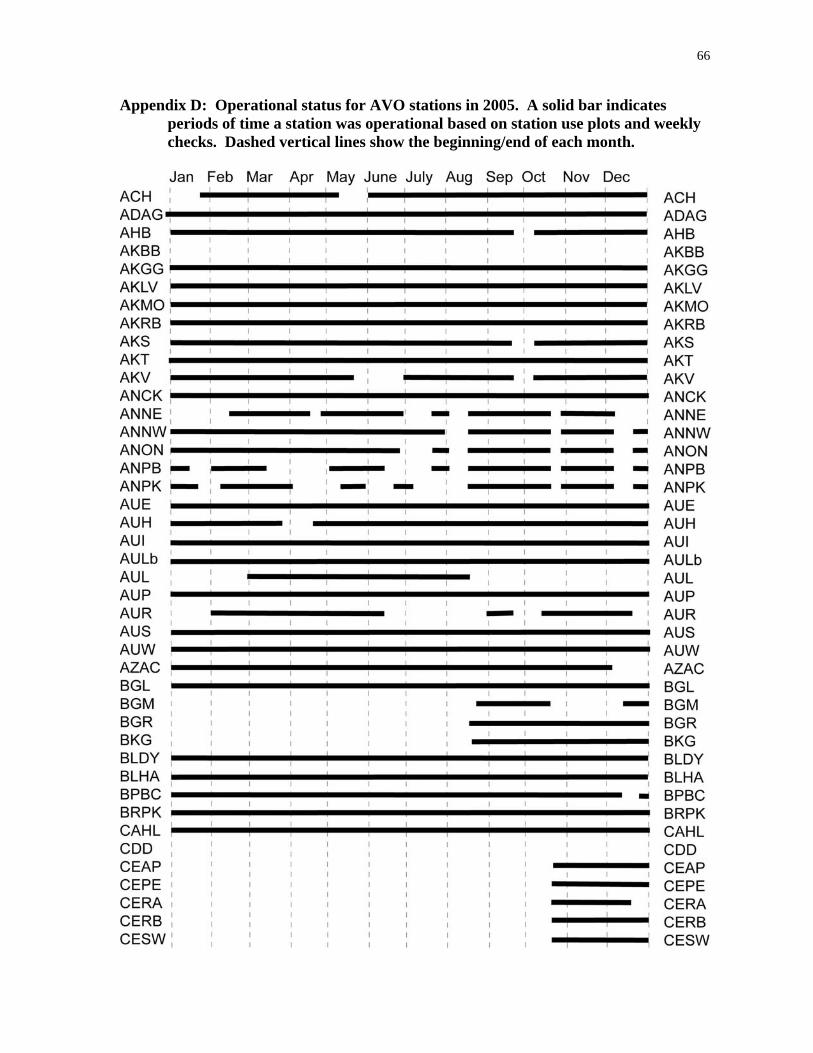
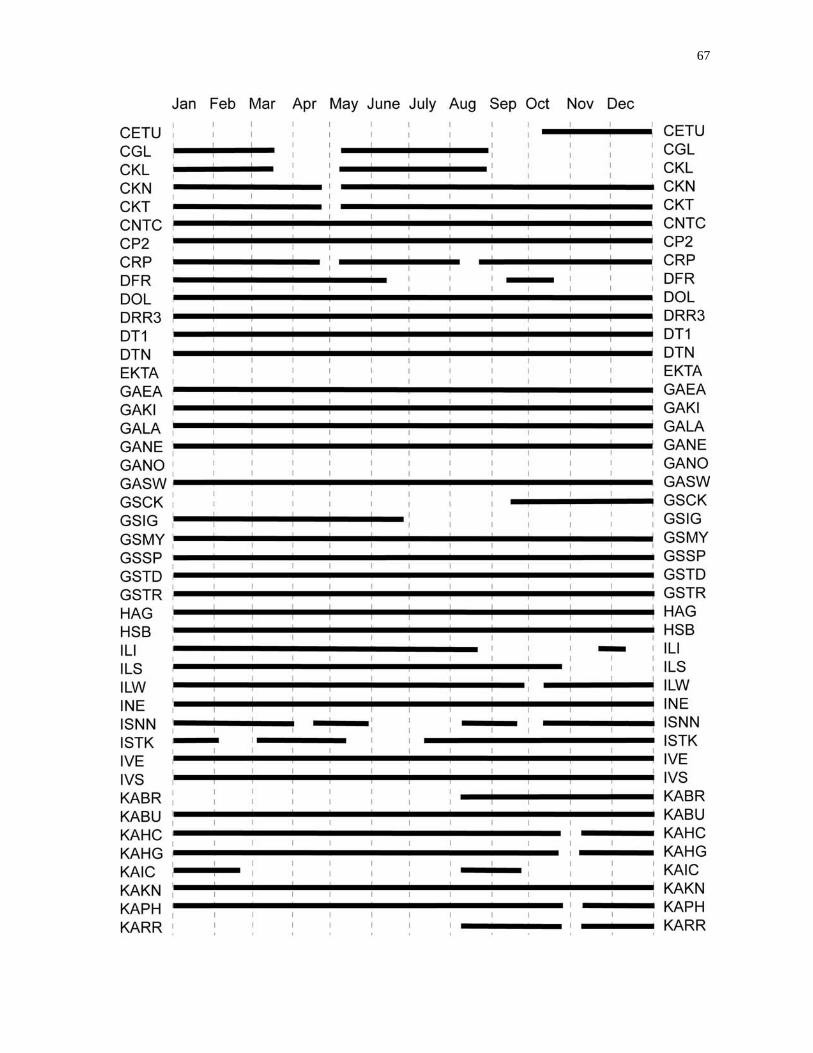
Appendix D: Operational status for AVO stations in 2005. A solid bar indicates periods of time a station was operational based on station use plots and weekly checks. Dashed vertical lines show the beginning/end of each month.
67

68

69

70

71
Appendix E: Seismic velocity models used in locating the earthquakes described in this
report. Following the name of each velocity model is a list of volcano subnetworks for which the model is used. Depths are referenced to sea level, with negative values reflecting height above sea level.
Cylindrical Model Parameters (Latitude and Longitude are the center of the model) Velocity Model Latitude (°N) Longitude (°E) Radius (km) Top (km) Bottom (km)
Spurr 61.60 -152.40 20 -3 50 Spurr 61.47 -152.33 20 -3 50 Spurr 61.33 -152.25 20 -3 50 Spurr 61.17 -152.35 20 -3 50 Spurr 61.00 -152.45 20 -3 50
Redoubt 60.83 -152.55 20 -3 50 Redoubt 60.66 -152.66 20 -3 50 Redoubt 60.49 -152.75 20 -3 50 Redoubt 60.34 -152.86 20 -3 50 Redoubt 60.19 -152.98 20 -3 50 Redoubt 59.87 -153.17 20 -3 50 Redoubt 59.70 -153.25 20 -3 50 Redoubt 59.53 -153.34 20 -3 50 Iliamna 60.03 -153.09 20 -3 50
Augustine 59.36 -153.42 20 -3 50 Katmai 58.17 -155.35 20 -3 50 Katmai 58.29 -154.86 20 -3 50 Katmai 58.35 -155.09 20 -3 50 Katmai 58.43 -154.38 20 -3 50
Veniaminof 56.18 -159.38 30 -3 50 Cold Bay 55.42 -161.89 20 -3 50 Cold Bay 55.18 -162.27 20 -3 50 Cold Bay 54.76 -163.97 30 -3 50 Westdahl 54.52 -164.65 20 -3 50 Akutan 54.15 -165.97 20 -3 50
Andreanof 52.08 -176.13 20 -3 50 Andreanof 51.93 -176.75 20 -3 50 Andreanof 51.92 -177.17 20 -3 50
Tanaga 51.89 -178.15 20 -3 50 Regional Velocity Model (for all areas south of 62.5°N not covered by a volcano specific model): Aniakchak, Gareloi, Korovin, Little Sitkin, Makushin, Okmok, Peulik, Semisopochnoi, and Wrangell (Fogleman and others, 1993).
Layer number Vp (km/sec) Top of layer (km) Vp/Vs1 5.3 -3.0 1.78 2 5.6 4.0 1.78 3 6.2 10.0 1.78 4 6.9 15.0 1.78 5 7.4 20.0 1.78 6 7.7 25.0 1.78 7 7.9 33.0 1.78 8 8.1 47.0 1.78 9 8.3 65.0 1.78

72
Akutan Velocity Model: Akutan (Power and others, 1996). Layer number Vp (km/sec) Top of layer (km) Vp/Vs
1 2.30 +0.37 km/sec for each km of depth -3.0 1.80 2 6.30 7.0 1.80
Andreanof Velocity model: Great Sitkin, and Kanaga (Toth and Kisslinger, 1984).
Layer number Vp (km/sec) Top of layer (km) Vp/Vs1 3.50 -3.0 1.73 2 3.88 -2.8 1.73 3 4.25 -2.6 1.73 4 4.62 -2.4 1.73 5 5.00 -2.2 1.73 6 5.50 -2.0 1.73 7 5.62 -1.0 1.73 8 5.74 0.0 1.73 9 5.86 1.0 1.73
10 5.98 2.0 1.73 11 6.10 3.0 1.73 12 6.60 4.0 1.73 13 6.68 5.0 1.73 14 6.80 8.0 1.73 15 6.92 11.0 1.73 16 7.04 14.0 1.73 17 7.16 17.0 1.73 18 7.28 20.0 1.73 19 7.85 23.0 1.73 20 8.05 37.0 1.73
Augustine Velocity Model: Augustine (Power, 1988).
Layer number Vp (km/sec) Top of layer (km) Vp/Vs1 2.3 -3.0 1.80 2 2.6 -0.7 1.80 3 3.4 0.0 1.80 4 5.1 1.0 1.80 5 6.3 9.0 1.78 6 8.0 44.0 1.78
Cold Bay Velocity Model: Dutton, Pavlof, and Shishaldin (McNutt and Jacob, 1986).
Layer number Vp (km/sec) Top of layer (km) Vp/Vs1 3.05 -3.00 1.78 2 3.44 0.00 1.78 3 5.56 1.79 1.78 4 6.06 3.65 1.78 5 6.72 10.18 1.78 6 7.61 22.63 1.78 7 7.90 38.51 1.78
73
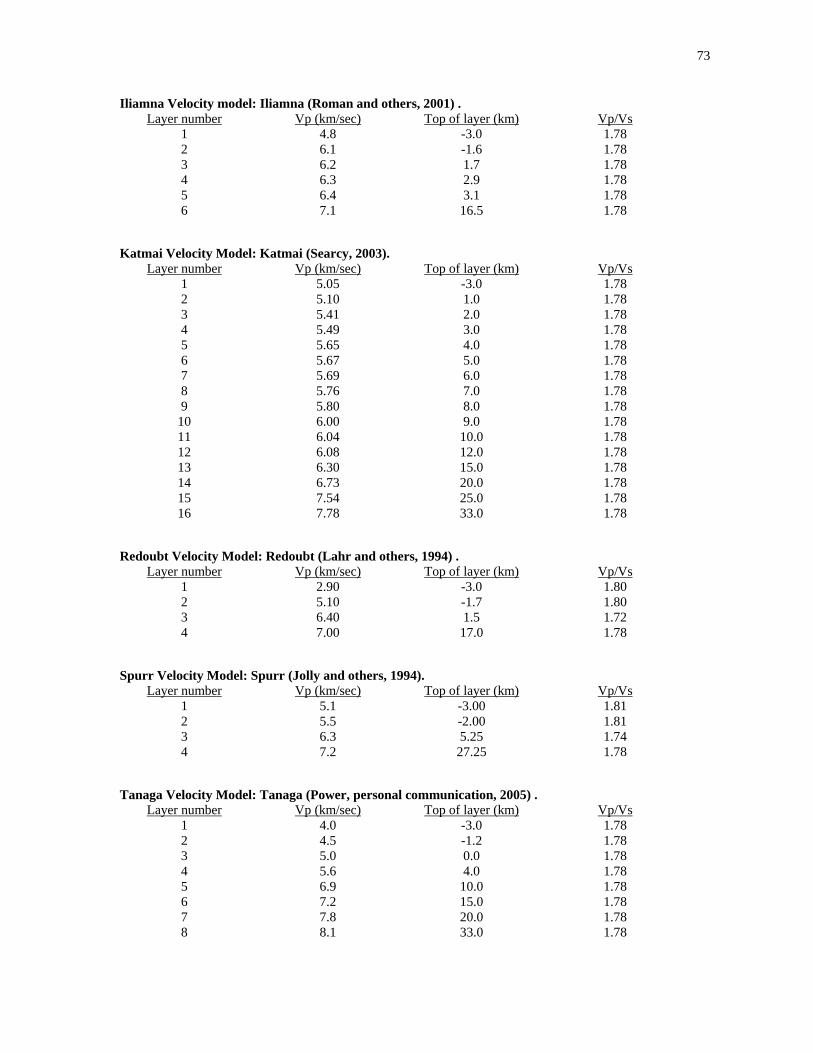
Iliamna Velocity model: Iliamna (Roman and others, 2001) . Layer number Vp (km/sec) Top of layer (km) Vp/Vs
1 4.8 -3.0 1.78 2 6.1 -1.6 1.78 3 6.2 1.7 1.78 4 6.3 2.9 1.78 5 6.4 3.1 1.78 6 7.1 16.5 1.78
Katmai Velocity Model: Katmai (Searcy, 2003).
Layer number Vp (km/sec) Top of layer (km) Vp/Vs1 5.05 -3.0 1.78 2 5.10 1.0 1.78 3 5.41 2.0 1.78 4 5.49 3.0 1.78 5 5.65 4.0 1.78 6 5.67 5.0 1.78 7 5.69 6.0 1.78 8 5.76 7.0 1.78 9 5.80 8.0 1.78
10 6.00 9.0 1.78 11 6.04 10.0 1.78 12 6.08 12.0 1.78 13 6.30 15.0 1.78 14 6.73 20.0 1.78 15 7.54 25.0 1.78 16 7.78 33.0 1.78
Redoubt Velocity Model: Redoubt (Lahr and others, 1994) .
Layer number Vp (km/sec) Top of layer (km) Vp/Vs1 2.90 -3.0 1.80 2 5.10 -1.7 1.80 3 6.40 1.5 1.72 4 7.00 17.0 1.78
Spurr Velocity Model: Spurr (Jolly and others, 1994).
Layer number Vp (km/sec) Top of layer (km) Vp/Vs1 5.1 -3.00 1.81 2 5.5 -2.00 1.81 3 6.3 5.25 1.74 4 7.2 27.25 1.78
Tanaga Velocity Model: Tanaga (Power, personal communication, 2005) .
Layer number Vp (km/sec) Top of layer (km) Vp/Vs1 4.0 -3.0 1.78 2 4.5 -1.2 1.78 3 5.0 0.0 1.78 4 5.6 4.0 1.78 5 6.9 10.0 1.78 6 7.2 15.0 1.78 7 7.8 20.0 1.78 8 8.1 33.0 1.78

74
Veniaminof Velocity Model: Veniaminof (Sánchez, 2005) . Layer number Vp (km/sec) Top of layer (km) Vp/Vs
1 4.82 -3.0 1.73 2 5.23 4.0 1.88 3 5.23 10.0 1.38 4 6.49 15.0 1.65 5 6.52 20.0 1.51 6 8.18 25.0 1.89 7 8.21 33.0 1.90 8 8.21 47.0 1.80 9 8.30 65.0 1.78
Westdahl Velocity Model: Westdahl (Dixon and others, 2005).
Layer number Vp (km/sec) Top of layer (km) Vp/Vs1 3.03 -3.0 1.71 2 3.18 0.0 1.71 3 5.03 2.0 1.71 4 5.70 8.0 1.71 5 6.30 10.0 1.71 6 6.82 16.0 1.71 7 7.17 26.0 1.71 8 8.16 38.0 1.71

75
Appendix F: Maps showing the location of volcanic zones modeled using multiple cylinders. Volcanic centers, modeled by a single cylinder, are not shown.
Figure F1. Volcanic zones for the Cook Inlet Volcanoes. Five overlapping cylinders model the Spurr volcanic zone. Four overlapping cylinders model the Redoubt volcanic zone. Single cylinders model the Iliamna and Augustine volcanic zones.
Figure F2. Volcanic zone for the Katmai volcanic cluster. The volcanic zone is modeled using four cylinders centered on Mount Martin, Mount Katmai, Mount Griggs and Mount Steller.

76
Figure F3. Volcanic zones for Mount Veniaminof Dutton. The volcanic zone is modeled using a single cylinder.
Figure F4. Volcanic zones in the Adak region. The volcanic zones are modeled using cylinders centered on Kanaga Volcano, Mount Moffet, and Great Sitkin Volcano.

77
Appendix G: Previous AVO Earthquake Catalogs.
1989-90: Power, J. A., G. D. March, J. C. Lahr, A. D. Jolly, and G. R. Cruse (1993). Catalog of earthquake hypocenters at Redoubt Volcano and Mount Spurr, Alaska: October 12, 1989-December 31, 1990, U.S. Geol. Surv. Open-File Rept., 93-685-A, 57 p.
1991-93: Jolly, A. D., J. A. Power, S. D. Stihler, L. N. Rao, G. Davidson, J. Paskievitch, S.
Estes, J. C. Lahr (1996). Catalog of earthquake hypocenters for Augustine, Redoubt, Iliamna, and Mount Spurr Volcanoes, Alaska: January 1, 1991 – December 31, 1993, U.S. Geol. Surv. Open-File Rept. 96-70, 90 p.
1994-99: Jolly, A. D., S. D. Stihler, J. A. Power, J. C. Lahr, J. Paskievitch, G., Tytgat, S.
Estes, A. B. Lockhart, S. C. Moran, S. R. McNutt, and W. R. Hammond (2001). Catalog of earthquake hypocenters at Alaskan Volcanoes: January 1, 1994 – December 31, 1999, U.S. Geol. Surv. Open-File Rept. t 01-189, 202 p.
2000-01: Dixon, J. P, S. D. Stihler, J. A. Power, G. Tytgat, S. Estes, S. C. Moran, J.
Paskievitch, and S. R. McNutt (2002). Catalog of Earthquake Hypocenters at Alaska Volcanoes: January 1, 2000 – December 31, 2001, U.S. Geol. Surv. Open-File Rept. 02-342, 56 p.
2002: Dixon, J. P., S. D. Stihler, J. A. Power, G. Tytgat, S. C. Moran, J. J. Sánchez, S.
Estes, S. R. McNutt and J. Paskievitch (2003). Catalog of Earthquake Hypocenters at Alaska Volcanoes: January 1 – December 31, 2002, U.S. Geol. Surv. Open-File Rept. 03-267, 58 p.
2003: Dixon, J. P., S. D. Stihler, J. A. Power, G. Tytgat, S. C. Moran, J. J. Sánchez, S.
Estes, S. R. McNutt, and J. Paskievitch (2004). Catalog of Earthquake Hypocenters at Alaska Volcanoes: January 1 – December 31, 2003, U.S. Geol. Surv. Open-File Rept. 2004-1234, 59 p.
2004: Dixon, J. P., S. D. Stihler, J. A. Power, G. Tytgat, S. Estes, S. Prejean, J. J.
Sánchez, R. Sanches, S. R. McNutt, and J. Paskievitch (2005). Catalog of Earthquake Hypocenters at Alaskan Volcanoes: January 1 through December 31, 2004, U.S. Geol. Surv. Open-File Rept. 2005-1312, 74 p.

78
Appendix H: Selected AVO papers published in 2005 De Angelis, S. and S. R. McNutt (2005). Degassing and hydrothermal activity at Mt. Spurr, Alaska during the summer of 2004 inferred from the complex frequencies of long-period events, Geophys. Res. Lett., 32, L12312, Doi: 10.1029/2005GL022618. Lu, Z., C. Wicks, O. Kwoun, J. A. Power, D. Dzurisin (2005). Surface deformation associated with the March 1996 earthquake swarm at Akutan Island, Alaska, revealed by C-band ERS and L-band radar interferometry, Can. J. Remote Sensing, 31, 7-20. McNutt, S. R. (2005). A Review of Volcanic Seismology. Ann. Rev. Earth Planet. Sci., 33, 461-491 doi: 10.1146/annurev.earth.33.092203.122459. West, M., J. J. Sánchez, and S. R. McNutt (2005). Periodically-triggered seismicity at Mt. Wrangell volcano following the Sumatra-Andaman Islands earthquake, Science, 308, 1144-1146.