Embed Size (px)
Citation preview

Metals Analyzer
User's Manual
June 1996 V 1.1
NCCOSC RDT&E DIV Code 36

Metal Analyzer User's Manual
Table Of Contents 1.0 Metal Analyzer Instrument Overview
1.1 Operational Description
1.2 Implemented Configuration
2.0 Recommended Setup Procedures
2.1 Initial (Dry) Setup
2.2 Daily Setup
2.3 System Volumes Calibration
2.4 System Bias Calibration
3.0 Typical Usage Guidelines
3.1 Reagents
3.2 Film Preperation
3.3 Measurement Modes
4.0 Metal Analyzer Software
4.1 Initial Display
4.2 Main Display
4.2.1 Display Composition
4.2.2 Manual Ops Menu
4.2.3 Edit Menu
4.2.4 Run Menu
4.2.5 Analysis Menu
4.2.6 File Menu
Appendix A: System Configuration Information

APPENDIX A
METAL ANALYZER Configuration Information
NR51 v1.2

METAL ANALYZER USER'S MANUAL
NCCOSC RDT&E DIV CODE 361 NOVEMBER 22, 1995

1
1.0 Metal Analyzer Instrument Overview
1.1 Operational Description
The Metal Analyzer is a PC based instrument built for detecting and measuring trace levels of heavy metals in water. The Metal Analyzer or MA unit, siphons water samples into an electrochemical cell, injects reagents and performs trace metal analysis based on potentionmetric stripping analysis (PSA) methods to determine the contaminant metal(s) composition and concentration. The treated sample is later pumped into a waste reservoir. The sampling, measurement and analysis is fully automated under computer control with pull down menus and button bars provided for the user interface.
To date, three metals have been tested successfully with the MA unit: Pb (Lead), Cd (Cadmium) and Zn (Zinc). Comparison testing has been conducted between Metal Analyzer ( PSA) and AA (atomic absorbtion) methods using split water samples. Results for the Pb and Cd samples achieved a 98% correlation coefficient between the AA and PSA methods. Using PSA methods, up to 40 different metals can be detected and their concentrations determined.
The "heart"of the MA Instrument is the electrochemical cell composed of plexiglass, teflon and other inert materials. The cell contains several inlet ports for reagent additions as well as a water sample inlet(fill), an outlet(drain) and an overflow port. The cell interfaces to the electronics via a three electrode system (working, reference and counter electrodes) used in potentiometric stripping analysis (PSA).
Prior to a water sample measurement, a mercury film is applied to the working electrode via an automated procedure. During a water sample measurement, the siphoned water in the cell is treated with various reagents to faciliatate the PSA process. A measurement cycle consists of applying a negative potential to the solution in the cell and upon removal of the potential, monitoring the potential decay over time. During the plating period, the heavy metals in the solution will tend to amalgamate or dissolve into the mercury film. During the potential decay or stripping period, the heavy metals are "stripped"or removed out of the mercury film, with each metal observing a characteristic stripping potential. The concentration of a particular heavy metal is determined from the amount of time spent at the metal's characteristic stripping potential.
The results of the potentionmetric stripping analysis are stored and displayed in a histogram format (i.e. the number of occurrances per voltage range or bin are calculated). Typically an addition of a metal standard (of known quantity) is later added to the water sample to provide a reference measurement which is used to extrapolate the initial water sample metal concentration. Figure 1-1 shows a histogram profile for a tap water sample with a standard addition (using a Lead (Pb) and Cadmium (Cd) standard).

2
Figure 1-1
1.2 Implemented Configuration
The MA instrument is composed of two main assemblies: 1) a mechanical and electro-chemical assembly (Part No. NR34) and 2) an electronics and user interface assembly ( Part No. NR35: desktop version, Part No. NR36: portable version). The inter-connection between the two main assemblies consists of a molded DB37 cable and electrometer triax cables (one for each electrode). Only the NR35/36 assemblies require external 120 VAC power. For more information on system configurations, refer to appendix A - Metal Analyzer Configuration Information.
The NR34 assembly contains the electrochemical cell with a magnetically coupled stirrer bar, stirrer motor with reduction gear, four reagents in individual container assemblies with respective miniture displacement pumps, cell fill and drain pumps, valve used to "flush" cell manifold, inert PFA jar for water sample, a 500ml HDPE waste container, and two 250ml HDPE containers used for cell preparation and rinsing. All the tubing is

3
either 1/16" or 1/8" inert teflon tubing terminated with the appropriate flangeless nut and ferrule.
Typically the cell is filled with a tap water sample, and later reagents are injected and mixed into the cell solution. During reagent injection (including standard addition), the stirrer bar action is halted, to better provide a previous homogeneous concenctration of reagents from which to calcualate the effects of the displaced solution into the overflow adapter.
On the cell cover (rev B), three ports are provided for electrodes and one for a manifold. The lower-most port is of slightly larger diameter and is reserved for the reference electrode. The working electrode is inserted in the port next to the reference and the counter electrode is placed in the topmost port. All electrodes require an o-ring positioned on the "collar" for a water-tight seal and are held in place by an electrode holder that is screwed in the electrode port. The electrode holders can be screwed in manually fingertight or a keyed tool can be used to insert the holders. The cell cover and manifold also have o-rings to provide a water-tight seal but typically do not require routine removal or adjustment. The cell cover is held in place over the cell body by four screws. The manifold interfaces to the cell cover and provides an indirect entry to the cell for the standard solution. The manifold is a cylindrical plexiglass fitting with an internal "T" pathway. During a standard addition cycle, the standard solution is injected into the manifold corridor and later "flushed" out into the cell with the water sample solution.
The cell body (rev C) contains a shallow cylindrical cavity with six access ports. The fill (side port), drain (lower-most port) and overflow (uppermost port) all have larger port diameters than the three reagent ports: matrix, psa acid and rinse acid (to minimize reagent diffusion into the cell solution). The stirrer bar is magnetically coupled with the stirrer motor/reduction gear shaft and the center is held in position by two small circular cutouts in both the cell body and cover. The magnets in the stirrer bar and reduction gear shaft ( 2 on each side) are installed with alternating polarity to maximize torque. The stirrer motor/reduction gear assembly attaches a motor mount collar to the reduction gear body and a cylindrical column with cutouts for the two magnets onto the reduction gear shaft. This assembly is aligned to the cell by two set screws thru the motor mount collar into the rear cell cavity. The cell body is held in place by four screws from the back. The overflow adapter is connected to the uppermost port of the cell body and provides an "airbreak" mechanism to route the solution overflow into the waste reservoir.
NR35/36 contains both the COTS (Commercial Off The Shelf) PC electronics as well as the custom ISA compatible MA circuit cards and MA application software. NR35 is the desktop PC version and consists of a PC compatible computer with the following: SVGA monitor, keyboard, trackball, 486DX33 CPU 16 MB RAM MIN, 3.5" FDD, IDE HDD 250MB MIN , 2 spare ISA slots for MA custom boards, DOS6.2 and WIN 3.1 MIN. NR36 is the current "portable" version and uses a MIPC box with an integrated LCD display, a reduced size keyboard & trackball, 1/2 AT board size CPU and with the remaining PC requirements being identical to the NR35. The NR36 along with the

4
mechanical/electrochemical NR34 unit can each be fitted into an ATA type case for transport to a test site. Both NR35/36 configurations require the custom MA circuit cards which consist of a two board set: an analog/digital board with an IO driver piggyback card and a baseboard with an electrometer piggyback card.
The electrometer piggyback card interfaces to the electrochemical cell via the triax connections to the electrode posts. The counter and the working electrode triax connection is a snug slip on connection but the reference electrode uses an alligator clip due to the fragile nature of the reference electrode glass housing. The electrometer features a three electrode implementation with guarding and shielding for each signal line. Guarding involves setting the inner shield to the same potential as the signal to minimize current flow and maximize input impedance. To optimize performance, the triax cables are terminated directly to the electrometer printed circuit board and require careful handling. The working electrode is used to both apply a plating potential or voltage as well as to monitor the potential decay. The reference electrode input is used as a summing point to add the programmed plating voltage to and also as a reference point during monitoring the potential decay after a plating cycle. The counter electrode is used during plating only, as a source of electrons. The electrometer also features a programmable gain amplifier and a HP/BP/LP (High Pass/Band Pass/Low Pass) Filter. The electrometer receives the Initial Potential and Relay Control Signals from the Analog/Digital Board and transmits the differential Electrometer Signal.
The Analog/Digital Board receives the differential Electrometer Signal from the Electrometer and performs the A/D conversion using a 1 MHZ 12 BIT A/D set to an input range of -2.5 Volts to 0 Volts. The A/D data output is not stored directly, instead it is used as a pointer into memory or RAM, and the incidences of occurrance within each 4096 0.6 mV (LSB) voltage bins are calculated. The result stored in RAM is in a histogram type data format. (This requires less memory and is less CPU intensive since the data collection and histogram function is done in hardware on the Analog/Digitial board). The data aquisition is a gated or windowed process contingent on a start and stop voltage level being detected. Currently the start and stop voltage levels are deter-mined by two individual resistor divider circuits. The Analog portion of the Analog-/Digital board can receive power from either the ISA bus or from a DC/DC converter. Refer to appendix A for more information on jumper settings.
The IO piggyback provides twelve 12V high current line drivers to control the pumps, motor and valves located in the NR34 Mechanical Assembly. The DB37 connector from the Analog/Digital board is the IO Pump output from the IO piggyback and interfaces to the NR34 Mechanical Assembly via a molded cable assembly. The Baseboard also has a DB37 connector but at this time it is unused. Also both the Analog/Digital board and the Baseboard have a mini DIN circular connector to provide external electromenter inputs and outputs but neither are used at this time.

5
2.0 Recommended Setup Procedures
2.1 Initial (Dry) Setup
After initial shipment or unattended transport, the system will be dry or empty of reagents. Initial checkout should involve the use of water to verify the integrity of the seals in the electrochemical cell as well as the tubing and fittings throughout the system. Electrodes with o-rings positioned on the collar need to be inserted using the electrode holders by screwing into the cell cover plate (or an equivalent plug). The sample and reagent bottles should be filled with water. Typically all four reagent and sample lines are "primed" or filled with water as well as the cell for all least 1 hour, but overnight is preferable. All fittings should be fingertight only, excessive force can cause cracks to the plexiglass cell and impair the seal in the flangeless fittings. Any ports or fittings found leaking, usually require only a small tightening adjustment. If tightening fails, the fitting will have to be removed, and the o-ring or flangeless ferule repositioned (can be optionally replaced if unsuccessful in achieving a seal). The system must be completely watertight before proceeding to the next step: installing the reagent solutions. Failure to comply with this could result in a hazardous operational condition of the MA unit.
Upon verifying the system seal integrity, the four reagent solutions can be added to the system. Prior to the reagent solution installation, verify that the sample line has been primed and the sample jar is full of water (tap or distilled water). Also due to the reagent solutions element composition and concentrations (extrememly acidic and/or hazardous material), use of protective eyewear and safety gloves is recommended during the reagent solution installation. Use of the MA software menu command PRIME <reagent: matrix, psa acid, rinse acid, or standard> is recommened. The PRIME <reagent> is a MA software Manual Ops (Operations) command and more information is available in section 4.2.2. Each prime or line fill operation is followed by a cell rinse. It is recommended to prime the rinse acid reagent solution first, since this solution is optionally injected into all the cell rinses (This is especially important during a rinse after priming the standard reagent). Sometimes air bubbles are visible in the reagent lines (either right after the initial priming or the next day, after the lines have settled). The reagent lines should be re-primed to purge the air bubbles. Usually the 2nd prime command is all that is needed. After priming all four reagents, the system is ready for the daily setup initialization routine (Only Daily Setup steps 4 & 5 are applicable).
2.2 Daily Setup
After the MA unit has been unused for an overnight or longer period, the daily setup routine is recommended for best results. The daily setup routine involves: 1) Verify the sample container is full of water. 2) remove reference electrode from NaCl maintainence solution, position o-ring on collar and install in cell by screwing in electrode holder. 3) Run the charge lines command from the Manual Ops Menu. This commands three pumps for all the reagent, sample and flush lines, to top off the lines due to any evaporative effects. The charge lines command includes a cell rinse. 4) Prime the sample line with a pH2 Nitric Acid in Distilled water. This provides an initial acid rinse

6
for the entire system and an extra strength rinse for the electrochemical cell since the rinse acid reagent is also added. This step may have to be repeated if the cell or the system becomes contaminated (metal concentration readings are too high). 5) Prime the sample line with either DI (distilled) water or tap water. After completion of the daily setup, the system is ready for the film preparation covered in section 3.2.
2.3 System Volumes Calibration
This setup applies only to new systems or any system that has had one of the following items modified or replaced: fill pump,drain pump, standard pump, cell assembly. The MA software EDIT menu contains a configuration menu used to specify volumes pumped or displaced within the MA unit. Some volumes need to be precise due to the ramifications on the concentration calculations. The volumes that are precisely measured for every system are: 1) standard pump volume displaced at the output of the manifold. 2) sample fill pump volume displaced at the input to the cell cover. 3) cell solution drain pump volume displaced at the input to the waste container. 4) cell fill volume in nearest multiple of fill pumps. Typically the average of 100 pumps is used, with the standard pump volume being the average of 2 independent measurements. System volume parameters (along with other menu parameters) are stored in the MA.INI file and are logged in each system's configuration data sheet (in case the INI file is lost or corrupted). Operation of the MA unit without the correct volume parameters entered in the EDIT Confi-guration menu will yield non-optimum cell volume control and erroneous data.
2.4 System Bias Calibration
To compensate for implementation scaling biases, system bias calibration factors are included in the EDIT configuration menu. Currently the MA unit has been primarily used to determine the Pb and Cd concentrations in tap water . Bias calibrations covering the range from 0 to 60 ppb have been conducted with linear results and correlation between different films. To cover larger detection ranges, additional bias calibrations will be needed and the current bias factors may require modification into a look-up table format to accomodate the potential for different bias factors at different metal concentration levels. Bias calibration consists of measuring two factors: 1) multiplier bias factor to be applied to raw intercept data 2) constant bias factor to be subtracted from intercept data.
To determine the multiplier bias factor, a series of "dummy" samples of known concentration by volume with the metal of interest is prepared (i.e. 20 ppb lead sample). The samples are then analyzed and the ratio of the raw to the actual value is used to determine the (1 + X.XX) bias multiplier. The constant bias factor is determined after analyzing a "dummy" sample with no metal added using the same standard addition method as with the first dummy sample. Ideally this should result in a zero intercept, however due to residual metal left over from the previous measurement cycle and the quality of the rinse, this value may be higher than 0. The scaled intercept value from the second dummy sample is the constant bias or residual cross-contami-nation value. The user must enter the bias multiplier and constant into the EDIT configuration menu to

7
utilize these bias factors in subsequent measurement results. Presently both bias factors are set at 0 (no compensation required).
3.0 Typical Usage Guidelines
3.1 Reagents
Currently the MA system requires four reagents to perform trace heavy metal analysis. The four reagents are: Matrix, Standard, PSA Acid and Rinse Acid Solutions. All solutions should be made with double distilled water (this is especially important when measuring endemic metals such as Zinc) and ultrex grade reagents. The reagents (especially the Matrix and Standard) should be kept in an airtight container and refrigerated if not being used for several weeks to minimize concentration fluctuations due to evaporative effects. Caution should be used in handling the reagents since all are extremely acidic and two contain hazardous metals (Matrix and Standard). Use of protective eyeware and gloves is recommended when installing or removing reagents and/or waste solution from the MA unit.
The Standard solution is composed of double distilled water, 0.01 M (molar) HNO3 (Nitric Acid at pH 2) and one or more metal standards in typical concentrations of X000 to X00 ppb (part per billion). Typical metal standards used are : 600 ppb Pb & Cd, 1200 ppb Pb & Cd, 1200 ppb Zn, 1200 PPB Cu. For best results (minimizing standard addition linefit errors), the amount of metal standard dispensed per addition cycle (using 1 or more pumps) should be close in value to the expected metal concentration in the sample. For example: when measuring lead (Pb) in tap water, typical values range from 5 to 20 ppb so a 10 or 20ppb Pb addition would yield a more accurate answer than a 100 ppb Pb addition. For measuring an industrial, potentially highly contaminated water sample of unknown concentration, several measurement cycles using different metal addition levels may be required before accurately determining the initial sample metal concentration. Also currently the MA unit does not feature an input sample dilution function. The MA unit can analyze up to three metals concurrently, however, intermetallic effects may limit the number of concurrent metals that can be analyzed accurately.
The matrix solution is composed of double distilled water, 0.01 M HCl (Hydro-chloric acid at pH 2), 0.006 M Mercuric Chloride and 0.06 M Sodium Citrate. The Mercuric Chloride in solution provides the Hg++ ions used to form a thin mercury film on the working electrode during a negative potential plating cycle. The Sodium Citrate provides necessary electrolytes to facilitate ion mobility. Note: when analyzing seawater or any water with a high salt content (NaCl), the histogram peaks may occassionally exhibit a "double peak" due to the presence of two salts. High levels of salts in the water sample will affect sensitivity levels (usually higher) and potentially raise the baseline or noise floor. The matrix solution appears to have a "self life" of 4-5 months and sometime afterwards will begin to generate a cloudy precipitate reducing the mecury in solution.

8
Typical signs of exceeding the Matrix shelf life include a dramatic drop in sensitivity and a slightly cloudy matrix solution.
The PSA acid solution is composed of double distilled water and 0.3M HCl . Use of HCl to acidify the water sample for potentiometric stripping analysis (PSA) provides excellent intercept line fit stability (metal concentration) over a tested pH range from 2.2 to 2.8.
The Rinse acid solution is composed of double distilled water and 0.3 M HNO3 (Nitric acid). Use of HNO3 as a rinse reagent added to the water sample during a standard cell rinse cycle greatly reduces the residual contamination from the previous measurement cycle especially when using standard additions. An effective rinse (using the same molarity or concentration of HCl and HNO3 reagents) involves setting the rinse acid number of pumps (in the EDIT REAGENT menu) to one pump more than the number specified in the PSA Acid number of pumps.
3.2 Film Preparation
Prior to a flim preparation, the glassy carbon working electrode must be removed from the cell by unscrewing the electrode holder and the end wiped clean with a tissue paper. Best results are acheived by placing the tissue paper on a firm flat surface, standing the electrode upright (black shiny disk on bottom), firmly pressing the electrode bottom surface on the tissue paper and rub against in several short strokes. (Note: disk should appear shiny but not scratched. A scratched disk will result in film performance degradation). Also the glassy carbon electrode should be polished routinely (once per month minimum) per the manufacturers guidelines. Refer to Appendix C, for electrode maintainence information. After wiping or polishing the working electrode, the o-ring is positioned on the collar and re-inserted to the cell using the electrode holder.
Typical film preparation involves using either tap or distilled water as the water sample, verifying the FILM PREP submenu parameters (under the EDIT main menu) are set appropriately and executing the RUN auto film prep command (a series of pull down menus and mouse clicks). Refer to section 4.2.3 and 4.2.4 for more information on the EDIT and RUN menu commands.
Typical conditions for film preparation (application of mercury film onto glassy carbon working electrode) are: plating voltage of -0.35 to -0.30 volts, 25 to 50 µl of Matrix, HCl acid added to achieve a pH of 3 to 3.5 for the sample solution, use of a 600 sec plating interval and a negative holding potential of -0.1 to -0.02 volts to maintain the film on the electrode.
Quicker methods for film preparation involve using a higher plating potential and a shorter plating interval (i.e., -1.1 volts for 60 sec) but do not yield a film with the same quality as the "standard" or longer film preparation. Besides a holding potential to maintain the film, the cell should be filled with water if not in use for more than 20

9
minutes. Also after an extended period (1 hour or more) of unuse, prior to conducting measurements, a throw away plating cycle should be executed to recondition the film. Also when switching between different water types (i.e., DI, tap water, sea water or bay water) or right after the initial film prep , a throw away plating cycle should be executed to "normalize" the film. Currently under consideration is the addition of a "throw-away" mini plate/strip cycle (of shorter duration) to precede a regular measurement plate/strip cycle. This may preclude "false" readings due to film pecularities depending on a previous condition. Continuous PSA plating/stripping or measurment cycles yields the best results for film operation and maintainence.
Film preparation is best conducted with clean (free of organics) water, to start the film in a known good condition prior to measuring a water sample that may contain organics which would result in fouling the film . Also when preserving a film during a period of unuse, best results are acheived when using a plating solution (i.e., add matrix and HCl acid to water) with the holding potential applied.
3.3 Measurement Modes
A measurement cycle consists of the following: 1) an optional cell fill with a water sample 2) an optional reagent addition, 3) a voltage plating & stripping interval, 4) resultant data collection, display and storage, 5) an optional cell empty followed by a cell rinse, 6) an optional analysis performed on multiple measurement cycle data results or 7) an optional link to another measurement cycle. All measurement cycles perform steps 3 & 4 and generate a histogram data file appended to the initial run file.
The variations in a measurement cycle are determined by which particular measurement mode the operator has selected to execute. The MA unit currently supports four types of measurement modes: single run, standard addition run set, multiple runs, and manual cell.
In the single run mode, the operator has selected either the standard only or the standard never (also known as sample only) option. This measurement cycle consists of the following above steps: 1) cell fill with sample 2) reagent addition 3) voltage plating & stripping 4) data collection and 5) cell empty and rinse. The only difference between the standard only and standard never is whether to add the metal standard to the solution in the cell (yes for standard only, no for standard never).
In the standard addition run mode, the operator has selected the standard addition mode as well as both the number of additions and the level (in ppb) of the metal standard additions. The total number of individual measurement cycles for a standard addition run set will equal 1 + the number of additions. Also after all the data collection is complete, an analysis will be performed on all the data files to determine the unknown metal concentration present in the first (sample only) measurement cycle. The standard addition run mode consists of 2 or more individual measurement cycles linked together. The first individual measurement cycle in a standard addition run mode consists of the following steps: 1) cell fill with sample 2) reagent addition (no standard added) 3) plating & stripping interval 4) data collection , and 7) link to next measurement cycle. All
10
measurement cycles in between the first and last cycle of a standard addition run mode consist of the following steps: 2) reagent addition (metal standard only is added) 3) plating & stripping interval 4) data collection and 7) link to next measurement cycle. The last measurement cycle in a standard addition run mode consists of the following steps 2) reagent addition (standard only), 3) plating & stripping interval, 4) data collection, 5) cell empty and rinse, and 6) analysis of multiple measurement data collected.
In the Multiple run mode, the operator can select multiple runs (of the same mode: either single or standard addition) to be linked together either consecutively or using a timed interval. Since either the single or the standard addition run modes are being used, the steps within a run mode are the same as mentioned previously. The Multiple or Timed run modes serve to link the execution of 1 to 99 single or standard addition run modes. During the automated sample measurement and analysis, the operator must occasionally monitor the fluid levels to preclude any underflow (water sample and reagents) and overflow (waste by-products) problems.
In the Manual cell run mode, the operator is responsible for controlling the water sample and reagent inlet and outlet operations to the cell by using the various MANUAL OPs commands. The Manual cell mode consists of the following steps: 3) plating & stripping interval, and 4) data collection. The Manual cell mode provides the operator flexibility to perform measurement modes not covered in the single, standard addition or multiple modes. The Manual cell mode can be used with the cell present in the MA unit or can also be used with another cell (external to the MA unit). The manual mode collects the data, performs data smoothing, will perform a histogram area calculation if enabled, but does not perform any concentration determination analysis. The data collected, however, can be exported, to be analyzed separately from the MA unit via the file export option. Typical conditions for a MA PSA measurement cycle are: plating voltage of -1.2 to -1.1 volts for Pb and Cd and -1.4 volts for Zn, 25 to 50 ul of Matrix, HCl acid added to achieve a pH of 2.2 to 2.8 (typically 100 µl for tap water), use of a 60 second plating interval, HNO3 rinse acid added to achieve a pH of 2 or less (typically 150 µ l for tap water) and a 30 second minimum rinse time.
4.0 Metal Analyzer Software
4.1 Initial Display
The Metal Analyzer Software is initiated by double clicking the MA icon when in the Windows environment. Figure 4-1 shows the Initial Display presented to the user. Here the user can select to begin a new series of runs or open up a previous run to review the results or can append to an existing file additional runs.

11
Figure 4-1
The composition of the Initial Display will be addressed in terms of "bars" or horizontal groups of similar display/command functions. Starting at the top of the Initial Display is a title bar listing the software title and revision. Below the title bar is a menu bar displaying the menu options: File and Help. The area below the menu bar will be blank (in the next display this area is reserved for the histogram data display). The lowermost bar is a status display of selected system parameters taken from the MA.INI file.
The File menu options include: New (a new file is created using a format of PBxxyyzz.DAT, where xx is date, yy is month and zz is year), Open (lists all the files with .DAT extensions in the run directory, Exit (the MA software is exited with the most recent menu parameters stored in MA.INI file) and optionally up to 4 existing data files are listed for quick selection. Once a run selection has been made, the software will transition to the Main Display depicted in figure 4-2.
When the user selects a New or exisiting run file, the MA system runtime menu parameters are loaded with the last used values saved in the MA.INI file. The menu parameters are user specified values from MA menu options and their associated windows. To edit menu parameters, the user enters menu windows and enters the new parameter selections. To update the MA system with the latest parameters from the currently displayed window, the user should click on the OK

12
Figure 4-2
button. To ignore the information in the displayed window and use the current MA system parameters, the user should click on the Cancel button. The menu parameters present when a run is executed are saved along with the histogram data collected from the run. The "raw" histogram data is saved as well as a smoothed version (to expedite loading runs) to the run data file. The default data presentation uses the the smoothed histogram data. The smoothing algorithm used is currently a 32 point moving average of the raw histogram data. The raw histogram data can be viewed by using the ANALYSIS Display Raw Data menu option. To avoid potential invalid data runs, all system runtime menu parameters should be verified for correct values prior to initiating run modes.
The Help Menu options include: Contents, Search, About, and Resources. The contents option provides the user alphabetic list of all the Help topics available for the MA software. The Search option provides the user with a dialog box to assist in locating information about a topic. The user selects a keyword or phrase from a list, or a word typed in the Search For box. For more information on using Help funtions, refer to MS Windows user's guide. (Note: MA Help is not implemented for v2.61). The About NRAD Metal Analyzer contains a list of the developers and a point of contact for customer service. The Resources option displays current MA system in Windows resource loading.

13
4.2 Main Display
4.2.1 Display Composition
The composition of the Main Display will be addressed in terms of "bars" or horizontal groups of similar display/command functions. Starting at the top of the Main Display is a title bar with the software title, revision and current run file selected (will be "Unamed" if new and no data has been collected yet). Below the title bar is a menu bar displaying the menu options: File, Edit, Run, Analysis, Manual Ops, Window and Help. Below the menu bar is a wide bar featuring command "buttons" and histogram data information. The area below the wide bar is reserved for the histogram data display and will be blank if the user selected a new file and no data has been collected yet). The last bar (lowermost on the display screen) in the Main Display is a status bar used to view selected system parameter settings to assist the user in the operation of the MA unit. (The same status bar is also present in the Initial Menu display)
The wide bar features the following command buttons and status displays: 1) Zoom button- when activiated will rescale histogram display to area within current left and right cursor bar. A subsequent hit to the same button will return display to the "auto" scale (horizontal axis scaled to first and last data occurrence).
2) Std Curve button - when activated will check to see if the current data run displayed is a member of a standard addition run mode (or curve set), if so, then all the runs within that set will be analyzed and the resultant linefit data displayed (the determination of the unknown metal concentration).
3) Print button - when activiated will print entire MA display screen using windows print utility.
4) Prime Sample button- when activated will execute a command from Manual Ops - Prime Sample which results in a new water sample being siphoned into the MA inlet tubing followed by a cell rinse.
5) Abort button - when acitivated should result in the termination of any run mode in process. Usually the operator is queried by the software whether a cell empty /rinse should be performed after an abort has occurred.
6) Set Cursor button - when activated this button takes the selected metal peak left and right cursor values (in -X.XXX volts) and sets them to the current "global" left and right cursor bar values. Global cursor bars are grabbed by depressing the left mouse button near a red vertical bar , dragging the bar over to the desired position and releasing the mouse button. Global cursor bars default position is at the first (left cursor) and last (right cursor) histogram data point. Note: Set Cursor is used during a manual peak inflection point determination and in conjunction with the zoom command to rescale the horizontal display axis. If in the manual peak mode, the linear baseline area will be recomputed and displayed using the new inflection points. The Lxx.xxx and R yy.yyy status displays the respective left and right global cursor bar values in volts.

14
7)Decay states stripping time interval measured for current run displayed.
8) Select Run bar area features an incrementer (up arrow) and a decrementer (down arrow) run number select buttons, with an OK button to load the selected run. Also in conjunction with loading a saved data run file, the preserve cursor box can be optionally checked (to use the current peak detection or cursor guidelines) or not (use the peak detection guidelines that were present when the data file was originally collected ). The View Info button when activated displays the run data associated with the currently displayed data run. Run Setup, Reagents , Analysis and Notes are displayed and can be optionally printed. To enter comments into the Notes section, the operator must enter the comments via the ANALYSIS notepad submenu and later hit the update button bar on the Main Display to copy the notes into the run info stored for the currently displayed data run.
9) The Areas and Cursor Volts section is associated with the histogram peak determination and resultant data. The auto peak box selects whether the manual peak (user specifies the inflection points) or auto peak (user specifies a search range and a width factor) is used to determine the peak inflection (begining and end) points used to compute the resultant area or concentration of a particular metal. The active cursor can be set to either 1, 2 or 3 which corresponds to a particular metal (i.e. each with a unique auto peak search range or specified inflection points for manual peak determination). The peak factors for up to three metals are programmed under the ANALYSIS peak detection controls menu. The resultant area of either a manual peak detection or an auto peak detection is displayed for up to three peaks or metals along with left (peak inflection point start), right (peak inflection point end), and center (highest number of counts).
A histogram data display is depicted in Figure 1-1. The horizontal axis is auto-scaled to the first and last occurance of data and the units are volts. The global cursor bars (left and right red vertical bars) are positioned at the begining and end of the histogram data. Up to 3 metal peaks can be enabled, with each peak being displayed with a left, right (start and end peak inflection points) and center (highest histogram count value) cursor bar set. The last used active (peak) cursor (selected in aforementioned wide bar area) will be displayed with violet cursor bars. Any other peak cursor bar sets (up to 2 more) will be displayed with green cursor bars. The horizontal axis can be re-scaled by using the red global cursors to set the horizontal range and later hitting the zoom button (currently the vertical range does not re-scale for the zoom). The vertical axis is also auto-scaled to the histogram data and the units are histogram counts. For each peak enabled, the associated cursor bar set is used to determine stripping potential (center cursor) and area (relative metal concentration). Currently the area is determined by fitting a line between the two inflection points and summing the histogram counts above this line.
The status bar on the lowermost portion of the screen is composed of read-only information for the operator. The status bar displays: PC system date (this is used in data file name creation), time, Initial Potential and Plating Time (parameters from the EDIT Electrode Run Plating menu), Electrode Potential (measured value); Matrix,

15
Acid and Std. Addition (pameters from the EDIT Reagents menu); (Run) Mode (parameter from EDIT Select Run Mode menu).
4.2.2 MANUAL OPs Menu
The MANUAL Ops Menu is used in the daily setup, initial dry setup and during manual cell operations. The options available with the pull down MANUAL Ops menu are displayed in Figure 4-3.
The Holding Potential menu option is used to enable or disable the holding potential applied to the working electrode (used to maintain the mercury film). A check mark denotes enabled, no check mark denotes disabled. The option is toggled on/off by a mouse click. The holding potential value is specified in the EDIT Film Prep menu.
The Prime Sample menu option is used to siphon a new water sample into the Metal Analyzer system and is followed by a rinse with the new water sample. The Prime Sample menu option is also available in the main menu as a command button and is activated when clicked upon with the mouse. The number of pumps executed by the fill pump is determined by an entry in the EDIT Configuration menu under Prime Pumps. Both the fill port inlet and the manifold flush port to the cell are primed with the new water sample.
The Prime Matrix, Standard, Acid and Rinse Acid menu options are used to siphon new reagents into the Metal Analyzer system and each prime operation is followed by a rinse cycle. The number of pumps executed by each dedicated reagent miniature pump is determined by an entry in the EDIT Configuration menu under Prime Pumps. The Prime Standard adds a manifold flush pump after the standard has been primed (but before the rinse cycle) to remove any standard remaining inside the mainifold.

16
Figure 4-3
The Cell Fill and Empty menu options allow the operator to fill the cell with a water sample and to empty the contents of the cell to a waste reservoir as required for any manual cell operations. The Cell Fill triggers N fill pump cycles where N is determined by the cell volume (plus an optional overfill volume) divided by the fill pump volume specified in the EDIT Configuration menu. The number of drain pump cycles for a Cell Empty is detemined by the cell volume divided by the drain pump volume and the result is multiplied by a safety factor imbedded in the software.
The Cell Rinse menu option allows the operator to perform additional cell rinses as required in between automated run modes (to reduce metal cross-contamination

17
between different water samples) or during manual operations. The Cell Rinse begins with a cell empty, followed by a cell fill with rinse acid added optionally (highly recommended) and completed with a cell empty. Both the amount of rinse acid to add during a rinse cycle as well the the duration of a rinse cycle are specified in the EDIT Reagents Rinse Solution.
The Stir and Stirring RPM menu options affect control of the internal stirrer bar in the cell. The Stir option is used for manual operations only and is an on/off toggle control activated by clicking on the stir option (automated run modes control stirrer bar as appropriate). The Stirring RPM option allows the operator to select the stirring speed. The default setting is 125.
The Diagnostics menu option performs a limited internal self test of the MA custom electronics circuit card assemblies. The self test is initiated by clicking on the Diagnostics option. A pass or fail test message will be displayed after the tests are completed.
The Manual Pump menu option when selected displays a Manual Pump Control Window as depicted in Figure 4-4. This window provides the
Figure 4-4
user with a manual override control for all the pumps and valves in the Metal Analyzer system. The user can trigger a specified number of pumps to occur by entering the desired number next to the pump of choice and clicking on the adjacent button to initiate the pump action. All four reagents (Matrix, Standard, Acid , Rinse

18
Acid), cell fill (Sample) and drain feature a numeric data entry box as well as a command button to initiate dispensation. In addition, the Sample pump control features a Flush On box that is used to specify control of the valve associated with performing mainifold flushes. A checked box denotes an enabled mainfold flush (water sample is routed to the cell via the mainifold) and a blank box denotes the default inlet path to the cell for the water sample.
The Charge All Lines menu option, when selected, initiates a series of pump actions resulting in all lines to the cell being topped off by 3 pumps followed by a cell rinse. This option is used in the Daily Setup of the MA system.
4.2.3 Edit Menu
The Edit Menu contains system setup information that is used during both automated and manual run modes. The information from the various EDIT windows is saved as runtime parameters in the MA.INI file. Depending on what types of tests the operator wishes to conduct, no changes may be required to the runtime parameters, however, the operator should verify that the proper parameters are loaded prior to conducting measurements. Figure 4-5 depicts the pull down EDIT menu options available to the user.
The Electrode Film Preparation menu option, when selected, will display a window as shown in Figure 4-6. Here the user can specify the Initial Potential (-2.5 to 0 volts), the Plating Time (999 to 0 seconds) and the Holding Potential (-2.5 to 0 volts). Typical values for film preparation paramenters are displayed in the adjacent numeric entry fields in Figure 4-6. For more information on Film Preparation and typical parameter values, refer to section 3.2.
The Electrode Run Plating menu option, when selected, will display a window as depicted in Figure 4-7. Here the user can specify the Initial Potential (-2.5 to 0 volts) and the Plating Time (999 to 0 seconds). Run Plating parameters are used in the trace metal (plating and stripping) portion for all the MA measurement modes. For more information on MA measurement modes and typical parameter values, refer to section 3.3
The Reagents menu option, when selected, will display a window as shown in Figure 4-8. In this window, the user can specify the reagent volumes dispensed and the concentration of up to 3 metals in the standard reagent. In the Standard Solutions

19
Figure 4-5
section of the window, the user can enter a metal name in each of the three data entry boxes under the Name header. Up to 8 characters can be associated with a metal name (typically two per periodic table symbol are used). The metal name specified will be used in MA data and cursor displays as the Metal Peak

20
Figure 4-6
Figure 4-7
Name. The concentration of the named metal is specified in the adjacent data entry box under the Concen-tration (ppb) header. The user can enter a concentration value from 0 to 99,999,999 ppb for each metal. In the Standard Additions section of the window, the user can click on the up arrow (increment) or the down arrow (decrement) to adjust the value of the standard addition given in ppb units. For each metal named (with a concentration greater than 0 ppb), the MA software will calcualate the smallest unit of addition based on the volume dispensed from the standard pump (parameter from the EDIT configuration pump volumes) and the metal concentration (specified in the Edit Reagents Standard Solutions). The increment and decrement function associated with the Standard Additions section will change the

21
concentration in multiples of the smallest unit of addition. In the Plating Solution section of the Reagents window, the user can specify the volume dispensed of the Matrix and Acid Reagents for a plating/stripping cycle. In the Rinse Solution section of the Reagents window, the user can specify the volume dispensed of the Rinse Acid Reagent during a rinse cycle and the duration of the rinse cycle. Currently both the Film Prep mode (applies initial mercury film) and all the measurement modes (perform trace metal plating and stripping) both use the plating and rinse solution parameters specified in the EDIT Reagents menu. For both the Matrix and Acid Added volumes, the user can increment and decrement the volumes dispensed by clicking on the up arrow and down arrow respectively. (All the volumes displayed are in multiples , up to 99 times, of the associated reagent pump volume specified in the EDIT configuration menu.). The Rinse time can be adjusted by clicking on the up arrow(to increment) or the down arrow (to decrement) to adjust the rinse time (0 to 60 seconds). A nine character
Figure 4-8
Matrix Reagent Name can be entered in the data entry box following Matrix Name. The Matrix Name is stored with the other menu parameters in the run data file. The Mode Controls Menu, when selected, will display a Window as depicted in Figure 4-

22
9. This window allows the user to specify the measurement or run mode as one of three options: Sample Only, Standard Addition or Standard Only. The run mode option is selected by clicking on the white circle next to the desired mode. The selected mode will have a white circle with a center black dot next to it. The run mode selected will also be displayed in the lower status bar of the main display and will be used as the default mode setting for the Run menu options. For more information on run modes, refer to section 3.3.
Figure 4-9
The Standard Addition Setup Menu, when selected, displays a window as shown in figure 4-10. The Standard Addition Setup Window allows the user to specify the number of points (number of standard addition cycles plus 1) in a standard addition run set (also referred to as a standard curve set) and the number of replicates per point. Both the number of points and replicates are adjusted by using the up and down arrows to increment and decrement by 1, respectively. The number of points in a standard addition setup can range from 2 to 8 points and the number of replicates can range from 1 to 4 replicates. The replicate number is a form of a measurement duplication factor. For example if a 3 point standard curve is selected using 3 replicates, each point or measure-ment cycle in the standard curve will be replicated 3 times (i.e., 3 consecutive measurements of same solution in cell) and a total of 9 data runs will be collected. For the standard curve line fit processing, all replicates (up to 4) for a given standard addition point are averaged first and later passed on to the linefit processing. The Actual Std. Add. Conc in ppb is a read only display indicating for each point in the standard curve the amount of metal in ppb added for up to three metals. The first point is always zero ppb added and each point thereafter is incremented by the value specified in the Edit Reagents Standard Additions. The Actual Std. Add. header refers to the adjustment applied to the concentration values added due to the cell solution displacement out thru the overflow adapter during additions.

23
Figure 4-10
The Configuration menu option when clicked will display a window as depicted in Figure 4-11. The configuration menu is used to store data obtained from the system volumes and bias calibrations. For more information on calibration operations, refer to sections 2.3 and 2.4. The pump volumes section contains measured volumes in µl (microliters) for all the pumps in the MA system. Typically only the standard, sample and drain pumps are measured. All the other reagent pumps can either use the manufacturer listed pump volume or can be optionally measured as well. The measured volume in µl is entered in the data entry box adjacent to the associated pump name. The Prime pumps section lists the number of pumps required to fill all the tubing from the reagent or sample bottle (which ever is applicable) to the associated input port to the cell with a small amount of overflow. The System Volumes section contains the measured cell volume as well as an overfill and rinse overfill. Currently the cell fill of a measurement cycle only fills to the top of the cell (using the measured cell volume and an overfill of 0 µl) to minimize any contamination that might be present in the overflow adapter for the first point in a standard curve set. Subsequent additions will displace some of the cell solution into the overflow adapter, but at higher metal concentrations the adapter does not pose a contamination problem. Also the Rinse Overfill only applies to the rinse cycles, whereas the Overfill applies to all fill cycles including the one in a rinse cycle. The Rinse Overfill provides a means for rinsing the overflow adapter as well as the cell during a rinse cycle. The Bias Factors Section contains the Bias Constant and Multiplier for up to 3 Metals. The Metal Names are the same as the ones entered in the EDIT Reagents menu. Currently this window only supports one constant and

24
multiplier per metal, but this may be later revised to support a table look up format to cover additional detection ranges.
Figure 4-11
4.2.4 Run Menu
The Run Menu is used to initiate MA run or measurement modes. Prior to initiating a measurement mode, the user should verify correct parameter values are present in the Edit menus to assure valid data collection. For valid first time post run analysis results, the Analysis Peak Detection menu should be setup. The options available with the Run menu are displayed in Figure 4-12.

25
Figure 4-12
The Run option is used to initiate either a single run mode (sample only or standard only) or a single standard addition run set. When clicking on the Run option, the user is presented with the Select Run Mode window as depicted in Figure 4-13. This is the same window as the one associated with EDIT Mode Controls. The mode presented will be the previously used mode. If no mode change is required, then the user should click on the OK button. If another run mode is desired, the user must first click on the circle next to the desired mode ( the circle with the black dot dentoes the mode selected) prior to using the OK button. If a standard addition run mode is executing, a window containing a run summary will be posted to the user as in Figure 4-14. If the setup is not correct, the user may abort the run before any data collection is started. Once a measurement cycle is being performed, a window reporting the percent completion for the plating interval will be displayed as in Figure 4-15. After the data is collected and smoothed, the smoothed histogram data will be displayed.

26
The Multiple [Run] option when clicked will first display a Select Run Mode window as depicted in Figure 4-13 to allow the user the option of
Figure 4-13
Figure 4-14
Figure 4-15

27
Figure 4-16
revising the run mode. After making a run mode selection, a Multiple Runs window will be shown as in Figure 4-16. Here the user specifies the number (or multiple) of runs to be executed. The run mode will be as specified in the previous window. Once the number of runs is entered and the user clicks on the OK button, the multiple run mode will be started. All the run operations and status displays within a multiple run mode are similar to the [single] run mode execept for the consecutive scheduling of same [single] run modes. The only indication the user has that the MA system is in a multiple run mode is a message on the Main Display in the lower status bar stating: Multiple Runs in Progress: Run 1 of N (where N is the number of runs specified by the user).

28
Figure 4-17
The Timed [Run] option, when selected, will first display a Select Run Mode window as depicted in Figure 4-13 to allow the user the option of revising the run mode.After making a run mode selection, a Timed Start/Stop window will be displayed as in Figure 4-17. Here the user must enter a Start Date and Time (default value is current PC system date and time) , an Interval (time period between start of runs), and a Stop Date and Time. After the user enters the desired parameters into the relevant data entry boxes and clicks on the OK button, the Timed run mode is started. All the run operations and status displays within a timed run mode are similar to the [single] run mode execept for the timed scheduling of same [single] run modes. The only indication the user has that the MA system is in a timed run mode is a message on the Main Display in the lower status bar stating: Timed Run In Progress. Also an interval countdown will be displayed to indicate time remaining before next [single] run mode is executed.
The Film Preparation menu option when clicked will first display a window as depicted in Figure 4-18. Here the user must respond whether an auto-cell (i.e., MA electrochemical cell) or a manual cell will be used during the Film Preparation. If the user clicks on the yes button for auto-cell mode, the software will perform a cell preparation cycle ( which consists of filling the cell and adding reagents) , followed by a film preparation cycle with a percent time to complete status display as shown in Figure 4-19. If the user selects the No button for the window in Figure 4-18, the manual cell mode will be enabled. For manual cell mode, the user is responsible for

29
the manual cell solution preparation since the software will only execute the film perparation cycle.
Figure 4-18
Figure 4-19
The Run Manual Cell option, when selected, will initiate execution of a [single] run mode consisting of a plating cycle, stripping cycle and a data measurement and recording cycle. For the Run Manual Cell option, the user is responsible for the cell solution preparation. This option can be run with the MA electroche-mical cell using the Manual Ops Menu Manual Pump option to inject the desired reagents and solution into the MA cell or an external electrochemical cell can be used.
4.2.5 Analysis Menu
The Analysis Menu contains post run analysis and histogram display options. Figure 4-20 shows the pull down menu options available to the user. During a standard addition run set, a post run analysis of the data is automatically scheduled as part of the run. The analysis consists of a inflection point determination (for auto peak mode), the metal peak area determination using peak inflection points (for both auto and manual peak modes) and the least

30
Figure 4-20
squares linefit using the metal areas obtained from all the standard addition runs to determine the initial metal concentration in the water sample. If more than 1 replicate is specified, all the replicates for the same standard addition point will be first averaged and later passed to the linefit algorithm. The analysis results will be stored in the run data file and can be viewed by clicking on the View Info button or the Std Curve button both located on the Main Display in the command/status wide bar area. The results can also obtained by using the Analysis Menu View Standard Curve option. Once the data is collected and analyzed, the user can re-analyze the run data saved with different parameter settings from the Analysis Peak Detection or Edit Configuration menus as many times as desired. To save the latest analysis results (other than the first post run analysis results), the user must click on the update button to save the results to the run data file.

31
The Notebook option when clicked will display a Run Notes window as shown in Figure 4-21. The Run Notes provides the user with a text editor and the mechanism of adding user notation to a run file. The user must first compose the notes and click on the OK button to save the text. To add the notes to the current run file, the user must click the update button to copy the text into the notes section of the run file.
Figure 4-21
The Peak Detection option, when selected, will display one of two windows depending on whether the automatic or manual peak edge detection is enabled. The user can change the peak detection mode either from the Main Display by an on/off toggle enable (user clicks adjacent box, "x" denotes enabled) of the Auto Peak function located in command/status wide bar or within the Peak Dectection window itself which is also an on/off toggle enable of the Automatic Peak Edge Detection Function. If the auto peak function is enabled, the user will be shown a window as in Figure 4-22. If the auto peak function is disabled (i.e. using manual or user specified peak inflection points), the user will be shown a window as in Figure 4-23. Common to both window versions, is the Select Peak on/off toggle enable (user clicks adjacent box, "x" denotes enabled) used to activate the peak search (auto mode) and the peak

32
Figure 4-22
area calculation (both modes). The Peak labels are copied from the Edit Reagents Menu Standard Solutions Name. Both auto and manual peak modes use the signal minus the linear baseline area method (using linefit between the peak's two inflection points, peak area is the sum of the the histogram counts above the line).
For auto peak detection, the user specifies a search range in mv for up to 3 metals. For the active metal peaks (select box is enabled with "x"), the software will search for peaks within the lower and upper voltage limits specified. The user can enter any upper and lower peak limit from -2.5 to 0 volts. Typically the peak limits are set around the stripping potential of the metal. The upper limit is before the rising peak inflection point and the lower limit is after the falling peak inflection point. The width factor is typically set from 2 to 4 to set a search limit for the peak inflection points. The width factor is based on applying a multiplier to the peak center width and using the result as the maximun search window for the peak's inflection points. The search window gets adjusted by a skew factor that moves the window fore and aft from the peak. The skew factor is useful for setting the correct peak inflection points for peaks with different rising and falling slopes. The main area of

33
improvement lies in not picking up extraneous peaks due to a generic (evenly distributed around the peak) search window .
When in the manual peak mode, the user specifes the peak inflection points (instead of search range as in auto). The peak inflection points can be specified by two methods. One involves using the Peak Detection Controls window and entering the Lower and Upper Voltage Limits in the Manual Cursor Position Section. TheVoltage Limits are the manually specified peak inflection points and will be used to determine the peak histogram area. The other method can be employed while in the Main Display, by using the Set Cursor button. The user first must grab and position the left and right global cursor bars in the histogram data display to pinpoint the desired left and right peak inflection points. Upon verifying the metal peak of interest is selected under the Active Cursor Header (adjacent circle is dotted or enabled), the user can click on the Set Cursor button to copy the current position of the global cursor bars onto the lower and upper voltage limit parameters used in manual peak mode area computations. Currently the Peak Detection Controls window for manual mode displays the width and skew factor parameters which are not applicable for the manual peak mode and should be ignored.
When reprocessing old data runs collected with different peak detection settings, the user should first setup the peak detection controls for the new analysis parameters, then click on the Preserve Cursors box ("x" is active) prior to loading any old data files. The Preserve Cursor option will keep the current cursor or peak detection (both auto and manual) parameter settings instead of replacing them with the ones stored in the old data run file.

34
Figure 4-23
The Analysis Menu features three overlay data display options. All overlay data display options are enabled by clicking on the option (a check mark denotes enabled) and removed by again clicking on the option (to remove the check mark). The Display 2nd Derivative Display option when enabled will overlay the 2nd derivative data plot onto the histogram data display as depicted in Figure 4-24. The metal center peak used to be determined by

35
Figure 4-24
using the 2nd derivative data but currently is determined by the highest smoothed histogram counts in the specified search region. The Display Raw Data option, when enabled, will overlay the raw or unsmoothed histogram data onto the default or smoothed histogram data display as shown in Figure 4-25. The Display All Data option, when enabled, (only if the current run is a member of a standard addition curve set) will overlay all the smoothed histogram data for every point or member of a standard addition curve set. Figure 4-26 depicts a display with the Display All Data option. To graphically view the results of a standard addition curve set, two methods may be used. One method involves clicking the standard curve button located in the Main Display or the other method entails clicking the Analysis Menu View Standard Curve Option. The results are also stored in the run data file and can be viewed in a text display by using the View Info button. After selecting the View Standard Curve Option

36
Figure 4-25

37
Figure 4-26
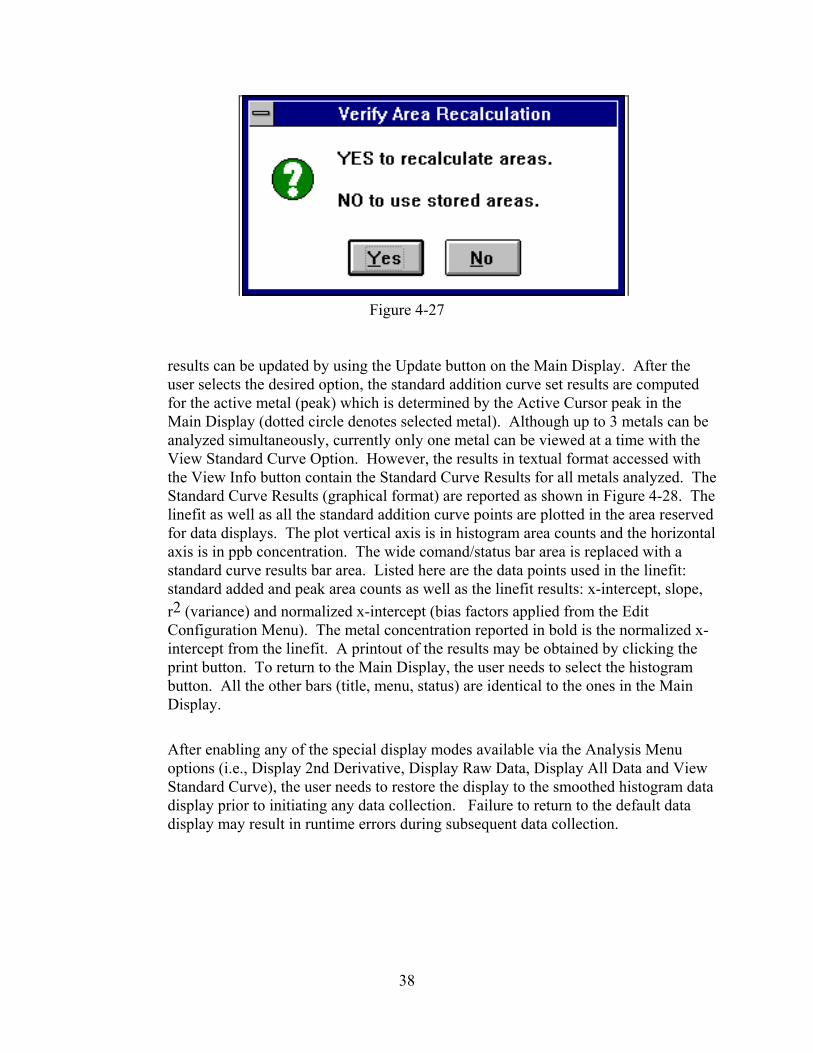
(by either one of the two methods), the user is presented with a Verify Area Recalculation window as depicted in Figure 4-27. Here the user must select either to use the last saved peak areas from the current run file or to recalculate the peak areas based on the current peak detection parameters settings. This option is useful for re-analysis efforts. The user can try many different peak detection paramenter settings, compute the results without deleting the original or last saved analysis results. The saved analysis
38
Figure 4-27
results can be updated by using the Update button on the Main Display. After the user selects the desired option, the standard addition curve set results are computed for the active metal (peak) which is determined by the Active Cursor peak in the Main Display (dotted circle denotes selected metal). Although up to 3 metals can be analyzed simultaneously, currently only one metal can be viewed at a time with the View Standard Curve Option. However, the results in textual format accessed with the View Info button contain the Standard Curve Results for all metals analyzed. The Standard Curve Results (graphical format) are reported as shown in Figure 4-28. The linefit as well as all the standard addition curve points are plotted in the area reserved for data displays. The plot vertical axis is in histogram area counts and the horizontal axis is in ppb concentration. The wide comand/status bar area is replaced with a standard curve results bar area. Listed here are the data points used in the linefit: standard added and peak area counts as well as the linefit results: x-intercept, slope, r2 (variance) and normalized x-intercept (bias factors applied from the Edit Configuration Menu). The metal concentration reported in bold is the normalized x-intercept from the linefit. A printout of the results may be obtained by clicking the print button. To return to the Main Display, the user needs to select the histogram button. All the other bars (title, menu, status) are identical to the ones in the Main Display.
After enabling any of the special display modes available via the Analysis Menu options (i.e., Display 2nd Derivative, Display Raw Data, Display All Data and View Standard Curve), the user needs to restore the display to the smoothed histogram data display prior to initiating any data collection. Failure to return to the default data display may result in runtime errors during subsequent data collection.

39
Figure 4-28
4.2.6 File Menu
The File Menu provides access, browsing, and export functions for the MA data files. The options available with the pull down File menu are displayed in Figure 4-29.

40
Figure 4-29
The New menu option, when selected, will initially set the run file to "unnamed". After a run is initiated, a save as window will be presented to the user, displaying the new run file name using the default naming convention. The operator can elect to user the default name or to specify another new name. To commence run execution, the user needs to select the OK button.
The Open menu option, when selected, provides the user with a list of files

41
Figure 4-30
available to the user with a default file suffix of .PBA and using a default directory specified in the Windows MA Program Item Properties Working Directory. The Open option is useful for appending runs to existing data runs and/or to perform additional data post-processing on previously collected data.
The Save As Option is not implemented in v2.61of the MA software.
The Close Option, when selected, closes the current data run file and restores the Main Display to initial default conditions.
The Directory Option, when selected, provides the user information on the individual runs contained with the currently selected run data file. Figure 4-30 is a typical display presented to the user with the Directory Option.
The Export Option, when enabled, prompts the user for a run number as in Figure 4-31 (must be a member of the current .PBA file) and later for a file name as in Figure 4-32 to be used for the comma separated value (CSV) format resultant output file. Currently the raw (unsmoothed) histogram data is provided for export.

42
Figure 4-31
Figure 4-32
The Print Option, when selected, will print the current MA window displayed, either the Main Data Display or the Standard Curve Results Display. The printer used for this option must be selected via the Windows Control Panel Printer settings.

43
The Exit Option, when selected, will close the current run data file and exit the MA application software. The current settings for most of the menu parameters will be saved in a MA.INI file to be used again the next time the MA software is enabled.
Below the Exit Option, up to 4 previously accessed run data files will be listed for the user's convenience.


![O~Cit - · PDF filebu'W'Uflfl"''''1J'''t''''W ~I .... • (~) d]'W~LflV!Ji'eJ~-r'U. L 'Vl't;~'1flflLI9lVrhVi'Vnm;I{i~~G1. 1911 ~~lfln . L ~~ltmtv11" '\ "](https://img.dokumen.tips/doc/110x75/5ab5a6ce7f8b9a6e1c8d1106/ocit-wuflfl1jtw-i-dwlflvjiej-ru-l-vlt1flflli9lvrhvivnmiig1.jpg)