Embed Size (px)
Citation preview
NASA Technical Memorandum 110294
//_/-S /
op.Uo3/
User's Guide for Flight Simulation DataVisualization Workstation
Joseph A. Kaplan and Ronnie ChenLangley Research Center
Hampton, Virginia
Patrick S. Kenney, Christopher M. Koval, and Brian K. HutchinsonUNISYS CorporationHampton, Virginia
November 1996
National Aeronautics and
Space AdministrationLangley Research CenterHampton, Virginia 23681-0001
https://ntrs.nasa.gov/search.jsp?R=19970005353 2020-06-16T02:54:20+00:00Zbrought to you by COREView metadata, citation and similar papers at core.ac.uk
provided by NASA Technical Reports Server


Abstract
Today's modem flight simulation research produces vast amounts of time sensitive data. Themeaning of this data can be difficult to assess while in its raw format. Therefore, a method ofbreaking the data down and presenting it to the user in a graphical format is necessary. SimulationGraphics (SimGraph) is intended as a data visualization software package that will incorporatesimulation data into a variety of animated graphical displays for easy interpretation by thesimulation researcher. This document is intended as an end user's guide.
Page i
Table of Contents
1.0 - Introduction ..................................................................................... 12.0 - User Interface ................................................................................... 2
Connection Established ........................................................................... 2
Replay ............................................................................................... 6Graphic Objects .................................................................................... 9
Strip Chart ....................................................................................... 9Mode Indicator ................................................................................ 10GL 3D View ................................................................................... 11
X Window System 3D View ................................................................ 12Heads-Up Display ............................................................................ 13Out of the Cockpit View ..................................................................... 14
3.0 - Conclusions ................................................................................... 15References ........................................................................................... 16
Table of Figures
Figure 1Figure 2Figure 3Figure 4Figure 5Figure 6Figure 7Figure 8Figure 9FigureFigureFigureFigureFigureFigureFigureFigureFigureFigure
- Communication Selection Window .................................................... 2
- Main Option Window .................................................................... 3- Save Data Window ....................................................................... 3
- Open Graphic Objects Window ......................................................... 3- HUD Selection Window ................................................................. 4
- Strip Chart Selection Window .......................................................... 4- Close Graphic Objects Window ........................................................ 5- User Configuration Window ............................................................ 5- Replay File Selection Window .......................................................... 6
10 - Replay Control Window ............................................................... 711 - Open Graphic Object Box .............................................................. 712 - Close Graphic Object Box ............................................................. 813 - Strip Chart Graphic Object ............................................................. 914 - Mode Indicator Graphic Object ...................................................... 1015 - SGI GL 3D View Graphic Object ................................................... 1116 - X Window System 3D View Graphic Object ...................................... 1217 - Control Strip for X Window System 3D View .................................... 1218 - Heads-Up Display Graphic Object .................................................. 1319 - Out of the Cockpit View Graphic Object ........................................... 14
Page ii

1.0 - Introduction
Simulation Graphics (SimGraph) is intended as a data visualization tool for researchers who usethe Flight Simulation Facilities of NASA Langley Research Center. The SimGraph program isdesigned to allow the researchers to view their data from the flight simulation environment usingseveral different types of displays, including Heads-Up Displays (HUDs), 3D views, out of thecockpit views, strip charts, and mode indicators. SimGraph is written in object-oriented C++ toallow for additional graphical displays to be added. SimGraph executes using a variety ofcommunication options, including Internet Domain Sockets, UNIX Domain Sockets, and theAdvanced Real-Time Simulation System (ARTSS) 1. SimGraph is designed to be platform
independent. It is configured to allow researchers to use it for simulations running in either real-time or batch mode on their choice of workstations.
Page 1

2.0 - User Interface
The Graphical User Interface for SimGraph is easy to use. The first window that is presented tothe user is the Communication Selection Window (Figure 1). This window allows the user to
select the method of communication between SimGraph and the simulation program. When theuser selects a method, the window disappears.
Figure 1 - Communication Selection Window
Connection Established
If the user selects Internet Domain Socket, ARTSS DR11W, or UNIX Domain Socket from the
Communication Selection Window, the Main Option Window in Figure 2 will be shown. Thiswindow allows the user to save data, open Graphic Objects, close Graphic Objects, load (or save)User Configurations, and quit the program. This window stays on the screen for the duration ofthe SimGraph program.
The Save Data Button allows the user to access the Save Data Window (Figure 3). This windowenabling the user to begin saving data to a file. The user is prompted for a filename and all datareceived after this point is saved to the specified file. It is recommended that the user append thesuffix, ".data", to the filename. If the user is already saving data, then the user may cancel thesaving of data by selecting the button labeled "Don't Save Data."
The Open Graphic Objects Button, if selected, presents the user with the Open Graphic ObjectsWindow (Figure 4). The Open Graphic Objects Window is the only method for the user to selectGraphic Objects to be presented to them. This window will change depending upon what GraphicObjects are available to the user.
Page 2

iFigure 2 - Main Option Window
Figure 3 - Save Data Window
GRAPHIC OBJECT
Figure 4 - Open Graphic Objects Window
Page 3

Depending upon which Graphic Object is selected from the Open Graphic Objects Window,different actions occur. If a Graphic Object is selected that depends upon the number of vehicles inthe simulation, a window similar to the HUD Selection Window (Figure 5) is presented to theuser. In the case of Figure 5, the simulation has two vehicles in it. If there were four vehicles inthe simulation, the HUD Selection Window would present the user with four Buttons, HUDs forvehicles one through four. If the Graphic Object does not show an individual vehicle status butinstead presents information about the entire simulation, such as the Mode Display, then pressingthe button on the Open Graphic Objects Window would cause that Graphic Object to be created.The only Graphic Object at the present time that does not follow these two examples is the StripChart Graphic Object. The names and number of the Strip Charts are sent over from the simulationprogram. Selecting the Strip Chart Button causes SimGraph to present the user with the StripChart Selection Window (Figure 6). The window that the user selects from (i.e., the HUDSelection Window or the Open Graphic Objects Window) disappears after a button is pressed.
Figure 5 - HUD Selection Window
Figure 6 - Strip Chart Selection Window
Page 4

TheCloseGraphicObjectsButtonon theMain OptionWindow(Figure2) allowstheusertoaccesstheCloseGraphicObjectsWindow(Figure7). Thewindowpresentstheuserwith a list oftheGraphicObjectsthatarecurrentlyopen.Theusercanselectoneof theGraphicObjectsandthenselecttheCloseObjectButton. TheGraphicObjectwill beremovedfrom thescreen.WhentheuserhasfinishedclosingGraphicObjects,selectingtheDoneButtonwill closetheCloseGraphicObjectsWindow.
Figure7 - CloseGraphicObjectsWindow
Selectionof theUserConfigurationoptionfromtheMainOptionWindow(Figure2) causestheUserConfigurationWindow(Figure8) to bepresentedto theuser.This windowallowstheuserto saveandloadconfigurationfiles. Theseconfigurationfilesconsistof theGraphicObjectsthatareopenandtheirpositiononthescreen.Whenaconfigurationfile isopened,all of thecurrentlyopenedGraphicObjectsareclosed.TheGraphicObjectsin theconfigurationfile arethenopenedandpositionedon thescreen.
By convention,thesuffix of ".config" is addedto nameof theconfiguration.Thereis thepossibilitythataconfigurationfile will refuseto beopenedif thecurrentnumberof vehiclesorstripchartsdoesnotequalthenumberin theconfigurationfile. This is donetopreventSimGraphfromrequestingdatafrom vehiclesthatdonotexist.
Figure8 - UserConfigurationWindow
Page5
Replay
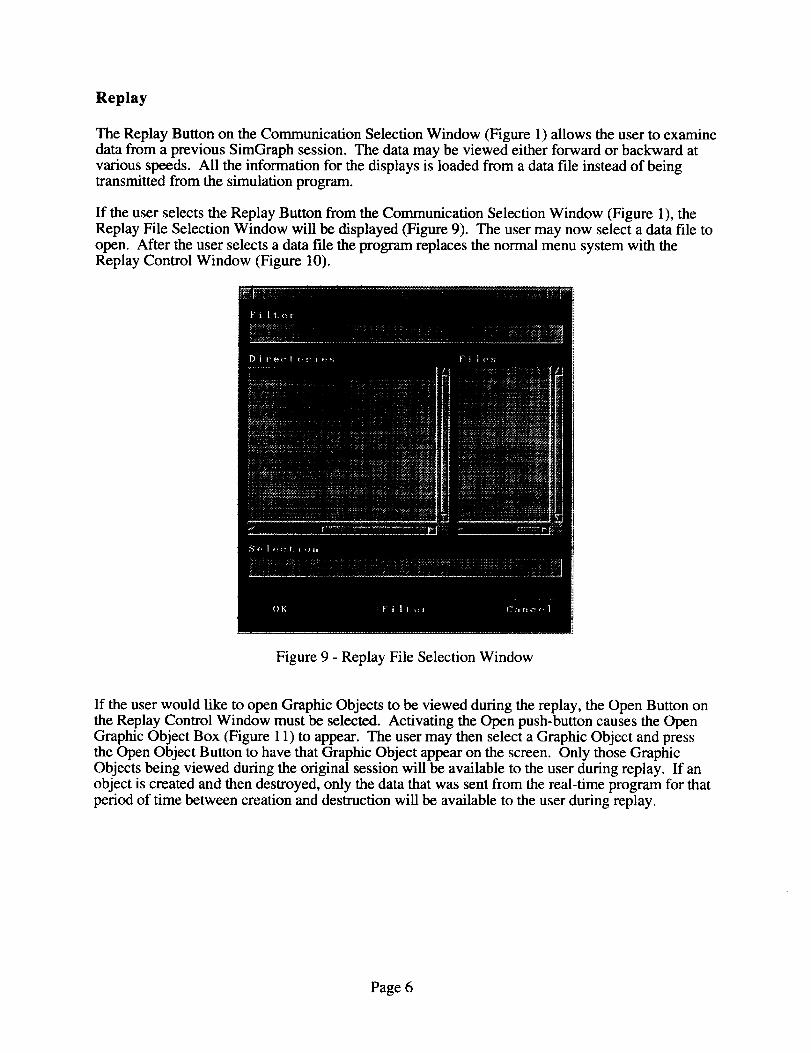
The Replay Button on the Communication Selection Window (Figure 1) allows the user to examinedata from a previous SimGraph session. The data may be viewed either forward or backward atvarious speeds. All the information for the displays is loaded from a data file instead of beingtransmitted from the simulation program.
If the user selects the Replay Button from the Communication Selection Window (Figure 1), theReplay File Selection Window will be displayed (Figure 9). The user may now select a data file toopen. After the user selects a data file the program replaces the normal menu system with theReplay Control Window (Figure 10).
Figure 9 - Replay File Selection Window
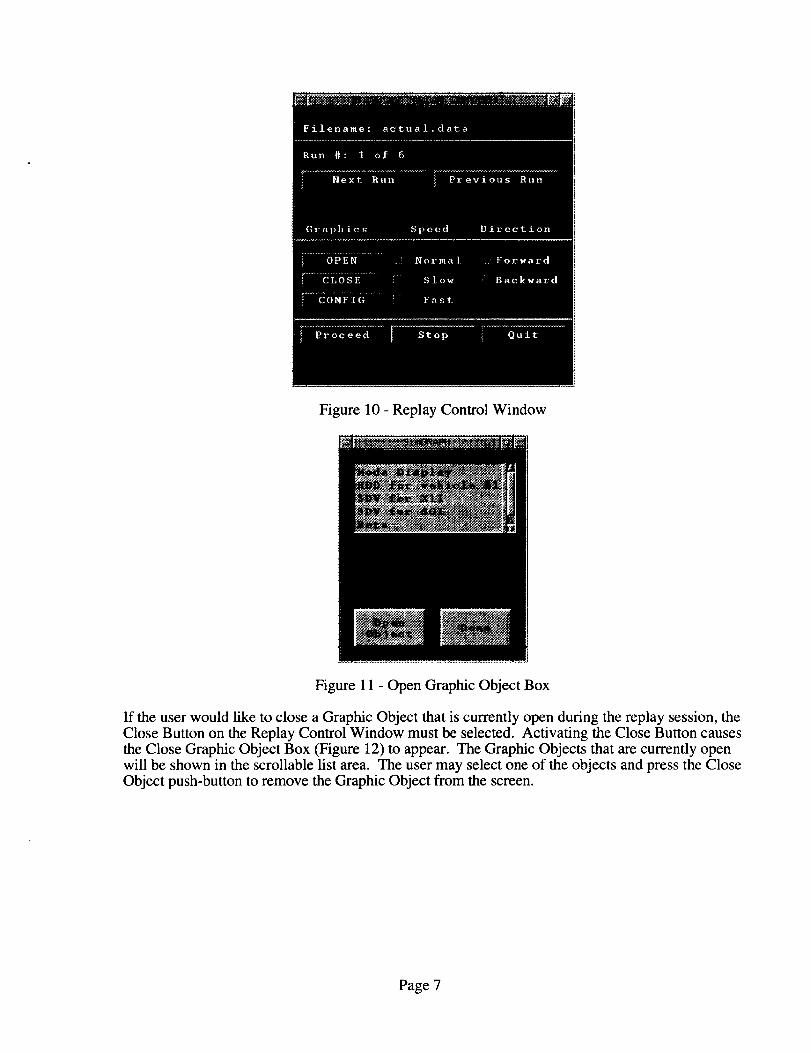
If the user would like to open Graphic Objects to be viewed during the replay, the Open Button onthe Replay Control Window must be selected. Activating the Open push-button causes the OpenGraphic Object Box (Figure 11) to appear. The user may then select a Graphic Object and pressthe Open Object Button to have that Graphic Object appear on the screen. Only those GraphicObjects being viewed during the original session will be available to the user during replay. If anobject is created and then destroyed, only the data that was sent from the real-time program for thatperiod of time between creation and destruction will be available to the user during replay.
Page 6
Filename: actual.data
Run #: 1 of 6
Next Run Previous Run
Graphics Speed Direction
OPEN ....i Normal ....Forward
CLOSE Slow ii Backward
CONFIG Fast
Proceed Stop Quit
Figure 10 - Replay Control Window
Figure 11 - Open Graphic Object Box
If the user would like to close a Graphic Object that is currently open during the replay session, the
Close Button on the Replay Control Window must be selected. Activating the Close Button causesthe Close Graphic Object Box (Figure 12) to appear. The Graphic Objects that are currently openwill be shown in the scrollable list area. The user may select one of the objects and press the Close
Object push-button to remove the Graphic Object from the screen.
Page 7
Figure12- CloseGraphicObjectBox
If theConfigButton(Figure10)is selected,theUserConfigurationWindow (Figure8) will bedisplayed.Theremainingbuttonson theReplayControlWindowdictatehowthedatais to bereplayed.If Slowis selected,thedatawill updateapproximatelytwiceasecond.If Normalisselected,thedatawill updateapproximatelytentimesasecond.If Fastis selected,thedatawillupdateapproximatelytwentytimesasecond.Thenextpanelof buttonsis usedto indicatereplaydirection.ForwardandBackwardallow theuserto movethroughthedatain theselecteddirections.Thebottompanelof buttonsallowtheuserto beginplayingdata(Proceed),halt theplayingof data(Stop),andexit SimGraph(Quit). Thecurrentlyselectedoptionwill behighlightedin red.
Page8
Graphic Objects
Strip Chart
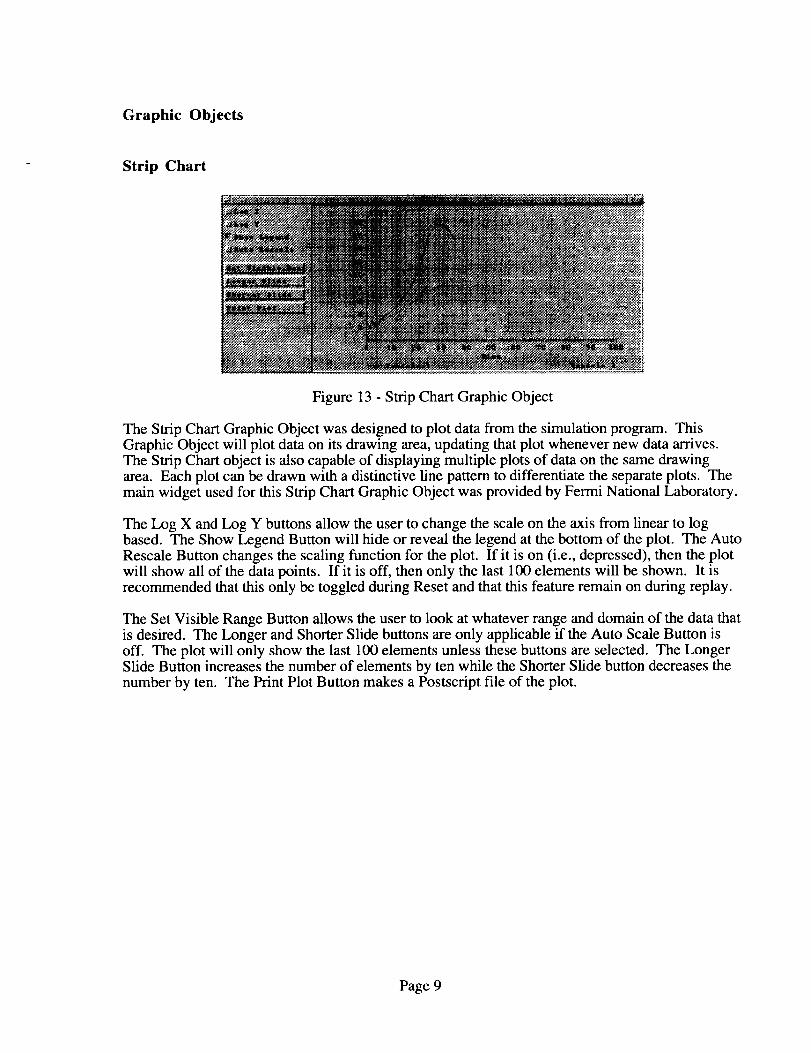
Figure 13 - Strip Chart Graphic Object
The Strip Chart Graphic Object was designed to plot data from the simulation program. ThisGraphic Object will plot data on its drawing area, updating that plot whenever new data arrives.The Strip Chart object is also capable of displaying multiple plots of data on the same drawingarea. Each plot can be drawn with a distinctive line pattern to differentiate the separate plots. Themain widget used for this Strip Chart Graphic Object was provided by Fermi National Laboratory.
The Log X and Log Y buttons allow the user to change the scale on the axis from linear to logbased. The Show Legend Button will hide or reveal the legend at the bottom of the plot. The AutoRescale Button changes the scaling function for the plot. If it is on (i.e., depressed), then the plotwill show all of the data points. If it is off, then only the last 100 elements will be shown. It isrecommended that this only be toggled during Reset and that this feature remain on during replay.
The Set Visible Range Button allows the user to look at whatever range and domain of the data thatis desired. The Longer and Shorter Slide buttons are only applicable if the Auto Scale Button isoff. The plot will only show the last 100 elements unless these buttons are selected. The LongerSlide Button increases the number of elements by ten while the Shorter Slide button decreases thenumber by ten. The Print Plot Button makes a Postscript file of the plot.
Page 9

Mode Indicator
Figure 14 - Mode Indicator Graphic Object
The Mode Indicator Graphic Object presents the user with the current time of the simulation run,the mode of the simulation, and the number of vehicles currently in the simulation. The mode thesimulation is in is indicated by a red box. In Figure 14, the simulation is in Operate.
Page 10
GL 3D View
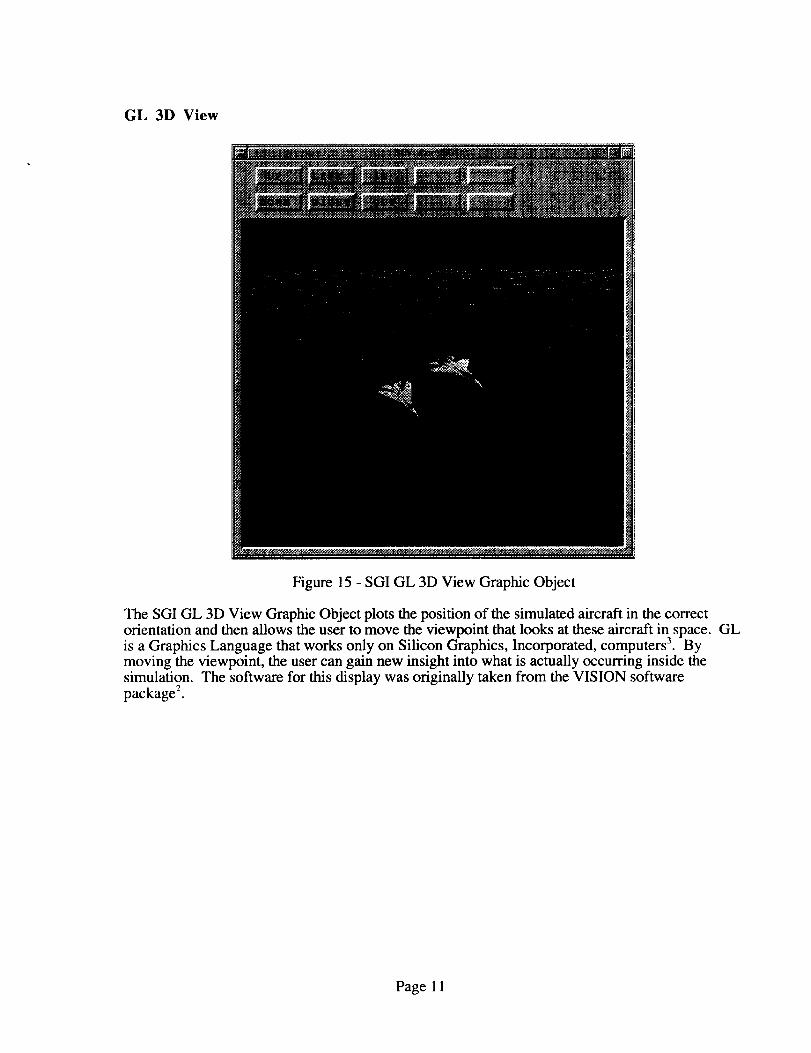
Figure 15 - SGI GL 3D View Graphic Object
The SGI GL 3D View Graphic Object plots the position of the simulated aircraft in the correctorientation and then allows the user to move the viewpoint that looks at these aircraft in space.3is a Graphics Language that works only on Silicon Graphics, Incorporated, computers. Bymoving the viewpoint, the user can gain new insight into what is actually occurring inside thesimulation. The software for this display was originally taken from the VISION softwarepackage 2.
GL
Page 11

X Window System 3D View
Figure 16 - X Window System 3D View Graphic Object
The X Window System 3D View Graphic Object was designed as an alternative for the SGI GL3D View Graphic Object. The 3D View Graphic Object plots the position of the simulated aircraftin the correct orientation and then allows the user to move the viewpoint that looks at these aircraftin space. By moving the viewpoint, the user can gain new insight into what is actually occurringinside the simulation. The Vlib graphics library was used in this Graphic Object _.
Figure 17 - Control Strip for X Window System 3D View
Most of the buttons for the Control Strip (Figure 17) are self-explanatory. The Shrink Buttonbrings the aircraft closer together while the Expand Button does the opposite. The G Flip Buttontoggles a Grid off and on. The Grid is very computationatly expensive and is turned off bydefault. The L Flip Button toggles off and on lines that are plotted from the aircraft to the ground.
Page 12
Heads-Up Display
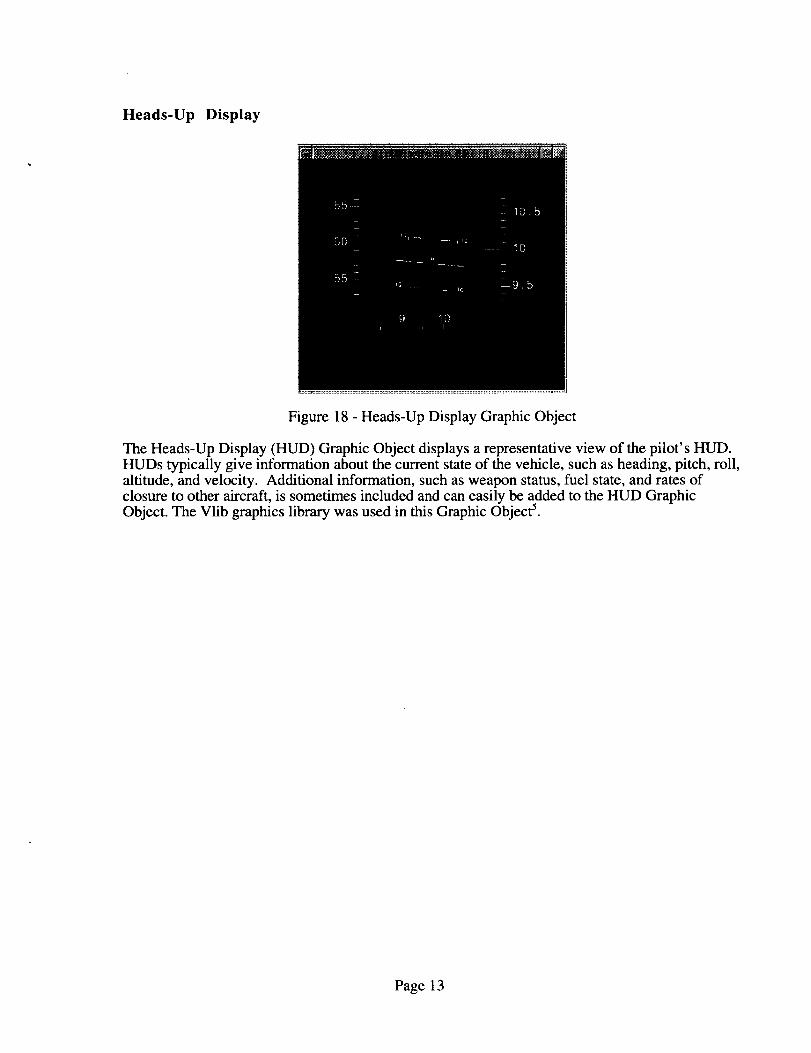
Figure 18 - Heads-Up Display Graphic Object
The Heads-Up Display (HUD) Graphic Object displays a representative view of the pilot' s HUD.HUDs typically give information about the current state of the vehicle, such as heading, pitch, roll,altitude, and velocity. Additional information, such as weapon status, fuel state, and rates ofclosure to other aircraft, is sometimes included and can easily be added to the HUD GraphicObject. The Vlib graphics library was used in this Graphic Object _.
Page 13

Out of the Cockpit View
Figure 19 - Out of the Cockpit View Graphic Object
The Out of the Cockpit View (OCV) Graphic Object gives the user a representative view of whatthe pilot is seeing. The OCV Graphic Object plots the locations of the simulated vehicles andpositions the eyepoint at one of these locations. The resulting view is then shown. Two separateOCV Graphic Objects are available. The Graphic Object shown in Figure 19 is the OCV-HUDGraphic Object. This object has this name because a Heads-Up Display is superimposed upon theOut of the Cockpit View. An additional OCV Graphic Object is available without the HUD and itis referred to as the OCV Graphic Object. The Vlib graphics library was used in this GraphicObject _.
Page 14

3.0 Conclusions
The increasing complexity of modem flight simulation has created the need for tools to aid in thevisualization of the tremendous amount of data that is produced. SimGraph was created not only tosimplify data interpretation but also to allow the users to adapt it to suit the requirements of theirresearch. The modular design of the program allows the user to pick and choose from a library ofgraphical displays that will meet the needs of the research being conducted. This document shouldprovide sufficient help to the user in understanding how to interact with the system.
P_el5
References
1. Cleveland, Jeff I., II; Sudik, Steven J.; Grove, Randall D.: "High Performance FlightSimulation as NASA Langley", AIAA 92-4179, in AIAA/AHS Flight Simulation TechnologiesConference, Hilton Head Island, South Carolina, August 24-26, 1992, Technical Papers, Pages313-319.
2. Dare, A., Burley, J.- "Pilot/Vehicle Display Development From Simulation To Flight", AIAA92-4174. AIAA/AHS Flight Simulation Technologies Conference, Hilton Head Island, SouthCarolina, August 24-26, 1992.
3. O'Reilly, Tim; Nye, Adrian: X Toolkit Intrinsics Programming Manual, Motif Edition, Volume4, November 1992.
4. OpenGL Architecture Review Board: OpenGL Programming Guide The Official Guide toLearning OpenGL, Release 1. Reading, Massachusetts, 1993.
5. Riley Rainey, ACM Version 4.3 The Aerial Combat Simulation for X11, February, 1994.
Page 16


REPORT DOCUMENTATION PAGE Form ApprovedOMB No. 0704-0188
Public refx)rtll_l bu_ler_ for this c_ion of informatiorl is estimall_ to average 1 hour per response, ¢lcltx:l_g the time for re..'mwmg instructions, searching existing data sources.gathering anti maintaining the data needed, and completing and rev_ the collection of reformation. Send commenls regarding this burden Imtinlate or any olher aspect ot thiscoflection of informatlorl, ¢lcludalg suggestions for reCluclng_i$ burden. Io Washington Hel_cluarlers ServCes. Directorate for Information Operations and Reports. 1215 Jefferson DavisHighway. Suite 1204, Arlington. VA 22202-4302, and to the Offct of Management and Budget. Pl,oerwod( Reduction Profect (0704-0188). Washinglon. DC 20503.
1. AGENCY USE ONLY (Leavebllnk) 12. REPORT DATE 1 3. REPORT'TYPE AND DATES COVERED
November 1996 I Technical Memorandum4. TITLE AND SUBTITLE 5. FUNDING NUMBERS
User's Guide for Flight Simulation Data Visualization Workstation
6. AUTHOR(S)
Joseph A. Kaplan, Ronnie Chen, Patrick S. Kenney, Christopher M. Koval,and Brian K. Hutchinson
7. PERFORMING ORGANIZATION NAME(S) AND ADDRESSEES)
NASA Langley Research Center
Hampton, VA 23681-0001
9. SPONSORING / MONITORING AGENCY NAME(S) AND ADDRESS(ES)
National Aeronautics and Space Administration
Washington, DC 20546-0001
8. PERFORMING ORGANIZATION
REPORT NUMBER
10. SPONSORING/MONITORINGAGENCY REPORT NUMBER
NASA TM-110294
11. SUPPLEMENTARY NOTES
12a. DISTRIBUTION/AVAILABILITY STATEMENT
Unclassified-Unlimited
Subject Category 61
12b. DISTRIBUTION CODE
13. ABSTRACT (Maximum 200 words)
Today's modem flight simulation research produces vast amounts of time sensitive data. The meaning of thisdata can be difficult to assess while in its raw format. Therefore, a method of breaking the data down andpresenting it to the user in a graphical format is necessary. Simulation Graphics (SimGraph) is intended as a
data visualization software package that will incorporate simulation data into a variety of animated graphicaldisplays for easy interpretation by the simulation researcher. This document is intended as an end user's guide.
14. SUBJECT TERMS
Heads-Up Display, Out of the Cockpit View
17. SECURITY CLASSIFICATION
OF REPORT
Unclassified
18. SECURITY CLASSIFICATION
OF THIS PAGE
Unclassified
NSN 7540-01-280-5500
19. SECURITY CLASSIFICATIONOF ABSTRACT
Unclassified
15. NUMBER OF PAGES
19
16. PRICE CODE
A03
20. LIMITATION OF ABSTRACT
Standard Form 298 (Rev. 2-89)Prescribed by ANSI SId Z39-18298-I02