Embed Size (px)
Citation preview

USER MANUAL
OptiForce200
March 2017
IonOptix LLC
396 University Ave, Westwood, MA 02090

2
Contents
1. Introduction to OFT200 .................................................................................................................................................... 3
2. Basics of interferometry .................................................................................................................................................... 3
3. Hardware ................................................................................................................................................................................. 7
a. Front panel of OFT200 ................................................................................................................................................ 7
b. Rear panel of OFT200 ................................................................................................................................................... 8
4. Setup and cleaning ............................................................................................................................................................... 9
5. Operation .............................................................................................................................................................................. 11
a. Measurement window ............................................................................................................................................... 11
b. Wavelength scan window ........................................................................................................................................ 12
c. Demodulation window.................................................................................................................................................12
d. Settings window ........................................................................................................................................................... 13
e. Side panel descriptions................................................................................................................................................14
6. Step-by-step procedure....................................................................................................................................................17
7. Force transducer calibration..........................................................................................................................................18
Research Use Only:
This product is intended for research purposes only. It is not certified for clinical applications
(including diagnostic purposes). Use of this product in uncertified applications is in violation of FDA
regulations.
Disclaimer: This is an electrical device. There is an inherent risk of electrical shock if used
improperly. Please take the necessary precautionary measures that are common place for any
electrical device. It is solely intended for the applications outlined in this document. The
manufacturer is not liable for any misuse, or any injury incurred because of misuse.

3
SAFETY WARNINGS
The OFT200 is equipped with a class 1M laser. The
laser is coupled out via the two connectors on the
front panel. Do not view directly with optical
instruments.
The OFT200 is equipped with a 220V/110V plug. Disconnect the instrument before changing the
fuse or before switching from 220V to 110V (or vice versa). Do not open the box, as this might
result in serious injuries.
IonOptix complies with the WEEE Directive on Waste of Electrical and Electronic Equipment.
Contact IonOptix if you wish to dispose of your OFT200.
1. Introduction to OFT200
The OFT200 is a stand-alone fiber interferometer that provides real-time demodulation of any
Fabry-Perot sensor. Using a single-mode fiber, displacement noise levels down to 2 𝑝𝑚
√𝐻𝑧 (standard)
can be achieved, over a stroke of hundreds of micrometers. The fully linearized displacement signal
is available as a scalable analog output voltage.
The linear signal is obtained by real-time, continuous, high-speed demodulation realized by an on-
board FPGA. The interrogator can provide a scalable analog voltage signal (16-bit resolution) up to
20 kHz. Calibration is performed automatically by the system.
The OFT200 is a convenient solution for low-noise, non-contact displacement measurements over a
scalable stroke of up to hundreds of micrometers.
2. Basics of interferometry
Before going into details about operation of the OFT200 let’s briefly discuss some basic principles
of interferometry. A typical fiber interferometer contains a light source and a detector. The light,

4
coupled into an optical fiber, travels toward the sensor/transducer and is partially reflected back
from multiple interfaces. As the multiple light signals travel back to the sensor, they interfere with
one another either constructively or destructively. The resulting signal amplitude is measured by
the detector, typically a photodiode, and converted into a useful electrical signal. Based on this
signal one can calculate a measured (such as forces, accelerations, humidity, and gas concentration)
with unprecedented accuracy and resolution. This is possible thanks to properties of laser light,
mainly stability and precise wavelength. The type of measured quantity depends only on the design
of the transducer. Since fiber-top measurement probes are all-optical, no electrical signals are
involved at the sensor side. Moreover, they can be used in extreme environments such as in high
temperature, liquids, or strong electrical and magnetic fields.
In the case of the OFT200, the electrical signal carries information about the displacement of a tiny
cantilever located at the tip of a fiber. Light is reflected from both the tip of the optical fiber and the
adjacent cantilever (see Figure 1 below). When force is applied to the cantilever, it will deflect,
changing the optical interference measured as a change in light intensity at the photodiode. Because
this light intensity is a function of cantilever deflection and consequently the amount of applied
force, force can be calculated by multiplying the amount of deflection by the spring constant of the
cantilever, which is provided on the box of each force probe.

5
Figure 1: Schematic representation of the interrogator working principle showing the path of light from
the IR laser source to the cantilever, where it is reflected to the photodiode sensor and converted into a
signal. At the optical fiber-cantilever interface, light is reflected from (I) the tip of the optical fiber; and
(II) the cantilever.
Quadrature Point
To obtain maximum sensitivity and linear
response, it is preferable to operate the
instrument near the quadrature point, i.e.,
near the mid-point of the sinusoidal function
depicted in the figure on the left. When a fiber-
top or ferrule-top cantilever is coupled to a
laser with a fix wavelength, there is the risk
that, in its at-rest-position (i.e., before that the
cantilever is bent by external forces), the
cantilever is not sufficiently close to the
position that would correspond to quadrature. To avoid problems of this kind, the OFT200 is
equipped with a tunable laser source, whose wavelength can be adjusted to match the quadrature

6
condition. During the Wavelength Scan function, the OFT200 automatically determines the optimal
wavelength.
Temperature Sensitivity
The distance between fiber tip and cantilever is measured in nm. Expansion of the ferrule to which
the fiber and cantilever are glued will thus affect the measurement. If stability of the baseline
measurement is very important, the temperature should be controlled tightly.

7
3. Hardware
a. Front Panel of OFT200
Figure 2: Front panel view
1. Power Switch, Green LED Light: The green led indicates whether the instrument is on or off.
2. Sensor Port: This port allows the user to connect the sensor to the interrogator.
3. Photodetector Output: This connector allows the user to send the analog output signal to an
external instrument. The bandwidth of this output is limited to 20 kHz.
4. Navigation buttons: These five buttons allow the user to navigate through the built-in menu and to
configure main functionalities of the interrogator.
5. LCD: Allows the user to use the system without PC.
IMPORTANT NOTE ON SAFETY:
The light source mounted inside the OFT200 is a class 1M laser. Use
precautions according to safety regulations for 1M lasers. Do not view
directly with optical instruments.

8
b. Rear Panel of OFT200
Figure 3 Rear panel view
1. Power Input: This connector allows the user to plug the instrument to the power net and to switch
on the instrument.
IMPORTANT: Before connecting to the main power supply line please check
the voltage settings (240/110).
2. USB Port: This port allows the user to connect the OFT200 to the computer.
3. 1 MHz Photodetector Output: This connector allows the user to send a direct analogue output of
the photodiode to an external device. The bandwidth of this output is limited to 1 MHz.
4. DDS TTL: Sync output of the internal signal generator (DDS).
5. Piezo output: Analog output of the internal signal generator (DDS).
6. Monitor Port: This port allows the user to couple 90% of light coming from the laser into an
auxiliary path (not included in OFT200) for monitoring and control purpose.
9
IMPORTANT NOTE ON SAFETY:
The OFT200 is equipped with a 220V/110V plug. Disconnect the
instrument before changing the fuse or before switching it from 220V
to 110V (or vice versa). Do not open the box, as this might result in
serious injuries.
4. Setup and Cleaning
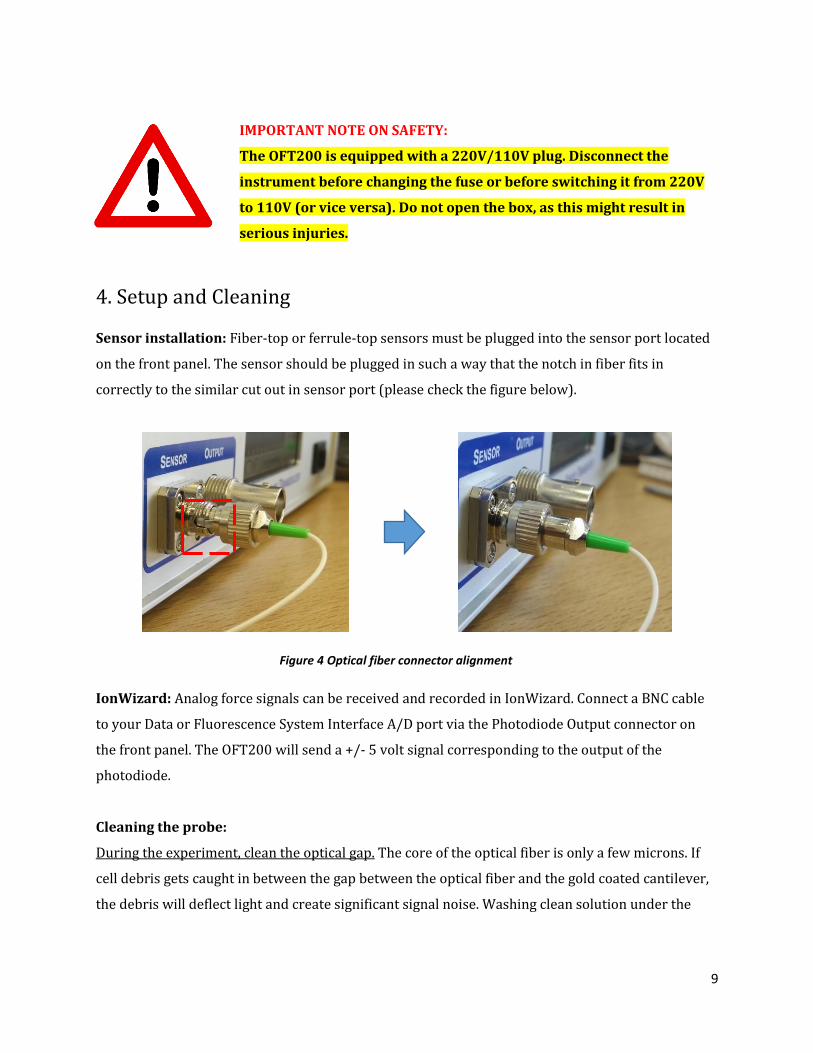
Sensor installation: Fiber-top or ferrule-top sensors must be plugged into the sensor port located
on the front panel. The sensor should be plugged in such a way that the notch in fiber fits in
correctly to the similar cut out in sensor port (please check the figure below).
IonWizard: Analog force signals can be received and recorded in IonWizard. Connect a BNC cable
to your Data or Fluorescence System Interface A/D port via the Photodiode Output connector on
the front panel. The OFT200 will send a +/- 5 volt signal corresponding to the output of the
photodiode.
Cleaning the probe:
During the experiment, clean the optical gap. The core of the optical fiber is only a few microns. If
cell debris gets caught in between the gap between the optical fiber and the gold coated cantilever,
the debris will deflect light and create significant signal noise. Washing clean solution under the
Figure 4 Optical fiber connector alignment

10
probe is usually sufficient to get rid of the debris and noise. This can even be done while a cell is
attached.
Between experiments, clean off dead cells. Dead cells usually come off with some mechanical action.
The smallest size paint brush is suitable for this purpose. Bristle or sable brushes are preferable to
synthetic brushes as the hairs on the brush are stiffer. MyoTak is mostly collagen, and to clean off
the working fiber properly, the MyoTak should be cleaned off as well. Collagen does not dissolve in
many solvents. A readily available solvent that does dissolve collagen and thus MyoTak reasonably
well is 6N (glacial) acetic acid. Do not use acetone as it can dissolve the glue that hold the optical
fiber and the wax that holds the working fiber.
End of the Day: Failure to clean the probe can lead to a decrease in the signal. If salt solution on the
probe is left to evaporate, salt crystals form between the probe and cantilever, rendering it useless.
Any dirt between the cantilever and optical fiber will affect the signal. A mild rinsing of the probe
with distilled water is usually sufficient to prevent this from happening.

11
5. Operation
The device can be operated without a computer. The Graphical User Interface (GUI) provides a user
interface to the device through the LCD display. All functions are accessible by five buttons located
on the front panel. Use arrows to navigate between different windows/buttons/values. To confirm
your choice press ENTER. For details please refer to pictures below. The GUI consists of 4 windows
and 5 panels. Windows and panels are explained below.
Figure 5 Front panel GUI operation
a. Measurement window:
This window shows a raw signal obtained from the optical fiber. The user can change gain and
offset of this signal. Amplitude of the raw signal is plotted in time domain.
Figure 6 Measurement window
Enter

12
b. Wavelength scan window
In this window, a wavelength scan can be performed, in which the OFT200 scans to find the most
suitable working wavelength at a quadrature point. The sine-like plot shows wavelength versus
photodiode voltage after a wavelength scan and is a fingerprint of probe cavity. A wavelength scan
should be repeated each time the sensor is changed. The “From… To…” box determines the range of
channels that will be scanned.
Figure 7 Wavelength scan window
c. Demodulation window:
In this window the user can monitor the demodulation process, or the process of converting the
photodiode signal to a usable signal. Ideal signal after calibration is a dotted white circle over the
red reference circle. This circle view is just a check to know whether the calibration step has
occurred properly or not.
Figure 8 Demodulation window

13
The output demodulated signal after calibration can be seen also on the time plot (using drop down
menu at the bottom of this screen). This is the same signal available on the front BNC output. The
bottom right icon must be green (i.e. in-range).
Signal indicator can either be degrees, voltage, or nanometers.
Tapping gently on the sensor after calibration should give a circular pattern as shown below:
Figure 9 Demodulation window showing ideal signal after calibration
d. Settings window:
Settings dialogue box shows the CPU and FPGA software version. “Save Defaults” will save the set
parameters on the memory.
Figure 10 Settings window

14
e. Side panel descriptions
Pressing the right and left buttons when the cursor is located in any part of the side panel scrolls
through the different side panel options.
Wizard Side Panel
Start wizard: This is the first step to begin the operation of OFT200. The
wizard walks the user through system calibration.
Wave scan: Second step of wizard begins by switching to wavelength scan
window.
Calibrate: Third step of wizard begins by switching to circle graph of
demodulation window.
Done: Final step of wizard shows the result in time graph of demodulation
window.
Reset range: After calibration, if the signal becomes saturated (shown by the
window displaying a red “saturated” message), pressing this button zeroes the demodulated output
to reset the signal.
Laser Side Panel
Laser Channel: Ranges from 1 to 89 and is set to 86 which is the default
parameter.
ON/OFF: Turns laser on and off.
Wavelength: Indicates the wavelength of laser corresponding to the laser
channel set.
Power: Laser power in mW.

15
ADC Side Panel
Gain: Sets the gain for the photodiode output.
Offset: Sets the offset for the photodiode output.
Range: Selector with low/high option for gain range.
Auto adjust: If enabled then gain and offset are added to the signal
automatically during the scan.
Modulation: Modulation can be turned on and off.
Output Side Panel
Front out: Changes the function of front BNC output. When set to “Straight” a
typical interferometric raw signal is available through front BNC. This signal is
previewed on “Measure” window. In “Demodul.” state the demodulated signal
is available instead of interferometric. This signal is previewed on the
“Demodulation” window time graph.
Sensitivity: Full range/voltage. For example, if full range is 20µm then
sensitivity is 2µm/V (i.e. one volt at the output represents 20µm). For liquid
operation the sensitivity value must be divided by refractive index of the
liquid.
Calibrate: Starts 10s calibration procedure. During this time interferometric
signal has to go through the peak and valley (max and min of interference pattern). A proper
calibration procedure creates a nice (which lies between -1 and 1) circle on the circle graph of the
“Demodulation” window. See the step-by-step instructions for more instruction.
16
Reset range: User can reset the demodulated signal and zero the front BNC output in “Demodul.”
state. This is typically done before measurement. An automatic reset is performed after each
calibration procedure.
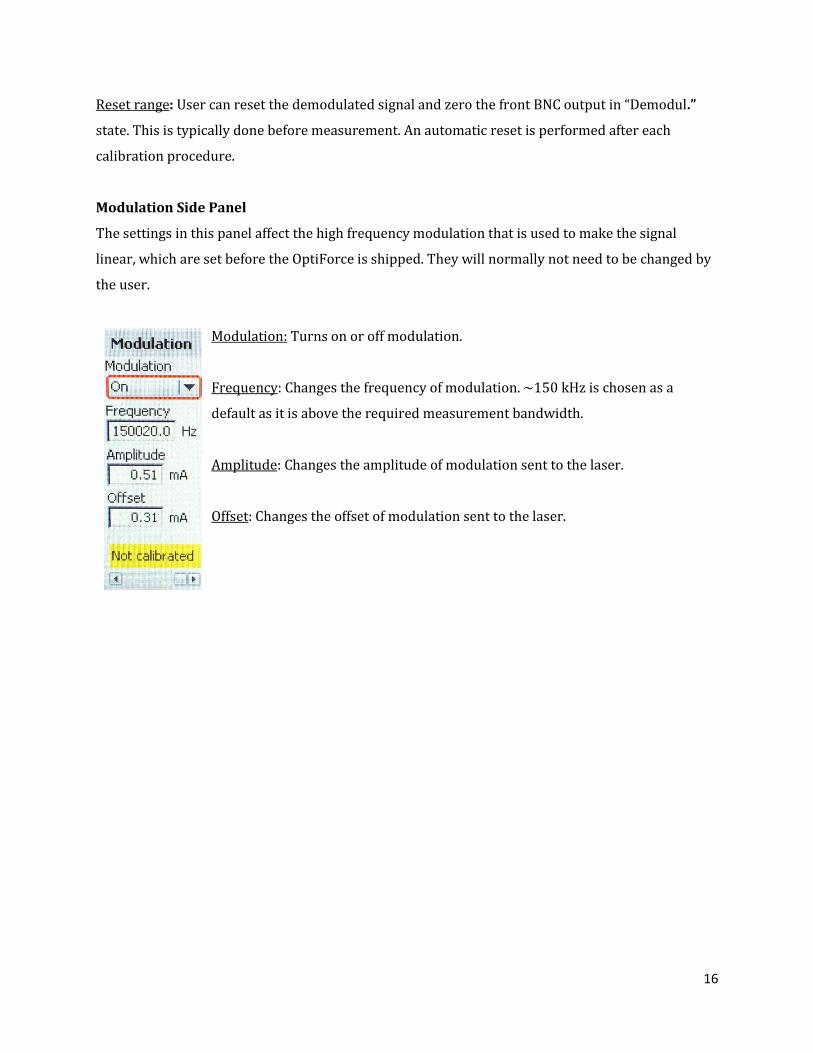
Modulation Side Panel
The settings in this panel affect the high frequency modulation that is used to make the signal
linear, which are set before the OptiForce is shipped. They will normally not need to be changed by
the user.
Modulation: Turns on or off modulation.
Frequency: Changes the frequency of modulation. ~150 kHz is chosen as a
default as it is above the required measurement bandwidth.
Amplitude: Changes the amplitude of modulation sent to the laser.
Offset: Changes the offset of modulation sent to the laser.
17
6. Step-by-step procedure
This is a step-by-step procedure to start and properly calibrate the device. These steps can also be
completed automatically by starting the Wizard and pressing the buttons when prompted.
1. Turn on the device.
2. Connect the probe to the sensor port in the front of the device. Check for the signal in the
Measurement window. The signal should change during manipulation of the sensor.
3. Next proceed to a wavelength scan by pressing “Scan wavelength” button in the Wavelength scan
window. During this process, the optimal gain and offset values are found. “Auto adjust” and
“modulation” in the ADC panel should be set to “ON” before scanning. Ideally a sinusoidal output
having an amplitude of about 6-8V peak-to-peak is obtained at the end of the scan. At the end of the
procedure the laser will be switched to a default modulation channel.
4. Next go to the Demodulation window. Press “Calibrate” in the Output panel. After pressing the
button the user has 10 seconds to gently tap the sensor in such a way that the calibrated signal (the
white dots that appear during probe excitation) becomes a circle similar to the red reference. This
circle should not be flattened on the top or side and should not be elliptical. If the circle is flattened,
decrease the gain slightly manually and redo the calibration. Switch from the circle to the time
graph using the drop down menu at the bottom of the screen. This gives the preview of the
demodulated signal after calibration.
5. Now the OptiForce is ready for operation.
NOTE:
If the front out dropdown is set to “Straight” a typical interferometric signal is available through
BNC output in the front of the device. This signal can also be previewed on the Measurement
window. The output of the front BNC can be scaled according to user needs using the “Sensitivity”
option on the Output panel, which is measured in um/V. If the output is saturated (greater than 10V
or lower than -10V as indicated with a red box in the bottom right corner of the screen) press
“Reset range” to readjust the output to 0V.

18
7. Force transducer calibration
Calibration of the force transducer is completed before the probe is shipped.