Embed Size (px)
Citation preview
Manual
Estimation of REDD+ cost elements
User Manual for the REDD+ cost elements assessment tool
Version 1.2. - March 2016

The World Bank,
1818 H Street, NW
Washington, DC 20433
USA
The findings, interpretations and conclusions herein are those of the authors and do not neces-sarily reflect the views of the International Bank for Reconstruction and Development / World Bank, its affiliated organizations, its Executive Directors, or the governments they represent.

Content
Content .......................................................................................................................................... 3
1 General information and purpose ........................................................................................... 4
2 Concept of REDD+ cost element assessment tool ................................................................... 4
2.1 Definitions REDD+ cost elements ..................................................................................... 6
2.1.1 Opportunity costs................................................................................................... 6
2.1.2 Implementation costs ............................................................................................ 8
2.1.3 Transaction costs ................................................................................................... 8
2.2 Institutional costs ............................................................................................................. 9
2.3 REDD+ cost element tool application guidance ............................................................. 11
2.4 Key assessment information .......................................................................................... 11
2.5 Spatial and carbon stock data ........................................................................................ 12
2.5.1 Spatial analysis ..................................................................................................... 12
2.5.2 Carbon stock assessment ..................................................................................... 13
2.6 Land use change matrix .................................................................................................. 14
3 GHG emissions ....................................................................................................................... 17
4 Assessment of land use economics ........................................................................................ 18
4.1 Land use economics ....................................................................................................... 21
4.2 Considerations in land use economics assessment ....................................................... 22
5 Opportunity costs assessment ............................................................................................... 23
5.1 REDD+ cost element tool linkage to REDD+ ABACUS software ..................................... 25
6 Assessment of REDD+ cost elements and abatement costs .................................................. 26
6.1 Abatement costs............................................................................................................. 27
7 References.............................................................................................................................. 28

User Manual REDD+ cost elements assessment tool UNIQUE 4
1 General information and purpose
The purpose of this tool is to provide REDD+ project or program planers with an economic tool to assess institutional, transaction and implementation REDD+ cost elements in a consistent manner, and quantify the abatement costs of the proposed REDD+ activities. It can be applied at different scales (project, province or region, and national). The tool is designed in a flexible and simple manner and is intended for users with basic background knowledge in MS Excel. The REDD+ cost assessment tool is available freely on the FCPF website www.forestcarbonpartner-ship.org.
Note that this tool does not take into account any specifics of carbon standards and is a purely economic analysis tool comparing the financial and GHG implications of a Reference (business-as-usual) and REDD+ scenario over a certain period of time.
This tool builds upon the framework of the World Bank (2010) “Estimating Opportunity Costs of REDD+”1 and the REDD+ cost element assessment work undertaken by UNIQUE forestry and land use in Tanzania2 and Democratic Republic of Congo (DRC) and Zambia.
2 Concepts of the REDD+ cost elements assessment tool and how it works
In the process of developing the national REDD+ frameworks, investors, development partners and policymakers are interested in cost-related information of REDD+ as a basis to develop strat-egies, allocate budgets, and assess the effectiveness of REDD+ investments and expenditures and prepare for performance based payments.
The figure below illustrates the general approach of the REDD+ cost elements assessment tool and further provides detailed guidance on its applicability.
1 http://wbi.worldbank.org/wbi/document/estimating-opportunity-costs-redd 2 http://www.cbmjournal.com/content/7/1/9; http://www.un-redd.org/Newsletter33/Tanzania_Cost_Elements/tabid/106654/Default.aspx

User Manual REDD+ cost elements assessment tool UNIQUE 5
Figure 1: General concept of the REDD+ cost elements assessment tool
The tool is designed in an iterative and flexible allowing the user to assess opportunity costs for multiple land uses, and requires the user to initially identify the persistent land use types at the project start and undertake a land use classification. It allows for the comparison of two scenar-ios – a Reference scenario (business-as-usual) and a REDD+ scenario. The Reference scenario represent the most likely future development path of the assessment unit and the respective land use changes, while the REDD+ scenario is a likely future scenario whereby specific interven-tions and the respective land use change trends are modeled.
In each scenario the user has to input the carbon stocks for each identified land use. Subse-quently land use change trends for each scenario have to be identified (land use change matri-ces). Afterwards one hectare based economic models have to be developed by undertaking fi-nancial analysis of each identified land use system. Based on these inputs the tool automatically generates carbon emissions, carbon stock enhancements and the opportunity costs between two distinct periods of time (see figure 2). If the REDD+ scenario is identified, in the next steps the user may estimate the remaining REDD+ costs elements comprised of implementation, transaction and institutional costs. Eventually, the tool automatically estimates the abatements costs of the REDD+ scenario.

User Manual REDD+ cost elements assessment tool UNIQUE 6
Figure 2: Opportunity costs methodological approach
Following this conceptual framework the MS Excel-based tool is structured in this iterative man-ner in the following worksheets (Figure 3).
Figure 3: Conceptual design REDD+ cost element assessment tool
2.1 Definitions REDD+ cost elements REDD+ cost elements are comprised of four different cost elements – opportunity costs, imple-mentation costs, transaction costs and institutional costs. In order to ensure consistency be-tween the cost types examples including definitions are provided below:
2.1.1 Opportunity costs
Opportunity costs are net benefits foregone when considering alternative activities (such as pro-ducing crops or any other agricultural activity) that could have been carried out on the same land. REDD+ opportunity costs are precisely the difference in net benefits from maintaining or enhancing forest cover and the net benefits from converting these forests and (if feasible) using the land for alternative purposes (e.g. smallholder farming). Opportunity costs can be presented on a per hectare basis, or per ton of CO2 equivalents of emissions avoided.
Opportunity cost analysis is an economic approach to monetize profits from these land uses, based on the calculation of the Net Present Value (NPV). The NPV is the result of a Discounted Cash Flow analysis (DCF) (see chapter 3, Box 1) of the costs and benefits for a certain land use over a defined period of time. Comparing the NPVs ($/ha) of various land uses indicates the most

User Manual REDD+ cost elements assessment tool UNIQUE 7
profitable land uses (e.g. profits from forest, agriculture, pasture). The difference between the higher NPV and the lower NPV is the opportunity cost, indicating the foregone monetized value the land user has to incur when opting for the land use with the lower NPV.
In order to estimate these costs, it is critical to understand the deforestation drivers in each REDD+ pilot activity subject to assessment. Moreover, understanding and estimating oppor-tunity costs is crucial to derive the needed REDD+ interventions to actually reduce the pressures on deforestation and avoid adverse social consequences (Pagiola & Bosquet, 2009).
An opportunity cost analysis can also be conducted in the REDD+ scenario and compared with the reference scenario identifying the economic benefits and potential losses of REDD+ imple-mentation.
Each land use is characterized by a “typical” average carbon stock (tCO2/ha). Since each land use type is also characterized by distinct NPV ($/ha), both parameters can be linked, resulting in opportunity cost estimates per ha and per tCO2.
Figure 3 illustrates a hypothetical example to explain this correlation:
• The carbon stock of natural forest is 400 tCO2/ha while agricultural land use carbon stock is 50 tCO2/ha.
• The NPV of forest is 50 $/ha, the NPV for agriculture is 800 $/ha.
Conserving the forest at its current state instead of converting it to agriculture would result in opportunity costs of 720 $/ha (difference between 800$/ha and 80$/ha), while the carbon con-served amounts to 350 tCO2/ha (difference between 400 tCO2/ha and 50 tCO2/ha). Hence, the opportunity cost per tCO2 due to forest conservation amounts to 2.1 $/tCO2.
Figure 4: Relation of NPV and carbon stock

User Manual REDD+ cost elements assessment tool UNIQUE 8
2.1.2 Implementation costs
Implementation costs are defined as the costs and investments required to implement REDD+ and avoid or minimize displacement of emissions to other regions or sectors (leakage). For in-stance, these costs can include: i) the cost of guarding a forest to prevent illegal logging; ii) man-aging a forest sustainably; iii) intensifying agriculture or pasture; or iv) improving energy effi-ciency in household cooking methods. All of these costs are intended to provide alternatives to the people avoiding unsustainable collection of fuelwood and production of charcoal (e.g. by providing alternative income generating activities). Depending on the scale of the cost assess-ment, the implementation costs may also include national level costs including: program imple-mentation, extension support services, investment in agricultural inputs and other activities di-rectly related to reduce emissions from deforestation and forest degradation. At project level, implementation costs of REDD+ are closely related to the respective project designs, which should explicitly address the drivers of deforestation and forest degradation as identified in the opportunity cost analysis, leakage prevention and overall project management as well as technical training and capacity building (Table 1). A major characteristic of implemen-tation costs is their recurrent nature after initial investments have taken place, that are related to addressing the drivers of deforestation and forest degradation.
Table 1: Examples of implementation costs
Scale
Cost categories National Juris-dicational
Project
Project infrastructure development X
Extension support services X x X
Sustainable forest management practices x X X
Law enforcement X X
Investments in agricultural inputs and improvement of productivity X X X
Reforestation/afforestation, agroforestry input and management costs X X X
Community social programs and investments X X X
Training and capacity building (fire management, sustainable land use, etc)
X X X
Staff salary costs of implementation x x x
Policy and action plan implementation
2.1.3 Transaction costs
Transaction costs are expenditures that are required to realize a transaction involving a REDD+ payment (buyer and seller, or donor and recipient) as well as external parties such as market regulators or payment scheme administrators (e.g. in national fund based mechanisms). REDD+

User Manual REDD+ cost elements assessment tool UNIQUE 9
transaction costs are also related to Measurement, Reporting and Verification (MRV) of forest carbon, certification, carbon transaction negotiations, marketing of GHG benefits and registry operations that track and administer the commodity. At project level, these costs are normally borne by project or program implementing entities. As for the national level, these costs are normally borne by the national level agencies and relate to REDD+ readiness activities such as: i) design and operation of the MRV systems; ii) design of reference emissions levels and refer-ence levels (REL/RL); iii) assessment and monitoring of social and environmental impacts; and iv) registry operations. These costs differ from implementation costs because they do not specifically reduce emissions from deforestation but are rather crucial to access potential performance-based REDD+ incen-tivized payments. While some of the transaction costs occur only once, typically at the beginning of the project, others are periodical costs.
Table 2: Examples of transaction costs
Cost categories Scale
National Juris-dictional
Project
Project design documentation and certification X
Costs related to payment distribution and benefit sharing mechanisms X X
Measurement, Reporting, and Verification related to GHG assessment X X X
Costs related to negotiations and contracting of REDD+ payments X X X
Contract management enforcement , negotiations, closure, compliance X X X
Financial management related to REDD+ X X X
Insurance costs X X X
Safeguards reporting, verification and compliance X X X
Grievance procedures and outcomes X X X
Standards establishment X X
Consultation and participation processes X X X
Marketing emissions reductions X X X
Registry operation and management of transactions X X X
2.2 Institutional costs Institutional costs of REDD+ are defined in the context of this study as costs incurred at the po-litical-administrative level to develop, manage and enforce REDD+ related activities, normally at national scale. These costs are related to national REDD+ readiness activities such as: i) develop-ing policies and regulations for a REDD+ framework; ii) institutional and/or legal reforms; iii) strengthening land tenure (e.g., via reform); and iv) building an enabling policy environment. This includes expenditures associated with training, research, policy design, legal and regulatory

User Manual REDD+ cost elements assessment tool UNIQUE 10
processes involved, law enforcement as well as national stakeholder consultations and decision making. These are typically costs incurred by government to ensure an enabling legal and regu-latory environment, address governance and reduce unregulated and/or illegal forest use. Also, pilot projects often include institutional costs in their budgets which relates to the interac-tions between project management and mainly local but also provincial and national govern-ment institutions – e.g. support the capacity building of local institutions. Institutional costs are often very difficult to distinguish from transaction costs at the project and national level. This is mainly due to the fact that the building and training of institutions – e.g. for MRV – can be as-signed to the transaction cost category but also to the institutional cost category. In our study, all activities related to building institutions, training and capacity building are assigned to insti-tutional costs, even though some cost elements could be assigned to transaction costs. It is important to count only institutional costs that are additional costs incurred by government institutions and projects compared to the reference scenario. Otherwise there is a tendency to overestimate REDD+ costs. Therefore, the existing historical forestry related expenditures should not be counted. For this reason, it is important to differentiate between business-as-usual and additional REDD+ related institutional investments.
Table 3: Institutional costs
Cost categories Scale
National Juris-dicational
Project
Institutional reform (Land tenure etc.) X X
Policy development and formulation X X
Training and capacity building of authorities (sustainable land use, GHG MRV, etc)
X X
Establishment and operation of new administrative REDD+ related au-thorities
X X
Establishment of participatory forest management mechanisms X X X
Staff salary costs related to operation of authorities X X
Knowledge transfer/dissemination on the local or national scale X X X

User Manual REDD+ cost elements assessment tool UNIQUE 11
2.3 REDD+ cost elements tool application guidance The tool is designed in an iterative manner and requires the user to fill out an array of entry fields. Only fields marked in yellow may be filled out by the user. The remaining fields are cal-culated automatically (Figure 5). Based on the input entry field the tool automatically generates information on the GHG emissions between the Reference and REDD+ scenario, opportunity costs, and REDD+ costs. The following example shows the economics of one land use that re-quires the user to input annual investment and recurrent costs, followed by annual revenues and a discount rate. The remaining field such as the annual und cumulative cash-flows, Net-Present Value (NPV) and Internal Rate of Return (IRR) are generated automatically.
Figure 5: Example input fields of REDD+ cost elements assessment tool – Worksheet: “Economics_Reference”
2.4 Key assessment information In the first “Key project info” sheet the user must decide the currency in which the economic assessment will be conducted and the time period of the entire assessment (figure 6, Cell B5-B6). The period of assessment should reflect the timeframe in which the REDD+ activity will take place. The user may select a timeframe between 1 and 30 years. The timeframe determines for how many years a Reference scenario and a REDD+ scenario will be assessed.
Figure 6: General parameters - Worksheet: “Key project info”

User Manual REDD+ cost elements assessment tool UNIQUE 12
2.5 Spatial and carbon stock data
2.5.1 Spatial analysis
Step 1. The user undertakes a land use classification of the REDD+ activity. Thereby all land uses and respective area representation at start must be filled out in the yellow fields (Cell B33-B52) (Figure 7). The identification of each land use must represent relatively homogenous carbon stocks and economic performance of the respective land use. Also land uses that do not exist at project start but will be transformed due to a REDD+ activity or projected from the Reference scenario, must be identified and filled in. The tool allows for comparison of a maximum of 20 different land uses.
Figure 7: Land use classification - Worksheet: “Key project info”
The land use classification must be identified by considering land use transitions over the assess-ment timeframe (Figure 8). For example primary natural forest (non-exploited) is initially used for charcoal production and subsequently converted to agricultural land. In this case the user must separate this land use from the direct conversion of natural forest to agricultural land use, since the economics of both land use are different over the assessment timeframe.
Figure 8: Land use transition and implication on carbon stocks and eco-nomic performance

User Manual REDD+ cost elements assessment tool UNIQUE 13
Step 2. The user must project the land use classification of the Reference scenario and a REDD+ scenario at the end of the selected assessment period. For the projection of the Reference sce-narios land use trends and historical land use change data is normally used and projected into the future. If this is not appropriate, national or sub-national circumstances may adapt the ref-erence scenario land use change trends. Further guidance on the development of Reference scenarios can be found under the following sources:
• UNFCCC Modalities for forest reference emissions levels and forest reference levels, at: http://unfccc.int/resource/docs/2011/cop17/eng/09a02.pdf#page=16
• Meridian Institute Guidelines for REDD+ Reference Levels, at: http://www.redd-oar.org/
In the REDD+ scenario the users would have projected the land use change trends into the future considering the implementation of proposed REDD+ implementation interventions. This sce-nario may be designed in a flexible manner and the user may test different scenarios and com-pare these with the Reference one.
In order to maintain consistency between both scenarios, in the worksheet “Key project info” the total areas of the land use classification (Cell C53), the Reference scenario (Cell G40) and REDD+ scenario (Cell G69) must be equal. If this is not the case, the comparison of both scenarios will lead to systematic mistakes in the analysis. In this case the tool signals the incorrect data input with the wording “Inconsistent areas”.
2.5.2 Carbon stock assessment
The carbon stocks for each identified land use must reflect a time average over the assessment period. The tool allows the user to fill out five different carbon pools (aboveground, below-ground, dead wood, litter and soil carbon in accordance with the IPCC classification). If no data e.g for dead wood or litter exists, or these carbon pools are conservatively neglected, the user must leave the entry field blank.
Locally or regionally representative carbon stock values for each land use should preferably be used. Alternatively if local or regional data does not exist, national or international default values may be used. However, note that if international carbon stock default values are used, the un-certainty will increase ,and as a consequence the opportunity costs analysis will not result in accurate estimates, compared with one that uses locally derived default values.
Example project:
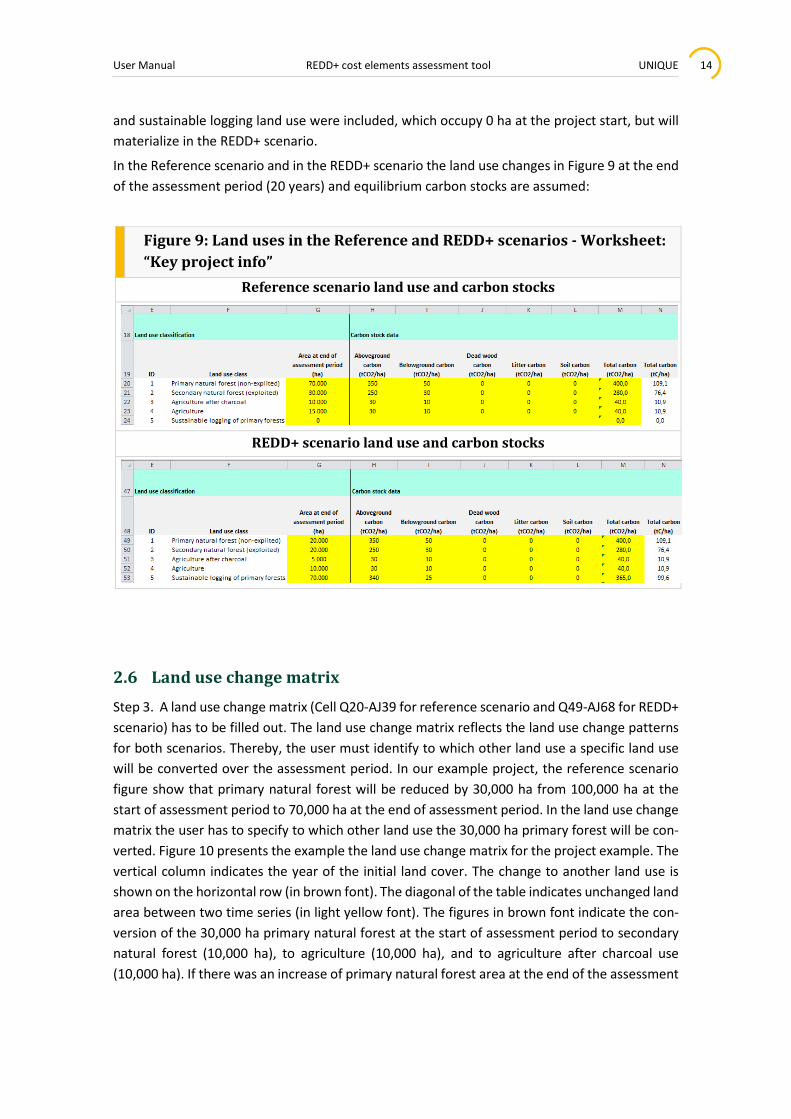
In the next steps an example project of 125,000 ha is used to illustrate the guidance given in this manual. At the project start the total land area is classified into primary natural forest (non-exploited) (100,000 ha), secondary natural forest (exploited) (20,000 ha) and agricultural land use (5,000 ha). In addition, additional land use such as agricultural land use after charcoal use
User Manual REDD+ cost elements assessment tool UNIQUE 14
and sustainable logging land use were included, which occupy 0 ha at the project start, but will materialize in the REDD+ scenario.
In the Reference scenario and in the REDD+ scenario the land use changes in Figure 9 at the end of the assessment period (20 years) and equilibrium carbon stocks are assumed:
Figure 9: Land uses in the Reference and REDD+ scenarios - Worksheet: “Key project info”
Reference scenario land use and carbon stocks
REDD+ scenario land use and carbon stocks
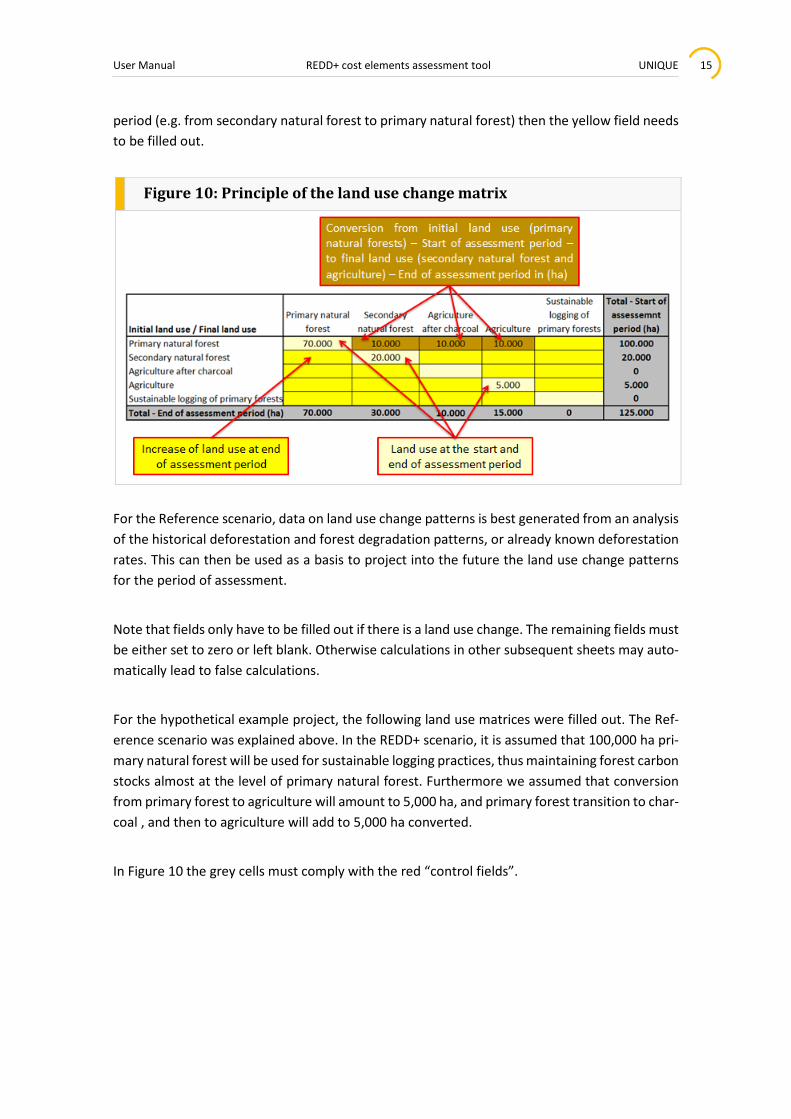
2.6 Land use change matrix Step 3. A land use change matrix (Cell Q20-AJ39 for reference scenario and Q49-AJ68 for REDD+ scenario) has to be filled out. The land use change matrix reflects the land use change patterns for both scenarios. Thereby, the user must identify to which other land use a specific land use will be converted over the assessment period. In our example project, the reference scenario figure show that primary natural forest will be reduced by 30,000 ha from 100,000 ha at the start of assessment period to 70,000 ha at the end of assessment period. In the land use change matrix the user has to specify to which other land use the 30,000 ha primary forest will be con-verted. Figure 10 presents the example the land use change matrix for the project example. The vertical column indicates the year of the initial land cover. The change to another land use is shown on the horizontal row (in brown font). The diagonal of the table indicates unchanged land area between two time series (in light yellow font). The figures in brown font indicate the con-version of the 30,000 ha primary natural forest at the start of assessment period to secondary natural forest (10,000 ha), to agriculture (10,000 ha), and to agriculture after charcoal use (10,000 ha). If there was an increase of primary natural forest area at the end of the assessment
User Manual REDD+ cost elements assessment tool UNIQUE 15
period (e.g. from secondary natural forest to primary natural forest) then the yellow field needs to be filled out.
Figure 10: Principle of the land use change matrix
For the Reference scenario, data on land use change patterns is best generated from an analysis of the historical deforestation and forest degradation patterns, or already known deforestation rates. This can then be used as a basis to project into the future the land use change patterns for the period of assessment.
Note that fields only have to be filled out if there is a land use change. The remaining fields must be either set to zero or left blank. Otherwise calculations in other subsequent sheets may auto-matically lead to false calculations.
For the hypothetical example project, the following land use matrices were filled out. The Ref-erence scenario was explained above. In the REDD+ scenario, it is assumed that 100,000 ha pri-mary natural forest will be used for sustainable logging practices, thus maintaining forest carbon stocks almost at the level of primary natural forest. Furthermore we assumed that conversion from primary forest to agriculture will amount to 5,000 ha, and primary forest transition to char-coal , and then to agriculture will add to 5,000 ha converted.
In Figure 10 the grey cells must comply with the red “control fields”.

User Manual REDD+ cost elements assessment tool UNIQUE 16
Figure 11: Land use change matrices for Reference scenario and REDD+ scenario of example project - Worksheet: “Project key info”
Reference scenario land use change matrix
REDD+ scenario land use change matrix

User Manual REDD+ cost elements assessment tool UNIQUE 17
3 GHG emissions
GHG emissions are generally calculated by the multiplication of emissions factors and activity data. Thereby the difference in carbon stocks between land use A and land use B forms the emissions factors, while the conversion of land use A to land use B forms the activity data. Ac-tivity data is represented in the land use change matrices that identify how many hectares of a specific land were converted to another land use.
Based on the carbon stock data filled in the key project information sheet and the land use change matrices for the reference and REDD+ scenario the tool automatically calculates the GHG emissions (reductions) on a per ha basis and aggregates these to the total area of assessment. At the top of the sheet the total GHG emissions in the Reference scenario and at the bottom the REDD+ scenario are calculated. In Cell B7 the net GHG benefits are automatically generated based on the difference between the Reference and REDD+ scenario for the time period of as-sessment (Figure 12).
Figure 12: GHG emissions and emissions reductions - Worksheet: “GHG emissions”
The GHG emissions are presented in the same form as the land use change matrix and must be read respectively (Figure 13). Thereby the matrix shows that the conversion of one ha of primary natural forest (carbon stock 400 tCO2/ha) to agricultural land use (carbon stock 40 tCO2/ha) will result in emissions of 360 tCO2/ha. Negative values indicate carbon emissions while positive val-ues indicate carbon stock enhancements from land use changes.

User Manual REDD+ cost elements assessment tool UNIQUE 18
Figure 13: Carbon emission (reduction) matrices - Worksheet: “GHG emissions”
GHG emission (tCO2) per ha due to conversion
Total GHG emissions (tCO2)
4 Assessment of land use economics
In order to quantify the opportunity costs and assess REDD+ abatement costs, the economic effect of each scenario has to be assessed. For the opportunity costs analysis the Net Present Value (NPV) is used as the economic profitability index (Box 1). For the calculation of the NPV the user must input the annual investment costs, recurrent costs and revenues of each land use for the time period as determined in Cell 6 (Project key info sheet). The assessment of the cost and revenues should reflect the local economic conditions and take the perspective of the de-forestation and forest degradation agents.
For the determination of the REDD+ abatement costs, the incremental cash flows between the Reference scenario and REDD+ scenario will compare the net economic benefits or losses of these scenario (Chapter 6).
User Manual REDD+ cost elements assessment tool UNIQUE 19
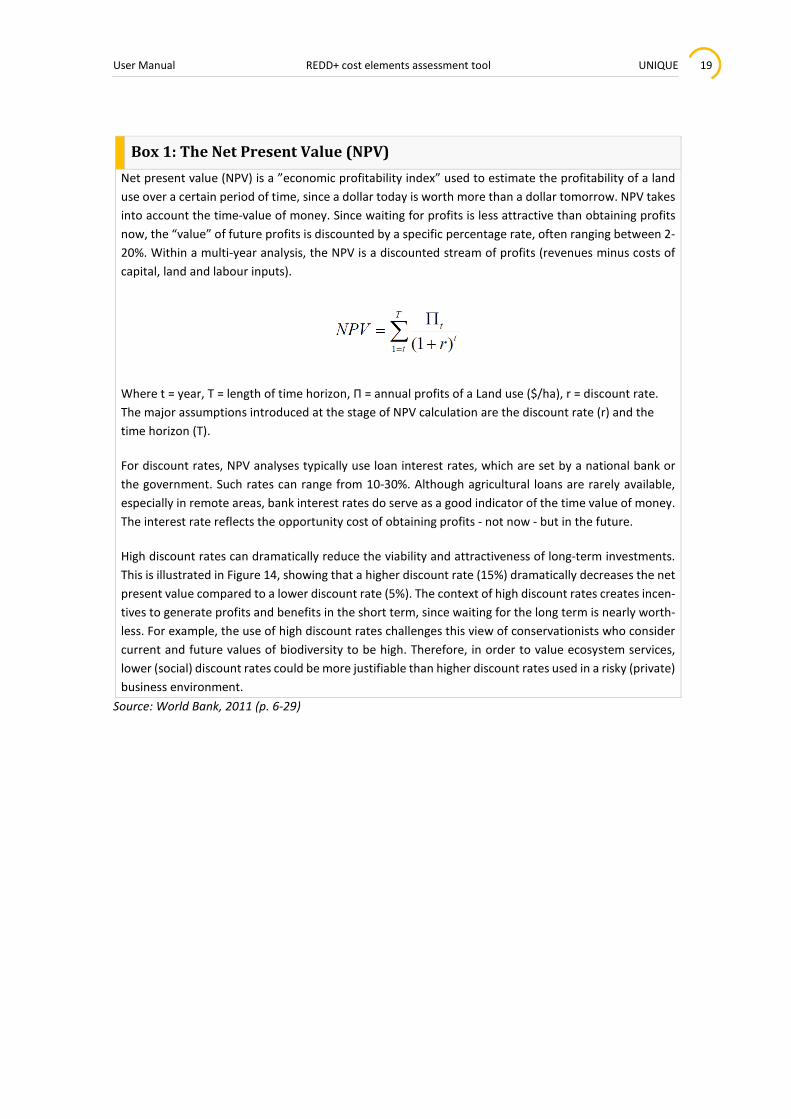
Box 1: The Net Present Value (NPV) Net present value (NPV) is a ”economic profitability index” used to estimate the profitability of a land use over a certain period of time, since a dollar today is worth more than a dollar tomorrow. NPV takes into account the time-value of money. Since waiting for profits is less attractive than obtaining profits now, the “value” of future profits is discounted by a specific percentage rate, often ranging between 2-20%. Within a multi-year analysis, the NPV is a discounted stream of profits (revenues minus costs of capital, land and labour inputs).
Where t = year, T = length of time horizon, Π = annual profits of a Land use ($/ha), r = discount rate. The major assumptions introduced at the stage of NPV calculation are the discount rate (r) and the time horizon (T).
For discount rates, NPV analyses typically use loan interest rates, which are set by a national bank or the government. Such rates can range from 10-30%. Although agricultural loans are rarely available, especially in remote areas, bank interest rates do serve as a good indicator of the time value of money. The interest rate reflects the opportunity cost of obtaining profits - not now - but in the future.
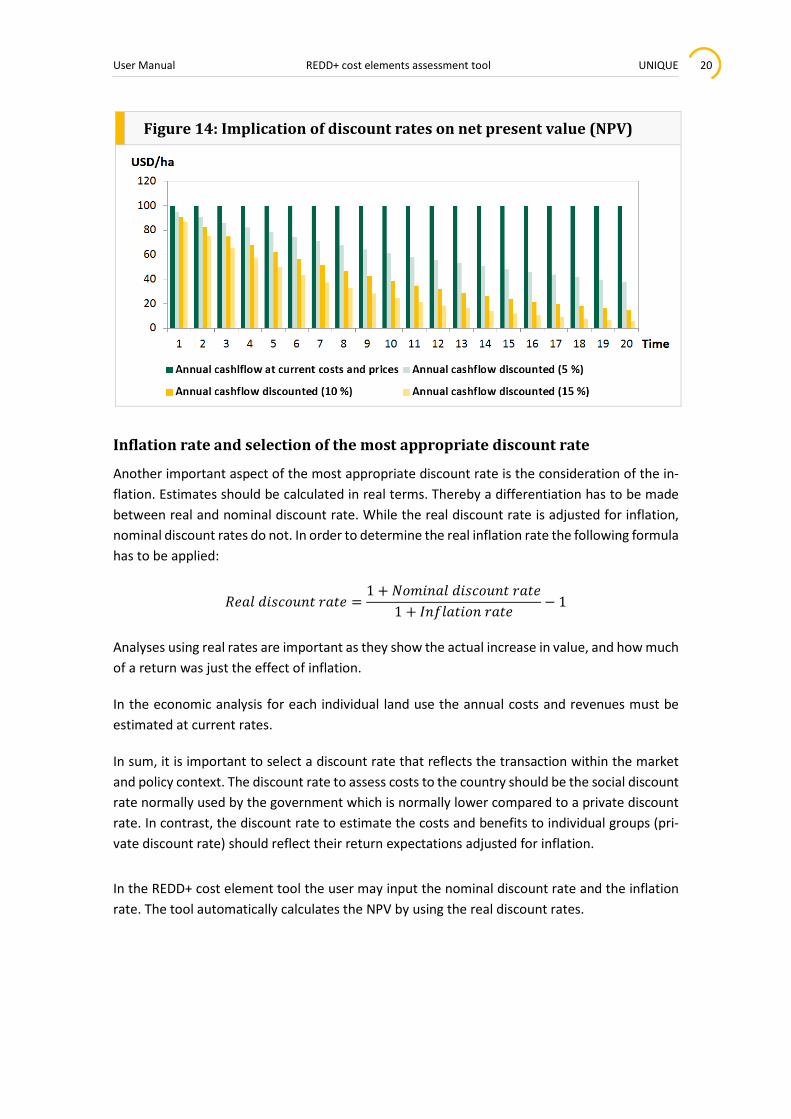
High discount rates can dramatically reduce the viability and attractiveness of long-term investments. This is illustrated in Figure 14, showing that a higher discount rate (15%) dramatically decreases the net present value compared to a lower discount rate (5%). The context of high discount rates creates incen-tives to generate profits and benefits in the short term, since waiting for the long term is nearly worth-less. For example, the use of high discount rates challenges this view of conservationists who consider current and future values of biodiversity to be high. Therefore, in order to value ecosystem services, lower (social) discount rates could be more justifiable than higher discount rates used in a risky (private) business environment.
Source: World Bank, 2011 (p. 6-29)
User Manual REDD+ cost elements assessment tool UNIQUE 20
Figure 14: Implication of discount rates on net present value (NPV)
Inflation rate and selection of the most appropriate discount rate
Another important aspect of the most appropriate discount rate is the consideration of the in-flation. Estimates should be calculated in real terms. Thereby a differentiation has to be made between real and nominal discount rate. While the real discount rate is adjusted for inflation, nominal discount rates do not. In order to determine the real inflation rate the following formula has to be applied:
𝑅𝑅𝑅𝑅𝑅𝑅𝑅𝑅 𝑑𝑑𝑑𝑑𝑑𝑑𝑑𝑑𝑑𝑑𝑑𝑑𝑑𝑑𝑑𝑑 𝑟𝑟𝑅𝑅𝑑𝑑𝑅𝑅 =1 + 𝑁𝑁𝑑𝑑𝑁𝑁𝑑𝑑𝑑𝑑𝑅𝑅𝑅𝑅 𝑑𝑑𝑑𝑑𝑑𝑑𝑑𝑑𝑑𝑑𝑑𝑑𝑑𝑑𝑑𝑑 𝑟𝑟𝑅𝑅𝑑𝑑𝑅𝑅
1 + 𝐼𝐼𝑑𝑑𝐼𝐼𝑅𝑅𝑅𝑅𝑑𝑑𝑑𝑑𝑑𝑑𝑑𝑑 𝑟𝑟𝑅𝑅𝑑𝑑𝑅𝑅− 1
Analyses using real rates are important as they show the actual increase in value, and how much of a return was just the effect of inflation.
In the economic analysis for each individual land use the annual costs and revenues must be estimated at current rates.
In sum, it is important to select a discount rate that reflects the transaction within the market and policy context. The discount rate to assess costs to the country should be the social discount rate normally used by the government which is normally lower compared to a private discount rate. In contrast, the discount rate to estimate the costs and benefits to individual groups (pri-vate discount rate) should reflect their return expectations adjusted for inflation.
In the REDD+ cost element tool the user may input the nominal discount rate and the inflation rate. The tool automatically calculates the NPV by using the real discount rates.

User Manual REDD+ cost elements assessment tool UNIQUE 21
Figure 15: Calculation of real discount rate - Worksheets: “Eco-nomic_Reference” and “Economics_REDD+ scenario”
4.1 Land use economics REDD+ programs involve different types of landowners. Such owners can be a country or from an individual group (e.g., farmer, rancher, logging company, community). The way costs and revenues are calculated – called an accounting stance – represents the viewpoint of individual groups or the country. Although an accounting stance does not affect productivity data (e.g., yield/harvest quantities), the difference in perspective determines what is counted as costs or benefits, the data collected, prices and discount rates within budget accounts, and thus profit analyses. Inappropriate mixing of data and methods is a common and potentially easy error, and can result in misleading estimates (Pagiola and Bosquet, 2009; World Bank, 2011).
In order to calculate the NPV for each identified land use the user has to input investment costs, the annual cost and revenues over the period of assessment on a per ha basis. The differentia-tion between investment costs and recurrent costs not necessarily has to be made, and only one column may be filled out. Investment costs normally occur once to establish production of a specific land use. Normally the first period will have substantial investment costs. Recurrent costs are characterized by its periodic occurrence for the operations management of a specific land use. After the annual costs and revenues are introduced the cash flows are calculated au-tomatically. Each land use cash flow on a per hectare basis is used as the reference units which are then automatically aggregated to the scale of the assessment, based on the land use change matrices in both Reference and REDD+ scenarios.
In order to maintain flexibility of the tool each specific land use economics sheet requires the input of the annual costs and revenues over time. The land use economics have to be assessed for the Reference and REDD+ scenario in a separate way, for which two “economics sheets” are provided. Each land use will have different key variables and assumptions for an accurate eco-nomic assessment. Therefore the user requires undertaking cost benefits analyses for each iden-tified land use in separate sheets (not provided in the tool). Elaborative guidance on how to undertake cost benefits analyses is provided in the World Bank (2011)3 publication “Estimating the opportunity costs of REDD+” (chapter 6).
3 http://wbi.worldbank.org/wbi/Data/wbi/wbicms/files/drupal-acquia/wbi/OppCostsREDD+manual.pdf

User Manual REDD+ cost elements assessment tool UNIQUE 22
4.2 Considerations in land use economic assessments Unsustainable land uses may be subject to different transition patterns. For example a primary natural forest may initially be used for logging of wood fuel production leading to forest degra-dation and subsequently may be converted to agricultural land uses over a certain period of time (Figure 8). Thereby the transition over time may generate different annual cost and reve-nues.
Similarly, the clearance of natural forest to shifting cultivation systems, may generate costs and revenues not on annual basis since one ha of land is used for a few years and subsequently left fallow. These land use change patterns must be reflected when undertaking the land use classi-fication and should reflect the land use transition and the respective profits over the entire as-sessment period.
Agricultural land use systems may include more than only one crop. Particularly smallholder farming systems include an array of different crops. Thereby, it is good practice to initially iden-tify the average percentage share of each crop when feasible. For each crop in the farming sys-tem a separate 1-ha cost-benefit analysis may be conducted and then scaled down to an overall 1-ha mixed cropping systems based on the identified percentages of each crop (Figure 16).
Figure 16: Compilation of 1ha mixed farming system economic models
The NPVs are automatically calculated in the land-use economics sheets for the assessment se-lected assessment time period (Cell B6 - worksheet “Key project info”). The land use economics should at least reflect one rotation period if it is beyond the assessment period (e.g. if one for-estation rotation takes 30 years and the assessment period is 20 years, the annual cashflows should be input for the entire rotation period. If there are more than one rotation period within the assessment period, cost and revenues should be input for several rotation periods within the assessment period.
User Manual REDD+ cost elements assessment tool UNIQUE 23
5 Opportunity costs assessment
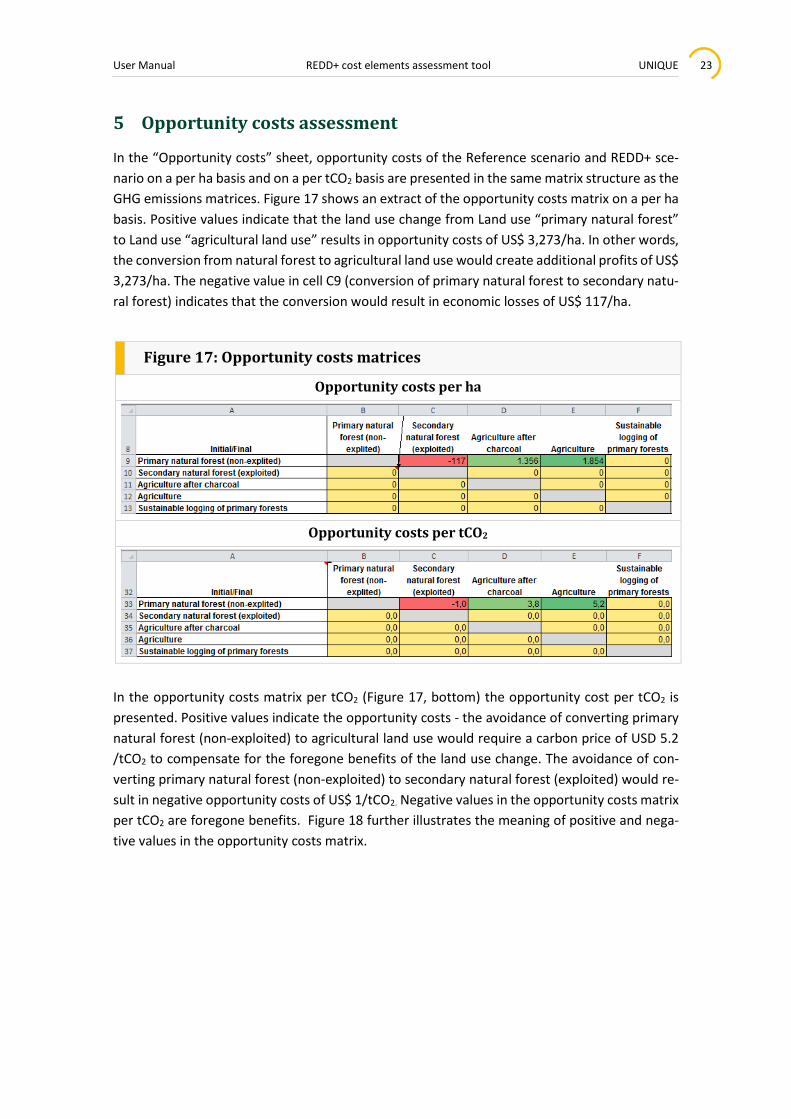
In the “Opportunity costs” sheet, opportunity costs of the Reference scenario and REDD+ sce-nario on a per ha basis and on a per tCO2 basis are presented in the same matrix structure as the GHG emissions matrices. Figure 17 shows an extract of the opportunity costs matrix on a per ha basis. Positive values indicate that the land use change from Land use “primary natural forest” to Land use “agricultural land use” results in opportunity costs of US$ 3,273/ha. In other words, the conversion from natural forest to agricultural land use would create additional profits of US$ 3,273/ha. The negative value in cell C9 (conversion of primary natural forest to secondary natu-ral forest) indicates that the conversion would result in economic losses of US$ 117/ha.
Figure 17: Opportunity costs matrices
Opportunity costs per ha
Opportunity costs per tCO2
In the opportunity costs matrix per tCO2 (Figure 17, bottom) the opportunity cost per tCO2 is presented. Positive values indicate the opportunity costs - the avoidance of converting primary natural forest (non-exploited) to agricultural land use would require a carbon price of USD 5.2 /tCO2 to compensate for the foregone benefits of the land use change. The avoidance of con-verting primary natural forest (non-exploited) to secondary natural forest (exploited) would re-sult in negative opportunity costs of US$ 1/tCO2. Negative values in the opportunity costs matrix per tCO2 are foregone benefits. Figure 18 further illustrates the meaning of positive and nega-tive values in the opportunity costs matrix.

User Manual REDD+ cost elements assessment tool UNIQUE 24
Figure 18: Implications of positive and negative opportunity costs values per tCO2 when converting land use A to Land use B
Negative values indicate net benefits of REDD+ intervention, while positive values indicate op-portunity costs - additional investment will be required in order to compensate for the carbon losses and foregone benefits. For example, the best case would be if an unused forest would be shifted to sustainable production forest which results in higher carbon stocks and higher eco-nomic return. In the worst case a natural forest is converted to agricultural with higher profita-bility and significant carbon emissions indicating high opportunity costs (positive values).
The opportunity cost matrices are automatically generated for the Reference and the REDD+ scenarios. While the reference matrices show the opportunity costs of land use changes in the Reference scenario, in the REDD+ scenario the user may assess the profitability and economic benefits of potential REDD+ intervention activities and whether these will be sufficient to com-pensate for the foregone benefits in the Reference scenario.
Often carbon stocks data and economic performance data of individual land uses are subject to significant variations and uncertainties among regions or land users. Therefore, with the given opportunity costs matrix, the user is encouraged to undertake a sensitivity analysis by changing either carbon stocks or economic performance of individual land uses. The sensitivity analysis may help to understand the variations of opportunity costs within the Reference or REDD+ sce-nario and also allows comparing different scenarios between the Reference and REDD+ scenario.

User Manual REDD+ cost elements assessment tool UNIQUE 25
5.1 REDD+ cost element tool linkage to REDD+ ABACUS software A separate “ABACUS interface” sheet is provided with all relevant information to use the REDD+ ABACUS software that allows the user to generate opportunity cost curves as shown in Figure 19). The REDD Abacus software has been designed to visually generate opportunity cost curves. For more information and the application of ABACUS please, see the manual available at: http://www.worldagroforestry.org/sea/abacus
Figure 18: Generation of opportunity cost curves with ABACUS
How to read the opportunity cost curve 1. Each bar represents an option of avoiding GHG emissions from converting Land use A to
Land use B. 2. The width of each bar shows the annual GHG emission reduction and/or carbon removal
potential (in tCO2), taking into account the current economic conditions and assuming that deforestation will occur in the same manner as in the past 10 years.
3. The sum of all bars cumulates the annual GHG emission reduction potential over the as-sessment period (tCO2).
4. The height of each bar shows the opportunity cost for avoiding the conversion of natural forests to the indicated land use (US$/tCO2).
5. The bars on the left hand side represent the cheapest emission reduction options, while the bars on the right hand side comprise the most expensive GHG emission reduction op-tions. Thus, avoidance of land use changes on the left hand side provide relatively cheap GHG emission reduction options and serve as a convenient tool to prioritize cost-effective measures to avoid deforestation.

User Manual REDD+ cost elements assessment tool UNIQUE 26
6 Assessment of REDD+ cost elements and abatement costs
For the assessment of the REDD+ costs and abatement costs the user has to estimate the total costs of REDD+ (see Worksheet: “REDD+ costs”). These have to be estimated on an annual basis and filled out in yellow entry fields (Figure 20).
Figure 19: REDD+ cost element estimation - Worksheet “REDD+ costs”
The project scale cost estimates may be estimated from project budgets and financial analyses and other forms of cost-benefit analyses. On the national scale, the readiness preparation pro-posal (R-PP) under the framework of the World Bank Forest Carbon Partnership Facility (FCPF) may serve as starting points to assess REDD+ costs, which should be complemented by more detailed cost assessments with the development of the implementation frameworks for in-stance with the Emission Reduction Program Idea Note (ERPIN) and the Emission Reduction Pro-gram Document (ERPD).
All cost must be estimated at current costs. The adjustment for inflation and discounting is gen-erated automatically once the user filled out the inflation rate field and nominal discount rate in Cell B5-B6 (Worksheet: “REDD+ costs”).
The estimation of REDD+ costs must be filled out in yellow field under the respective REDD+ activity “components” between Cell A14 and AG 275. Each component may include maximum 10 activities. In order to determine the cost type the row B 43 – B 270 requires the user select between “Implementation”; “Transaction”; and “Institutional” cost types. For a definition of these cost elements, see chapter 2.
In order to avoid double counting of costs, it is crucial to exclude costs that have already been counted for in the Worksheet ‘Economics REDD+ scenario’ for each individual land use. There-fore users have to be careful when estimating REDD+ cost and clearly draw boundaries between the cost to be assigned to each individual land use and cost related to the overall design and implementation of the REDD+ activity.

User Manual REDD+ cost elements assessment tool UNIQUE 27
6.1 Abatement costs REDD+ abatement costs indicate the carbon price (US$/tCO2) of avoiding the emission of one tCO2. In order to quantify the REDD+ abatement costs it is necessary quantify all REDD+ cost elements on the project, jurisdictional or national level (Worksheet ‘REDD+ cost’) and the net economic benefits or losses of each individual land use - called “incremental REDD+ cash flows” (Row 29-30), that are calculated automatically.
Abatement costs are then quantified by dividing REDD+ cost and the sum of incremental cash flows by the total net GHG benefits of the REDD+ activity, as presented in the formula below.
The incremental cash flows of REDD+ is the difference between the net economic cost / benefits in the Reference and the REDD+ scenario. Thereby, the economic performance of the Reference and REDD+ scenario of each land use is compared and then aggregated to the geographical scale as filled out in the land use change matrices. For the annual area changes the tool assumes a linear land use change over the entire assessment period. For example if the land use change between the start and end of assessment period (20 year) is 30,000 ha, the tool assumes an annual land use change of 1,500 ha as a basis for the quantification of the incremental cash flows. For example if the annual cash flows of the primary natural forest (non-exploited) is USD 10 per year in the Reference Scenario and in the REDD+ scenario, on a per ha basis the cash flow is equal to USD 0 per year. However, if primary natural forest is converted annually by 1,500 ha in the Reference scenario and by 1,000 ha in the REDD+ scenario, the REDD+ scenario will have incremental cash flows of USD 5,000 per year [(1,500 - 1,000 ha) x USD 10 per year = USD 5,000 year].
The summary worksheet “REDD+ abatement costs” (Figure 21) illustrates the cost and benefits and the GHG emissions (tCO2) in the Reference and in the REDD+ scenario. In the abatement costs table the total GHG emission reductions (tCO2), the total incremental cashflows and the total REDD implementation, transaction and institutional costs are presented. Based on these input values the REDD+ abatement costs are calculated. Thereby positive values indicate the costs of avoiding / reducing the emission of one tCO2, while negative values indicate net benefits resulting from avoiding / reducing the emission of one tCO2.

User Manual REDD+ cost elements assessment tool UNIQUE 28
Figure 20: REDD+ abatement costs - Worksheet “REDD+ abatement cost”
7 References
Pagiola S, Bosquet B: Estimating the costs of REDD at the country level. Munich Personal RePEc Archive (MPRA) 2009, 18062:1-22.
World Bank (2011): Estimating the Opportunity Costs of REDD+: A training manual. Version 1.3. The World Bank, Washington. Available at: http://wbi.worldbank.org/wbi/Data/wbi/wbicms/files/drupalacquia/wbi/OppCostsREDD+man-ual.pdf

![WEE TOOL Gender Analysis · 2018. 2. 1. · 3 GENDER TOOL BOX [ TOOL ] GENDER ANALYSIS – PRINCIPLES & ELEMENTS / MARCH 2015 KEY ELEMENTS TO CONSIDER IN GENDER ANALYSIS A gender](https://img.dokumen.tips/doc/110x75/60cc93523038d156c717d2d8/wee-tool-gender-analysis-2018-2-1-3-gender-tool-box-tool-gender-analysis.jpg)