Embed Size (px)
Citation preview

User Guide Version 3.4

<This page is intentionally left blank>

iii
Contents
Welcome ..................................................................................... 1 Visensia Overview ........................................................................... 1
Intended Use .............................................................................. 3 Safety Information ........................................................................... 3
Trademarks ..................................................................................... 4
Data Protection/ Privacy .................................................................. 4
The Visensia Display ................................................................. 5 Banner ............................................................................................. 5
Status Bar ........................................................................................ 5
Patient Information .......................................................................... 7
Drill Down Display ......................................................................... 12
Pop Up Display (Drill Down) .......................................................... 14
Corrections and Deletions ............................................................. 15
Patient Trend Indicator .................................................................. 17
Using Visensia ......................................................................... 19 Adding a Patient’s Name ............................................................... 19
Removing a Patient’s Name .......................................................... 20
Entering Vital Signs Manually ........................................................ 21
Changing the Observation Frequency ........................................... 22
Maintaining Alerts .......................................................................... 22
Warnings ....................................................................................... 25

iv
Document Reference: 011-0131-LMAN-R13
Issue Date: February 2013
Copyright © 2013 OBS Medical
Visensia® is a registered trademark of OBS Medical
Visensia is a medical device complying with the EU Council Directive 93/42/EEC concerning Medical Devices.
0120

1
Welcome
This guide contains all the information you need to operate
Visensia®. It is intended for use by trained medical personnel
and assumes prior knowledge of the operation of multi-parameter
patient monitors.
Configuration and Connectivity of Visensia is detailed in the
Installation and Configuration Guide (Part No. 011-0130-
LMAN).
Visensia Overview
Visensia software is a computerised analysis software program
designed as an accessory to standard patient monitors or
medical information systems. It operates by forming an
aggregate score of patient status based on five vital signs; heart
rate, respiratory rate, temperature, blood pressure and arterial
oxygen saturation. The aggregate score, the Visensia Index, is
displayed on a scale of 0-5, with 0 representing the normal end of
the scale and 5 representing extreme physiological deterioration.
An audible and visual alert is provided when the Visensia index
exceeds a threshold value for a period of time.
The Visensia Index is calculated whenever new data is received.
Visensia is an advanced physiological monitoring system that
monitors critical vital signs to provide early warning of patient
deterioration.
Visensia Index
The Visensia software calculates the Visensia Index based on a
non linear combination of up to five vital sign parameters: heart

2
rate, arterial oxygen saturation, respiration rate, temperature and
blood pressure. The Visensia Index works by comparing the
patient’s vital signs against a model of normality for a population
of patients from a similar environment. The Visensia Index
represents a single measure of the patient’s condition

3
Intended Use
Visensia with alert is an accessory to multi-parameter patient monitors
(bedside, ambulatory, or centralized location) or clinical information
systems and is indicated for use by health care professionals with
those non-pediatric high dependency care patients for whom multi-
parameter patient monitoring has been routine.
Visensia provides the clinician with a patient status index (Visensia
Index) based on a weighted average of five or (four) vital signs namely
heart rate, respiration rate, temperature, oxygen saturation and blood
pressure. The Visensia Index is a single measure of a patient's
condition and represents how different the patient's vital signs are with
respect to normality. Visensia is an adjunct to and is not intended to
replace vital sign monitoring.
When a Visensia alert has activated, it means that the Visensia Index
has reached and/or surpassed the default threshold and indicates that
attention should be brought to the patient.
Safety Information
Users should familiarize themselves with all warnings and
cautions before using Visensia. In addition to the following, other
warnings and cautions appear throughout this manual.
Visensia software must not be used outside of its intended use.
Visensia software is not for paediatric use.
The abnormal vital warning indicators are not intended to be
used as a primary alert mechanism. It is not a replacement for
any primary alerting systems or procedures already in place.
CAUTION: US Law restricts this software to sale on or by
the order of a physician.

4
Trademarks
Visensia® is a registered name of OBS Medical.
Data Protection/ Privacy
Clinicians and other users of the Visensia system should be
aware that, in collecting and recording patient names and data,
they are responsible for complying with all applicable data
protection and/or privacy law and regulation.
5
The Visensia Display
During normal operation the Visensia screen will display a
Visensia Index for each patient and it will update every time new
physiological data is received for that patient.
The Visensia display can be configured to show patient
information in a variety of formats. This section describes the
main elements that are found on each Visensia display.
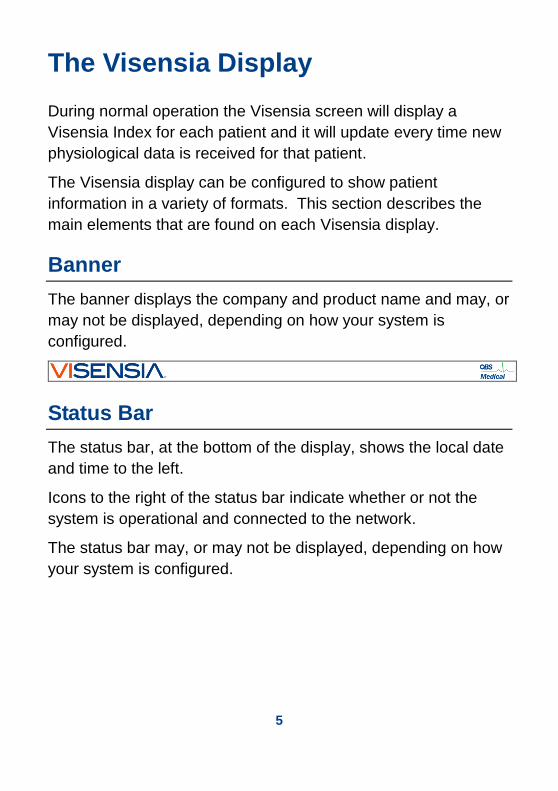
Banner
The banner displays the company and product name and may, or
may not be displayed, depending on how your system is
configured.
Status Bar
The status bar, at the bottom of the display, shows the local date
and time to the left.
Icons to the right of the status bar indicate whether or not the
system is operational and connected to the network.
The status bar may, or may not be displayed, depending on how
your system is configured.

6
The icons that display are as follows:
Network connection indicator
Indicates whether Visensia client is connected/is
not connected to the server.
Activity indicator
When this is flashing it indicates that Visensia is
operational.
Warning: If this indicator stops then it indicates a
system failure. Refer to a Clinical Engineer or IT
Specialist immediately.

7
Patient Information
Each Visensia display shows a grid of cells and each cell shows
information for a single monitored patient.
Patient Name
Index Value
Observation
Frequency
Change
Vital Signs
Display
Warning Indicators
8
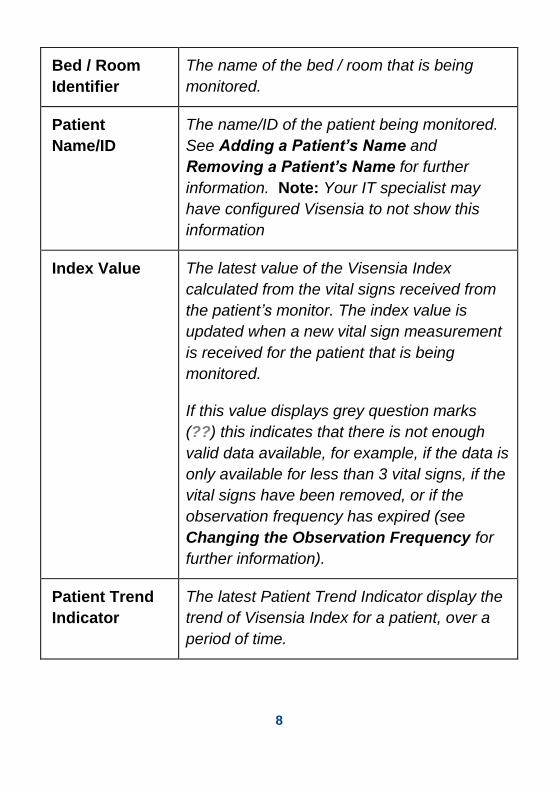
Bed / Room
Identifier
The name of the bed / room that is being
monitored.
Patient
Name/ID
The name/ID of the patient being monitored.
See Adding a Patient’s Name and
Removing a Patient’s Name for further
information. Note: Your IT specialist may
have configured Visensia to not show this
information
Index Value The latest value of the Visensia Index
calculated from the vital signs received from
the patient’s monitor. The index value is
updated when a new vital sign measurement
is received for the patient that is being
monitored.
If this value displays grey question marks
(??) this indicates that there is not enough
valid data available, for example, if the data is
only available for less than 3 vital signs, if the
vital signs have been removed, or if the
observation frequency has expired (see
Changing the Observation Frequency for
further information).
Patient Trend
Indicator
The latest Patient Trend Indicator display the
trend of Visensia Index for a patient, over a
period of time.

9
Index
timestamp
The time the latest value of the Visensia
Index was calculated
Note: The time stamps shown are in 24 hour clock format only (without a date), the time is limited to the last 24 hours from the point the display is observed.
Warning
Indicators
Indicators showing any active warnings for
the bed/room being monitored. Note: Your IT
specialist is able to configure which warnings
Visensa® will display.
Vital Signs
Display
A list of current vital signs for the patient, their
values and the times at which the vital signs
were recorded.
If this value displays grey question marks
(??) this indicates that there is no valid data
available, for example, if the vital signs have
been entered, or if the observation frequency
has expired (see Changing the Observation
Frequency for further information).
Note: The time stamps shown are in 24 hour clock format only (without a date), the time is limited to the last 24 hours from the point the display is observed.
10
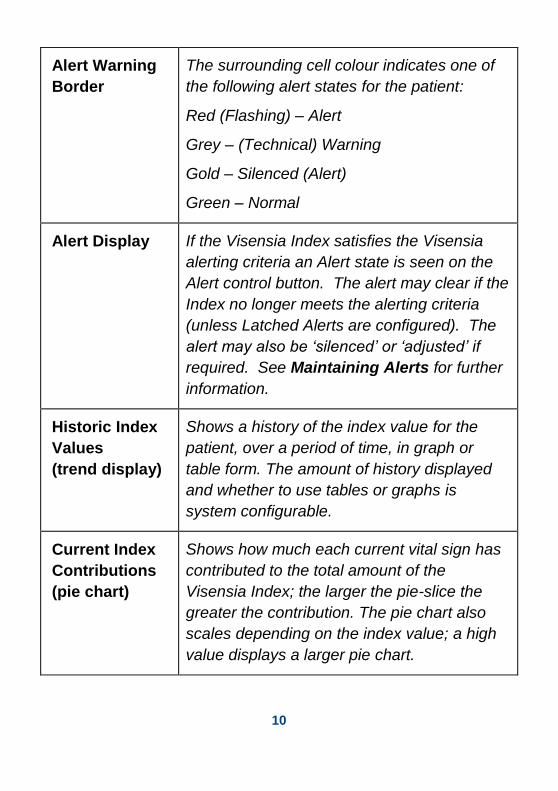
Alert Warning
Border
The surrounding cell colour indicates one of
the following alert states for the patient:
Red (Flashing) – Alert
Grey – (Technical) Warning
Gold – Silenced (Alert)
Green – Normal
Alert Display If the Visensia Index satisfies the Visensia
alerting criteria an Alert state is seen on the
Alert control button. The alert may clear if the
Index no longer meets the alerting criteria
(unless Latched Alerts are configured). The
alert may also be ‘silenced’ or ‘adjusted’ if
required. See Maintaining Alerts for further
information.
Historic Index
Values
(trend display)
Shows a history of the index value for the
patient, over a period of time, in graph or
table form. The amount of history displayed
and whether to use tables or graphs is
system configurable.
Current Index
Contributions
(pie chart)
Shows how much each current vital sign has
contributed to the total amount of the
Visensia Index; the larger the pie-slice the
greater the contribution. The pie chart also
scales depending on the index value; a high
value displays a larger pie chart.

11
Observation
Frequency
Change
From here you can set the observation
frequency rate for the patient.
This is the length of time that you estimate a
patient’s reading is valid for.
See Changing the Observation Frequency
for further information.

12
Drill Down Display
The Drill Down display, and displays that are similar to this, show
the vital signs and the index value for the patient currently
selected, along with any currently active warnings.
Acuity List
The Acuity List shows the current list of patients being monitored.
The list is ordered according to the alert state and then the index
value.
You can select a patient and display their details in the Trend
Display by clicking on the patient details from the Acuity List.
Trend Display
Acuity List
Warning Indicators

13
Trend Display
The Trend Display shows the vital signs for the selected patient,
including the values for each vital sign and the time on which the
values were last recorded.
The display also shows, in graph form, a history of the patient’s
index value and a history of the values for each vital sign. The
maximum time interval for the historic graphs is system
configurable. To change the maximum time interval, please see
your IT Specialist.
You can temporally change the time interval for the historic
graphs by clicking the left and right hand sides of the graphs.
Clicking to the right will decrease the time interval, clicking to the
left will increase it. The time interval will automatically reset after
10 minutes of no interaction has elapsed. Clicking in the centre
of the graph will reset the time interval to its default value.
Note: The time interval of all graphs will change, not just the graph you are clicking on
Click to
decrease time
interval
Click to
increase
time
interval
Click here to reset the
time interval to default
14
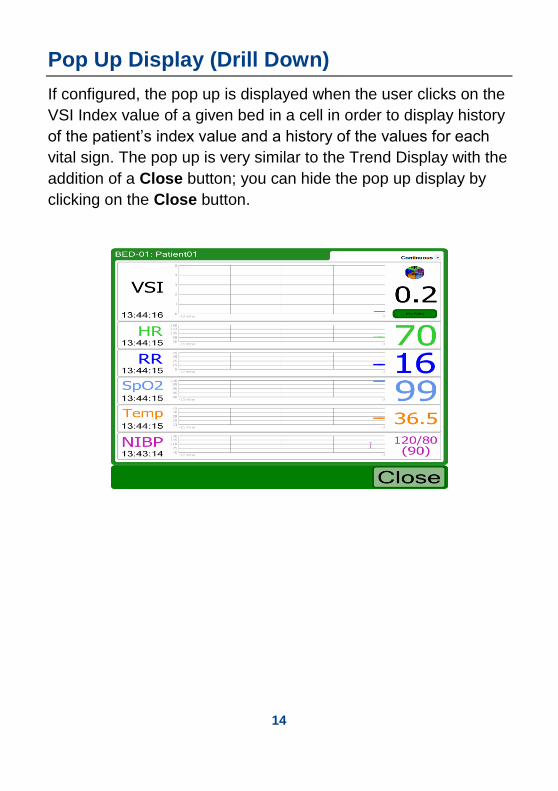
Pop Up Display (Drill Down)
If configured, the pop up is displayed when the user clicks on the
VSI Index value of a given bed in a cell in order to display history
of the patient’s index value and a history of the values for each
vital sign. The pop up is very similar to the Trend Display with the
addition of a Close button; you can hide the pop up display by
clicking on the Close button.

15
Corrections and Deletions
If configured, Visensia displays can show corrections and
deletions that are made to the vital signs and the calculated VSI
index.
Both Corrections and Deletions result in deleting a previous
value, the deletion is visible on those screens that show historical
data such as the trend graphs and the history table.
Trend Graphs with Corrections:
Correction of HR
causes a correction
of the VSI. The
corrected (old)
values are shown
with a red circled
around them.

16
Trend Graphs with Deletions:
History Table with Corrections:
History Table with Deletion:
Deletion of HR, RR,
Temp and BP results
in no VSI being able
to be calculated.
The correction to a vital
sign caused a correction
to the VSI Index. This
corrected (old) value is
shown with a strike
through.
The deletion to a vital
sign caused a deletion
to the VSI Index. The
deleted value is shown
with a strike through.

17
Patient Trend Indicator
Patient Trend Indicator indicates improvement or deterioration in
the Visensia Index trend for a Patient over a period of time. The
red arrow indicates deterioration, while green arrow means
improvement. The height of the arrow indicates the amount of
improvement or deterioration. A horizontal grey arrow means no
change. Following figures illustrates the three states mentioned
above.
Deterioration
Improvement

18
No Change

19
Using Visensia
You can interact with the main Visensia display by clicking on
various areas of the patient information cells.
Note: The following data entry screens will timeout after 10 minutes and the main display will be shown so that any alerts can be seen.
Adding a Patient’s Name
A patient’s name can be added to identify the bed / room being
monitored, if required.
Note: You will only be able to add a patient’s name if your system has been configured to enable you to do so.
1. Click on the name of the bed / room for which you want to enter a patient’s name.
2. Type in the patient’s name or select from a Patient List (depending on Display Configuration).
3. Click the OK button.

20
Removing a Patient’s Name
If a patient has been discharged, you can remove their name
from the bed / room being monitored.
Note: You will only be able to remove a patient’s name if your system has been configured to enable you to do so.
1. Click on the name of the bed / room for which you want to remove a patient’s name.
2. Click the CLEAR button or select “<Remove Current Patient>” from Patient List (depending on Display Configuration).
3. Click the OK button.

21
Entering Vital Signs Manually
Vital signs - heart rate, respiratory rate, temperature, blood
pressure and blood oxygen – can be manually entered for a
patient, if configured to do so. The manual reading entered will
be overridden once a new automatic reading is received from the
patient’s monitoring system.
Note: You will only be able to enter a patient’s vital signs manually if your system has been configured to enable you to do so.
1. Click on the vital sign for which you want to enter details manually. For example, click the HR vital sign to manually enter the Heart/Pulse Rate details for a patient.
2. Type in the value for the vital sign.
3. Click the OK button.

22
Changing the Observation Frequency
You can manually set the period for which the last set of
recorded vital signs to remain valid (and displayed) in the system,
if required.
Note: The frequency selections available will depend on how your system has been configured.
1. Click on the down arrow to the right of the Observation Frequency Change field.
2. Select the frequency option you require from the drop down list.
Maintaining Alerts
Visensia displays an alert for a patient when the index value for
that patient meets, and/or, exceeds the criteria for alerting. If the
vital signs for the patient change and the index value falls to
below the alerting criteria, the patient automatically comes off
alert (unless your system has been configured to display Latched
Alerts).
The alerting criteria can be manually adjusted, if required, but for
only a set period of time or silenced (disabled) for a period of
time.
Note: A patient with an Alert requires immediate attention.
Note: The last alert state is maintained when the index goes to grey question marks (??). Only a patient reset or a new index can change this alert state.

23
Alerts are distinguished in two ways:
The border to the patient information cell displays in a colour
that reflects an alert state, as follows:
Red (Flashing) – Alert
Grey – Warning (a warning will display when there is an error to the patient’s data feed)
Gold – Silenced (Alert)
Green – Normal
An alert control button. The button displays as:
A red Alert button when there is a non-silenced alert.
A gold Silenced button when the alert is silenced for a period of time.
A green No Alert button when there’s VSI available and its neither alerting or silenced.
A green Adjusted button when there’s VSI available and the alerting threshold has been adjusted.
Silencing/Modifying an Alert
To silence or adjust an alert:
1. Click the Alert control button.

24
The Alert Options screen displays.
2. You can either:
Set the time interval for the Silence Alert, i.e. the time period after which the Alert will be re-instated, by clicking on either the Prev or the Next button until the time interval you require displays. The Prev or Next buttons will not display if the minimum or maximum time intervals have been reached.
or:
Set the alert index value and the time interval for the Alert adjustment. Until the time period has elapsed and alert will only be generated when the new Alert level has been reached.
Select the alert value by clicking on either the Prev or the Next button until the alert value you require displays. The Prev or Next buttons will not display if the minimum or maximum alert values have been reached.
25
Select the time interval by clicking on either the Prev or the Next button until the time interval you require displays. The Prev and Next buttons will not display if the minimum or maximum time intervals have been reached.
3. Click the Silence or Adjust button when you have selected the required silence alerting criteria.
Warnings
Visensia can be configured to display warnings when vital signs
fall outside of configured thresholds, or when a vital sign is
missing from the patient’s feed or generating some kind of “status
message”. These warnings are indicated on the display by either
a visual icon or text indicator.
Note: Which warnings are shown is configurable by your IT specialist.
Note: The abnormal vital warning indicators are not intended to be used as a primary alert mechanism. It is not a replacement for any primary alerting systems or procedures already in place.

26
UK Head Office
174 Milton Park, Abingdon OX14 4SE, UK
011-0131-LMAN-R13
February 2013