Embed Size (px)
Citation preview

User Experience Strategy
Design
Implement Deploy
Analyse
by Anton Saputro - @antonps
➔ Meet with key stakeholders to align business and branding
➔ Assemble multidisciplinary team of experts
➔ Conduct field studies➔ Create user personas➔ Define user stories➔ Look at competitive products➔ Draft project plan by balancing
resources and business goals➔ Document user scenarios and
performance requirements
Analyse
Business and Market Understanding
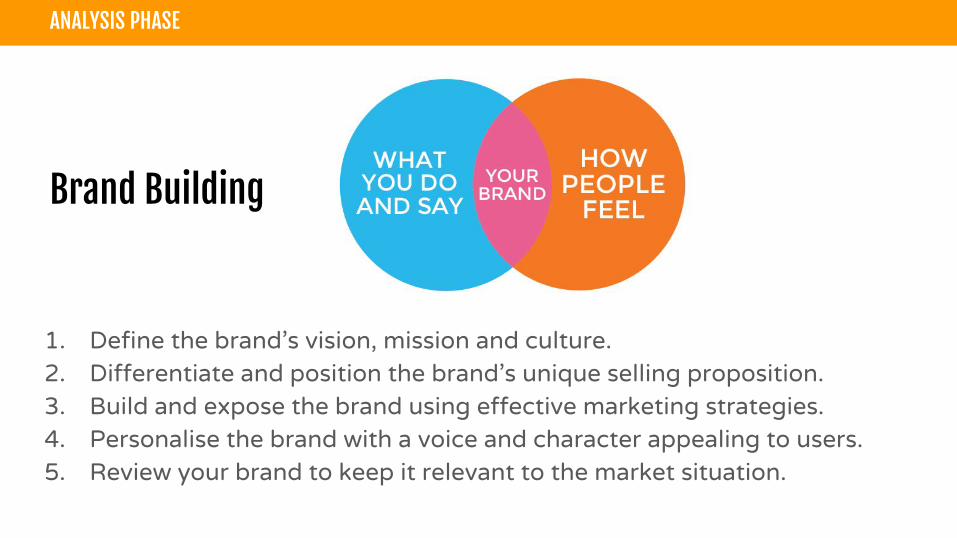
Brand Building
1. Define the brand’s vision, mission and culture. 2. Differentiate and position the brand’s unique selling proposition. 3. Build and expose the brand using effective marketing strategies.4. Personalise the brand with a voice and character appealing to users.5. Review your brand to keep it relevant to the market situation.
ANALYSIS PHASE
ANALYSIS PHASE
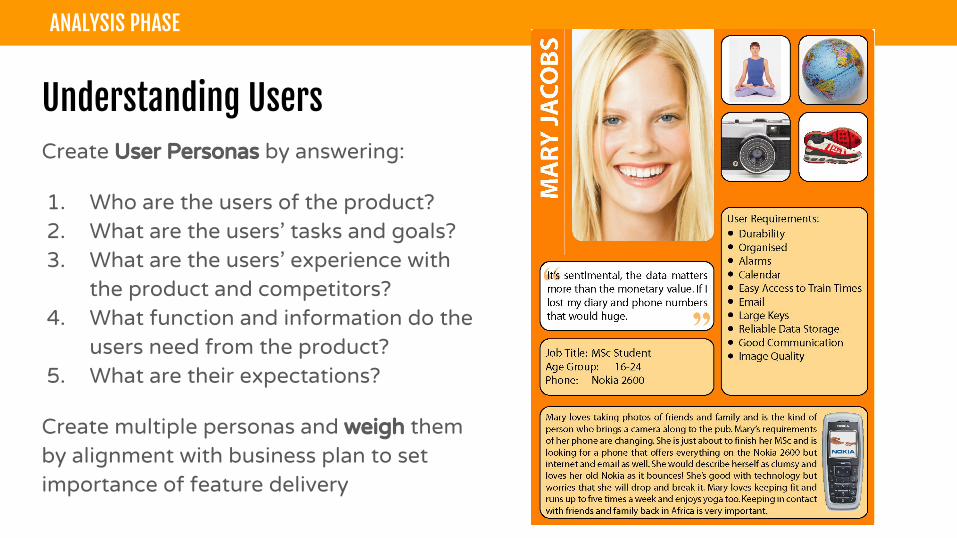
Understanding UsersCreate User Personas by answering:
1. Who are the users of the product?2. What are the users' tasks and goals?3. What are the users' experience with
the product and competitors?4. What function and information do the
users need from the product?5. What are their expectations?
Create multiple personas and weigh them by alignment with business plan to set importance of feature delivery
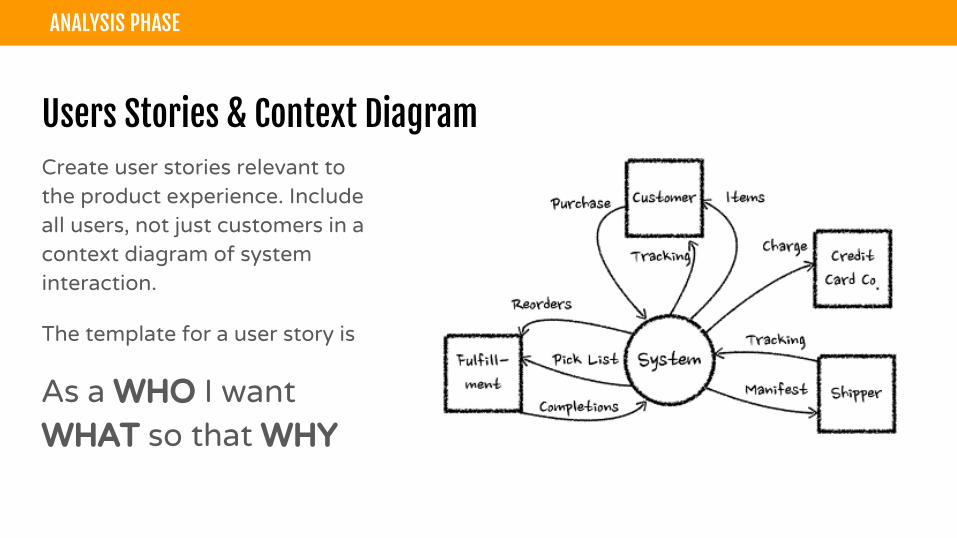
Users Stories & Context DiagramCreate user stories relevant to the product experience. Include all users, not just customers in a context diagram of system interaction.
The template for a user story is
As a WHO I want WHAT so that WHY
ANALYSIS PHASE
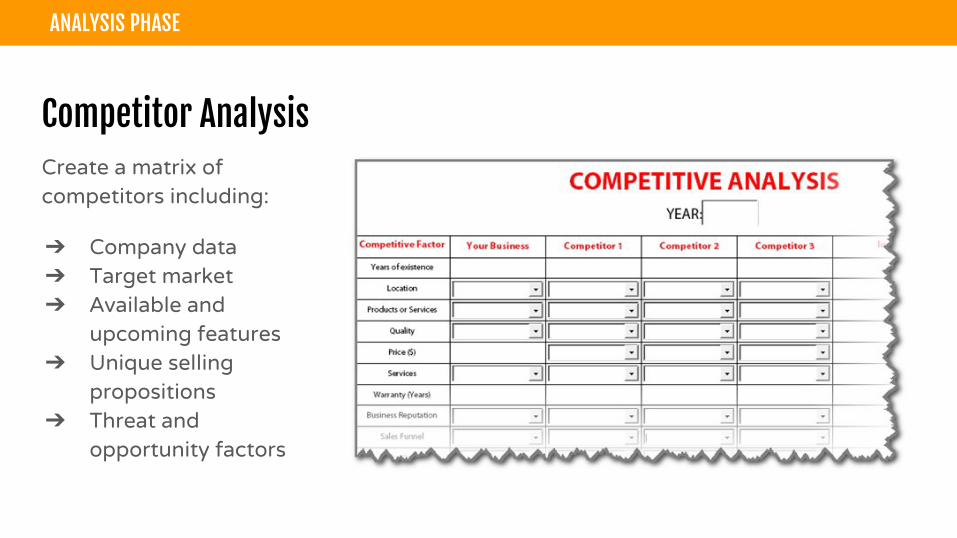
Competitor AnalysisCreate a matrix of competitors including:
➔ Company data ➔ Target market➔ Available and
upcoming features➔ Unique selling
propositions➔ Threat and
opportunity factors
ANALYSIS PHASE
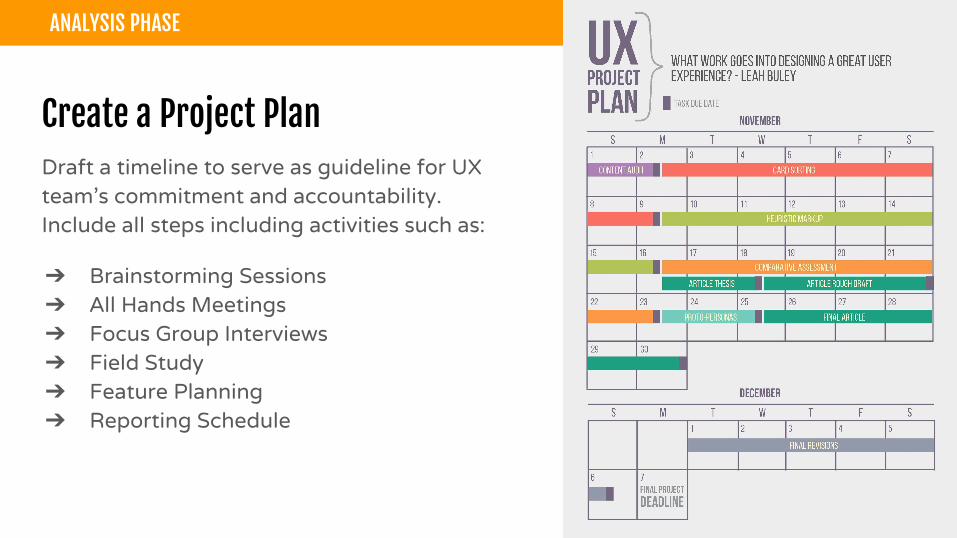
Create a Project PlanDraft a timeline to serve as guideline for UX team’s commitment and accountability. Include all steps including activities such as:
➔ Brainstorming Sessions➔ All Hands Meetings➔ Focus Group Interviews➔ Field Study➔ Feature Planning➔ Reporting Schedule
ANALYSIS PHASE

➔ Brainstorm design concepts➔ Develop screen flow and
navigation models➔ Create low fidelity prototypes to
be validated quickly➔ Repeat usability testing with
high fidelity prototypes➔ Document standards and
guidelines of operations➔ Create design specification and
style guide for branding
Design
Prototyping and Usability Testing
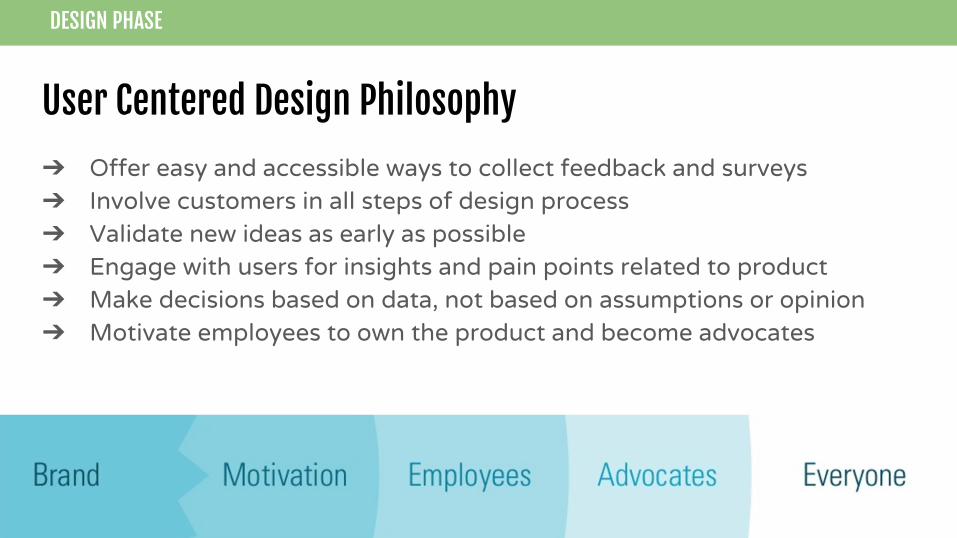
User Centered Design Philosophy
➔ Offer easy and accessible ways to collect feedback and surveys➔ Involve customers in all steps of design process➔ Validate new ideas as early as possible➔ Engage with users for insights and pain points related to product➔ Make decisions based on data, not based on assumptions or opinion➔ Motivate employees to own the product and become advocates
DESIGN PHASE

Brainstorming Sessions
➔ Post Up Participants write down ideas and concepts related to the topic marked either as Fact, Opinion, or Guess, and then present to discuss.
➔ Card SortingGain insight for category and navigation items. Write down individual items and have participants arrange them in logical groupings.
➔ Feature RankingList down ideas and have each participant assign a score of 1-10 to each idea and add up the numbers.
DESIGN PHASE

Low Fidelity Prototypes
Quick sketches of UI elements required for product features. Elements can be mixed and matched to create layouts of possible screens. Achieved using tools such as:
➔ Pen & paper➔ Balsamiq
DESIGN PHASE
DESIGN PHASE
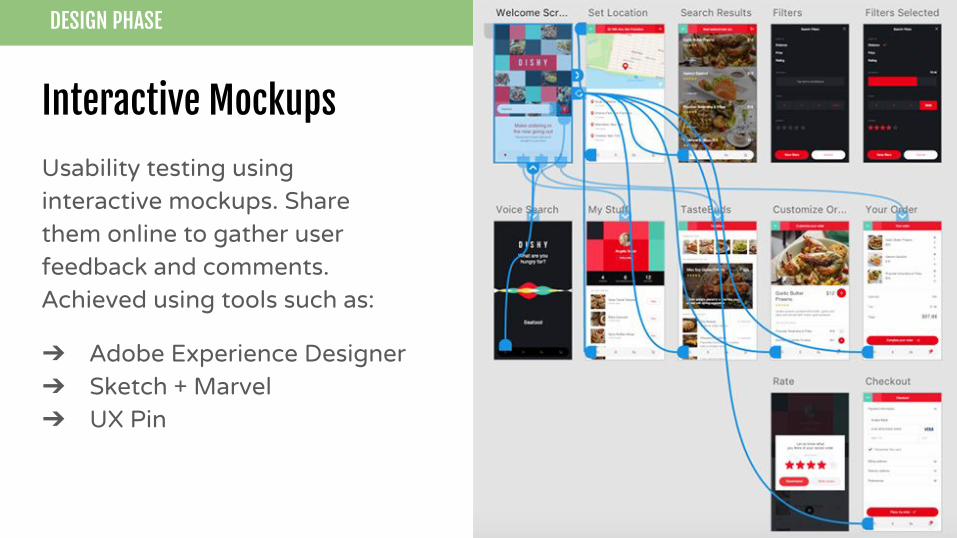
Interactive Mockups
Usability testing using interactive mockups. Share them online to gather user feedback and comments. Achieved using tools such as:
➔ Adobe Experience Designer➔ Sketch + Marvel➔ UX Pin
DESIGN PHASE
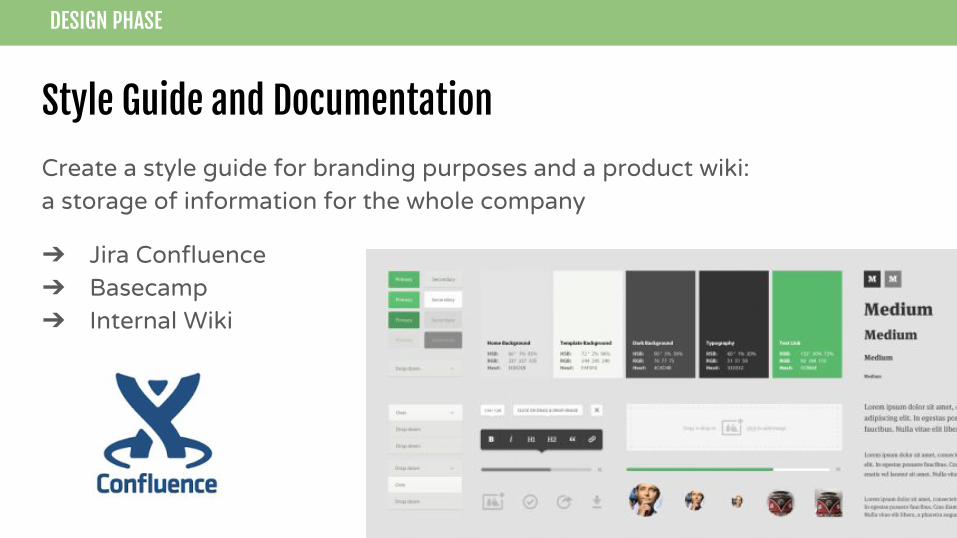
Style Guide and Documentation
Create a style guide for branding purposes and a product wiki: a storage of information for the whole company
➔ Jira Confluence➔ Basecamp➔ Internal Wiki
➔ Work closely with delivery team to implement design
➔ Setup and test all events, properties, goals and funnels
➔ Optimize technical performance➔ Do ongoing heuristic evaluations
Implement
Tracking Data in Staging Environment

Capturing and Measuring Data
- Pageviews- Conversions- Time on page- Task attempts- Task completions- Time to task completion- Error occurrence- Element visibility- Media queries- Social sharing
- Visit Frequency- Dates and Times of Visits- Purchase quantity- Purchase amount- Purchase frequency- Search keywords- Viewed products- Viewed categories- Viewed brands
And many more...
IMPLEMENTATION PHASE
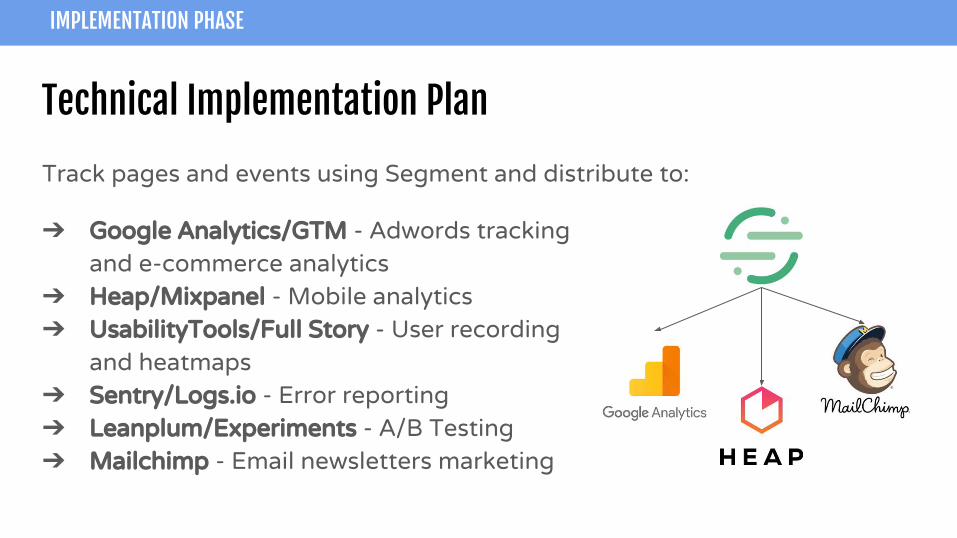
Technical Implementation Plan
➔ Google Analytics/GTM - Adwords tracking and e-commerce analytics
➔ Heap/Mixpanel - Mobile analytics➔ UsabilityTools/Full Story - User recording
and heatmaps➔ Sentry/Logs.io - Error reporting➔ Leanplum/Experiments - A/B Testing➔ Mailchimp - Email newsletters marketing
IMPLEMENTATION PHASE
Track pages and events using Segment and distribute to:
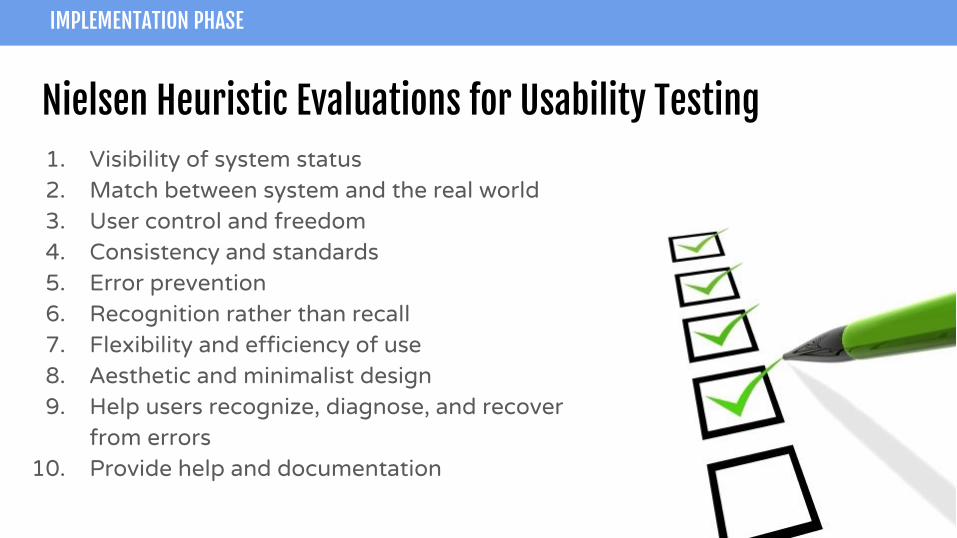
Nielsen Heuristic Evaluations for Usability Testing1. Visibility of system status2. Match between system and the real world3. User control and freedom4. Consistency and standards5. Error prevention6. Recognition rather than recall7. Flexibility and efficiency of use8. Aesthetic and minimalist design9. Help users recognize, diagnose, and recover
from errors10. Provide help and documentation
IMPLEMENTATION PHASE
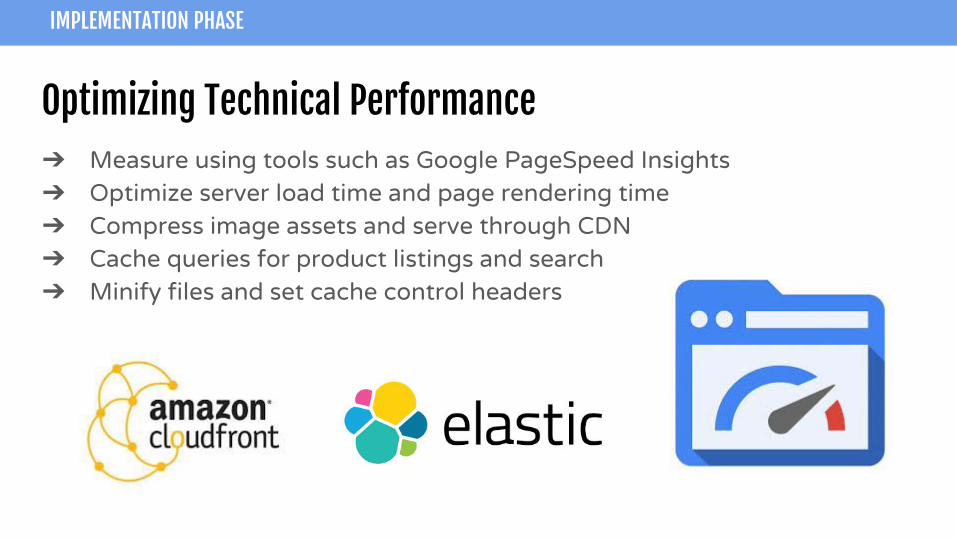
Optimizing Technical Performance➔ Measure using tools such as Google PageSpeed Insights➔ Optimize server load time and page rendering time➔ Compress image assets and serve through CDN➔ Cache queries for product listings and search➔ Minify files and set cache control headers
IMPLEMENTATION PHASE
➔ Monitor all tracking events, goals, and conversions
➔ Conduct field studies on all aspects of user experience journey
➔ Weekly reporting of Key Performance Indicators
➔ Get qualitative data from user surveys and engagement
➔ Ongoing process involving all previous phases to improve UX
Deploy
Monitor Conversions and Feedback
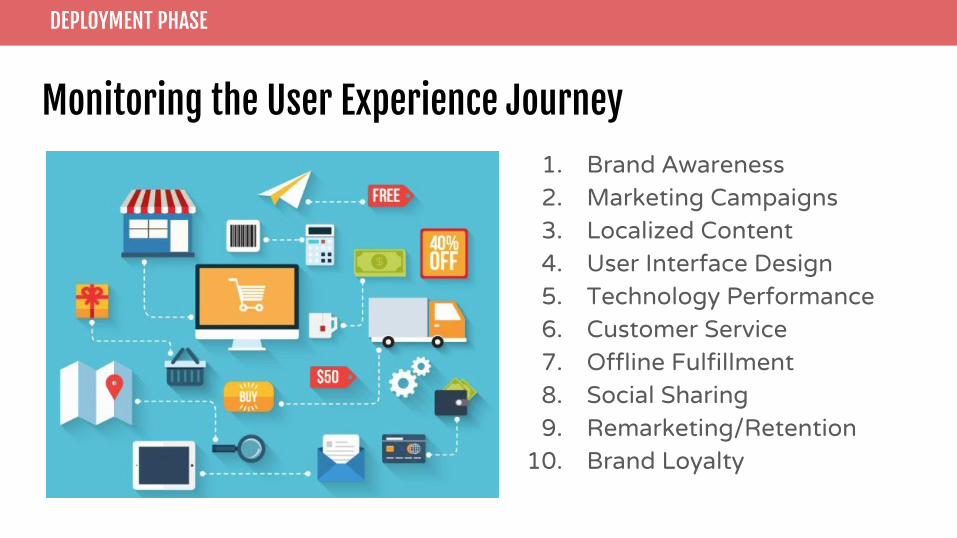
Monitoring the User Experience Journey
1. Brand Awareness2. Marketing Campaigns3. Localized Content4. User Interface Design5. Technology Performance 6. Customer Service7. Offline Fulfillment8. Social Sharing9. Remarketing/Retention
10. Brand Loyalty
DEPLOYMENT PHASE
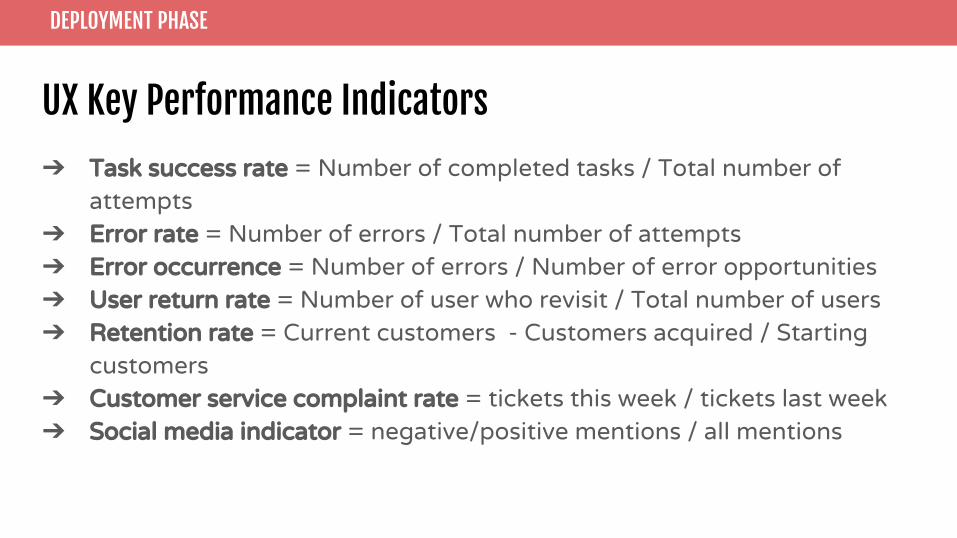
UX Key Performance Indicators
➔ Task success rate = Number of completed tasks / Total number of attempts
➔ Error rate = Number of errors / Total number of attempts➔ Error occurrence = Number of errors / Number of error opportunities➔ User return rate = Number of user who revisit / Total number of users➔ Retention rate = Current customers - Customers acquired / Starting
customers➔ Customer service complaint rate = tickets this week / tickets last week➔ Social media indicator = negative/positive mentions / all mentions
DEPLOYMENT PHASE

Weekly UX Reports
➔ Google Analytics custom dashboards - Audience, Acquisitions, Behaviour, and Conversions report
➔ Key Performance Indicator reports Quantitative data calculations
➔ User satisfaction index (qualitative analysis) - From customer service tickets, app reviews, social media comments, etc.
DEPLOYMENT PHASE

User Experience Ongoing Process
➔ Learn from new data and grow➔ Adapt to market and business changes➔ Keep up with the latest technology to improve UX➔ Constantly challenge product with critical thinking
DEPLOYMENT PHASE
Design
Implement Deploy
Analyse

Sources:
➔ http://www.mprove.de/script/00/upa/_media/upaposter_85x11.p ➔ https://blog.prototypr.io/10-usability-heuristics-with-examples-4a81ada920c➔ http://www.slideshare.net/folletto/design-with-personas-a-lean-approach➔ http://blog.abovethefolddesign.com/2010/11/11/5-powerful-ways-to-brainstorming
THANKS FOR READING
User Experience Strategyantonps.com - @antonps


![[REPORT DATA] Experience Strategy: Connecting Customer Experience to Business Strategy](https://img.dokumen.tips/doc/110x75/5a6485427f8b9a27568b5881/report-data-experience-strategy-connecting-customer-experience-to-business.jpg)

