Embed Size (px)
Citation preview

USER-CENTRIC SERVICE MODEL IN WIRELESS NETWORKS
The transition from technical excellence to customer experience excellence
Presented by Jan Holub for Workshop on Selected Items on Telecommunication
Quality Matters , Wien, 27- 28 November 2012 © ETSI 2012. All rights reserved
Outlines
What is customer experience (CX) ?
Where is the Business Case (RoI) ?
2 © ETSI 2012. All rights reserved
What is a Customer Experience ?
The sum of all experiences a customer has with a supplier of
goods or services, over the duration of their relationship with
that supplier. From awareness, discovery, attraction, interaction,
purchase, use, cultivation and advocacy (wiki)
3 © ETSI 2012. All rights reserved
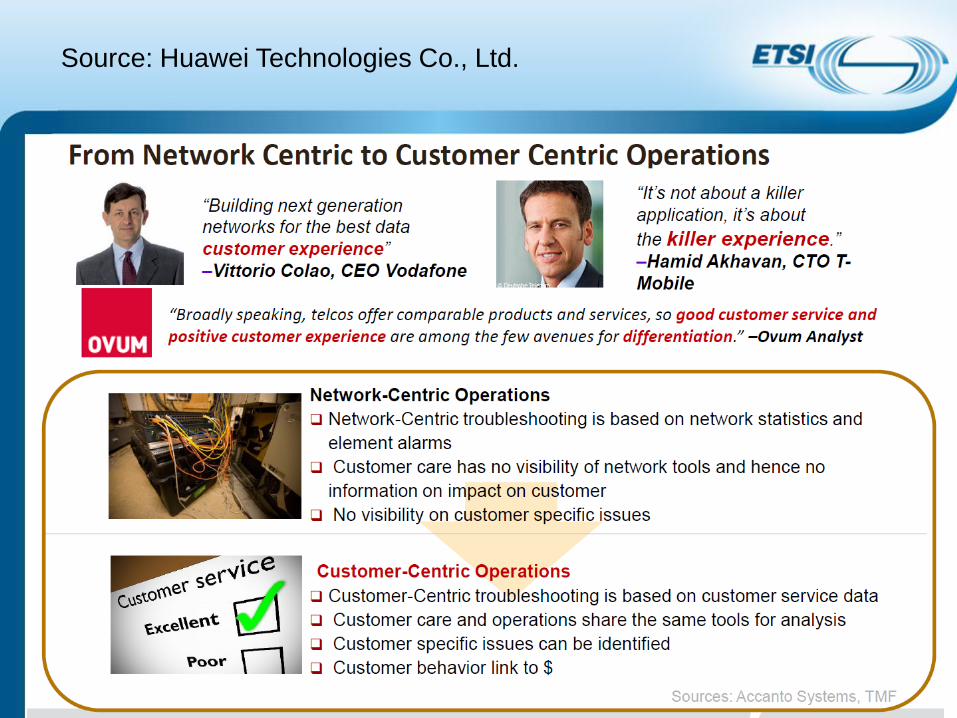
What is Customer Experience Management?
The goal of customer experience management (CEM) is to move customers from satisfied to loyal and then from loyal to advocate. CEM is a strategy that focuses the operations and processes of a business around the needs of the individual customer (wiki)
(compare to traditional Customer Relationship Management (CRM). CRM strategies and solutions are designed to focus on product, price and enterprise process, with minimal or no focus on customer need and desire. The result is a sharp mismatch between the organisation’s approach to customer expectations and what customers actually want, resulting in the failure of many CRM implementations. CRM is enterprise-focused and designed to manage customers for maximum efficiency)
© ETSI 2012. All rights reserved 4
Source: Huawei Technologies Co., Ltd.

Source: Huawei Technologies Co., Ltd.

Source: Huawei Technologies Co., Ltd.
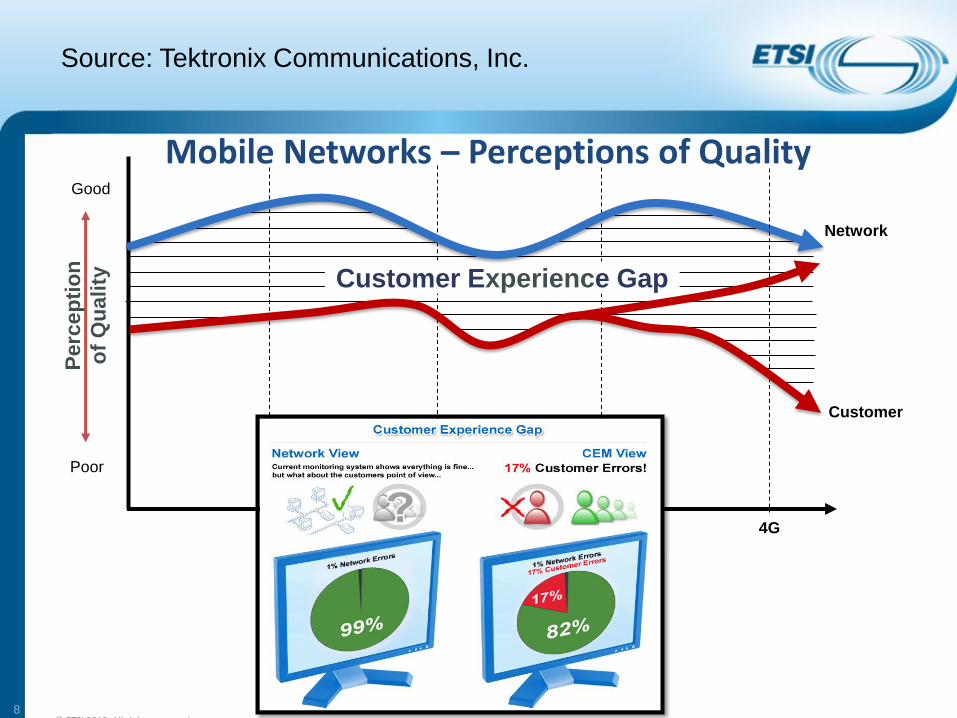
Mobile Networks – Perceptions of Quality
© ETSI 2012. All rights reserved 8
2G 2.5G 3G
Customer Experience Gap
Good
Poor
Network
Customer
Perc
ep
tio
n
of
Qu
ality
4G
Time and Technology progression
Source: Tektronix Communications, Inc.

Speech Transmisison Quality
Perceived connection quality is influenced by many transmission impairments (delay, echo, various kinds of noise, speech (de)coding distortions and artifacts, temporal and amplitude clipping, ...), assessed and measured in MOS (Mean Opinion Score)
• 5 Excellent
• 4 Good
• 3 Fair
• 2 Poor
• 1 Bad
Listening / Conversational Tests (ITU-T P.800)
Intrusive Algorithmic Methods (P.862 PESQ, P.863 POLQA)
• dedicated test call must be established
Suitable for per-call analysis by CEM system:
Non-intrusive Algorithmic Methods (P.563 3SQM)
• real voice samples acquired on real connections are processed (cons: computationally demanding)
Estimation Algorithmic Methods - jitter, delay, packet loss etc. mapped to MOS (P.564, E-model) – fast but inaccurate
© ETSI 2012. All rights reserved 9
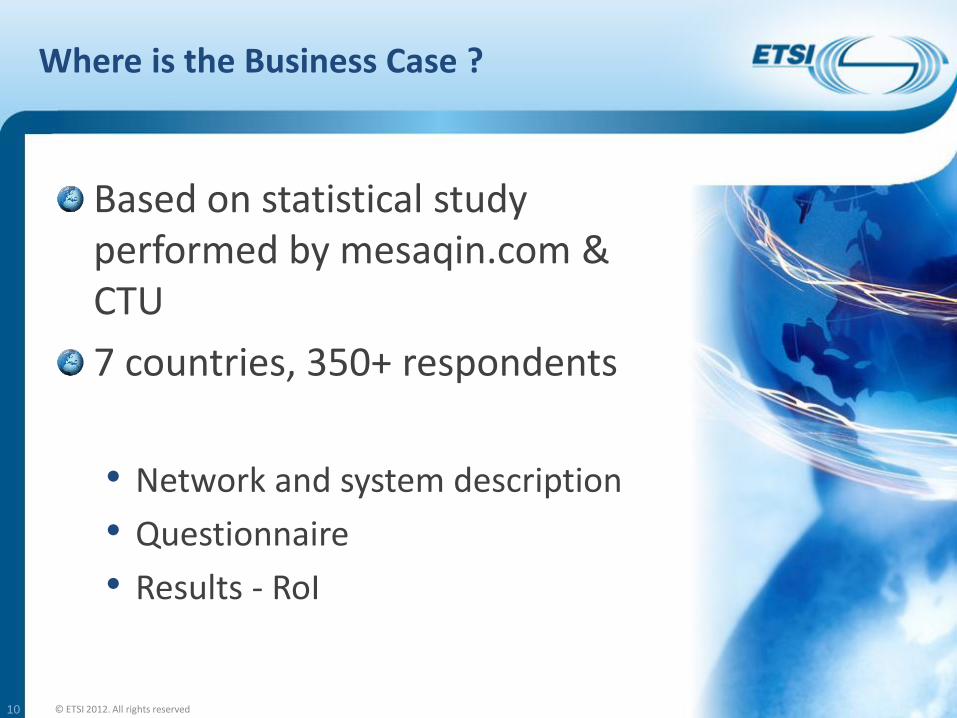
Where is the Business Case ?
Based on statistical study performed by mesaqin.com & CTU
7 countries, 350+ respondents
• Network and system description
• Questionnaire
• Results - RoI
10 © ETSI 2012. All rights reserved

Operator size
Small size operator
Number of subscribers 1 000 000
Sites number – MSCs/RNCs 3
Number of calls per day 10 000 000
Middle size operator
Number of subscribers 10 000 000
Sites number – MSCs/RNCs 10
Number of calls per day 100 000 000
Large size operator
Number of subscribers 40 000 000
Sites number – MSCs/RNCs 25
Number of calls per day 400 000 000
© ETSI 2012. All rights reserved 11
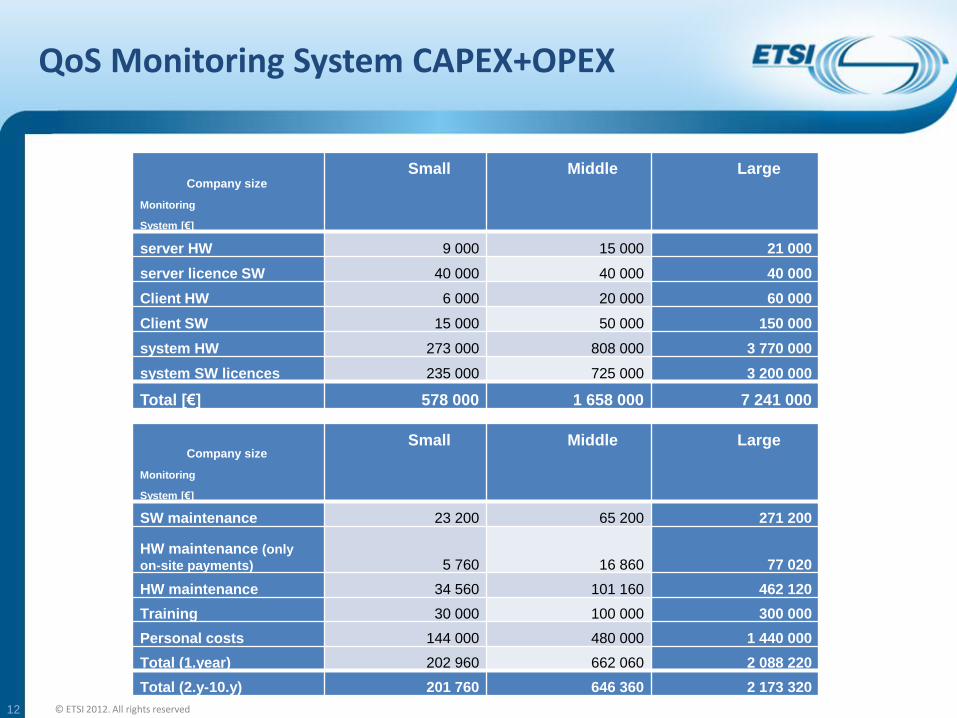
QoS Monitoring System CAPEX+OPEX
© ETSI 2012. All rights reserved 12
Company size
Monitoring
System [€]
Small Middle Large
server HW 9 000 15 000 21 000
server licence SW 40 000 40 000 40 000
Client HW 6 000 20 000 60 000
Client SW 15 000 50 000 150 000
system HW 273 000 808 000 3 770 000
system SW licences 235 000 725 000 3 200 000
Total [€] 578 000 1 658 000 7 241 000
Company size
Monitoring
System [€]
Small Middle Large
SW maintenance 23 200 65 200 271 200
HW maintenance (only
on-site payments) 5 760 16 860 77 020
HW maintenance 34 560 101 160 462 120
Training 30 000 100 000 300 000
Personal costs 144 000 480 000 1 440 000
Total (1.year) 202 960 662 060 2 088 220
Total (2.y-10.y) 201 760 646 360 2 173 320
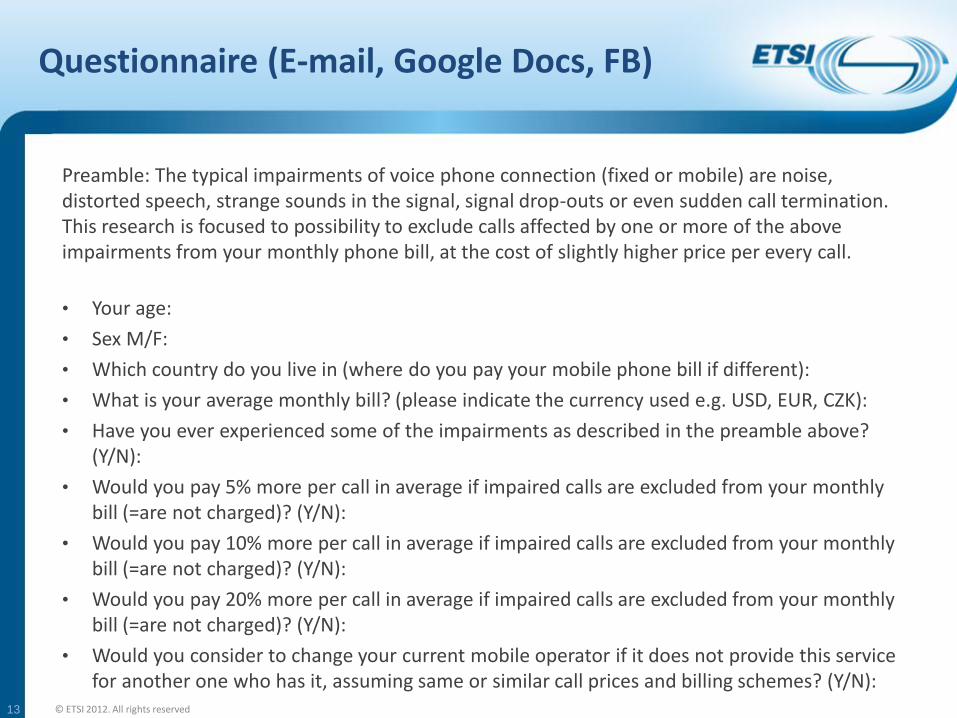
Questionnaire (E-mail, Google Docs, FB)
Preamble: The typical impairments of voice phone connection (fixed or mobile) are noise, distorted speech, strange sounds in the signal, signal drop-outs or even sudden call termination. This research is focused to possibility to exclude calls affected by one or more of the above impairments from your monthly phone bill, at the cost of slightly higher price per every call.
• Your age:
• Sex M/F:
• Which country do you live in (where do you pay your mobile phone bill if different):
• What is your average monthly bill? (please indicate the currency used e.g. USD, EUR, CZK):
• Have you ever experienced some of the impairments as described in the preamble above? (Y/N):
• Would you pay 5% more per call in average if impaired calls are excluded from your monthly bill (=are not charged)? (Y/N):
• Would you pay 10% more per call in average if impaired calls are excluded from your monthly bill (=are not charged)? (Y/N):
• Would you pay 20% more per call in average if impaired calls are excluded from your monthly bill (=are not charged)? (Y/N):
• Would you consider to change your current mobile operator if it does not provide this service for another one who has it, assuming same or similar call prices and billing schemes? (Y/N):
13 © ETSI 2012. All rights reserved
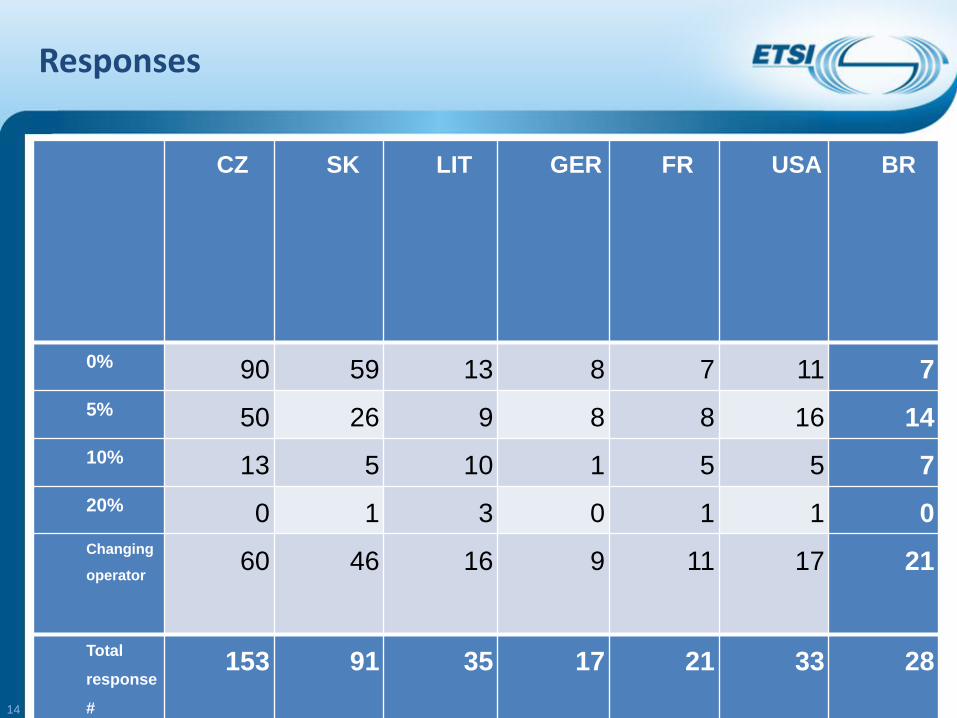
Responses
© ETSI 2012. All rights reserved 14
CZ SK LIT GER FR USA BR
0% 90 59 13 8 7 11 7
5% 50 26 9 8 8 16 14
10% 13 5 10 1 5 5 7
20% 0 1 3 0 1 1 0
Changing
operator 60 46 16 9 11 17 21
Total
response
#
153 91 35 17 21 33 28
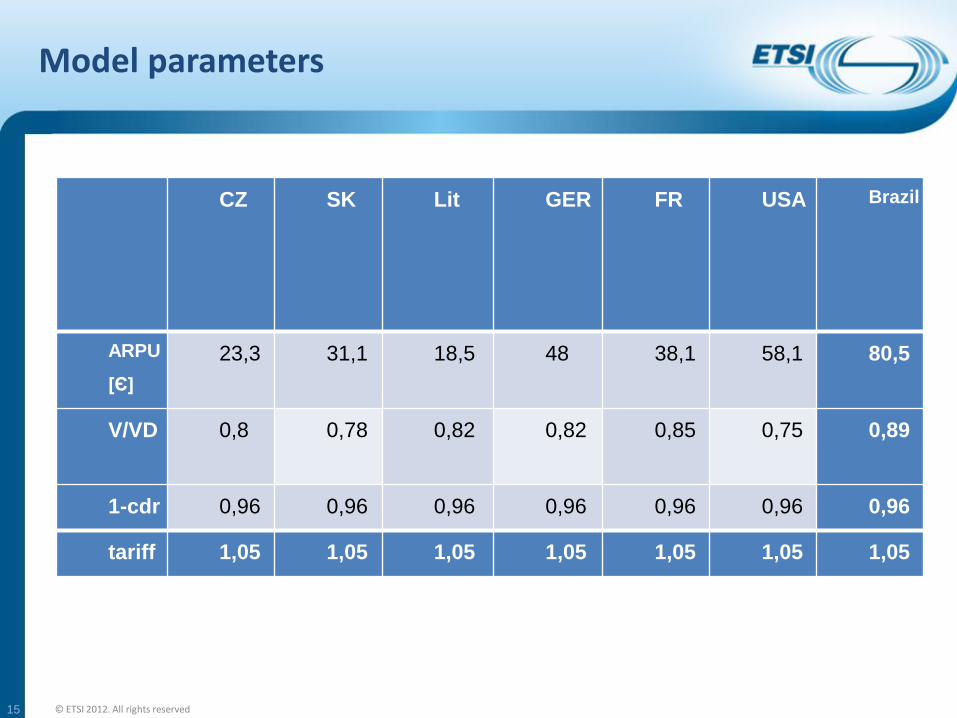
Model parameters
© ETSI 2012. All rights reserved 15
CZ SK Lit GER FR USA Brazil
ARPU
[Є]
23,3 31,1 18,5 48 38,1 58,1 80,5
V/VD 0,8 0,78 0,82 0,82 0,85 0,75 0,89
1-cdr 0,96 0,96 0,96 0,96 0,96 0,96 0,96
tariff 1,05 1,05 1,05 1,05 1,05 1,05 1,05
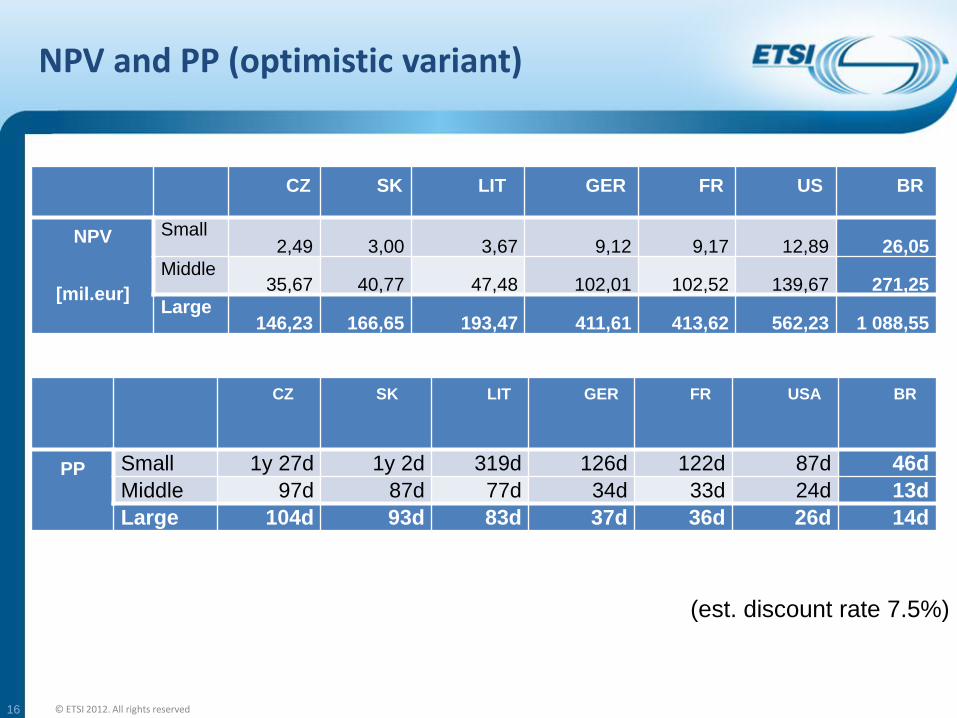
NPV and PP (optimistic variant)
© ETSI 2012. All rights reserved 16
CZ SK LIT GER FR USA BR
PP Small 1y 27d 1y 2d 319d 126d 122d 87d 46d
Middle 97d 87d 77d 34d 33d 24d 13d
Large 104d 93d 83d 37d 36d 26d 14d
CZ SK LIT GER FR US BR
NPV
[mil.eur]
Small 2,49 3,00 3,67 9,12 9,17 12,89 26,05
Middle 35,67 40,77 47,48 102,01 102,52 139,67 271,25
Large 146,23 166,65 193,47 411,61 413,62 562,23 1 088,55
(est. discount rate 7.5%)
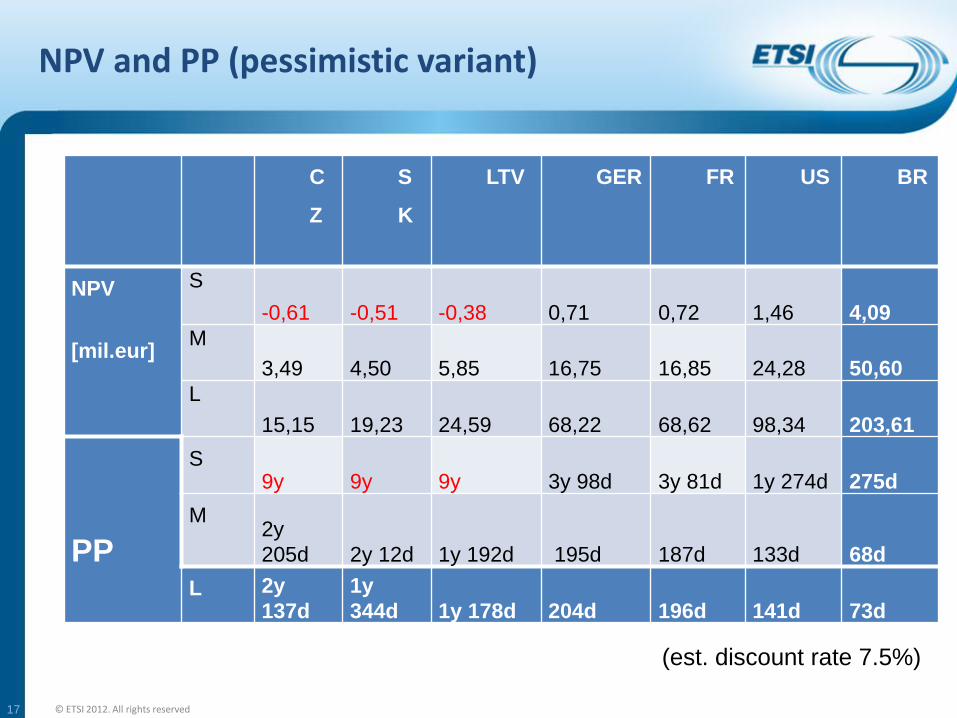
NPV and PP (pessimistic variant)
© ETSI 2012. All rights reserved 17
C
Z
S
K
LTV GER FR US BR
NPV
[mil.eur]
S
-0,61 -0,51 -0,38 0,71 0,72 1,46 4,09
M
3,49 4,50 5,85 16,75 16,85 24,28 50,60
L
15,15 19,23 24,59 68,22 68,62 98,34 203,61
PP
S 9y 9y 9y 3y 98d 3y 81d 1y 274d 275d
M 2y
205d 2y 12d 1y 192d 195d 187d 133d 68d
L 2y
137d
1y
344d 1y 178d 204d 196d 141d 73d
(est. discount rate 7.5%)
Contact Details:
Assoc. Prof. Ing Jan Holub, Ph.D.
+420 602 649 654
18
Thank you!
© ETSI 2012. All rights reserved