Embed Size (px)
Citation preview

User Manual
Ad$penderTM
INTRODUCTION
Ad$pender User 2011
i
Introduction
About Ad$penderTM
Ad$pender™ is a tool that allows you to view a top-level
summary of the multi-media advertising marketplace.
Ad$pender monitors advertising expenditures and
occurrence information for 3+ million brands across 18
media. Ad$pender is the popular choice of research, sales
and marketing professionals. Ad$pender is a fast and easy-
to-use tool that allows you to break down information by
category, parent, company, subsidiary and brand.
About Kantar Media
Kantar Media Intelligence is the leading provider of
strategic advertising intelligence to advertising agencies,
advertisers, and media properties. Utilizing highly
innovative tracking technologies, Kantar Media collects
expenditure, occurrence and creative intelligence
on millions of brands across all major media and
marketplaces. Established in 50 countries with more than
22,000 customers, Kantar Media Intelligence is part of
Kantar Media, a global leader in marketing information.
Media Coverage ■ Network TV
■ Spot TV
■ Spanish Language Network TV
■ Cable TV
■ Syndication
■ Magazines
■ Sunday Magazines
■ Local Magazines
■ Hispanic Magazines
■ B-to-B Magazines
■ National Newspapers
■ Newspapers
■ Hispanic Newspapers
■ Network Radio
■ National Spot Radio
■ Local Radio
■ US Internet
■ Outdoor
CONTENTS
Ad$pender User 2011
ii
Ad$pender User Manual
Contents
Brand Central: Kantar Media 1
Intelligence’s Product Structure
Setting Up Key Reports
Customizing Your Media Set 2
Selecting Markets 3
Selecting Time Periods 4
Report By Week 4
Customizing Your Product Set 5
Setting Up Your Report Format 6
Report Format 6
Reviewing The Report Summary 7
Measures & Calculations Explanations 8
Terms & Definitions 9
Frequently Asked Questions 11
Data Availability 12
BRAND CENTRAL
Ad$pender User 2011
1
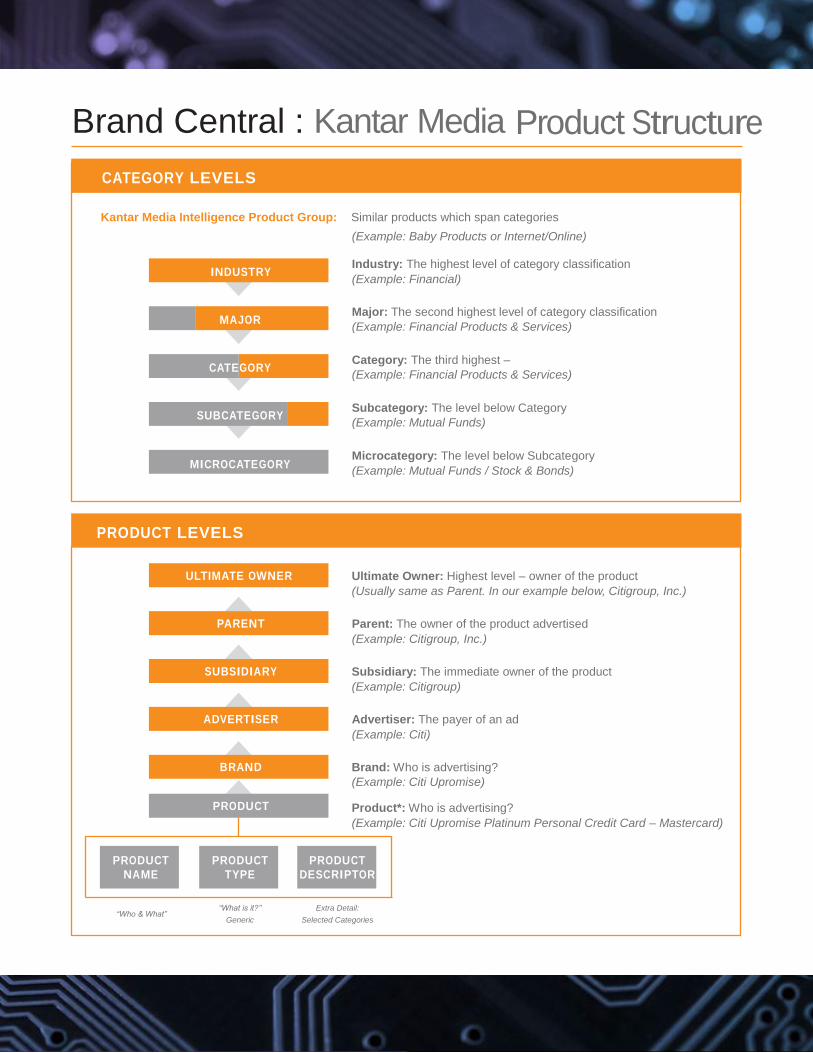
Brand Central : Kantar Media Product Structure
CATEGORY LEVELS
Kantar Media Intelligence Product Group: Similar products which span categories
(Example: Baby Products or Internet/Online)
INDUSTRY Industry: The highest level of category classification
(Example: Financial)
MAJOR
CATEGORY
SUBCATEGORY
MICROCATEGORY
Major: The second highest level of category classification
(Example: Financial Products & Services)
Category: The third highest –
(Example: Financial Products & Services)
Subcategory: The level below Category
(Example: Mutual Funds)
Microcategory: The level below Subcategory
(Example: Mutual Funds / Stock & Bonds)
PRODUCT LEVELS
ULTIMATE OWNER Ultimate Owner: Highest level – owner of the product
(Usually same as Parent. In our example below, Citigroup, Inc.)
PARENT Parent: The owner of the product advertised
(Example: Citigroup, Inc.)
SUBSIDIARY Subsidiary: The immediate owner of the product
(Example: Citigroup)
ADVERTISER Advertiser: The payer of an ad
(Example: Citi)
BRAND
PRODUCT
Brand: Who is advertising?
(Example: Citi Upromise) Product*: Who is advertising?
(Example: Citi Upromise Platinum Personal Credit Card – Mastercard)
PRODUCT
NAME
“Who & What”
PRODUCT
TYPE
“What is it?”
Generic
PRODUCT
DESCRIPTOR
Extra Detail:
Selected Categories

Ad$pender User 2011
2
Setting Up Key Reports
Customizing Your Media Set
To begin using Ad$pender, log in at http://products.KantarMediaNA.com
Your Media Set allows you to narrow down your choices of which media
to include in your report. It also allows you to create and include media groups.
1. To create a Media Group, highlight media within Selected Media box and
click on Create Group.
2. Enter Group Name and save group.
3. Click on the Market tab to proceed. (Depending on your permission level, you
may or may not have access to the Market tab).
● The default includes All Markets. If you want to run a report for all markets,
you do not need to select anything. Only make your selection to limit your report.
● Rearrange your selections on any page to appear in the order you choose.
Click the selected item and use the arrows on the right side to move up or
down in the list
Ad$pender User 2011
3
Setting Up Key Reports
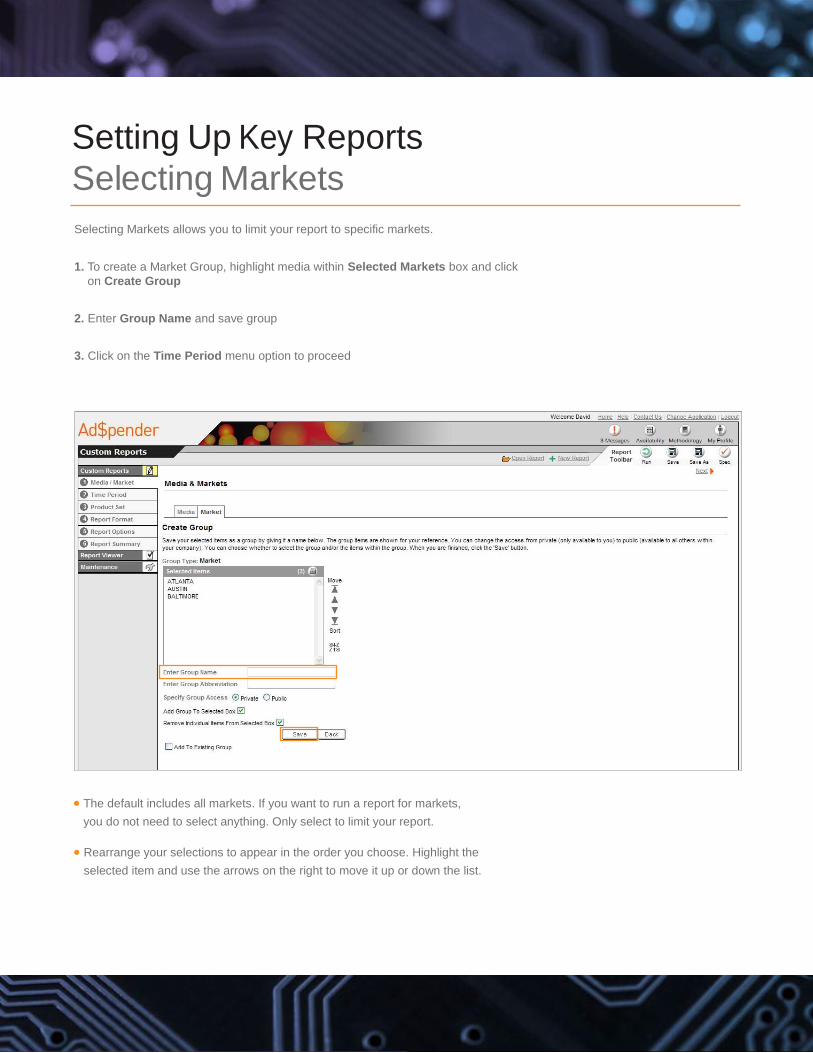
Selecting Markets
Selecting Markets allows you to limit your report to specific markets.
1. To create a Market Group, highlight media within Selected Markets box and click
on Create Group
2. Enter Group Name and save group
3. Click on the Time Period menu option to proceed
● The default includes all markets. If you want to run a report for markets,
you do not need to select anything. Only select to limit your report.
● Rearrange your selections to appear in the order you choose. Highlight the
selected item and use the arrows on the right to move it up or down the list.

Ad$pender User 2011
4
Setting Up Key Reports
Selecting Time Periods
You can add more than one type of time period in your report
to. Mix and match months, quarters, years, and more.
1. Select a single time period from the drop down menu, specify a
date range, or Select Multiple Time Periods
● Dynamic time periods will allow you to run a report where time
period will update themselves, such as Current Month,” “Current
Year to Date, and more.
● Broadcast weeks & months begin on Mondays

Ad$pender User 2011
5
Setting Up Key Reports
Selecting Time Periods (Continued)
Report by Week
1. Select Multiple Time Periods
2. Select Broadcast under the Static tab
3. Select Week from the Select Frequency drop down menu
4. Specify a week date range (optional)

Ad$pender User 2011
6
Setting Up Key Reports
Customizing Your Product Set
1. Specify a Product in the Search Box or click on the Show All
button to Show All Category Levels and make selections
● All Categories can be segmented by Industries, Majors, Categories,
Subcategories, and Micro-categories
● All Products can be segmented by Ultimate Owners, Parents,
Subsidiaries, Brands, and Products

Ad$pender User 2011
7
Setting Up Key Reports
Setting Up Your Report Format
1. Choose the sort options you would like to appear in the rows
of your report
● The order of the sorts will determine the organization of your report
● The default column is Media and the default row is Product
● The Product sort by option enables the display of the Product Break Out
box, which allows you to select other Product and Category levels.

Ad$pender User 2011
8
Setting Up Key Reports
Setting Up Your Report Format (Continued)
Report Format 2. Choose the measurement options you would like to appear in the rows of
your report
● To select a calculation check the box of your choice

Ad$pender User 2011
9
Setting Up Key Reports
Reviewing The Report Summary
1. Enter a Report Name
2. Specify a report access, Privilege Private or Public.
● Public reports can be viewed and used (but not modified) by
anyone with access to AdSpender within your company
3. Click on the Run Report button

Ad$pender User 2011
10
Ad$pender Measures & Calculations Explanations Measures
# - Units: Units are simply the number of advertisements
placed. There is no weighting (based on spot length, size,
etc.) at all. Units are also called “placements”.
Calculations
Difference: Difference shows the difference between the
given column and the base column* as a pure numeric
difference.
Difference %: Difference Percent shows the percent
difference between the given column and the base
column* as a percentage.
% Across: Percent Across compares the numbers within
the column to the total for the report for the given measure
across all columns as a percentage. This gives the
percentage of the total that the given column accounts in
the selected measure.
$ - Expenditures: Expenditures are the dollars attributed
to the given amount of advertising. Expenditures do not
take into account volume discounts or sales commissions.
Expenditures are “Gross” dollars. Expenditures are stated
in thousands (000) within Trend, Media Mix, Pod Position,
and Summary. You are given an option of thousands (000)
or actual numbers for all other report types.
Index: Index divides by the total for a given row and
multiplies by 100.
% Down: Percent Down compares the numbers within the
row to the subtotal for the report for the given measure.
This gives the percentage of the subtotal that the given
row accounts in the selected measure. For example if
sorting by Parent then Brand, % Down on expenditures
would show brand’s expenditures as a percentage for the
parent.
*Base Column: The column to calculate differences from. Note that if a base
column is not designated (within either the time period tab for trend reports,
or the applicable column in the Finder for Media Usage) then the Total
column will be used.

Ad$pender User 2011
11
Terms & Definitions
ALL
If no selections are made, the system defaults to “All,”
which means everything is automatically selected.
All other-ranking
When ranking and limiting to the Top “N”, there is an
option for an all other total which would group together the
remaining activity beyond the top “N”.
Brand
The name associated with the maker or provider of a
Product or service. Also referred to as an Account.
Category
Groups of brands that do business in the same general
area. Each brand belongs to one category.
Cutoff
Setting a number below or above which activity will not be
reported. For example, reporting only brands that spent
more than $100,000 and less than $1,000,000. Available
as a tab within the measures/calcs page. Note that you
must rank in order to cutoff within reports.
Dynamic Time Periods
These change based on data availability so you do not
have to continually change your time periods. These can
be a single time period or multiple time periods such as
current month and current year broken out by month.
Grand Total
Total for all items within the report. Grand totals can be
at the top or bottom of the report, set within the Report
Options page.
Groups
A combination of the same entity type (i.e. brands) to show
on a report as one item.
Major
A level of brand classification above category. Majors
contain numerous categories.
Not-Itemized
Not-Itemized advertising does not receive a specific
Brand. Examples of this include the following: Classified
Ads and advertising in directories including Schools &
Camps, Financial, Kennels, Game Breeders, Where-To-
Go, Real Estate, Restaurants, Hotels & Resorts, Postage
Stamps & Coins, Business Propositions, etc.
Commonly Used Abbreviations
ADV Advertising or Advertisement
ASSN Association
CO Company
CORP Corporate
COS Companies
CP Corporate Promotion
DISC Discount
DOM Domestic
DOW Day of Week
DR Direct Response
FSI Free Standing Insert
HISP Hispanic
LOH Ladies of the Household
LTD Limited
M Men
M&W Men and Women
MA Mergers and Acquisitions
PDTS Products
RTS Ready to Serve
RTW Ready to Wear
VAR Various
W Women
WW Working Women

Ad$pender User 2011
12
Terms & Definitions (Continued)
Parent Company
Represents the company that produces, markets, or
distributes and is usually the source of the ad dollars for
individual brands. Each brand or account has one parent
company. If a brand or accounts parent company is not
known it will be placed under ‘Parent Unknown’. Note that
‘Parent Unknown’ will not show as an available parent
within Product Sets.
Product Sets
A container of product related selections including special
class, industry, major, category, parent company, subsidiary,
and brand. Product sets can be saved so they can be
reused for other reports. If you don’t want to reuse a product
set, you would just make selections and continue. If you
want to reuse it, you would save and name it.
PSA (Public Service Announcements)
Ads created to convey a public service. Placement can be
paid or unpaid.
Public Report
Specifications, Product Sets, Media Sets, Daypart Sets,
Groups, and Report Results can be shared across your
company. When you save, you would change to the public
option. Public items are public read-only, meaning only the
owner can modify them. All other users can use them as is
or save under another name.
Ranking
Ordering a report based on the selected measure in a
descending order. User can also select Top “N” such as
Top 25 which limits the report.
Special Class
An additional attribute on a brand to group brands across
categories. Some examples of Special Classes are
Corporate Promotion brands or Online brands.
Static Time Period
Specifically defined time periods that do not change.
Subsidiary
A company at least 50% controlled or owned by another
company.
Subtotals
Intermediate totals within the report. The default is to
subtotal all sorts except the innermost. These can be
deselected on the Report Options page.
Summary Totals
Show totals for inner sorts that may be under more than
one outer sort. For example, if you were to run Parent then
Category as sorts, if a summary total was reported the total
by category across all parents would be shown on the
report as well.
Time Period Frequency
Option to determine how time periods will be reported.
(i.e. by week, month, etc.)
Totals
All totals are net totals, which means if there is duplication
within a report, the totals wouldn’t show the duplication.
For example, if I select a brand and I create a brand group
that also contains that brand, the total will only count the
brand once.
Units
Refers to a single measurement such as one TV spot or
one newspaper ad. Media such as Local Radio, Outdoor,
and Internet do not have units of measurement so will
show an empty field. Units ARE NOT PRORATED based
on size or length.
Vignette
A short literary sketch sponsored and bundled with a
commercial. It may be a trivia question, cooking tip, public
interest item or program-material-related sketch. Vignettes
will air nationally with many national products.

Ad$pender User 2011
13
FAQs
What does “There were no results for the report you
requested” mean?
This means that there was no activity found for the report
you ran. This could happen for a number of reasons. For
example, the brands included in your report may not have
had any activity during the time period you requested, or
perhaps dollars or ratings were not yet available for the time
period you included in the report. In this situation you should
check data availability or change some of your selections
before running your report again.
(Note that there is no more “No data met all report
specifications”)
How can I see what brands are included in a
particular category?
On the Product Set Summary page, click on Category
and you will be taken to the category selection page. After
searching or browsing for your desired category, highlight
it. Now, in the box below, select “Show Me Brands For
Highlighted Available Items” and click on the Search but-
ton. You will now see a list of brands within the category
you highlighted. Note that you may also highlight multiple
categories in order to see the brands in each.
If you want to drill down to these brands using a keyword,
click the show advanced link first. Then select a begin date
of 1/1/1998 and enter your keyword. With your category
highlighted, click search. This will search all brands within
the database.
How do I find new brands that were added into
the database within a particular time frame?
(Also referred to as a Brand Audit)
On the Product Set Summary page, click on Brand. With
brand still shown in the dropdown of the Product Set
search box, click on Show Date Criteria to make your date
selections. Type your desired keyword in the box and click
on search. If you would prefer to search all new brands,
leave the keyword box blank and click on search. If you
would like to see new brands within a particular category
or parent, go to the Product Set Summary page and click
on Category or Parent. After searching or browsing for your
desired category or parent, highlight it.
Now, in the box below, click on Show Advanced and choose
a date range.Then, select “Show Me Brands For
Highlighted Available Items” and click on the Search
button. You will now see a list of brands within the category
or parent you highlighted.
What is the difference between a static
and a dynamic time period?
Static time periods are specific dates to be included in
your report. Static time periods do not change over time.
Example: January 2005
Dynamic time periods are based on media availability.
With a dynamic time period, such as “Current Month”, the
days, weeks, months, or years covered in a given report
will change over time depending on when a report is run.
For example, if a report includes “Current Month”, the
report will always include the most recent month of
available data. Therefore the report output will cover a
different month in June than it would if it the report is run
again in December.
What does COMB, COPY & NEC mean?
Comb Copy and NEC (Not Elsewhere Classified) means that
a particular brand or combination of brands did not fit into any
category within a specific class, and is therefore put into the
Comb Copy and NEC for that class. For example, Category
F611 is for Regular Beer & Ale, Category F612 is for Light &
Low Alcohol Beer & Ale. If both a regular and a light beer are
advertised together, then the brand and ad spending will go in
F619 Beer & Ale: Comb Copy and NEC.
How can I view the DMA rank of a market?
Check off Display DMA rank under the market tab within the
MediaSet Selections.
How do I find out when the most recent data will be
available? When will spending/ratings be available for
a certain media?
Please see Data Availability chart or click on Availability button
in the upper right hand corner of Ad$pender.

Ad$pender User 2011
14
Data Availability
Network TV Syndication Cable TV Spot TV
Units & Dollars
6-8 Weeks
6-8 Weeks
6-8 Weeks
Unadjusted: 1-2
Weeks
Net Radio
Natl Spot Radio
MK Local Radio
Magazines
Sunday Mags
Units & Dollars
3-5 Weeks
8-10 Weeks
6-8 Weeks
1-2 Weeks
1-2 Weeks
Local Magazines
Hispanic Magazines B-To-B Magazines
Internet
Outdoor
Units & Dollars
1-2 Weeks
1-2 Weeks
6-8 Weeks
24-48 Hours
5-6 Weeks
National Newspaper Newspaper
Hispanic Newspaper
Units & Dollars
About 4 Weeks
About 4 Weeks
About 4 Weeks