Embed Size (px)
Citation preview
Usefulness of Nuclear Cardiology Tecqniques in the management of
Heart Failure pts.Raffaele Giubbini
Chair and Nuclear Medicine UnitUniversity and Spedali Civili
Brescia [email protected]
Heart Failure in the New Millennium
Heart Failure remains one of the most• common• disabling• deadly• costlymedical conditions encountered by a wide range of physicians in both primary and secondary careMcMurray & Pfeffer. Lancet May 28, 2005; 365:1877
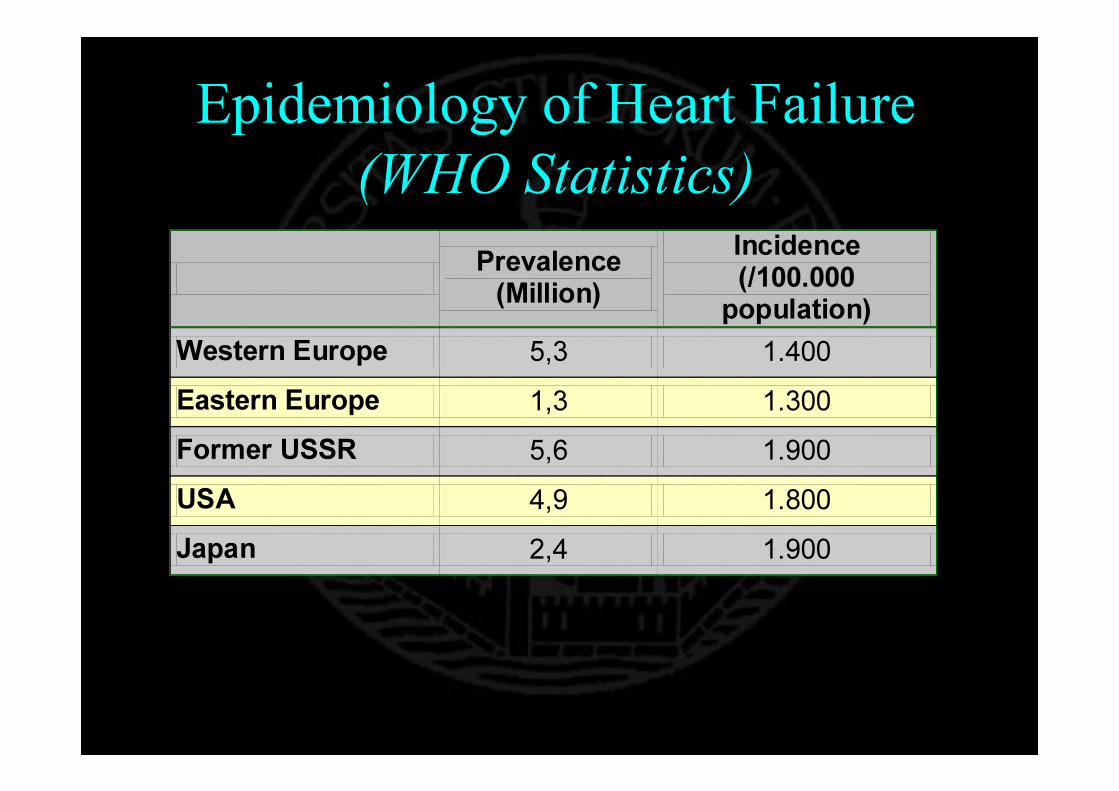
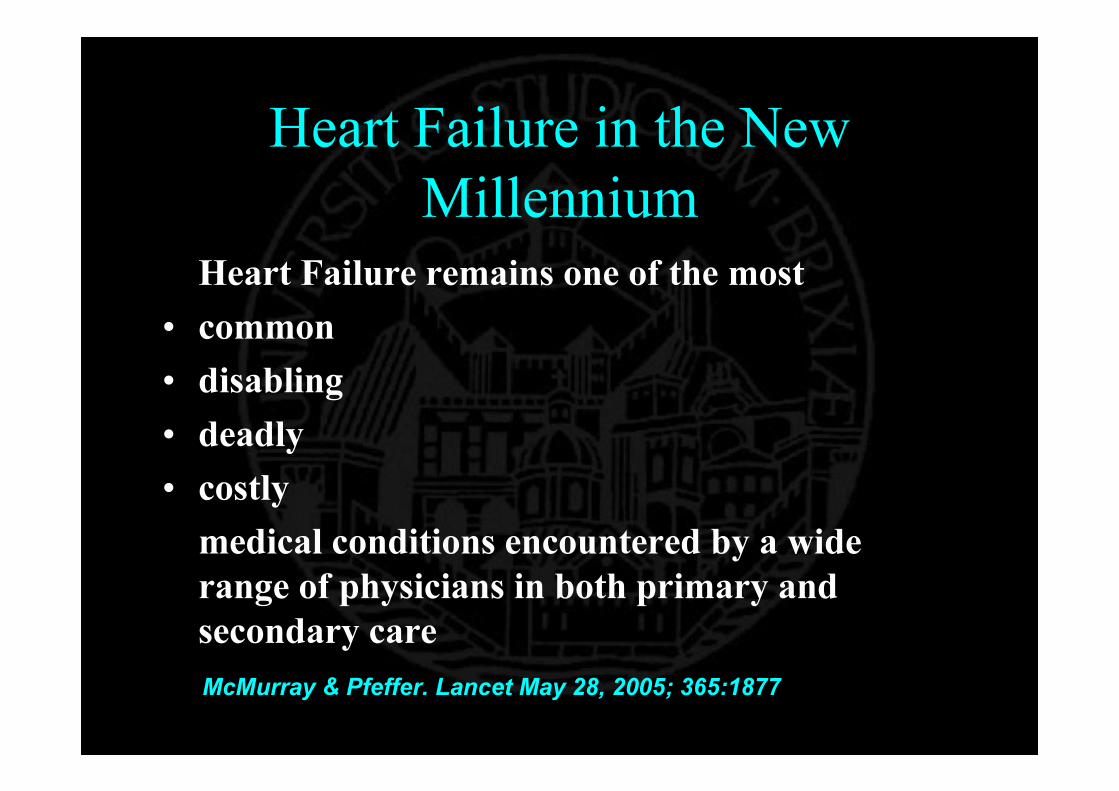
Epidemiology of Heart Failure (WHO Statistics)
Prevalence (Million)
Incidence (/100.000 population)
Western Europe 5,3 1.400 Eastern Europe 1,3 1.300 Former USSR 5,6 1.900 USA 4,9 1.800 Japan 2,4 1.900
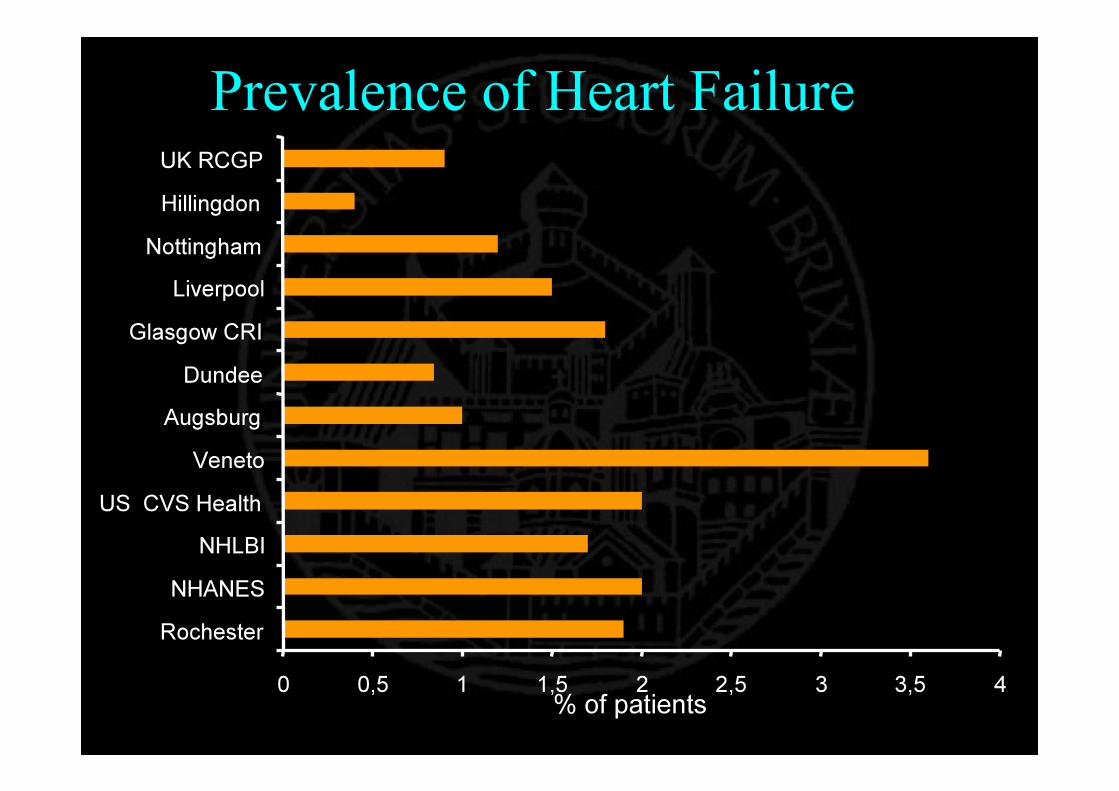
0 0,5 1 1,5 2 2,5 3 3,5 4RochesterNHANES
NHLBIUS CVS Health
VenetoAugsburgDundee
Glasgow CRILiverpool
NottinghamHillingdonUK RCGP
% of patients
Prevalence of Heart Failure
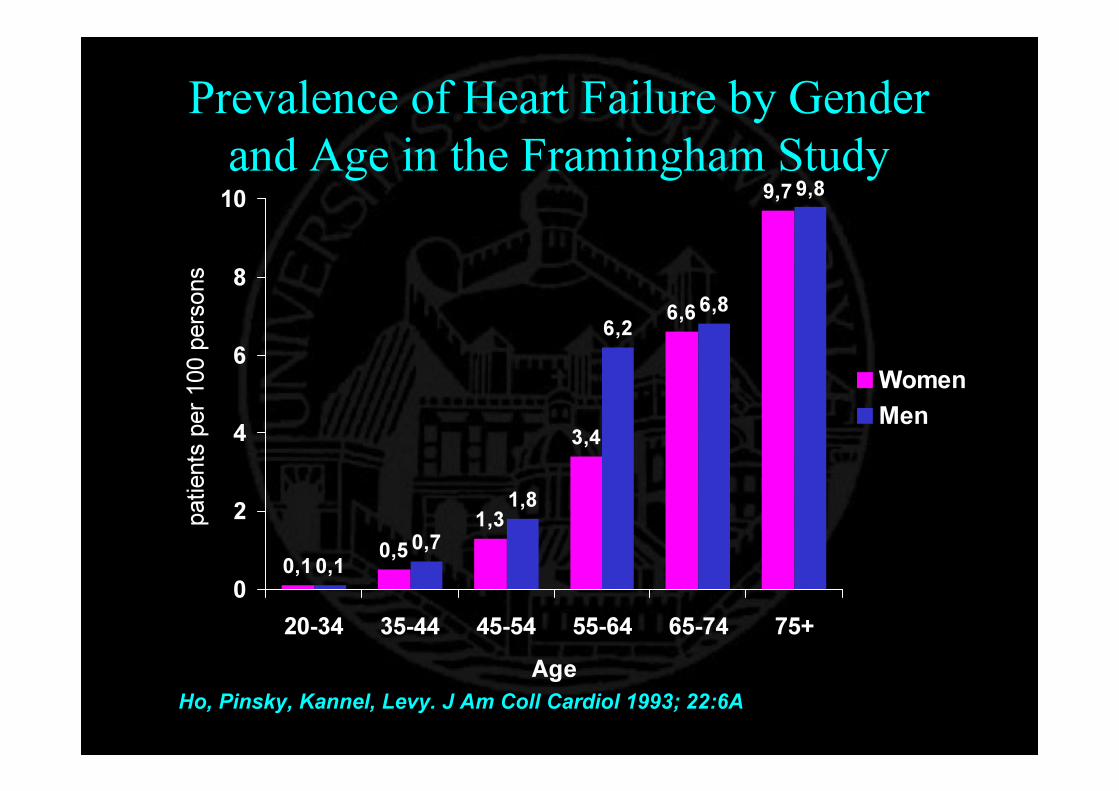
Prevalence of Heart Failure by Gender and Age in the Framingham Study
0,1 0,51,3
3,4
6,6
9,7
0,10,7
1,8
6,26,8
9,8
0
2
4
6
8
10
20-34 35-44 45-54 55-64 65-74 75+Age
patie
nts pe
r 100
perso
ns
WomenMen
Ho, Pinsky, Kannel, Levy. J Am Coll Cardiol 1993; 22:6A
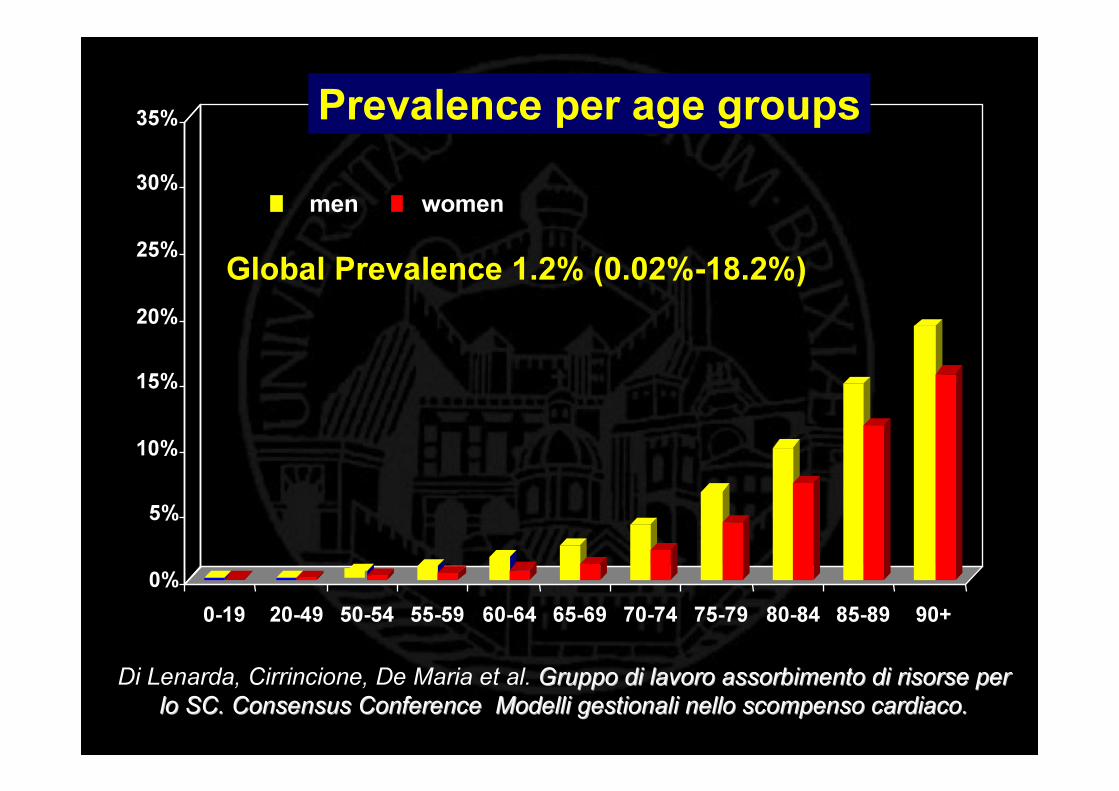
0%
5%
10%
15%
20%
25%
30%
35%
0-19 20-49 50-54 55-59 60-64 65-69 70-74 75-79 80-84 85-89 90+
men women
Prevalence per age groups
Global Prevalence 1.2% (0.02%-18.2%)
Di Lenarda, Cirrincione, De Maria et al. Gruppo di lavoro assorbimento di risorse per Gruppo di lavoro assorbimento di risorse per lo SC. Consensus Conference Modelli gestionali nello scompenso lo SC. Consensus Conference Modelli gestionali nello scompenso cardiaco. cardiaco.

The Epidemiology of Heart Failure
• Prevalence– 1-2% of the general population– 6-10% of people > 65 year old– 15-20% people >80 year old
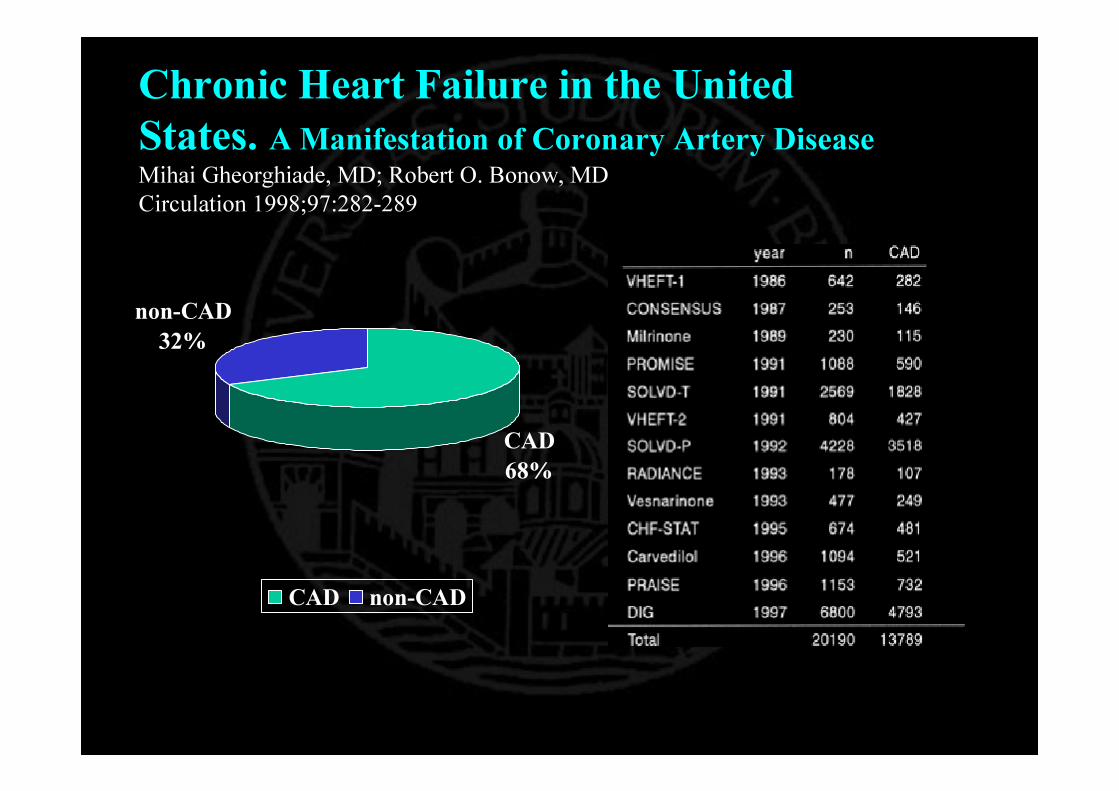
Chronic Heart Failure in the United States. A Manifestation of Coronary Artery DiseaseMihai Gheorghiade, MD; Robert O. Bonow, MD Circulation 1998;97:282-289
CAD68%
non-CAD32%
CAD non-CAD

Incidence of Heart FailureStudy Incidence (No.
per 1000)Framingham, McKee NEJM 1971
45-54 years85-94 years
2 40
Sweden, Eriksson EHJ 198950-54 years55-60 years60-61 years
1.5 4.3
10.2 Finland, Remes EHJ 1992
45-74 years 4.1 US, Rodheffer Mayo Clin Proc 1993 1.1
UK, Cowie Lancet 1997 1.85
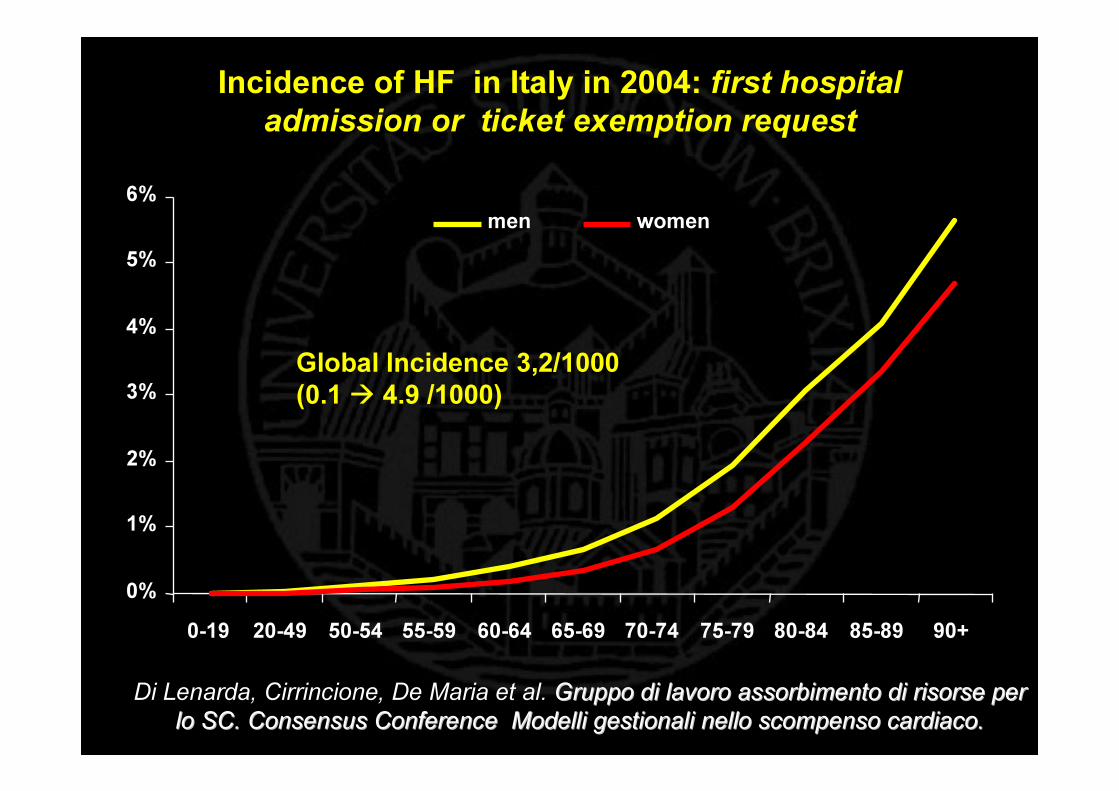
Incidence of HF in Italy in 2004: first hospital admission or ticket exemption request
0%
1%
2%
3%
4%
5%
6%
0-19 20-49 50-54 55-59 60-64 65-69 70-74 75-79 80-84 85-89 90+
men women
Global Incidence 3,2/1000(0.1 � 4.9 /1000)
Di Lenarda, Cirrincione, De Maria et al. Gruppo di lavoro assorbimento di risorse per Gruppo di lavoro assorbimento di risorse per lo SC. Consensus Conference Modelli gestionali nello scompenso lo SC. Consensus Conference Modelli gestionali nello scompenso cardiaco. cardiaco.
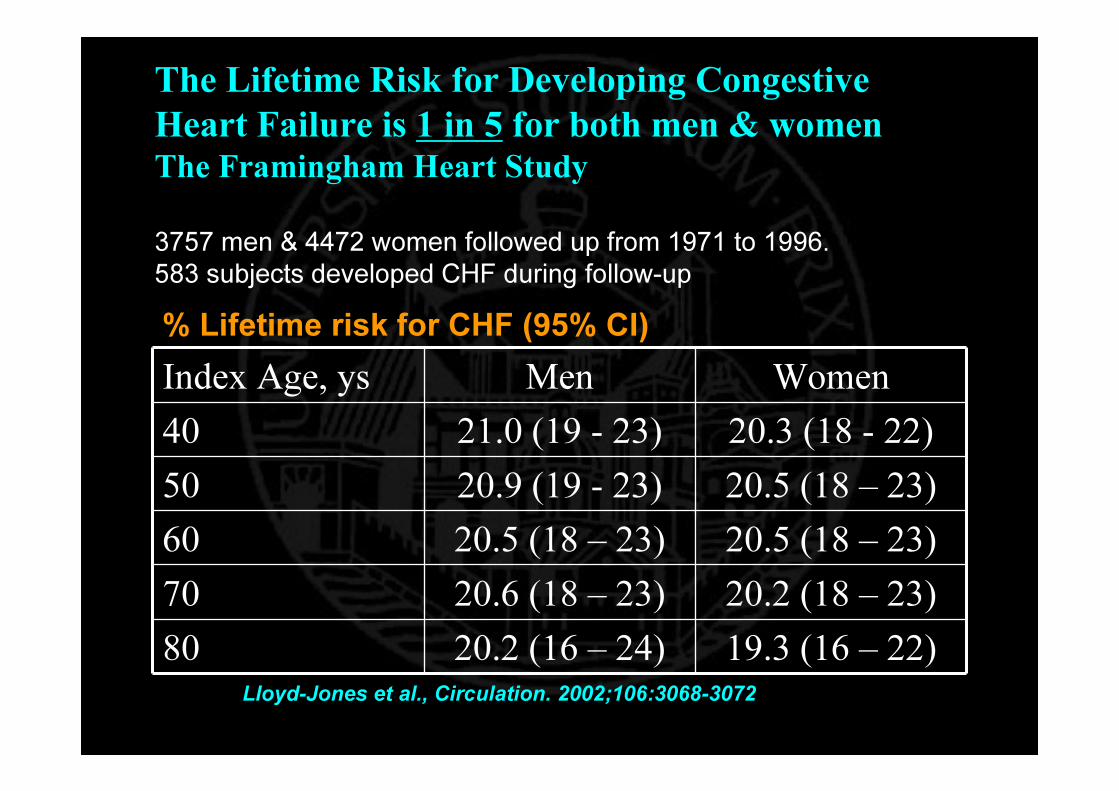
The Lifetime Risk for Developing Congestive Heart Failure is 1 in 5 for both men & womenThe Framingham Heart Study
Index Age, ys Men Women40 21.0 (19 - 23) 20.3 (18 - 22)50 20.9 (19 - 23) 20.5 (18 – 23)60 20.5 (18 – 23) 20.5 (18 – 23)70 20.6 (18 – 23) 20.2 (18 – 23)80 20.2 (16 – 24) 19.3 (16 – 22)
% Lifetime risk for CHF (95% CI)
3757 men & 4472 women followed up from 1971 to 1996.583 subjects developed CHF during follow-up
Lloyd-Jones et al., Circulation. 2002;106:3068-3072
The Diagnostic Burden of HF “2002 ESC Guidelines Heart Failure”Symptoms + LV Systolic Dysfunction
Asymptomatic LV Systolic Dysfunction
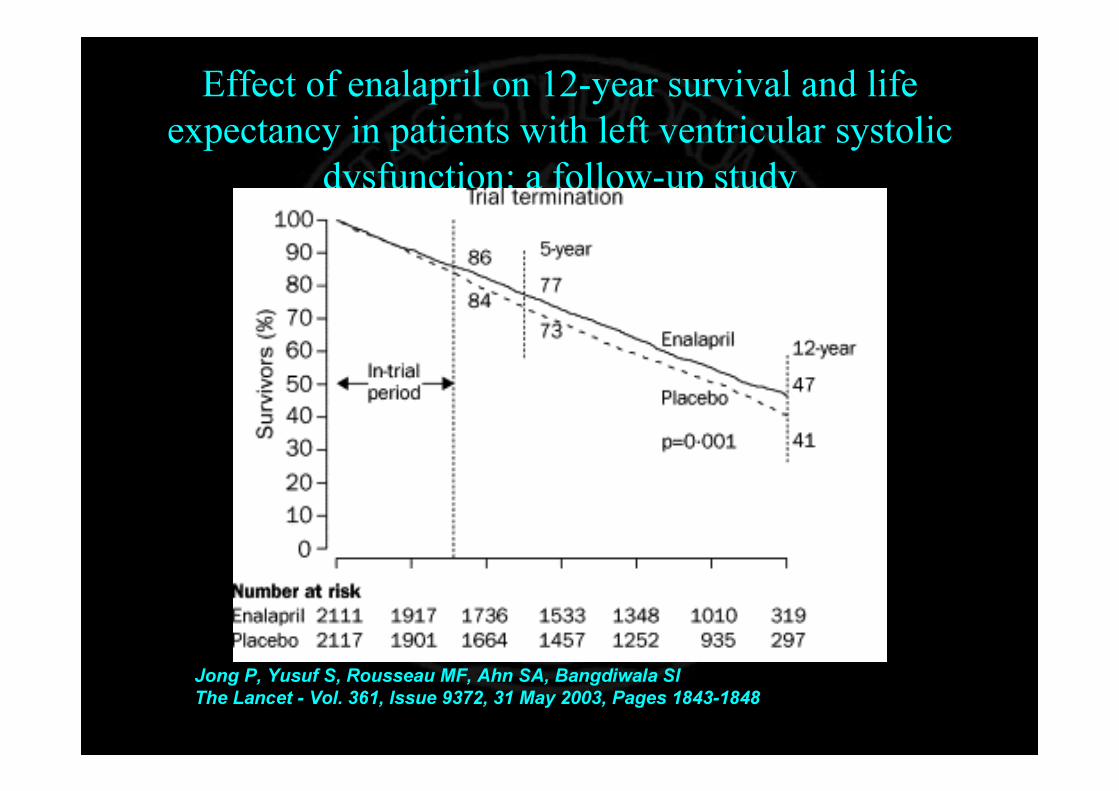
Effect of enalapril on 12-year survival and life expectancy in patients with left ventricular systolic
dysfunction: a follow-up study
Jong P, Yusuf S, Rousseau MF, Ahn SA, Bangdiwala SIThe Lancet - Vol. 361, Issue 9372, 31 May 2003, Pages 1843-1848

0 2 4 6 8 10
Framingham
Glasgow CRI <30%
Glasgow CRI <35%
NHLBI
Augsburg
Rotterdam
The NHLBI study recruited only patients >65 yrs The Rotterdam study recruited only patients >55years but had no upper age limitOther studies recruited patients between the ages of 25-75 years (approx.)
NB:CutNB:Cut--off for LVD variedoff for LVD varied
Prevalence of LV systolic dysfunction in echocardiographic studies
%%
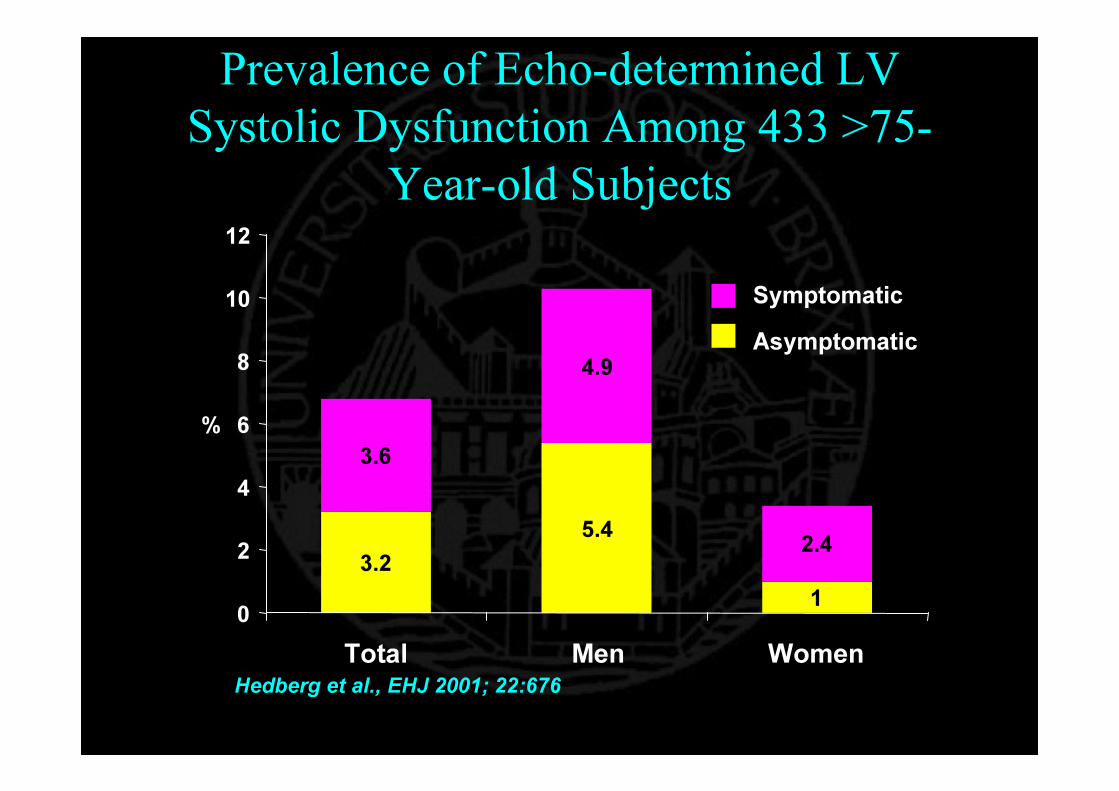
Prevalence of Echo-determined LV Systolic Dysfunction Among 433 >75-
Year-old Subjects
5.4
1
4.9
2.43.2
3.6
0
2
4
6
8
10
12
Total Men Women
%
Hedberg et al., EHJ 2001; 22:676
AsymptomaticSymptomatic
Women show high tolerance of CHF symptoms
Women show high tolerance of CHF symptoms
…..not only of men!…..not only of men!
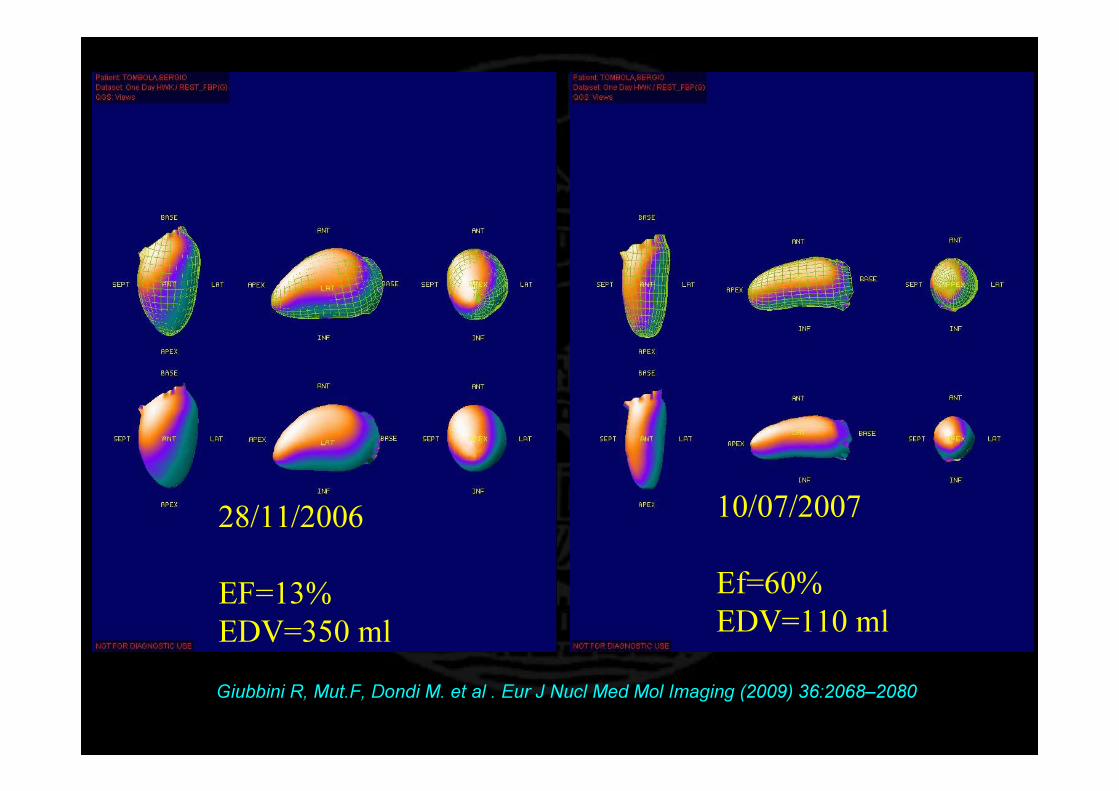
28/11/2006
EF=13%EDV=350 ml
10/07/2007
Ef=60%EDV=110 ml
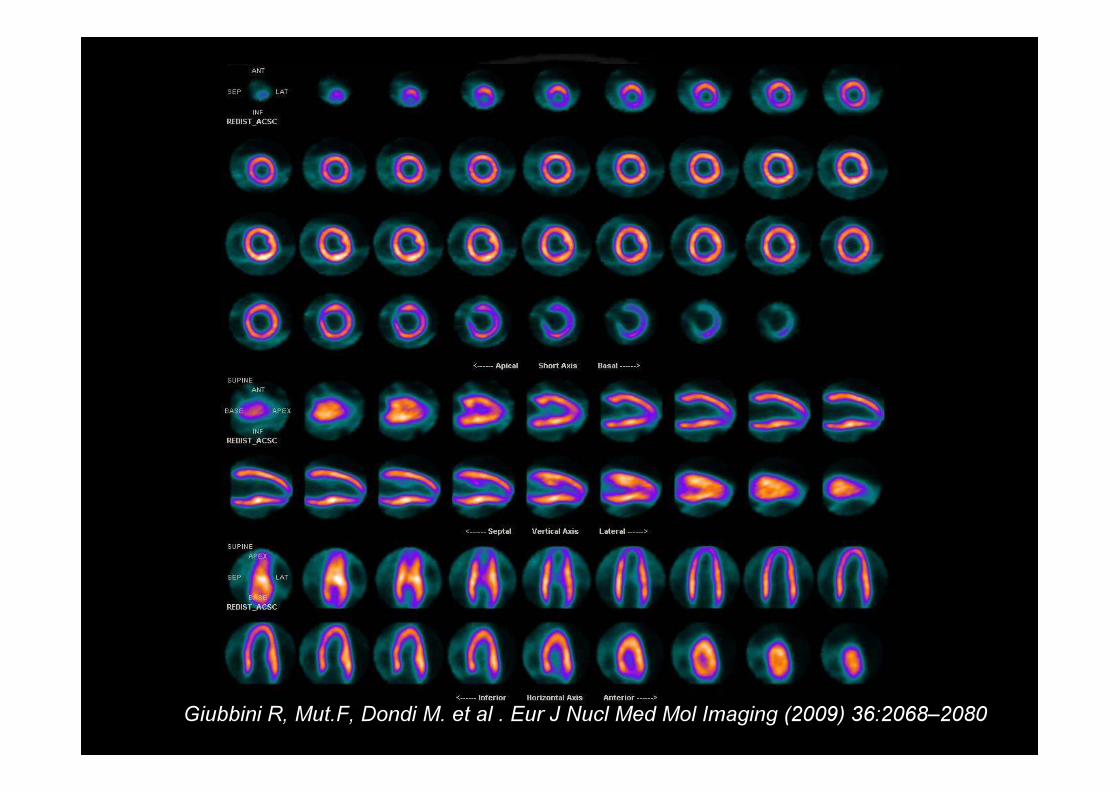
Giubbini R, Mut.F, Dondi M. et al . Eur J Nucl Med Mol Imaging (2009) 36:2068–2080
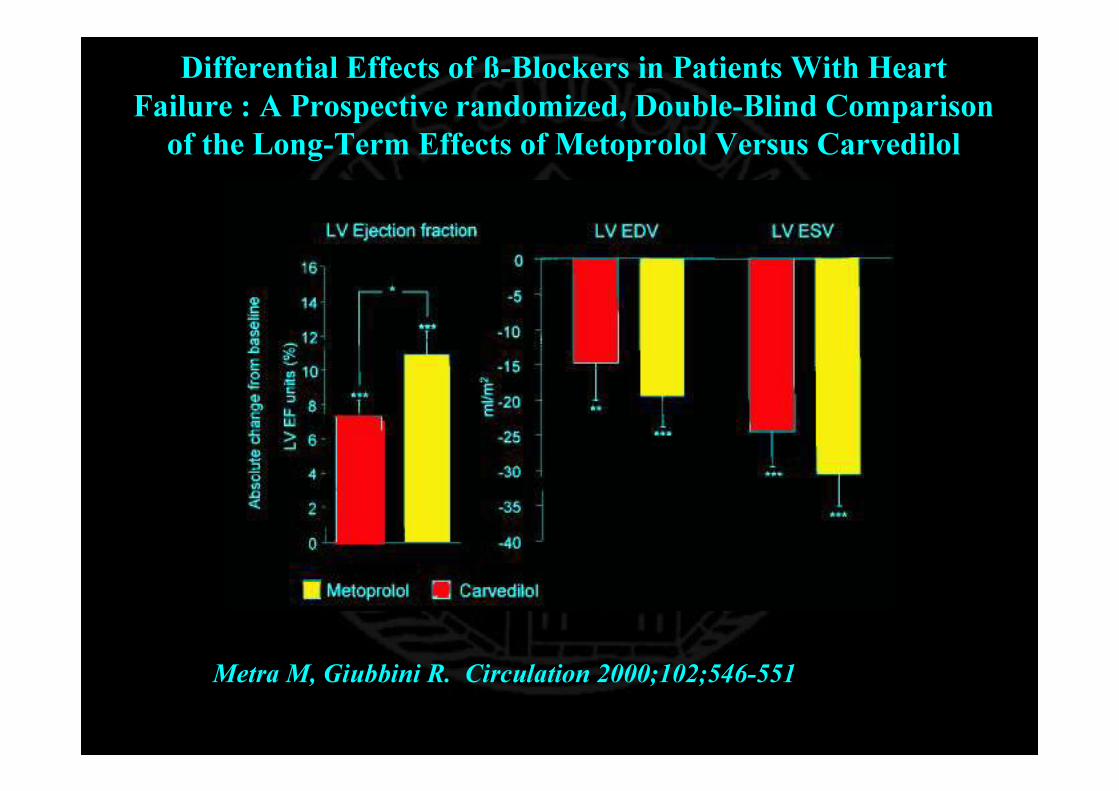
Differential Effects of ß-Blockers in Patients With Heart Failure : A Prospective randomized, Double-Blind Comparison of the Long-Term Effects of Metoprolol Versus Carvedilol
Metra M, Giubbini R. Circulation 2000;102;546-551
Diagnostic tools for monitoring LV performance in CHF pts
• A reliable• Widely available• reproducible • 3-D• Performing in 100% of pts
MR ventriculography could be an optimal technique,
but….
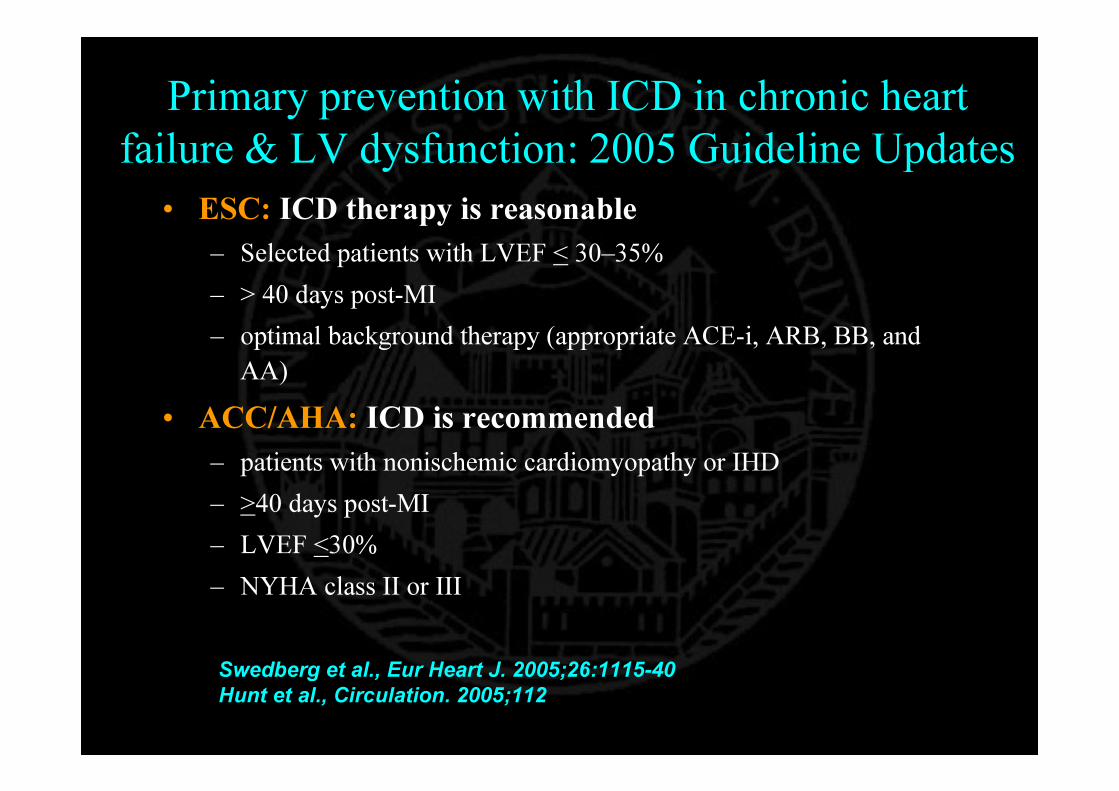
Primary prevention with ICD in chronic heart failure & LV dysfunction: 2005 Guideline Updates
• ESC: ICD therapy is reasonable– Selected patients with LVEF < 30–35%– > 40 days post-MI– optimal background therapy (appropriate ACE-i, ARB, BB, and
AA)• ACC/AHA: ICD is recommended
– patients with nonischemic cardiomyopathy or IHD– >40 days post-MI – LVEF <30% – NYHA class II or III
Swedberg et al., Eur Heart J. 2005;26:1115-40Hunt et al., Circulation. 2005;112

• Lawyer pressure• Malpractice fear

Jauhar, S. et al. N Engl J Med 2004;351:2542-2544
Increase in the Use of Implantable Cardioverter-Defibrillators (ICDs) in the United States
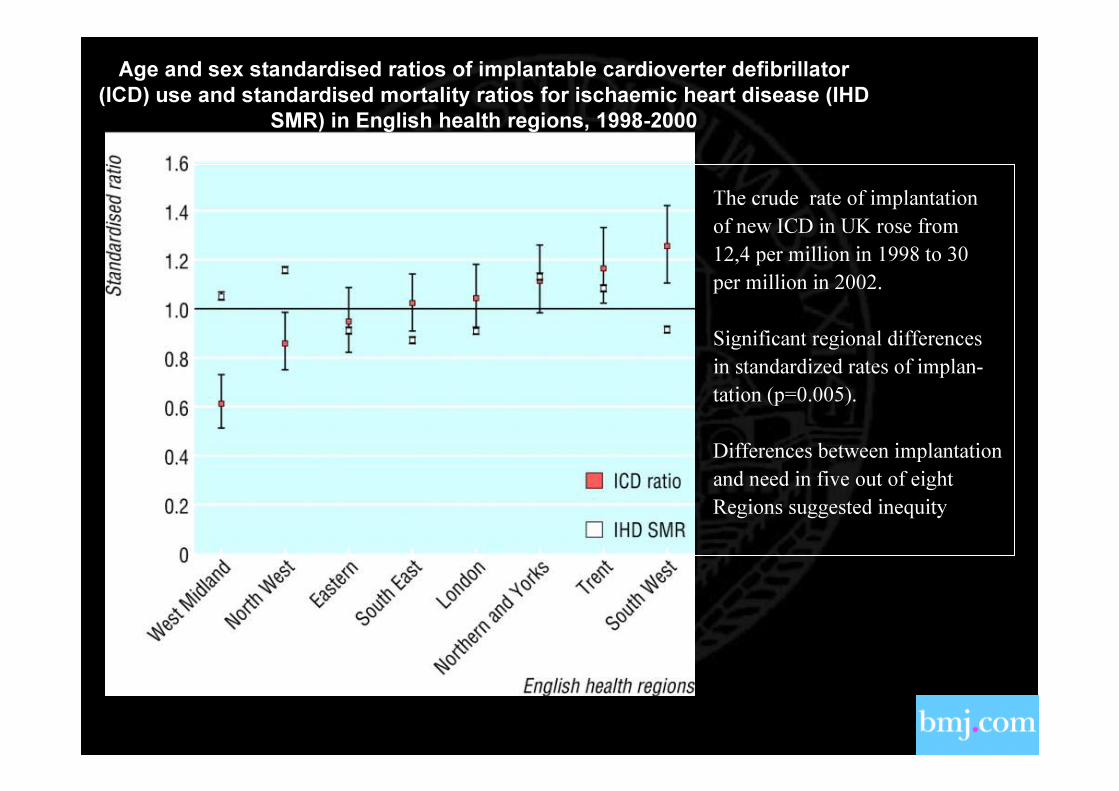
Parkes, J. et al. BMJ 2005; 330: 454-455
Age and sex standardised ratios of implantable cardioverter defibrillator (ICD) use and standardised mortality ratios for ischaemic heart disease (IHD
SMR) in English health regions, 1998-2000
The crude rate of implantationof new ICD in UK rose from 12,4 per million in 1998 to 30per million in 2002.
Significant regional differencesin standardized rates of implan-tation (p=0.005).
Differences between implantationand need in five out of eightRegions suggested inequity

The Diagnostic Burden of HF “2002 ESC Guidelines Heart Failure”Symptoms + LV Systolic Dysfunction
Asymptomatic LV Systolic Dysfunction
LV Diastolic dysfunction
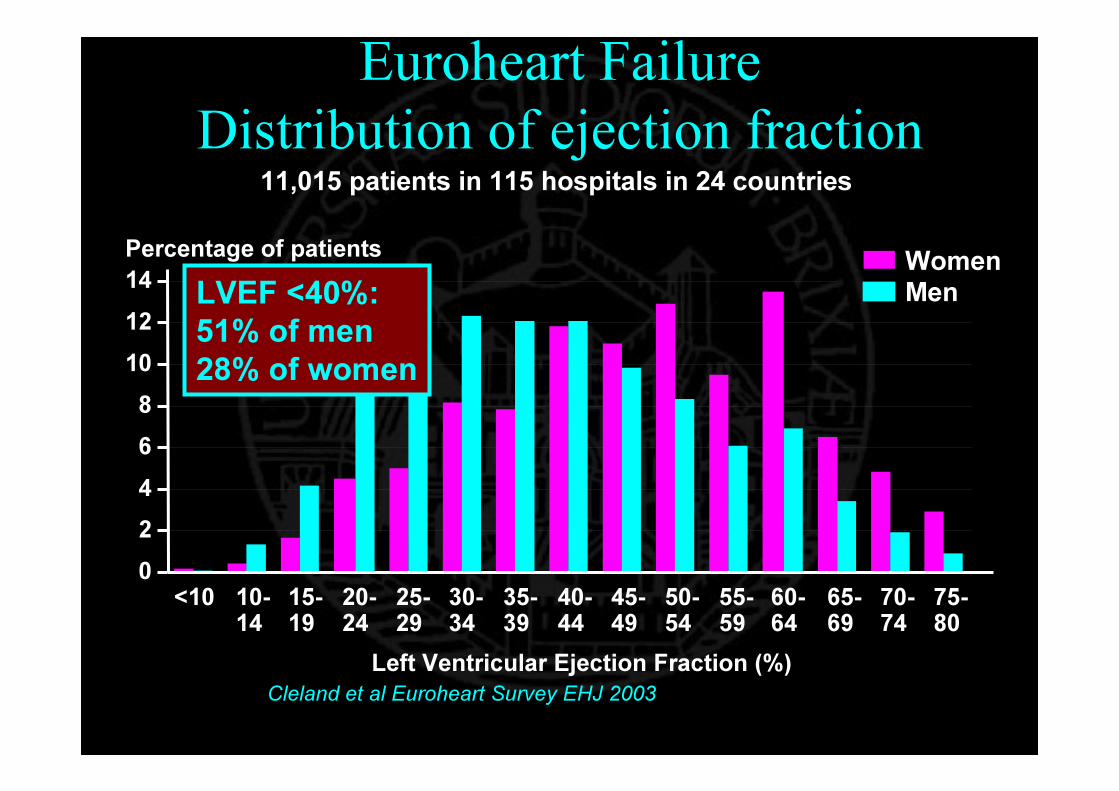
Euroheart FailureDistribution of ejection fraction
Left Ventricular Ejection Fraction (%)
02468
101214
<10 10-14
15-19
20-24
25-29
30-34
35-39
40-44
45-49
50-54
55-59
60-64
65-69
70-74
75-80
Percentage of patients WomenMen
Cleland et al Euroheart Survey EHJ 2003
11,015 patients in 115 hospitals in 24 countries
LVEF <40%:51% of men28% of women

Clinical Characteristics & Treatment of Patients with Preserved and Depressed LV Function
Normal EF(n = 3148)
Low EF (n=3658)
P
Age, ys 71 + 12 67 + 13 < 0.001Women, % 55 29 < 0.001Hypertension,% 59 50 < 0.001Diabetes, % 26 28 0.09CAD, % 59 69 < 0.001AF, % 25 23 0.01ACEi, % 58 78 < 0.001BB, % 39 46 < 0.001Diuretics, % 85 87 0.01Spironolactone, % 17 29 < 0.001
Lenzen et al., Eur Heart J 2004; 25:1214
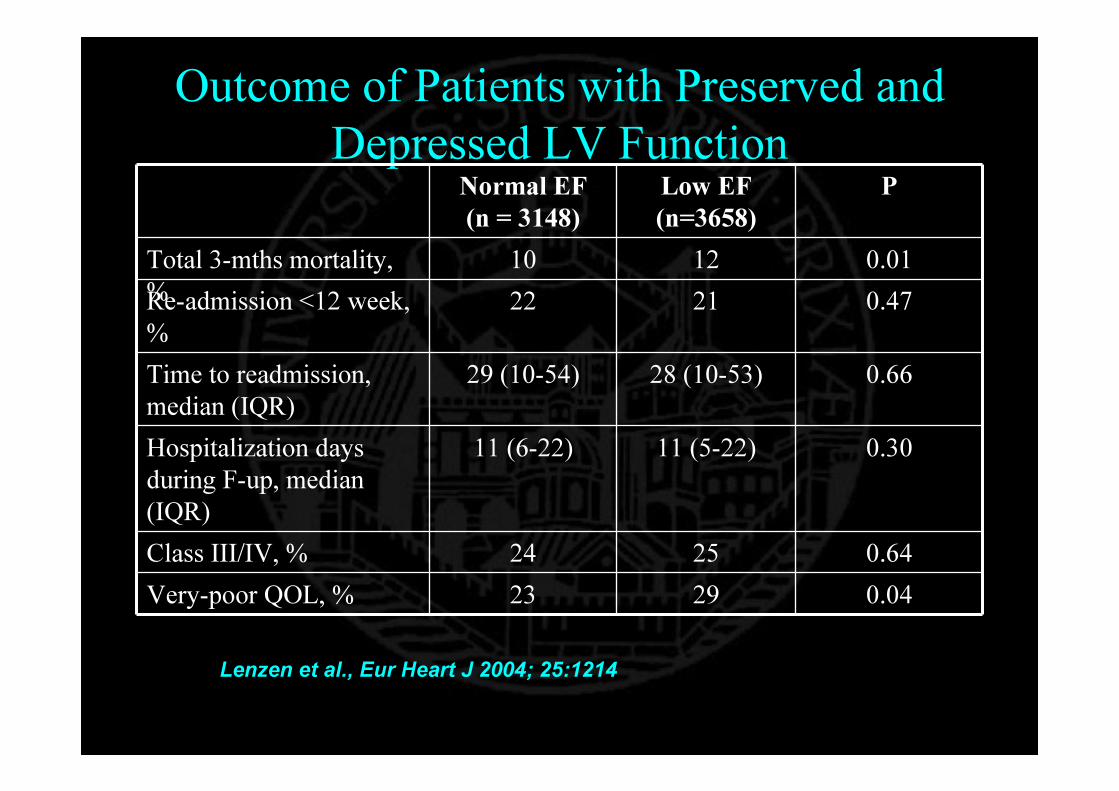
Outcome of Patients with Preserved and Depressed LV Function
Normal EF (n = 3148)
Low EF (n=3658)
P
Total 3-mths mortality, %
10 12 0.01Re-admission <12 week, %
22 21 0.47
Time to readmission, median (IQR)
29 (10-54) 28 (10-53) 0.66
Hospitalization days during F-up, median (IQR)
11 (6-22) 11 (5-22) 0.30
Class III/IV, % 24 25 0.64Very-poor QOL, % 23 29 0.04
Lenzen et al., Eur Heart J 2004; 25:1214
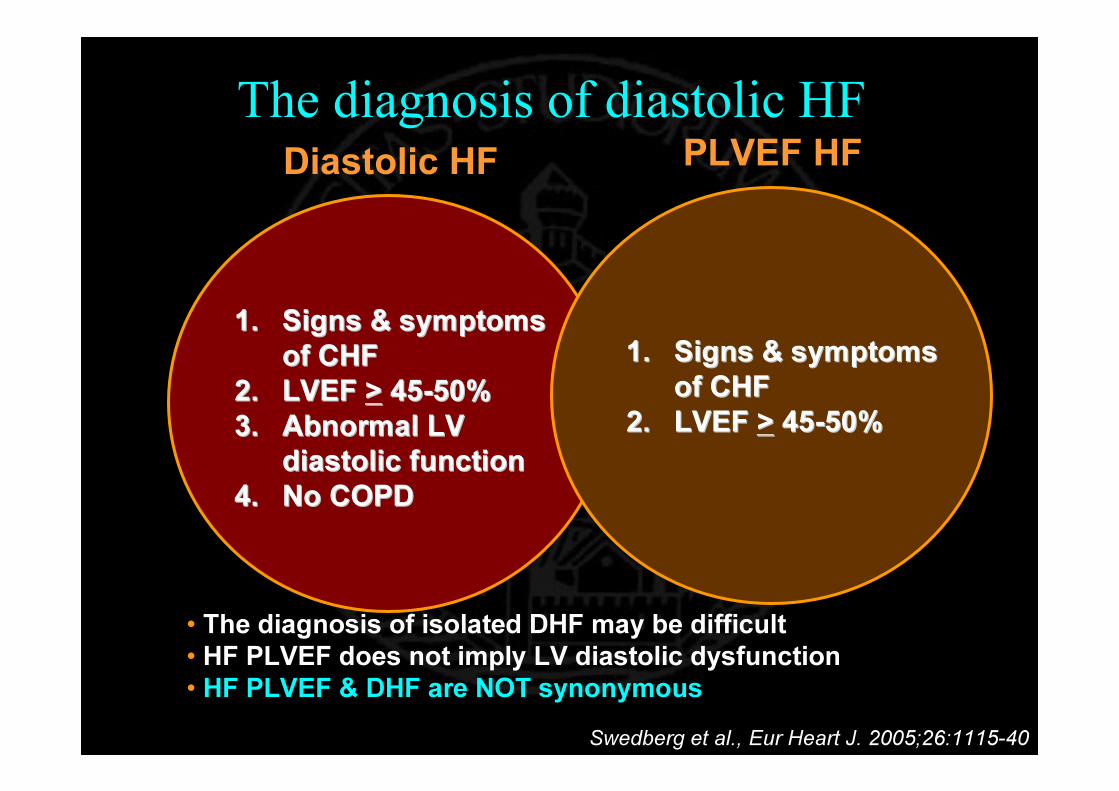
The diagnosis of diastolic HF
1.1. Signs & symptoms Signs & symptoms of CHFof CHF
2.2. LVEF LVEF >> 4545--50%50%3.3. Abnormal LV Abnormal LV
diastolic functiondiastolic function4.4. No COPDNo COPD
Diastolic HF
• The diagnosis of isolated DHF may be difficult• HF PLVEF does not imply LV diastolic dysfunction • HF PLVEF & DHF are NOT synonymous
PLVEF HF
1.1. Signs & symptoms Signs & symptoms of CHFof CHF
2.2. LVEF LVEF >> 4545--50%50%
Swedberg et al., Eur Heart J. 2005;26:1115-40
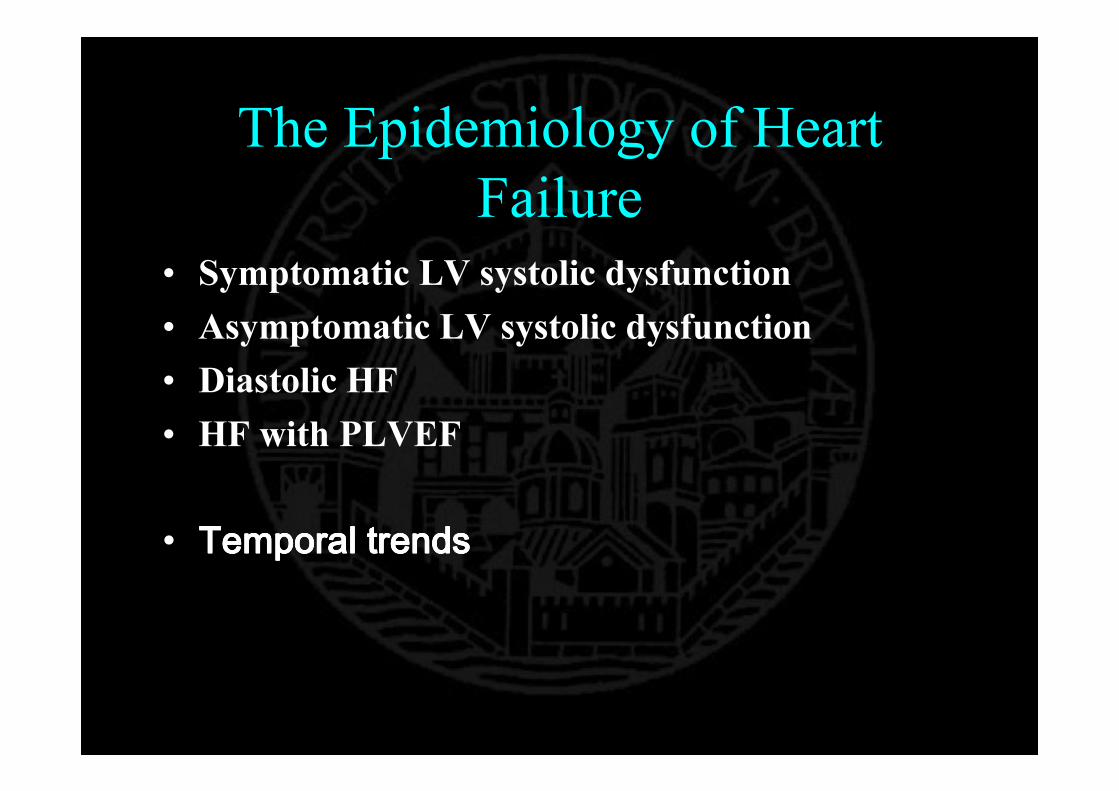
The Epidemiology of Heart Failure
• Symptomatic LV systolic dysfunction • Asymptomatic LV systolic dysfunction • Diastolic HF• HF with PLVEF
• Temporal trendsTemporal trendsTemporal trendsTemporal trends

Increasing Prevalence of HFAging population
Improvemnt of life expectancyOf CAD pts
CHF ptsImprovement ih therapy
(medication, ICD)
↑ CHF prevalence

Projected Increases in the US Population >65 Years of Age.
Data from the US Census Bureau. Redfield. New Engl J Med 2002; 347:1444
9.211.3
12.7
16.5
20.5
16.625.5
34.8
53.7
77.2
0
5
10
15
20
25
1960 1980 2000 2020 2040
% of
popu
lation
> 65
years
old
0
10
20
30
40
50
60
70
80
90
Millio
ns of
perso
ns >6
5 yea
rs oldPercent of population
Millions of persons
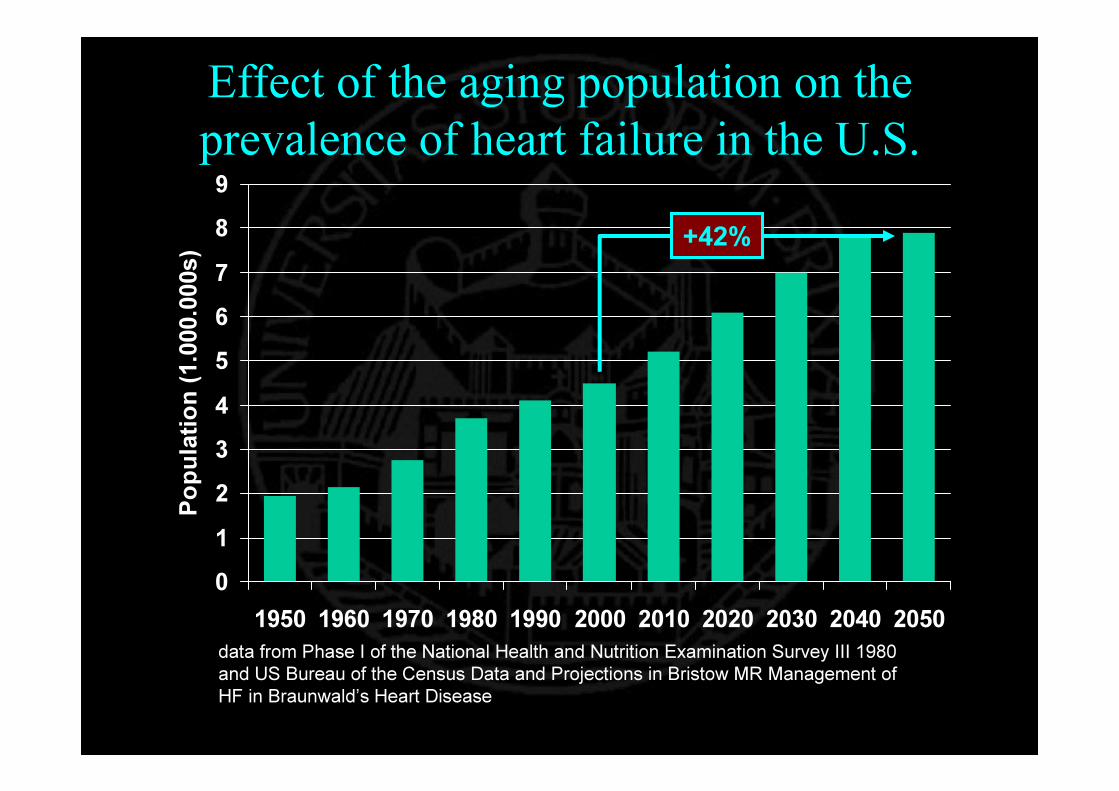
Effect of the aging population on the prevalence of heart failure in the U.S.
0123456789
1950 1960 1970 1980 1990 2000 2010 2020 2030 2040 2050
Popu
lation
(1.00
0.000
s)
data from Phase I of the National Health and Nutrition Examination Survey III 1980 and US Bureau of the Census Data and Projections in Bristow MR Management of HF in Braunwald’s Heart Disease
+42%
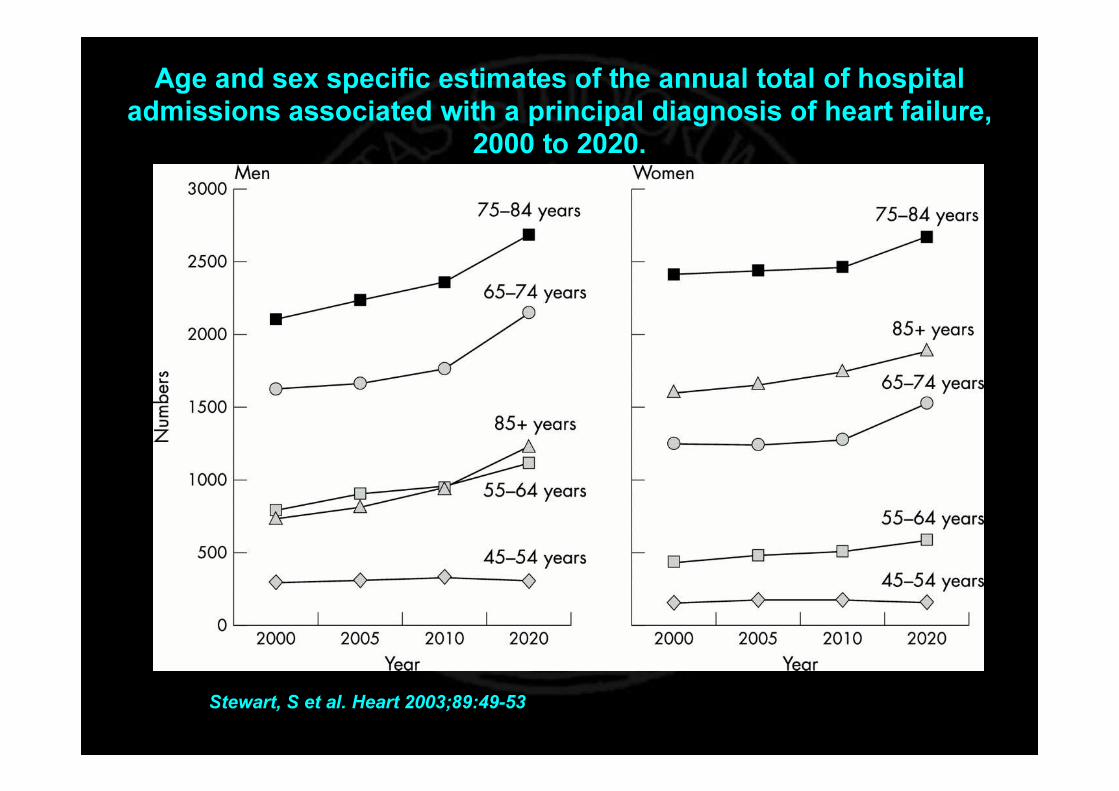
Stewart, S et al. Heart 2003;89:49-53
Age and sex specific estimates of the annual total of hospital admissions associated with a principal diagnosis of heart failure,
2000 to 2020.
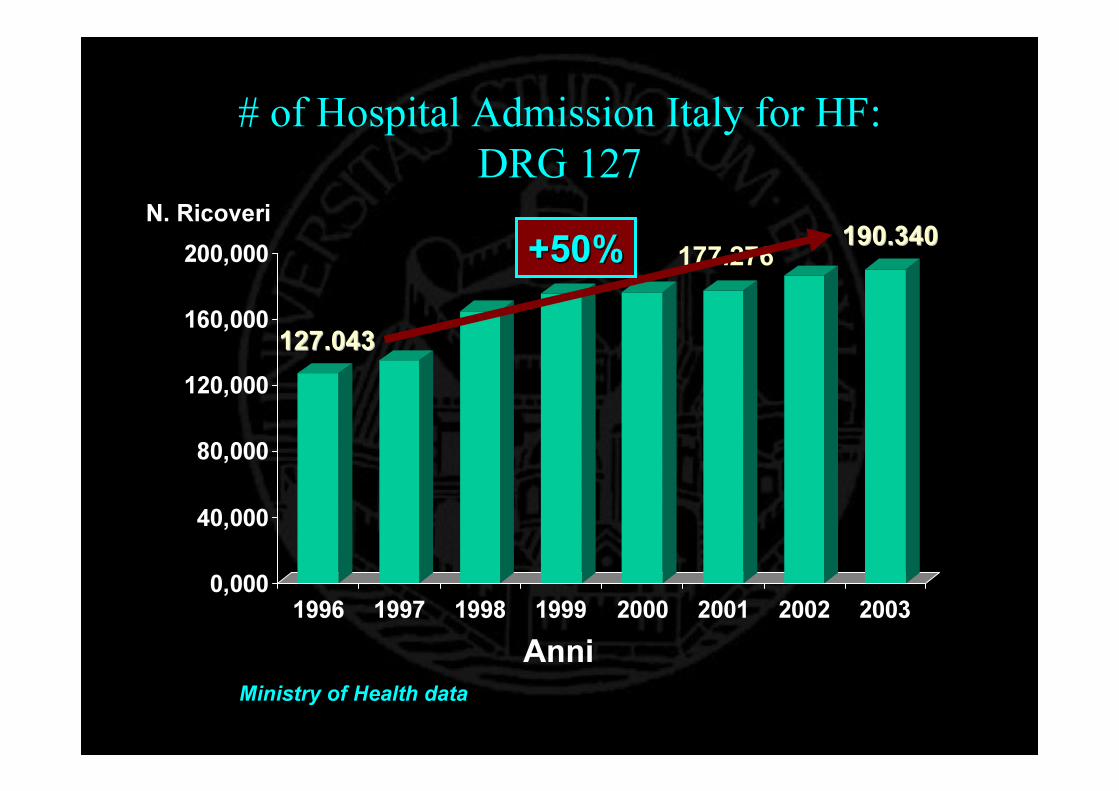
# of Hospital Admission Italy for HF: DRG 127
0,000
40,000
80,000
120,000
160,000
200,000
1996 1997 1998 1999 2000 2001 2002 2003
127.043127.043
190.340190.340N. Ricoveri
Ministry of Health dataAnni
177.276+50%+50%
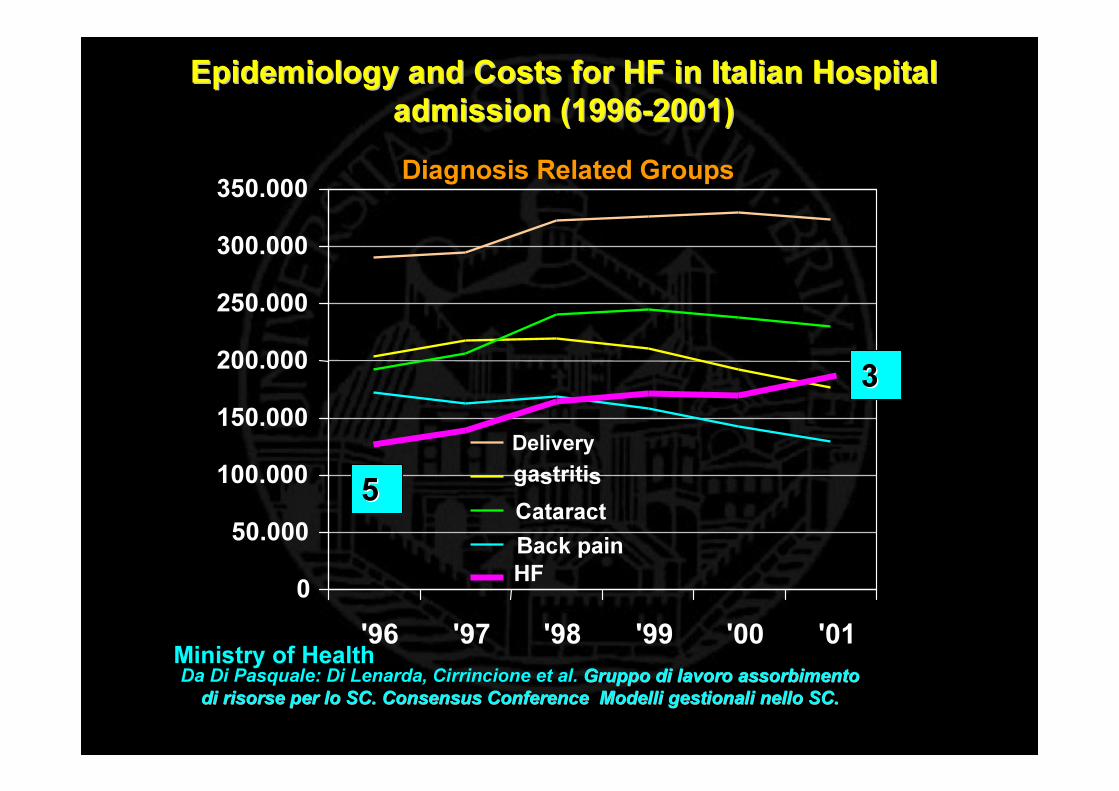
Epidemiology and Epidemiology and CCosts for HF in Italian Hospital osts for HF in Italian Hospital admission (1996admission (1996--2001) 2001)
0
50.000
100.000
150.000
200.000
250.000
300.000
350.000
'96 '97 '98 '99 '00 '01
DeliverygastritisCataractBack painHF
Diagnosis Related Groups
55
33
Ministry of HealthDa Di Pasquale: Di Lenarda, Cirrincione et al. Gruppo di lavoro assorbimento Gruppo di lavoro assorbimento
di risorse per lo SC. Consensus Conference Modelli gestionali ndi risorse per lo SC. Consensus Conference Modelli gestionali nello SC.ello SC.

The Epidemiology of Heart Failure
• Quality of life / Mortality
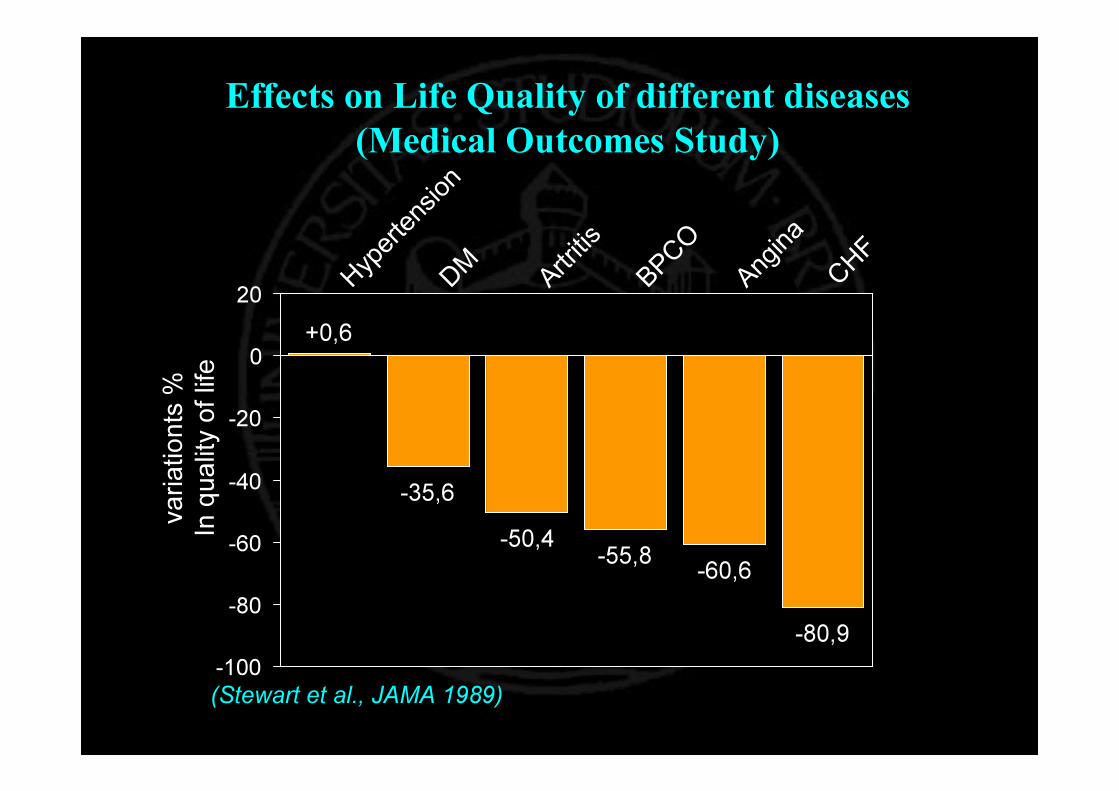
Effects on Life Quality of different diseases (Medical Outcomes Study)
+0,6
-35,6-50,4 -55,8 -60,6
-80,9-100
-80
-60
-40
-20
0
20 H y pe r t e
n s i on
D M A r t ri t i s
B P CO
A n gi n a
C HF
varia
tionts
%
In qu
ality
of life
(Stewart et al., JAMA 1989)
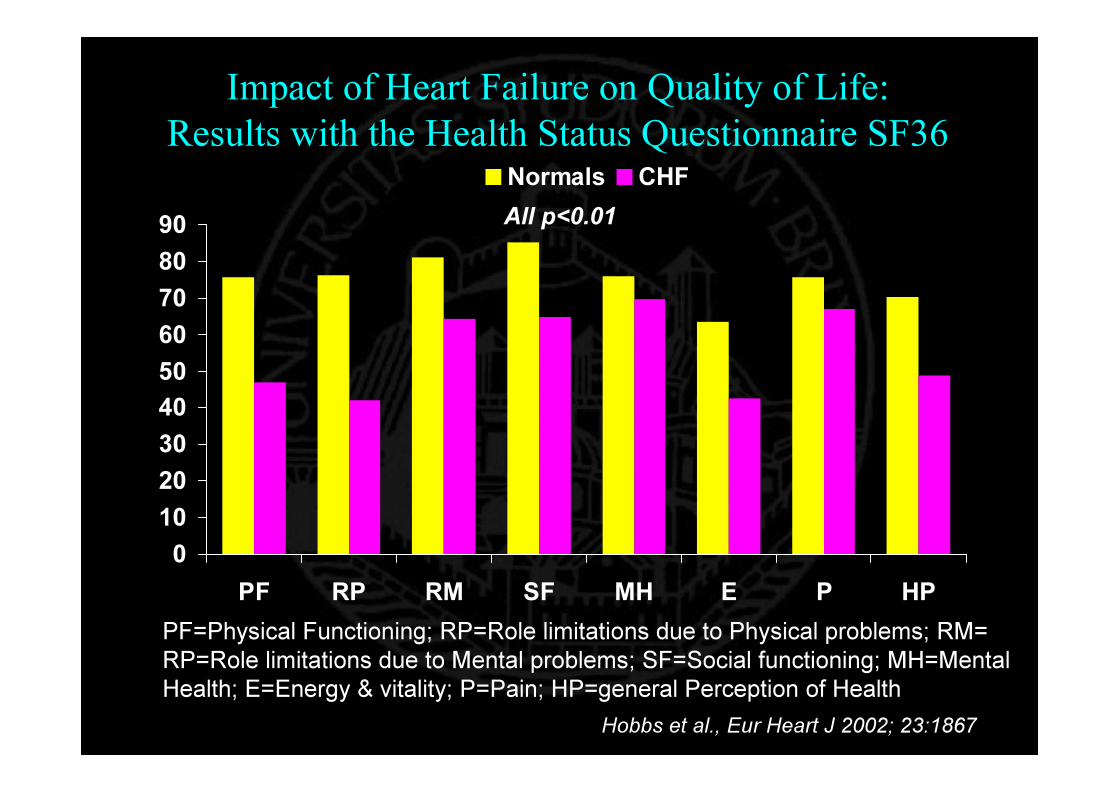
Impact of Heart Failure on Quality of Life:Results with the Health Status Questionnaire SF36
0102030405060708090
PF RP RM SF MH E P HP
Normals CHF
PF=Physical Functioning; RP=Role limitations due to Physical problems; RM= RP=Role limitations due to Mental problems; SF=Social functioning; MH=Mental Health; E=Energy & vitality; P=Pain; HP=general Perception of Health
All p<0.01
Hobbs et al., Eur Heart J 2002; 23:1867

Impact of Heart Failure on Quality of Life:Results with the Health Status Questionnaire SF36
0102030405060708090
Physical Functioning Social functioning
Normals CHF Angina Prior MIHBP Arthritis Bronchitis Depression
Hobbs et al., Eur Heart J 2002; 23:1867

0
2
4
6
8
< 5% 5% - 17% >= 18%
P<0,001 P<0,001P<0,0001
Percentage of LV with PET mismatch
Metabolics equivalents
Myocardial viability to predictimprovement in exercise capacity
Di Carli MF Curr Opin Cardiol 1998;13:415-24
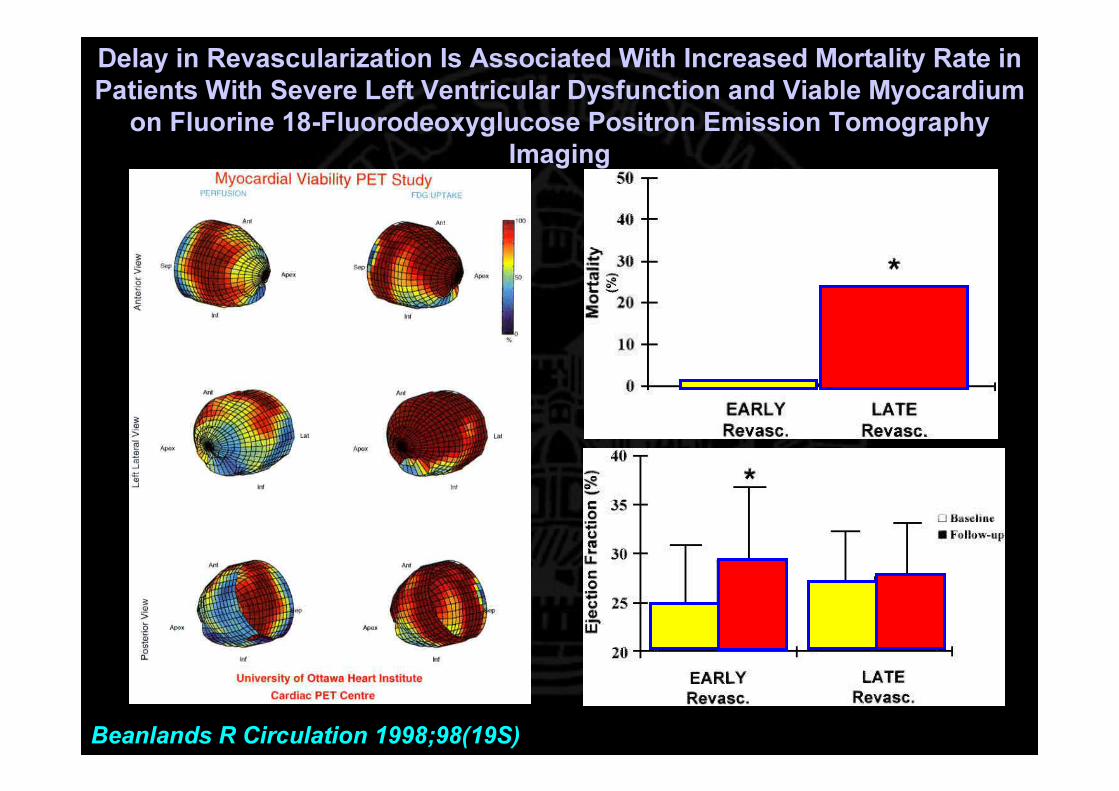
Delay in Revascularization Is Associated With Increased Mortality Rate in Patients With Severe Left Ventricular Dysfunction and Viable Myocardium
on Fluorine 18-Fluorodeoxyglucose Positron Emission Tomography Imaging
Beanlands R Circulation 1998;98(19S)
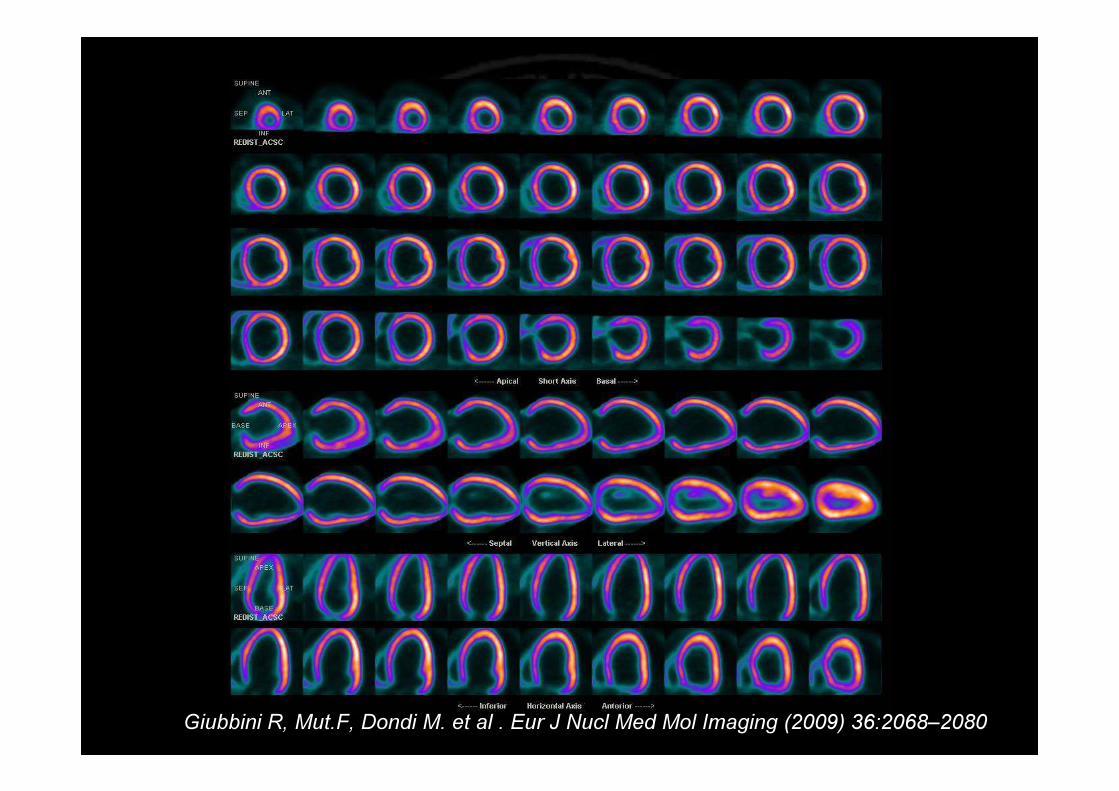
Giubbini R, Mut.F, Dondi M. et al . Eur J Nucl Med Mol Imaging (2009) 36:2068–2080
Giubbini R, Mut.F, Dondi M. et al . Eur J Nucl Med Mol Imaging (2009) 36:2068–2080
45
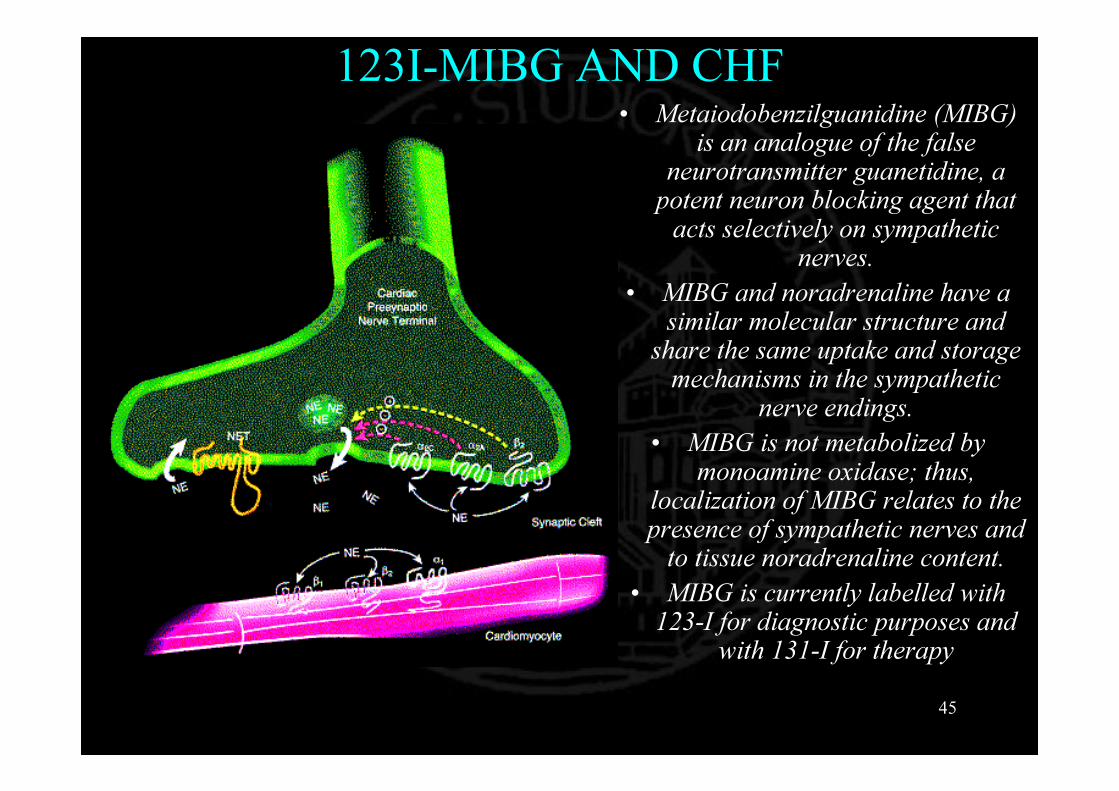
123I-MIBG AND CHF• Metaiodobenzilguanidine (MIBG)
is an analogue of the false neurotransmitter guanetidine, a potent neuron blocking agent that acts selectively on sympathetic
nerves. • MIBG and noradrenaline have a
similar molecular structure and share the same uptake and storage mechanisms in the sympathetic
nerve endings. • MIBG is not metabolized by
monoamine oxidase; thus, localization of MIBG relates to the presence of sympathetic nerves and to tissue noradrenaline content.
• MIBG is currently labelled with 123-I for diagnostic purposes and
with 131-I for therapy


Attività somministrata 370 MBqAcquisizione precoceAcquisizione Tardiva
Metodo 1 Metodo 3Cuore Mediastino Cuore Mediastino Cuore Mediastino Cuore Mediastino
Totale 107306 71225 58279 49346 Totale 715328 71225 419205 49346Minimo 527 298 268 202 Minimo 363 298 215 202Massimo 768 446 420 322 Massimo 768 446 420 322Area 167 192 168 193 Area 1330 192 1347 193
Conteggi corretti per il decadimento
Metodo 1 Metodo 3Cuore Mediastino Cuore Mediastino Cuore Mediastino Cuore Mediastino
CD/MBq 1,74 1,00 1,15 0,85 CD/MBq 1,45 1,00 1,03 0,85
Cardiac I-123 MIBG
Metodo 1 Media ± SDMetodo 3 Media ± SD33,6% 23,0 ± 6,4 28,9% 22,3 ± 8,1
H Precoce 1,74 1,48 ± 0,29 1,45 2,01 ± 0,43H Tardiva 1,15 0,93 ± 0,22 1,03 1,30 ± 0,30M Precoce 1,00 0,77 ± 0,12 1,00 0,91 ± 0,15M Tardiva 0,85 0,47 ± 0,10 0,85 0,58 ± 0,10H/M Precoce 1,73 1,89 ± 0,14 1,45 2,15 ± 0,30H/M Tardiva 1,36 1,93 ± 0,16 1,22 2,16 ± 0,17
Precoce Tardiva
ParametroWashout
28/11/2006 10.5128/11/2006 14.47
Precoce Tardiva
Precoce Tardiva
Precoce Tardiva

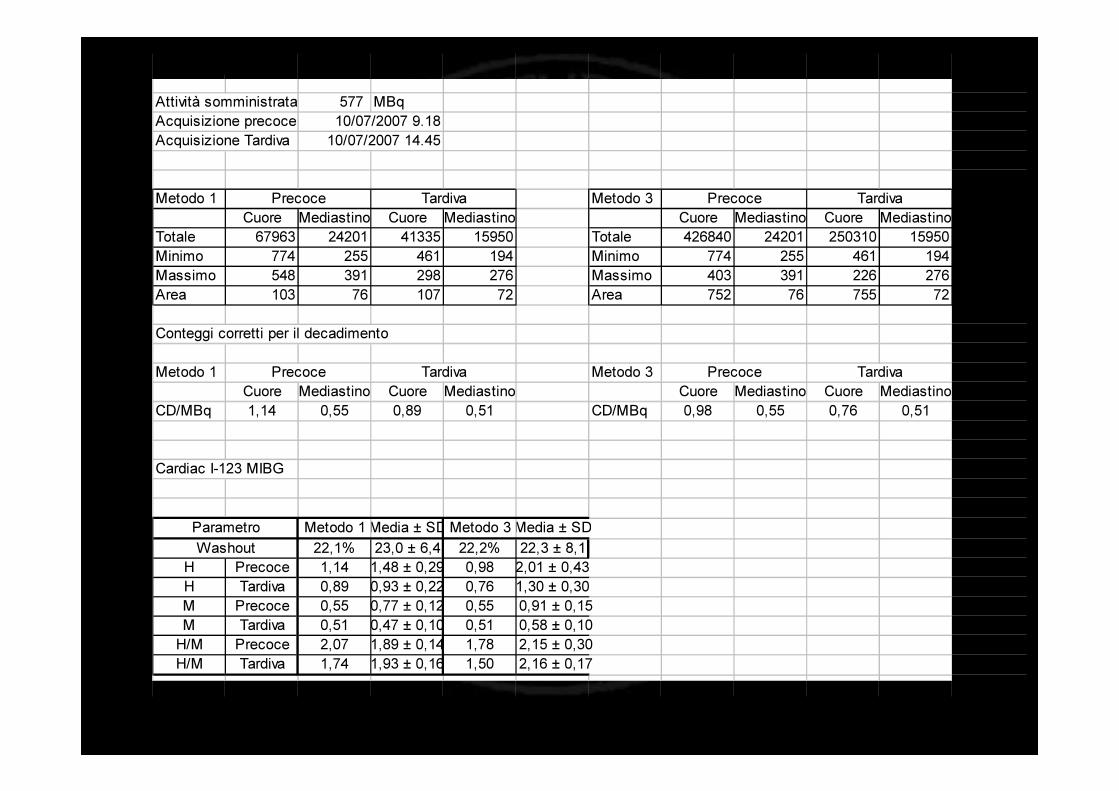
Attività somministrata 577 MBqAcquisizione precoceAcquisizione Tardiva
Metodo 1 Metodo 3Cuore Mediastino Cuore Mediastino Cuore Mediastino Cuore Mediastino
Totale 67963 24201 41335 15950 Totale 426840 24201 250310 15950Minimo 774 255 461 194 Minimo 774 255 461 194Massimo 548 391 298 276 Massimo 403 391 226 276Area 103 76 107 72 Area 752 76 755 72
Conteggi corretti per il decadimento
Metodo 1 Metodo 3Cuore Mediastino Cuore Mediastino Cuore Mediastino Cuore Mediastino
CD/MBq 1,14 0,55 0,89 0,51 CD/MBq 0,98 0,55 0,76 0,51
Cardiac I-123 MIBG
Metodo 1 Media ± SD Metodo 3 Media ± SD22,1% 23,0 ± 6,4 22,2% 22,3 ± 8,1
H Precoce 1,14 1,48 ± 0,29 0,98 2,01 ± 0,43H Tardiva 0,89 0,93 ± 0,22 0,76 1,30 ± 0,30M Precoce 0,55 0,77 ± 0,12 0,55 0,91 ± 0,15M Tardiva 0,51 0,47 ± 0,10 0,51 0,58 ± 0,10H/M Precoce 2,07 1,89 ± 0,14 1,78 2,15 ± 0,30H/M Tardiva 1,74 1,93 ± 0,16 1,50 2,16 ± 0,17
ParametroWashout
Precoce Tardiva
Precoce Tardiva Precoce Tardiva
10/07/2007 9.1810/07/2007 14.45
Precoce Tardiva

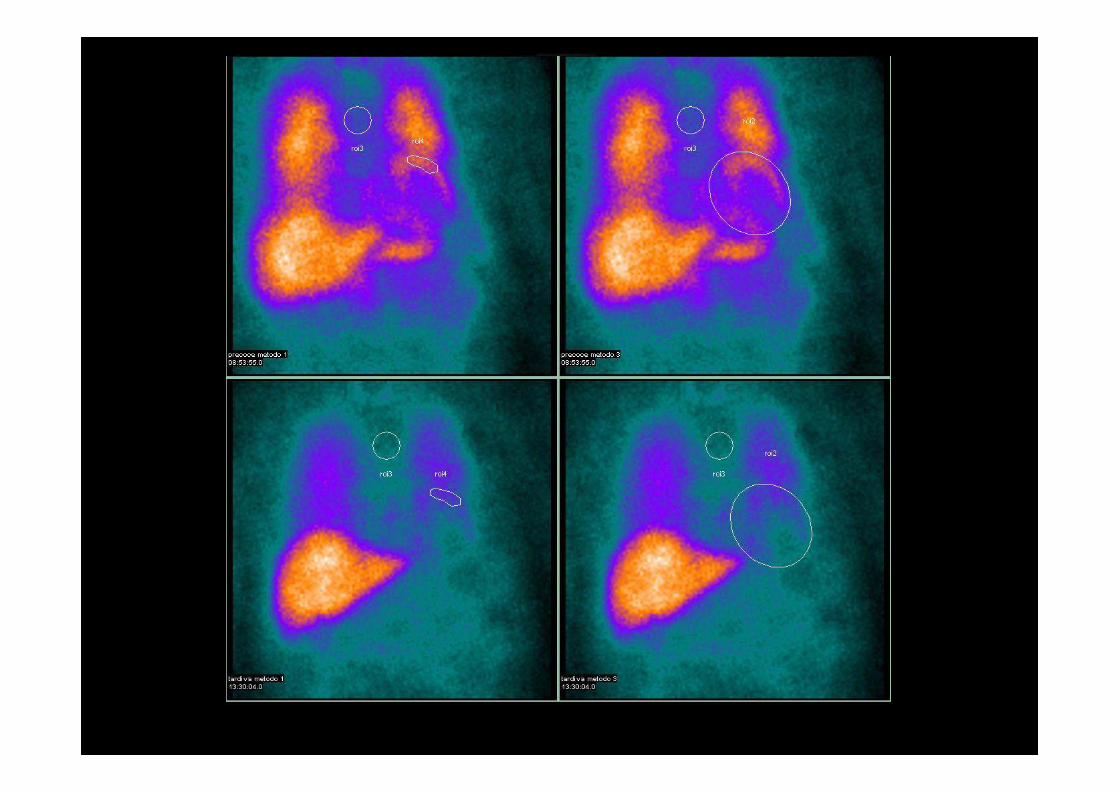
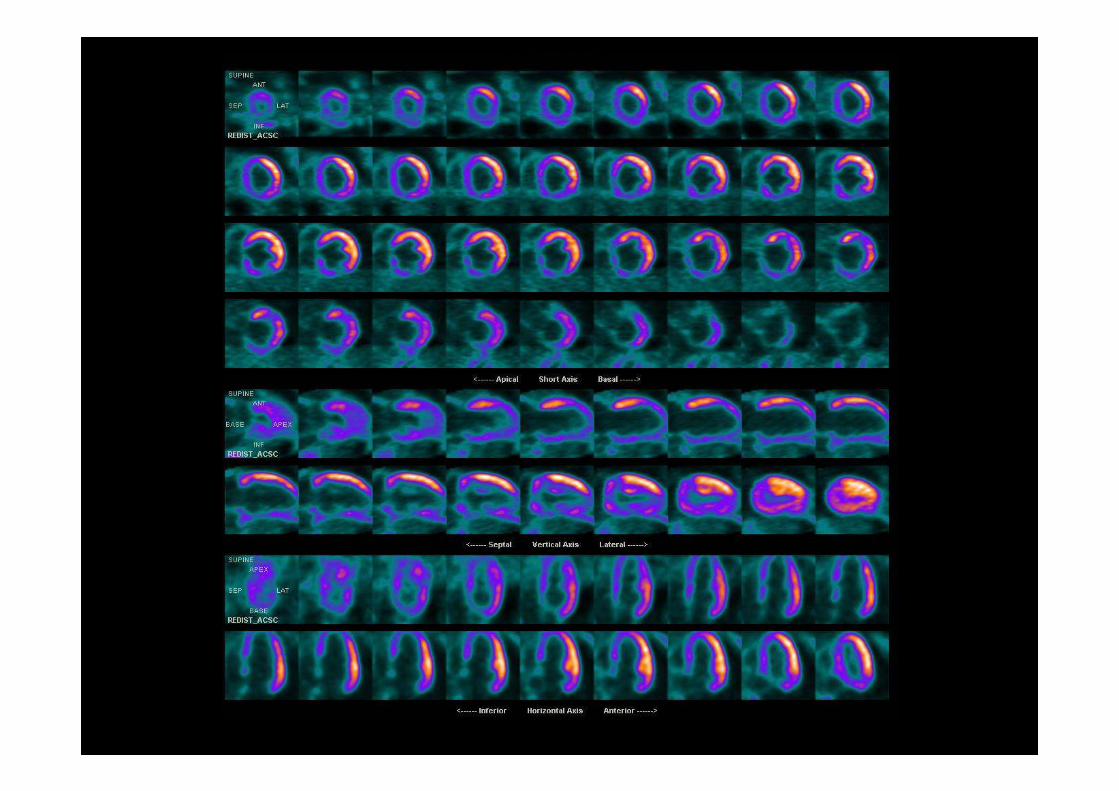
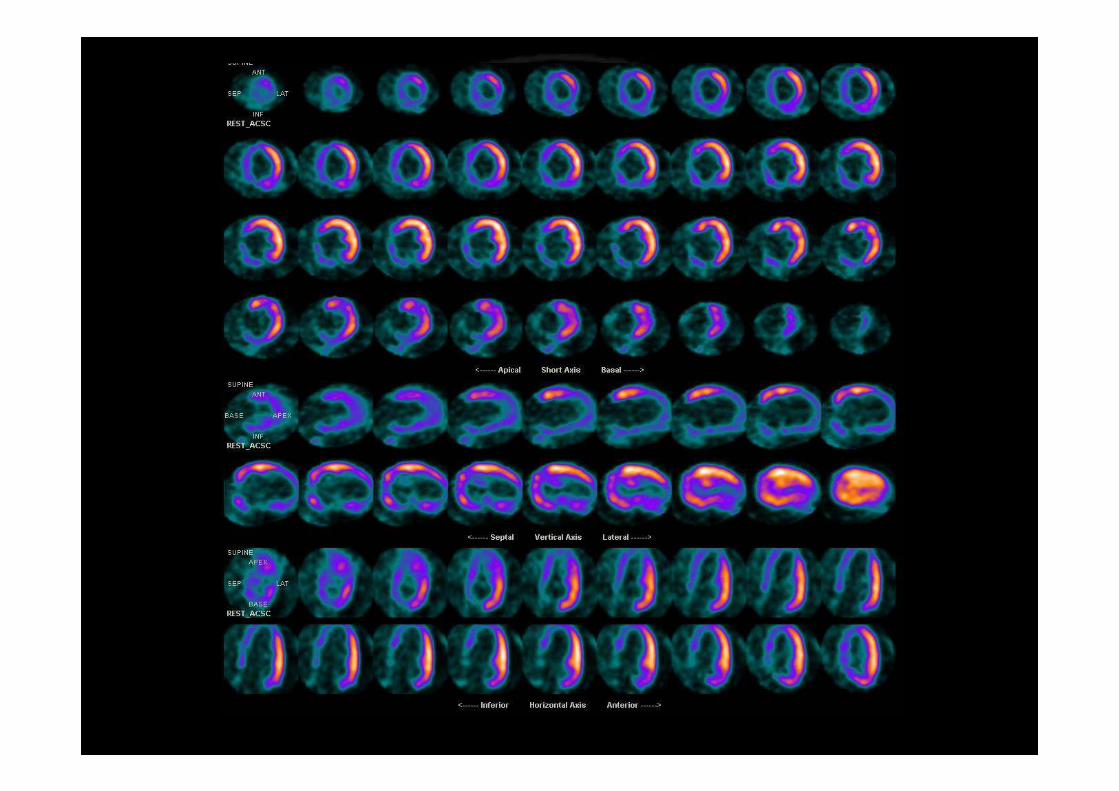
• Both viability and heart innervation study may be necessary to predict improvement

COMET: Subsequent Mortality in the Patients with HF hospitalization vs those without
Time (years)
Perce
ntage
Mort
ality
(%)
0
20
40
60
0 1 2 3 4 5
632 436 273 142 341862 1724 1598 1407 523
No WHF hospitalizationWHF Hospitalization
Metra et al., Circulation 2004; 110(supplement III):III-431
P < 0.001

Outcome of patients hospitalized for HFStudy (Acronym) Year No. Days of
hosp
Mortality
Rehosp,%
In-hosp, % FU %
Cleland et al. (EuroHF) 2003 11,327 11+8 3 ms: 13 3 ms:
35.6Di Lenarda et al.
(TEMISTOCLE) 2003 2,127 11 5.6 6 ms: 15.5 44.6Lee et al. (EFFECT) 2003 4,031 … 8.9 1 y: 32.9 …Rudiger et al., 2005 312 11.5 8 6 ms: 18Adams (ADHERE) 2005 107,362 4 4 … …O’Connor et al.
(IMPACT) 2005 567 8+7 2 ms: 8.5 2 mts: 25.7
OPTIMIZE-HF 2005 48,612 4 4 6 ms: 9 30Goldberg et al., 2005 2,604 4 5.1Tavazzi et al. 2006 2,807 9 7.3 6 ms:12.8 38.1Zannad, (EFICA) 2006 581 15 1 y: 46.5
Ms = months
InIn--hospital mortality: 4hospital mortality: 4--9%9%66--months mortality: 9months mortality: 9--15%15%66--months rehospitalizations, 30months rehospitalizations, 30--45%45%
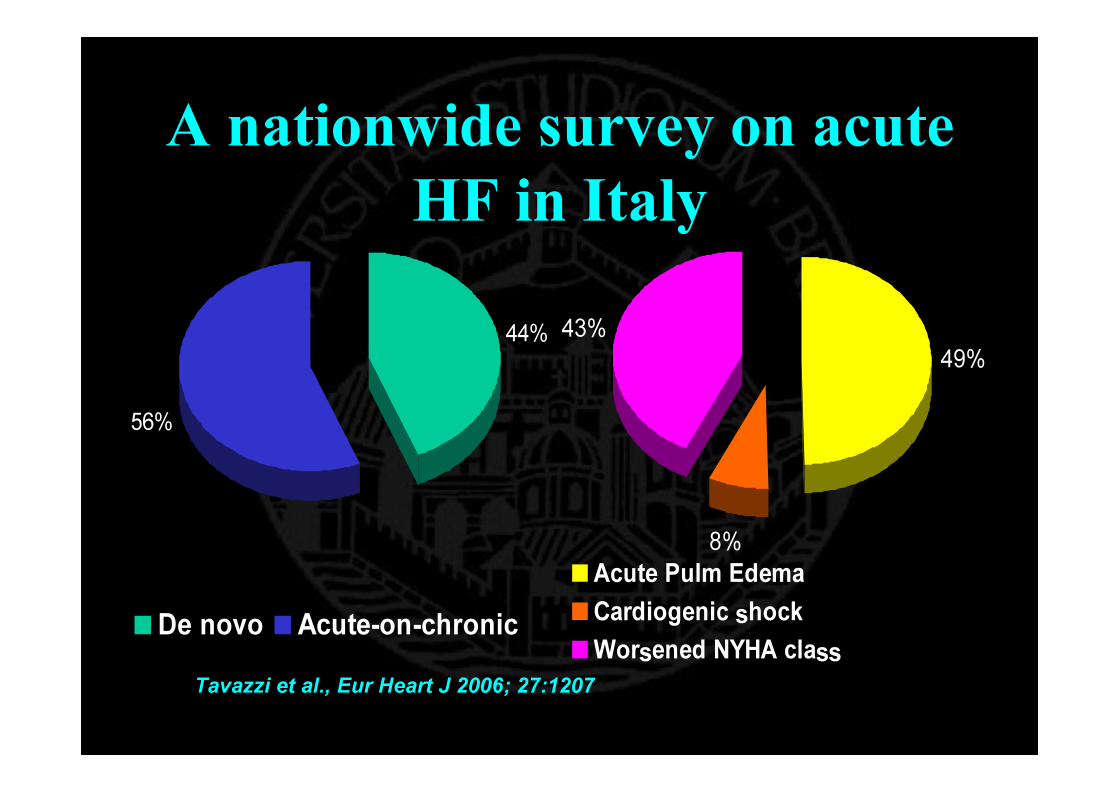
A nationwide survey on acute HF in Italy
44%
56%
De novo Acute-on-chronic
49%
8%
43%
Acute Pulm EdemaCardiogenic shockWorsened NYHA class
Tavazzi et al., Eur Heart J 2006; 27:1207

Italian A-HF Survey: Independent predictors of in-hospital all-cause mortalityVariable P valueIntravenous inotropes <0.0001Elevated troponin 0.0071Prior revascularization 0.048SBP at admission <0.0001Age 0.0004
Haemoglobin 0.01Sodium 0.027
Tavazzi et al., Eur Heart J 2006; 27:1207

All-cause In-hospital Mortality According to SBP at Admission: Italian
Survey on Acute HF 15,3
7,8
4,12,2
024681012141618
<119 120-139 140-161 >161Systolic blood pressure, mm Hg
Morta
lity, %
Eur Heart J 2006; 27:1207

Fram. Men* Fram. Women* Hillingdon* ATLASSOLVD-t SOLVD-t DIGSHIPS** Framingham, Hillingdon and SHIPS data include only patients surviving ≥90 days from diagnosis
Prognosis of chronic heart failure
0102030405060708090100
0 1 2 3 4 5Years
50% Survival
%
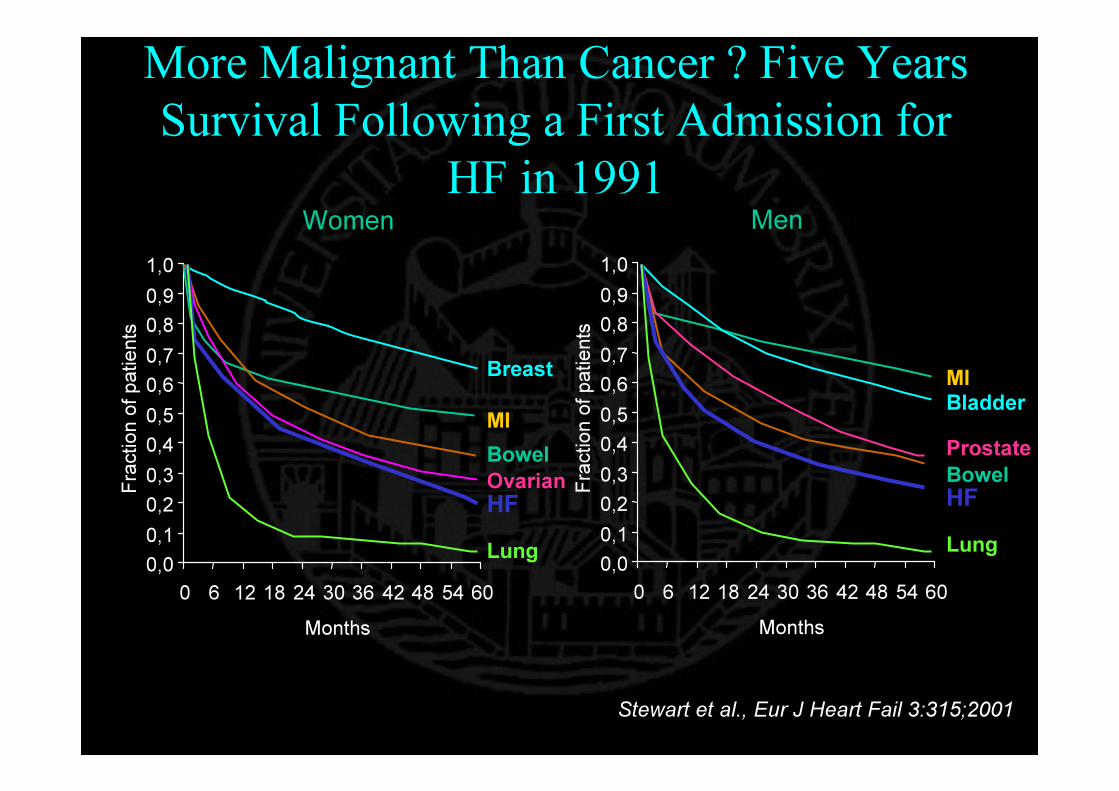
Women
0,00,10,20,30,40,50,60,70,80,91,0
0 6 12 18 24 30 36 42 48 54 60Months
Fracti
on of
patie
nts
Men
0,00,10,20,30,40,50,60,70,80,91,0
0 6 12 18 24 30 36 42 48 54 60Months
Fracti
on of
patie
nts
Breast
MIBowelOvarianHFLung
MIBladderProstateBowelHFLung
More Malignant Than Cancer ? Five Years Survival Following a First Admission for
HF in 1991
Stewart et al., Eur J Heart Fail 3:315;2001
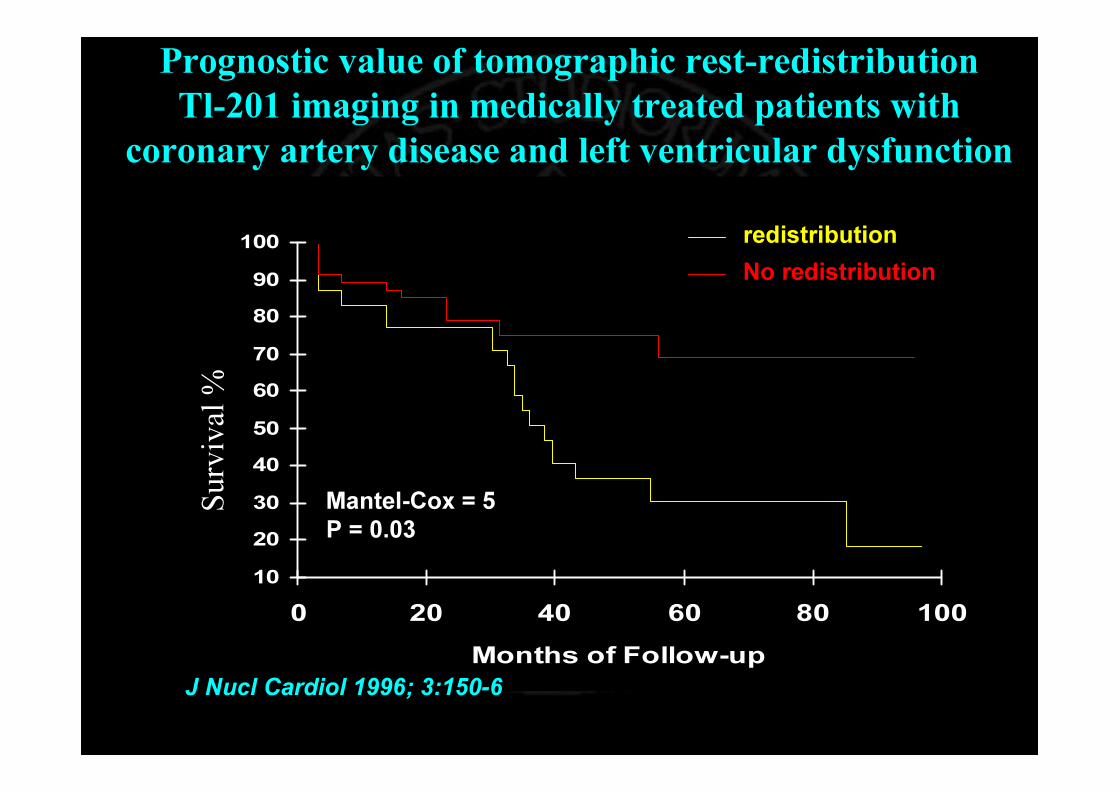
Prognostic value of tomographic rest-redistribution Tl-201 imaging in medically treated patients with
coronary artery disease and left ventricular dysfunction
10
20
30
40
50
60
70
80
90
100
0 20 40 60 80 100Months of Follow-up
redistributionNo redistribution
Mantel-Cox = 5P = 0.03
Surv
ival
%
J Nucl Cardiol 1996; 3:150-6

• G. La Canna G, Rahimtoola SH, Giubbini R et al. Eur Heart J 2000 21, 1358–1367
Sensitivity, specificity, and predictive accuracies of non-invasive tests, singly and in combination, for diagnosis of hibernating myocardium
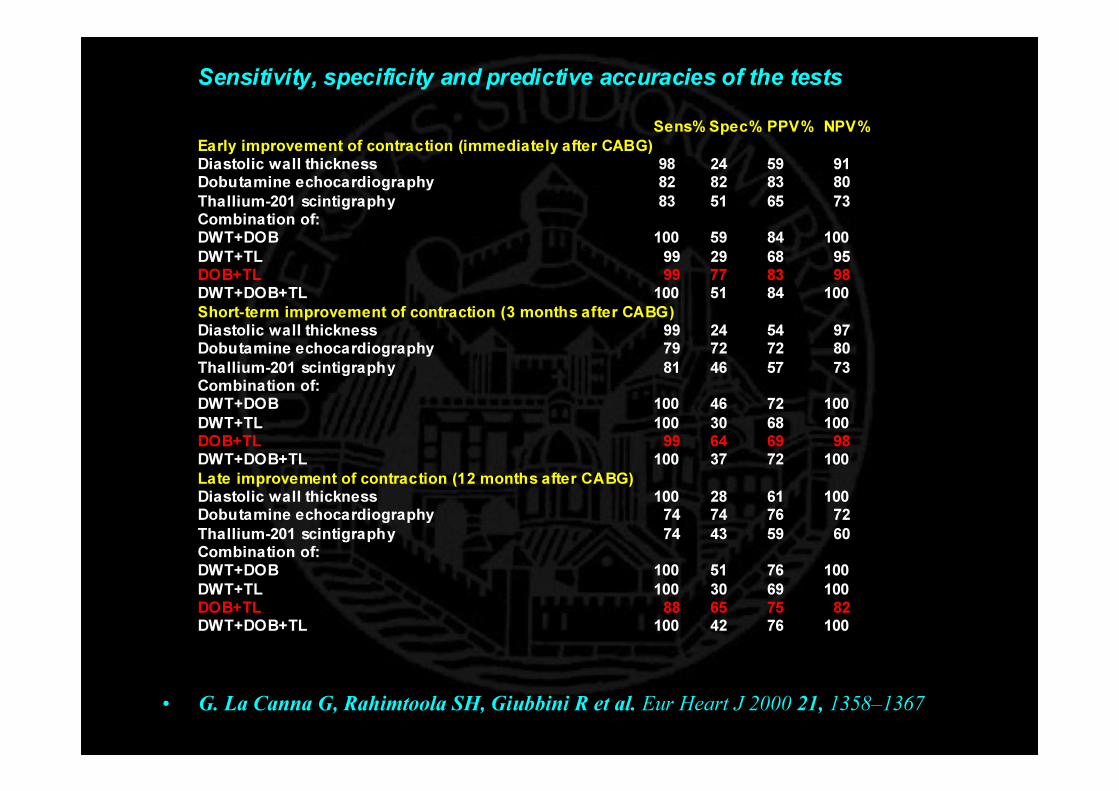
• G. La Canna G, Rahimtoola SH, Giubbini R et al. Eur Heart J 2000 21, 1358–1367
Sensitivity, specificity and predictive accuracies of the tests
Sens% Spec% PPV% NPV% Early improvement of contraction (immediately after CABG) Diastolic wall thickness 98 24 59 91 Dobutamine echocardiography 82 82 83 80 Thallium-201 scintigraphy 83 51 65 73 Combination of: DWT+DOB 100 59 84 100 DWT+TL 99 29 68 95 DOB+TL 99 77 83 98 DWT+DOB+TL 100 51 84 100 Short-term improvement of contraction (3 months after CABG) Diastolic wall thickness 99 24 54 97 Dobutamine echocardiography 79 72 72 80 Thallium-201 scintigraphy 81 46 57 73 Combination of: DWT+DOB 100 46 72 100 DWT+TL 100 30 68 100 DOB+TL 99 64 69 98 DWT+DOB+TL 100 37 72 100 Late improvement of contraction (12 months after CABG) Diastolic wall thickness 100 28 61 100 Dobutamine echocardiography 74 74 76 72 Thallium-201 scintigraphy 74 43 59 60 Combination of: DWT+DOB 100 51 76 100 DWT+TL 100 30 69 100 DOB+TL 88 65 75 82 DWT+DOB+TL 100 42 76 100

Death Rates with and without ViabilityRevascularization vs. Medical TherapyRevascularization vs. Medical Therapy
3,2
6.27.7
16.0
0
5
10
15
20
Cardiac Death Rates (%/yr)
ViableRevasc Medical Rx Revasc Medical Rx
Non-Viable
-79.64%
23.04%χχ22=147, =147, p<.0001p<.0001
χ2=1.43, p=0.23
Allman KC et al. JACC 2002;1151-8
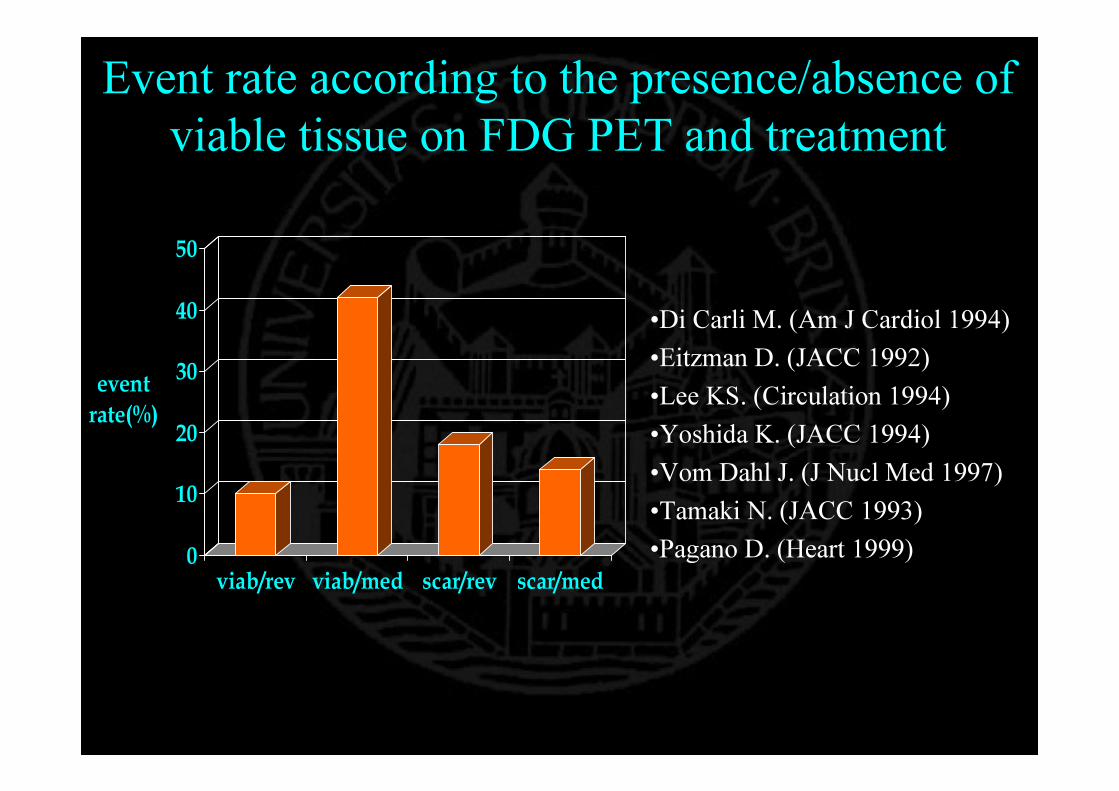
Event rate according to the presence/absence of viable tissue on FDG PET and treatment
0
10
20
30
40
50
event rate(%)
viab/rev viab/med scar/rev scar/med
•Di Carli M. (Am J Cardiol 1994)•Eitzman D. (JACC 1992)•Lee KS. (Circulation 1994)•Yoshida K. (JACC 1994)•Vom Dahl J. (J Nucl Med 1997)•Tamaki N. (JACC 1993)•Pagano D. (Heart 1999)

Variable chi2 Hazards ratio 95% CI P value
Ejection fraction at baseline 1.4 1.0 0.9–1.1 0.2
Viable segments 6.7 1.2 1.1–1.5 <0.01
Non-viable segments 0.1 0.9 0.7–1.2 0.8
Coronary revascularization 12.2 0.3 0.1–0.6 <0.001
Survival benefit after revascularization is independent of left ventricular ejection fraction improvement in patients with
previous myocardial infarction and viable myocardium
Acampa W et al. Eur J Nucl Med Mol Imaging. 2005;32(4):430-7

Sudden cardiac death: key points♥ Sudden cardiac death (SCD) is a major cause of death in the growing population of patients with heart failure♥ Ventricular arrhythmias have been documented in up to 85% of patients with severe congestive heart failure♥ Patients with severe left ventricular (LV) systolic dysfunction are among those at greatest risk for SCD♥ To date, no single test reliably predicts arrhythmic risk in patients with heart failure♥ Optimal medical treatment will improve prognosis and reduce the risk of SCD in heart failure patients♥ The implantable cardioverter-defibrillator (ICD) effectively treats malignant ventricular arrhythmias and is indicated for the secondary prevention of SCD♥ There is growing evidence for the use of the ICD for the primaryprevention of SCD
Lane RC et al. Heart 2005;91:674–680.
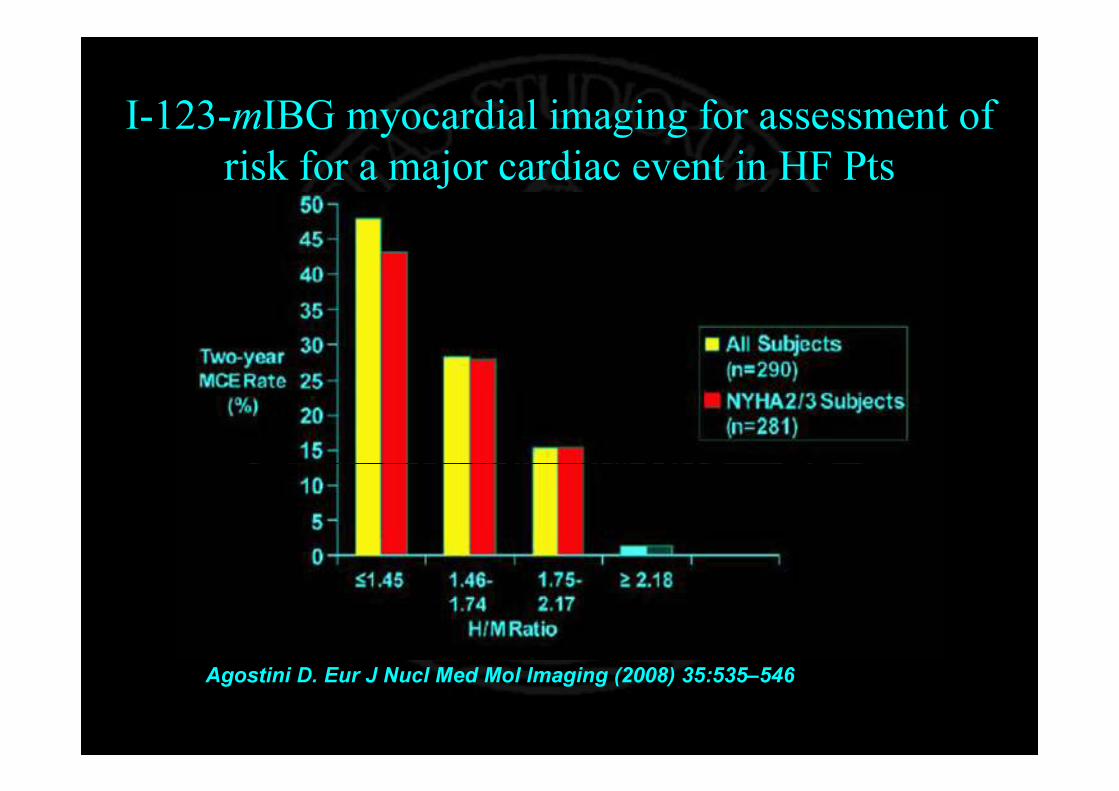
I-123-mIBG myocardial imaging for assessment of risk for a major cardiac event in HF Pts
Agostini D. Eur J Nucl Med Mol Imaging (2008) 35:535–546
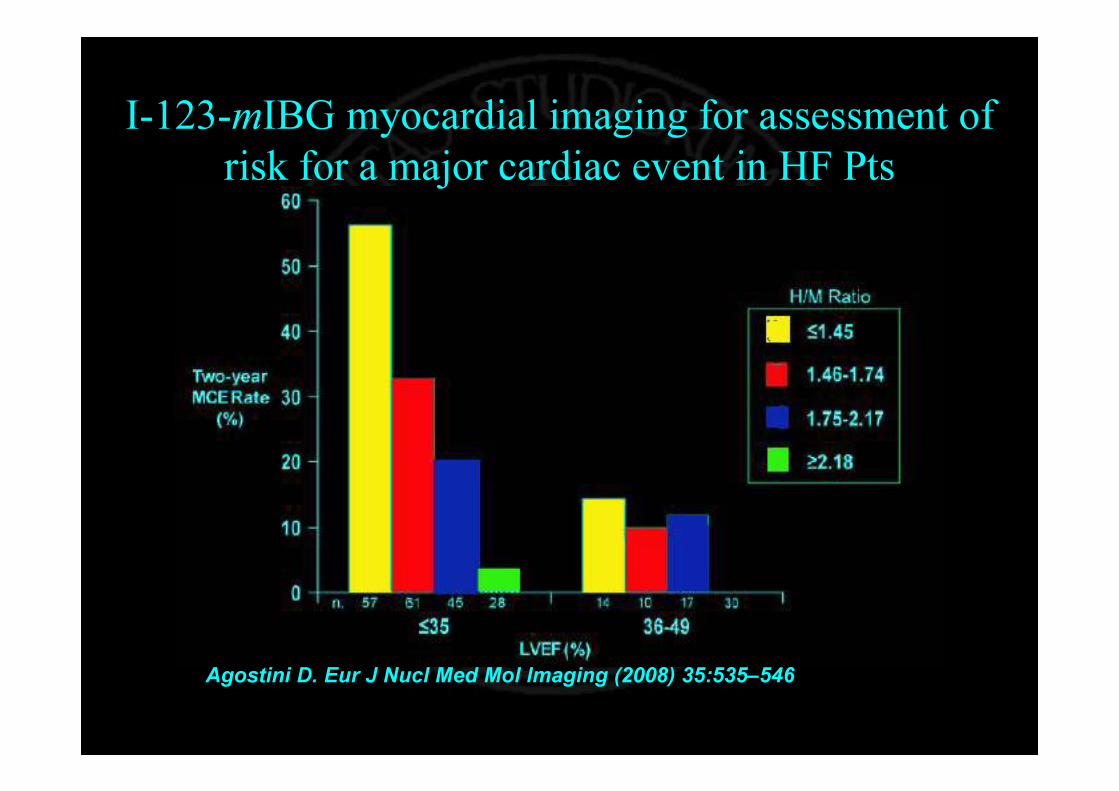
I-123-mIBG myocardial imaging for assessment of risk for a major cardiac event in HF Pts
Agostini D. Eur J Nucl Med Mol Imaging (2008) 35:535–546
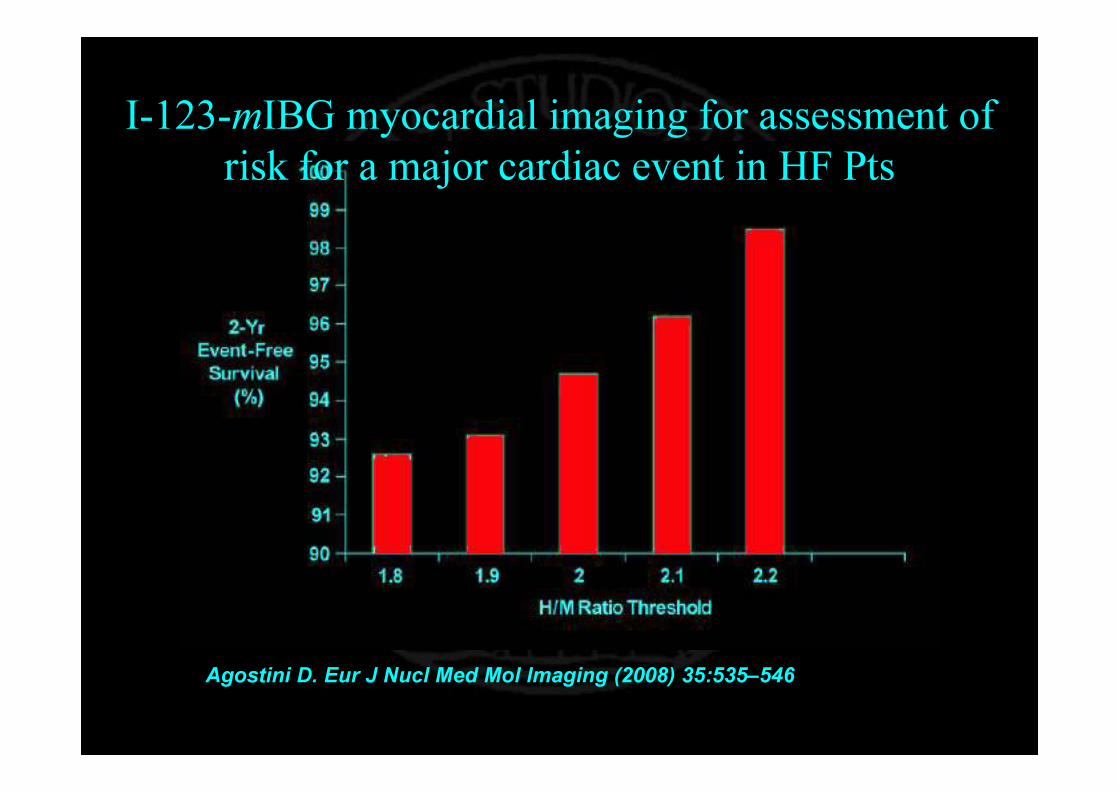
I-123-mIBG myocardial imaging for assessment of risk for a major cardiac event in HF Pts
Agostini D. Eur J Nucl Med Mol Imaging (2008) 35:535–546
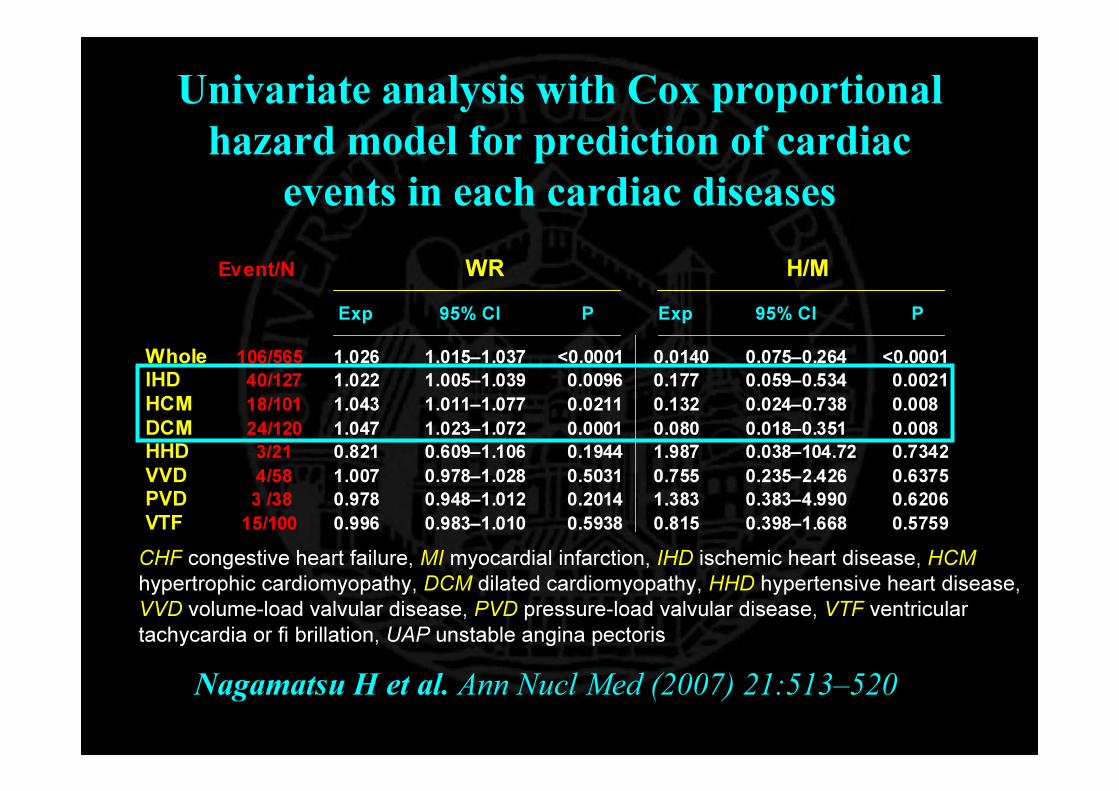
Univariate analysis with Cox proportional hazard model for prediction of cardiac
events in each cardiac diseases
Event/N WR H/M
Exp 95% CI P Exp 95% CI P
Whole 106/565 1.026 1.015–1.037 <0.0001 0.0140 0.075–0.264 <0.0001 IHD 40/127 1.022 1.005–1.039 0.0096 0.177 0.059–0.534 0.0021 HCM 18/101 1.043 1.011–1.077 0.0211 0.132 0.024–0.738 0.008 DCM 24/120 1.047 1.023–1.072 0.0001 0.080 0.018–0.351 0.008 HHD 3/21 0.821 0.609–1.106 0.1944 1.987 0.038–104.72 0.7342 VVD 4/58 1.007 0.978–1.028 0.5031 0.755 0.235–2.426 0.6375 PVD 3 /38 0.978 0.948–1.012 0.2014 1.383 0.383–4.990 0.6206 VTF 15/100 0.996 0.983–1.010 0.5938 0.815 0.398–1.668 0.5759
Nagamatsu H et al. Ann Nucl Med (2007) 21:513–520
CHF congestive heart failure, MI myocardial infarction, IHD ischemic heart disease, HCM hypertrophic cardiomyopathy, DCM dilated cardiomyopathy, HHD hypertensive heart disease, VVD volume-load valvular disease, PVD pressure-load valvular disease, VTF ventricular tachycardia or fi brillation, UAP unstable angina pectoris
The Epidemiology of Heart Failure
• Resource utilization
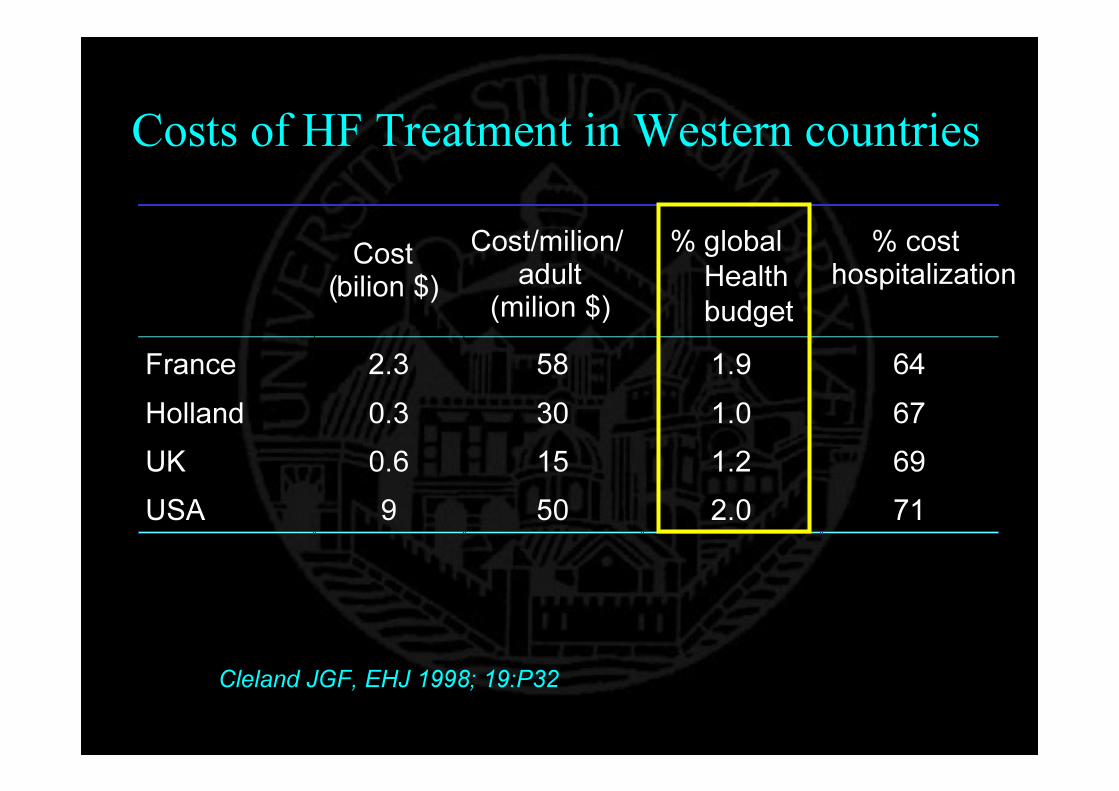
Costs of HF Treatment in Western countries
Cost(bilion $)
Cost/milion/adult
(milion $)% global
Healthbudget
% costhospitalization
France 2.3 58 1.9 64Holland 0.3 30 1.0 67UK 0.6 15 1.2 69USA 9 50 2.0 71
Cleland JGF, EHJ 1998; 19:P32
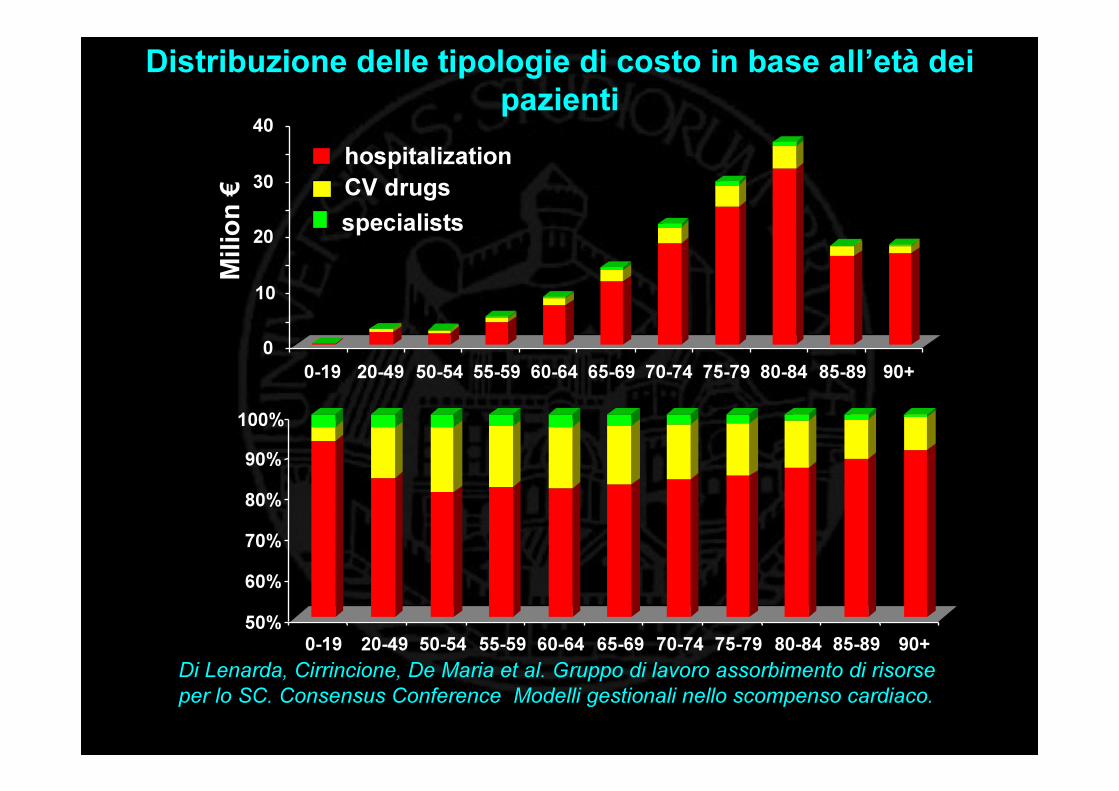
hospitalizationCV drugsspecialists
Distribuzione delle tipologie di costo in base all’età dei pazienti
50%
60%
70%
80%
90%
100%
0-19 20-49 50-54 55-59 60-64 65-69 70-74 75-79 80-84 85-89 90+
0
10
20
30
40
0-19 20-49 50-54 55-59 60-64 65-69 70-74 75-79 80-84 85-89 90+
Mili
on €
Di Lenarda, Cirrincione, De Maria et al. Gruppo di lavoro assorbimento di risorse per lo SC. Consensus Conference Modelli gestionali nello scompenso cardiaco.

Forecasts…• Prevalence
– Increasing• Hospitalizations
– Increasing • Economic impact
– Severely increasing• Mortality
– Likely decreasing (slightly)• Quality of life
– ??
GSPECT ?
MIBG ?
PET-FDG ?
Nuclear Cardiology and HF