Embed Size (px)
Citation preview
Used in over Used in over 300,000300,000
classrooms!classrooms!
by Peggy Healy Stearnsby Peggy Healy Stearns
www.tomsnyder.comwww.tomsnyder.comMac/Win CD-ROMMac/Win CD-ROM
®
Used in over Used in over 300,000300,000
classrooms!classrooms!
by Peggy Healy Stearns, Ph.D.by Peggy Healy Stearns, Ph.D.
www.tomsnyder.comwww.tomsnyder.comMac/Win CD-ROMMac/Win CD-ROM
ii
The Graph Club 2.0 Teacher’s Guide
Credits
Publisher: Richard AbramsEditor-in-Chief: David Dockterman
* * * * *
Thanks to the team atTom Snyder Productions:Carl Adams, Mark Airey, Seth Alpert, Phillip Andrews, Amy Ashman, Igor Biryukov,Meghan Cahill, Ronan Campbell, John Carroll,Andrea Castellanos, Amy Conklin, BeckyConners, Rachel Cook, Jonas Cox, NancyCsaplar, Elizabeth Davis, Stacey Dell’Anno,Gail Dinkelkamp, Patrick Downie, Erin Earnst,Hedrick Ellis, Jack Ferraiolo, Maria Flanagan,Alan Foreman, Aya Fukuda, Sean Gallagher,Todd Gantzer, David Gibbons, Peter Giglio,Terry Gilligan, Dorothea Gillim, Eric Gitelson,Kim Goodman, Alicia Gregoire, Lisa Hamanaka,Lauren Harman, Arlene Hawkins, Niki Hebert,Debbie Hodin, Mark Hoffmann, Steven Huff,Marc Hughes, Andrew Kay, Denis Knjazihhin,Laura Kozuh, Aidas Kupcinskas, Will Lipchitz,Inga Logan McCarthy, Andre Lyman, MartyLyman, John McAndrew, Brian McCabe, BrianMcKean, Marie-Claude Mendy, Cory Mitchell,Fatimah Moore, Brian O’Mara, David O’Neil,Kim O’Neil, Edie Perkins, Ruta Puskorius,Paula Rheaume, Lenora Robinson, StephenRogan, Tyler Ronald, Amy Ronayne, JohnSacco, David SanAngelo, Michael Scott, JohnSimpson, Jody Snider, Tim Snyder, Arlene Steele,David Tata, Kathryn Terwilliger, Mark Usher,Catherine Weicker, Scott Whidden, RachaelWilcox, Damon Wong, Jleaugen Wong, Amy Yau
Copyright Notice© 1993–2003 Tom Snyder Productions, Inc. All rights reserved. Tom Snyder Productionsand The Graph Club are registered trademarksof Tom Snyder Productions, Inc.
Macintosh is a registered trademark of AppleComputer, Inc. Windows is a registeredtrademark of Microsoft Corporation.
QuickTime and the QuickTimelogo are trademarks used underlicense. The QuickTime logo isregistered in the U.S. and othercountries.
This document and the software described in it may not, in whole or part, be copied,photocopied, reproduced, translated, orreduced to any electronic medium or machine-readable form other than that whichhas been specified herein without prior writtenconsent from Tom Snyder Productions, Inc.
The Graph Club 2.0 upgrade
Product Development and ManagementJessica Adler, Ikay Iwobi
EngineeringSoftware MacKievProduct Manager: Andrei ProkopetsProgrammers: Alexander Gomenyuk,Gennadiy Kis, Eugene Limonov, AndreyIshutin, Alexey Navrosky, Andrey BoichukQuality Assurance: Andrey Piskun, AlexeyKorneyev, Roman Muzh, Maxim Loboda,Ruslan Dorozhovets, Oleg Krivokobylskii,Anton Kuzmenko
Tom Snyder ProductionsProgramming Support: Eric HilferQuality Assurance: Kevin Kennedy-Spaien,Mark Lynch, Zlatka Fitneva
Art and DesignSoftware Interface: David GrotrianSplash Screen & Main Menu Design:Robert ThibeaultSymbols: David Grotrian, Robert Thibeault,Sean Hagan, Robert Keough, Elizabeth Hurley
ActivitiesDesign/Writing: Carrie FinisonAudio Recording & Editing: Ikay IwobiAudio Narration: Sean Hagan, Jamielyn MoscaIntern: Patricia Sullivan-HallProofreading: Melba Wood
Tutorial MovieScript & Storyboard: Carrie FinisonNarration: Jim Woodell, Kim VernerFlash Animation: Robert Thibeault, Sean HaganAudio Editing: Carrie FinisonProgramming: Nelson Wolf
Teacher’s GuideResearch: Peggy Healy StearnsWriting: Jessica Adler, Carrie Finison, Peggy Healy StearnsEditorial Development: Annette DonnellySuggested Reading List: Mary Jo MelvinGraphic Design: Christine Barie, Tina BourgeoisIllustrations: Robert Thibeault, Peter ReynoldsProofreading: Melba Wood
AudioMusic: Gerry and Gordy StearnsEnglish Audio: Peter Reynolds, Jim WoodellSpanish Audio: Yurima Guilarte
The Graph Club - Previous Versions
Product Development and ManagementOriginal Macintosh Version 1.0: Bruce MichaelGreen, Peter ReynoldsMacintosh Version 1.3 Upgrade: Laurel KayneWindows Version 1.0: Jessica Adler
EngineeringOriginal Macintosh Version 1.0: Shawn CokusMacintosh Version 1.3 Upgrade: Sean NolanWindows Version 1.0: Turning Point SoftwareSoftware Project Leader: Jim ParkProgrammers: Bruce Rosenblum, Bryan Dube,Eric VanHeleneProgramming Support: Eytan Bernet
Special thanks to the following educators:Judi Adams, Ellen Baru, Diane Boehm, TimBourne, Karen Brodski, Karen Bryant, GaryCarnow, Barbara Chmura, Megen Cosby, BobbieCunningham, Frances Curcio, Bob Densmore, LoriDeuchar Yum, Pat Dolan, Chris Dowd, LisaDowns, Peter Flyzik, Deb Fridsma, Mirium Furst,Lori Gern, Carolyn Gilbert, Marianne Handler,Meg Henderson, Jackie Lipsitz, Frances Malloway,Michelle Marriott, Kam Matray, Paula McGirr, PatMessina, Karen Michalak, D’Ette Myers, MarilynNicholson, Sharon B. Ogden, Ted Perry, LindaPolin, Joe Proscia, Lydia Shipley, Mary Vesneske,Sally Williams, Judy Yacio, Linda Zadow
For more informationabout Tom Snyder
Productions or for a free catalog,
call us at 1-800-342-0236 or
visit us on the Web atwww.tomsnyder.com
The Graph Club was designed by: Peggy Healy Stearns, Ph.D.
* * * * *

iii
The Graph Club 2.0 Teacher’s Guide
Contents
The Graph Club at a GlanceA Note from the Author . . . . . . . . . . . . . . . . . . . . . . . . . . . . . . . . . . . . . . . . . . .1What Is The Graph Club? . . . . . . . . . . . . . . . . . . . . . . . . . . . . . . . . . . . . . . . . . .2Learning Objectives . . . . . . . . . . . . . . . . . . . . . . . . . . . . . . . . . . . . . . . . . . . . . .4Meeting State & NCTM Standards . . . . . . . . . . . . . . . . . . . . . . . . . . . . . . . . . . .5
Getting StartedWhat You Get & What You Need . . . . . . . . . . . . . . . . . . . . . . . . . . . . . . . . . . . .6Quick Install & Easy Start . . . . . . . . . . . . . . . . . . . . . . . . . . . . . . . . . . . . . . . . . .7WalkThrough . . . . . . . . . . . . . . . . . . . . . . . . . . . . . . . . . . . . . . . . . . . . . . . . . . .8Features & Functions . . . . . . . . . . . . . . . . . . . . . . . . . . . . . . . . . . . . . . . . . . . .21
Ideas for the ClassroomIntroduction . . . . . . . . . . . . . . . . . . . . . . . . . . . . . . . . . . . . . . . . . . . . . . . . . . .37Getting Started in the Primary Grades . . . . . . . . . . . . . . . . . . . . . . . . . . . . . . . .38Graphing with Manipulatives . . . . . . . . . . . . . . . . . . . . . . . . . . . . . . . . . . . . . .40Making the Most of The Graph Club . . . . . . . . . . . . . . . . . . . . . . . . . . . . . . . . .43Choosing the Right Graph Type . . . . . . . . . . . . . . . . . . . . . . . . . . . . . . . . . . . .48Graphing Across the Curriculum . . . . . . . . . . . . . . . . . . . . . . . . . . . . . . . . . . . .49Printing Ideas . . . . . . . . . . . . . . . . . . . . . . . . . . . . . . . . . . . . . . . . . . . . . . . . . .52
ActivitiesIntroduction . . . . . . . . . . . . . . . . . . . . . . . . . . . . . . . . . . . . . . . . . . . . . . . . . . .53Activities Matrix . . . . . . . . . . . . . . . . . . . . . . . . . . . . . . . . . . . . . . . . . . . . . . . .54Math . . . . . . . . . . . . . . . . . . . . . . . . . . . . . . . . . . . . . . . . . . . . . . . . . . . . . . . .56Social Studies . . . . . . . . . . . . . . . . . . . . . . . . . . . . . . . . . . . . . . . . . . . . . . . . . .68Science . . . . . . . . . . . . . . . . . . . . . . . . . . . . . . . . . . . . . . . . . . . . . . . . . . . . . . .75Language Arts . . . . . . . . . . . . . . . . . . . . . . . . . . . . . . . . . . . . . . . . . . . . . . . . . .83
AssessmentIntroduction . . . . . . . . . . . . . . . . . . . . . . . . . . . . . . . . . . . . . . . . . . . . . . . . . . .87Teacher Assessment Checklists . . . . . . . . . . . . . . . . . . . . . . . . . . . . . . . . . . . . . .89Graph Rubrics . . . . . . . . . . . . . . . . . . . . . . . . . . . . . . . . . . . . . . . . . . . . . . . . .94Student Graph Checklist . . . . . . . . . . . . . . . . . . . . . . . . . . . . . . . . . . . . . . . . . .99Sample Graphs . . . . . . . . . . . . . . . . . . . . . . . . . . . . . . . . . . . . . . . . . . . . . . . .100
ResourcesReading List: Counting . . . . . . . . . . . . . . . . . . . . . . . . . . . . . . . . . . . . . . . . . .105Reading List: Math & Language Arts . . . . . . . . . . . . . . . . . . . . . . . . . . . . . . . .106Math Curriculum Matrix . . . . . . . . . . . . . . . . . . . . . . . . . . . . . . . . . . . . . . . . .108Reproducible Masters . . . . . . . . . . . . . . . . . . . . . . . . . . . . . . . . . . . . . . . . . . .109Index . . . . . . . . . . . . . . . . . . . . . . . . . . . . . . . . . . . . . . . . . . . . . . . . . . . . . . .137

iv
The Graph Club 2.0 Teacher’s Guide

1
The Graph Club 2.0 The Graph Club at a Glance
A Note from the Author
In 1993, after two years of research and development, we released the first version of The Graph Club. The program soon became aclassroom favorite and now, ten years later, is used by millions ofstudents in over 300,000 classrooms nationwide. We are delighted to hear from educators around the country how the program hasenhanced, even revolutionized, the way they teach graphing.
Even more than the honors we’ve won, knowing we’ve made adifference for both teachers and students is our motivation and reward.So it is with great pleasure that we bring you The Graph Club 2.0, a more powerful and versatile program that includes all the addedfeatures you’ve asked for and more — all designed to support yourcurriculum goals.
After ten years, graphing remains an essential skill in almost everysubject area. That’s because graphs, like other kinds of pictures, tell a story at a glance. In this age of information overload, when studentscome to our classrooms visually oriented anyway, graphs are a powerfuladjunct to the written word. We can share this power with our students.When we teach our students to graph, we give them a powerfulcommunication skill.
The Graph Club is designed to do just that. Its highly manipulative and interactive environment helps children make the transition fromgraphing with manipulatives to graphing in the abstract. It also helpsthem see that the same data can be represented differently. Using The Graph Club, students learn to gather, sort, and classify information;they construct graphs, analyze their data, and print their graphs inmultiple sizes. They learn to use graphs to solve problems and makedecisions, and they talk about, write about, and share their graphs.
The Graph Club is an exciting and effective tool that can be used acrossthe curriculum, from math and science to language arts, social studies,and more. We hope you and your students find The Graph Club 2.0 aneven more motivating and effective environment in which to explore,play, think, and learn about the power of graphs.
Peggy Healy Stearns, Ph.D.

2
The Graph Club 2.0 The Graph Club at a Glance
What Is The Graph Club?
Open any newspaper, annual report, or scientific study, and you’ll seeinformation presented in graphs. Graphs are a powerful communicationtool, but they can also be challenging. The Graph Club provides amotivating, manipulative environment that introduces students to the power of graphs and gives them the skills they need to organize,display, and interpret data effectively.
Designed for students in grades K– 4, The Graph Club is an innovativeand easy-to-use tool for creating, exploring, interpreting, and printinggraphs. With The Graph Club, students create and compare up to fivedifferent representations of the same data — a picture graph, bar graph,line graph, circle graph, and table. They describe and interpret graphsin the on-screen notebook, and print their graphs in a variety of layoutsand sizes — from standard to poster size. The program also includes abuilt-in library of cross-curricular activities aligned to state and NCTMstandards.
The Graph Club has been a classroom favorite since 1993. Now, this new version of the program makes teaching and learning about graphs even easier. New features in The Graph Club 2.0 include:• the ability to graph 12 kinds, with a scale maximum of 1000• an on-screen notebook for describing graphs in writing• audio recording and playback for describing graphs orally• over 150 new picture graph symbols organized in categories• the ability to import your own symbols and save them with
the program• over 30 ready-made standards-aligned activities, plus the ability
to create your own activity templates• an animated, built-in tutorial • reproducible assessment tools, including rubrics, checklists,
and sample graphs

3
The Graph Club 2.0 The Graph Club at a Glance
Meets Standards Across the CurriculumThe Graph Club is a versatile tool that supports and enhances graphingactivities across the curriculum. The program comes with more than 30 ready-made activities covering math, science, social studies, andlanguage arts. Over 75 additional activities are available on the Ready-Made Activities CD (sold separately). These activities let you start graphing immediately and also provide ideas and models for your own graphing lessons.
This Teacher’s Guide includes lesson overviews, plus a handy matrix to help you choose activities based on preparation time, content, ordifficulty level. In addition, each of these activities has been correlated to state standards by experienced teachers.
Powerful Printing FeaturesThe Graph Club makes it easy to print graphs for a variety of purposes— from projects and assignments to quizzes and classroom posters.Students can print up to five graphs on a single page. They can also write about their graphs in the on-screen notebook and print thisnotebook text with their graphs. All graphs can be printed in three sizes — standard, big book, or poster. In addition, students can printtheir graphs in solid color, or they can use the pattern or outlineprinting options to save ink.
Assessment Made EasyThe Graph Club offers lots of ways to assess students’ progress. In thisTeacher’s Guide, you’ll find reproducible rubrics and assessment checklistsfor teachers, plus a self-assessment checklist and sample graphs for yourstudents. The built-in notebook is another useful assessment tool. Afterstudents create graphs, they can use the notebook to record descriptions,interpretations, or answers to specific questions. In addition, the printingfeatures make it easy to share students’ progress with administrators or parents.

4
The Graph Club 2.0 The Graph Club at a Glance
Learning Objectives
With The Graph Club, students practice important skills related tographing and data analysis. They learn to:
• Generate questions• Collect data through …
- surveys- observation- research
• Sort and classify data• Construct and interpret …
- picture graphs- bar graphs- circle graphs- line graphs- tables
• Compare graphs• Discover patterns• Make predictions and draw conclusions• Describe graphs orally and in writing• Use graphs to solve problems and make decisions
In addition, The Graph Club includes over 30 ready-made activity filesthat address specific content areas and skills across the curriculum,including:
Math: counting, place value, addition and subtraction, fractions and decimals, estimation, measurement, money, patterns, shapes
Science: animals and plants, weather, seasons, experiments, nutrition
Social Studies: holidays, immigration, cities, states and countries, community, economics, the arts
Language Arts: literature, creative writing
Look at the matrix on page 54 for a list of the learning objectives met by each activity.

5
The Graph Club 2.0 The Graph Club at a Glance
Meeting State & NCTM Standards
The Graph Club is designed to teach data analysis and graphing skills as students collect data and create, interpret, and write aboutgraphs. The program correlates to the NCTM Standards, as outlinedbelow. The program’s dozens of activity files also address many cross-curricular standards.
For correlations to state standards, please visit our Web site atwww.tomsnyder.com/products/standards/gc. You can also link directly to these correlations from within the program by choosing Link toStandards Correlations Online from the Teacher menu.
NCTM StandardStudents should be able to…
Formulate questions that can beaddressed with data and collect,organize, and display relevant data to answer them.(Data Analysis and Probability Standard)
Select and use appropriate statisticalmethods to analyze data.(Data Analysis and Probability Standard)
Develop and evaluate inferences andpredictions that are based on data.(Data Analysis and Probability Standard)
Organize and consolidate theirmathematical thinking throughcommunication.(Communication Standard)
Understand numbers, ways ofrepresenting numbers, relationshipsamong numbers, and number systems.(Number and Operations Standard)
Understand patterns, relations, and functions.(Algebra Standard)
The Graph Club 2.0Students can…
• Pose questions about themselves andtheir surroundings
• Collect data using surveys, observation,and research
• Sort and classify objects according to theirattributes
• Represent data using tables, and picture,bar, line, and circle graphs
• Describe parts of the data and the set ofdata as a whole
• Compare different representations of thesame data and choose appropriate graphtypes
• Use the ready-made activity files toexplore real-world questions, or come upwith their own
• Use the on-screen notebook to writeconclusions and predictions based on data
• Make predictions from graphs
• Describe graphs orally, and in writing, inthe on-screen notebook
• Print tables, graphs, and notebook text foruse in presentations and reports
• Read and interpret graphs
• Connect number words to the quantitiesthey represent, as program counts aloud
• Use graphs to visualize the relativemagnitude of whole numbers
• Understand and represent commonlyused fractions, such as 1/4, 1/3, and 1/2
• Sort, classify, and order objects by size,number, and other properties
• Represent and analyze patterns andfunctions, using words, tables, and graphs
6
The Graph Club 2.0 Getting Started
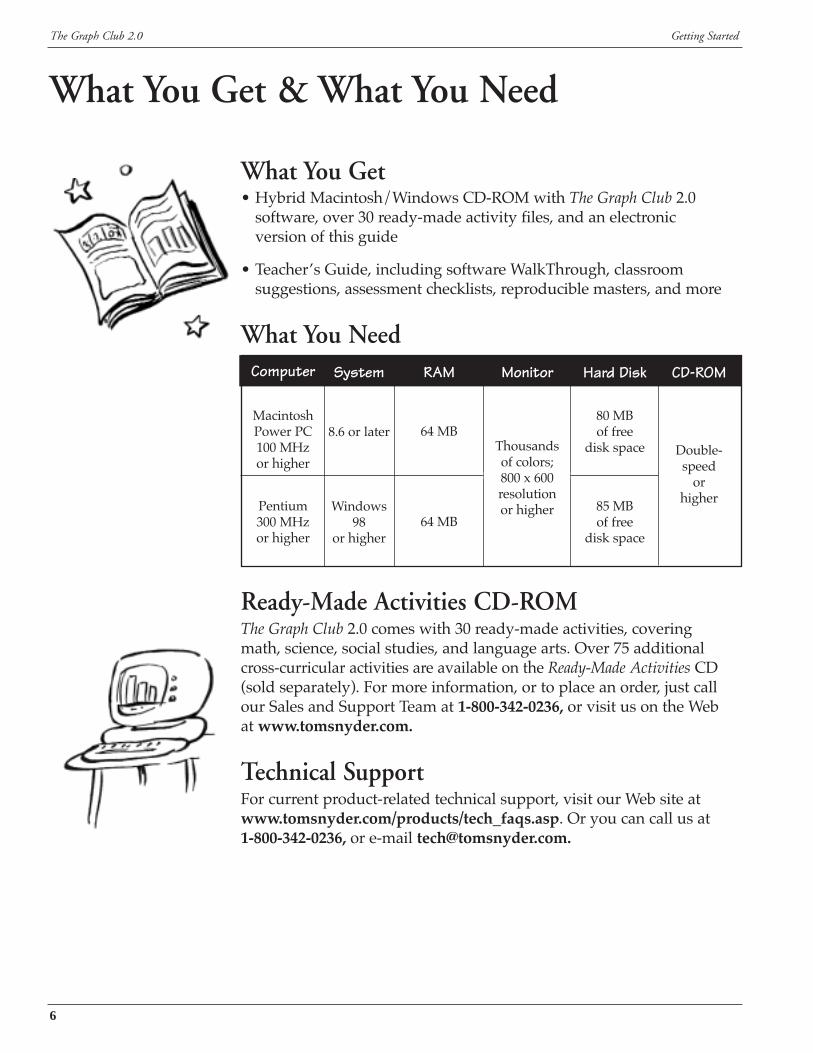
What You Get & What You Need
What You Get• Hybrid Macintosh/Windows CD-ROM with The Graph Club 2.0
software, over 30 ready-made activity files, and an electronic version of this guide
• Teacher’s Guide, including software WalkThrough, classroomsuggestions, assessment checklists, reproducible masters, and more
What You Need
Ready-Made Activities CD-ROMThe Graph Club 2.0 comes with 30 ready-made activities, covering math, science, social studies, and language arts. Over 75 additionalcross-curricular activities are available on the Ready-Made Activities CD(sold separately). For more information, or to place an order, just callour Sales and Support Team at 1-800-342-0236, or visit us on the Web at www.tomsnyder.com.
Technical SupportFor current product-related technical support, visit our Web site atwww.tomsnyder.com/products/tech_faqs.asp. Or you can call us at 1-800-342-0236, or e-mail [email protected].
Computer
MacintoshPower PC100 MHzor higher
Pentium300 MHz or higher
System
8.6 or later
Windows98
or higher
Hard Disk
80 MB of free
disk space
85 MB of free
disk space
CD-ROM
Double-speed
or higher
Monitor
Thousands of colors;800 x 600resolution or higher
RAM
64 MB
64 MB
7
The Graph Club 2.0 Getting Started
Quick Install & Easy Start
Quick Install
Installing the SoftwareMacintosh1. Insert the CD-ROM into the CD-ROM drive.2. Double-click the installer and follow the on-screen instructions.3. To launch the program, double-click
The Graph Club 2.0 icon on the computer’s hard drive.
Windows1. Insert the CD-ROM into the CD-ROM drive.2. From the Start menu, choose Run.3. Type D:\SETUP (where D is your CD-ROM drive).
Follow the on-screen instructions to install The Graph Club.4. To launch the program, go to the Start menu and choose
The Graph Club 2.0 from the Programs folder.
For network installation instructions, see the ReadMe file on the network CD-ROM.
Easy Start
1. Double-click The Graph Club 2.0 icon on your hard drive.2. On the title screen, click Let’s Graph to begin. The program’s main
menu screen appears. 3. On the main menu screen, click Tutorial. The tutorial provides
an animated introduction to The Graph Club’s features.4. The tutorial has four sections: Create Graphs, Describe Your Graphs,
Print Graphs, and Activities & More. To view a section, click thecorresponding button.
• To pause the animation, click .
• To resume playing the animation, click .
• To replay an animated section from the beginning, click .
• To close the tutorial, choose Close from the File menu (Macintosh)or click Close Tutorial (Windows).
The tutorial provides a quick and easy overview of some of The Graph Club’s key features. For a more detailed introduction, see theWalkThrough (pages 8–20). For a comprehensive guide to programfeatures, see Features & Functions (pages 21–36).
The Graph Club 2.0Program Icon
The Graph Club 2.0Installer

WalkThrough
Install the SoftwareSee page 7 for instructions on installing the software.
Getting Started1. Double-click The Graph Club 2.0 icon on your hard drive.
The title screen appears:
Title Screen
Cool Feature: The Graph Club is bilingual. Use the toggle on the title screen to choose how you want to view the program: English or Español (Spanish).
2. Click Let’s Graph! to begin.
8
The Graph Club 2.0 Getting Started
The Graph Club 2.0Program Icon

9
The Graph Club 2.0 Getting Started
The program’s main menu screen appears.
Main Menu Screen
3. To begin, click Create Graphs.
Create Graphs —create and exploreyour own graphs
Activities — choose aready-made graphing activity
in math, science, socialstudies, or language arts
Match Graphs —practice changing one
graph to match another
Tutorial — view a short introduction to
The Graph Club’s features
Open Graphs — open a previously made
graph set
10
The Graph Club 2.0 Getting Started
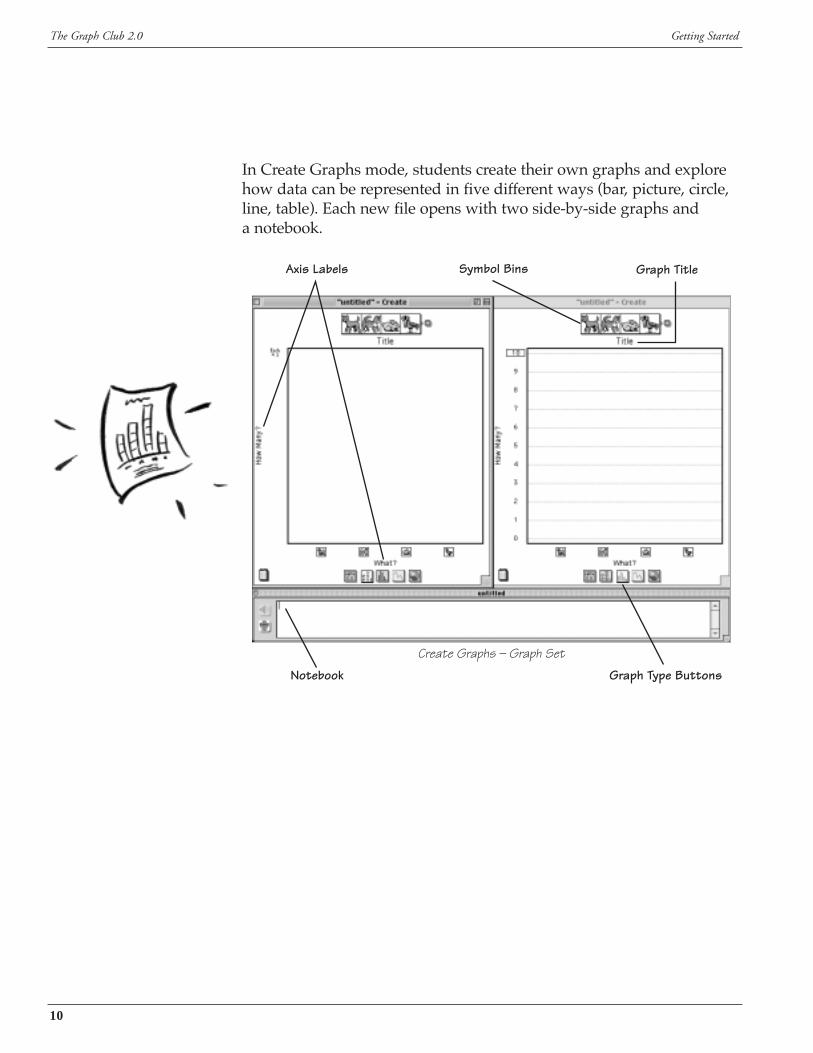
In Create Graphs mode, students create their own graphs and explorehow data can be represented in five different ways (bar, picture, circle,line, table). Each new file opens with two side-by-side graphs and a notebook.
Create Graphs – Graph Set
Axis Labels Graph Title
Notebook Graph Type Buttons
Symbol Bins

11
The Graph Club 2.0 Getting Started
Creating a Graph
Entering data4. Move your cursor to the blue dog at the top of the graph on the left.
Hold the mouse button down and drag a dog into the area abovethe dog icon at the bottom of the graph.
Create Graphs – Graph Set
When the dog is in the correct area, a highlighted column appears, and you hear “bing.” Release the mouse at this time, and you havegraphed one dog! Notice that on the bar graph to the right you alsohave one dog.
5. Click the bar graph to select it. Then click the top edge of the blue bar,hold the mouse down, and drag the bar up or down to change data.
6. Enter data for all four animals until you have a graph to your liking.
Cool Feature: Copy your graph from The Graph Club and paste it into any paint or draw program! For directions, see page 24.

12
The Graph Club 2.0 Getting Started
Having Some Fun
Choose How Many Kinds7. Go to the Graph menu and pick Choose How Many Kinds.
Click the arrow on the right to change the number of kinds to 5.Then click OK.
Choose How Many Kinds Dialog Box
Choose Symbols8. Click the symbol that appears to the right of the symbol bins.
The Choose Symbols dialog appears.
Choose Symbols Dialog Box
Symbols are grouped into 12 categories: People, Animals, Earth & Space, Places, Holidays, Food, Transportation, Sports & Hobbies,Letters, Math, More!, and My Symbols (for imported symbols only).

13
The Graph Club 2.0 Getting Started
9. Click each tab and scroll through the symbols for each category. To add a symbol to your graph, click it and drag it up to one of thebins at the top of the dialog. Experiment with replacing all fivesymbols in your graph.
Cool Feature: In addition to choosing symbols, you can choose a range of colors for circle and bar graphs.
Extra-cool Feature: You can design your own symbols in any paint or drawprogram and import them into The Graph Club. For directions, see page 26.
10. Click OK to return to your graph.
Title and axis labels11. Go to your bar graph and click the word Title above the graph.
Enter a title for your graph. You may enter up to 32 characters.
12. Click What? Enter a label for the x-axis (up to 24 characters). Do the same for the y-axis by clicking How Many?
13. Click one of the little symbols along the x-axis and enter a label forthat symbol (up to 11 characters).
Graph types14. Make sure the picture graph is selected (click it) and move your
cursor to the Graph Type buttons at the bottom of your graph.
Notice that the picture graph button is in color. Click the circle graphbutton, then experiment with the other Graph Type buttons.
Note: For some data, line graphs may not be appropriate. (See page 48for more information on choosing the right graph type for your data.) If you wish to restrict the availability of line graphs, you may do sofrom the Teacher Preferences. See page 30.

14
The Graph Club 2.0 Getting Started
Cool Feature: Using the Add Another Graph option on the Graph menu,you can open up additional graphs and see your data representedmultiple ways. Your computer’s resolution determines the number of graphs that can fit on-screen without overlapping. To close a graph,choose Close from the File menu. Then choose Arrange Graphs from theOptions menu to resize the remaining graphs so that they fill the screen.
Scale maximum15. Using the Graph Type buttons below each graph, select a circle
graph and a bar graph. Next, go to the Graph menu and pickChoose Scale Maximum. Click 100, then click OK.
Choose Scale Maximum Dialog Box
Note: The scale maximum for picture graphs is 20.
Cool Feature: On your bar graph, notice the box at the top of the y-axislabeled 100. You can change the scale maximum by clicking this box.This option is available for bar, picture, and line graphs.
Entering and deleting dataNow let’s add some more data to your graphs — we’ll try two differentways to do this.
16. Click on a circle graph. Then, drag a symbol (from the Symbol Bins)into the corresponding segment of your circle graph. This adds oneunit to your graph.

15
The Graph Club 2.0 Getting Started
17. Move the mouse to the edge of a segment and drag it clockwise.This allows you to add data more rapidly to your graph. Movingthe mouse counterclockwise deletes data from the graph.
The dragging method of changing data is available for bar, circle, and line graphs.
18. Click a number on your circle graph. Notice that you can label yourcircle graph seven different ways: None (no label), Symbol, Count,Fraction, Simplified Fraction, Percent, and Decimal. Click Percent.Then click OK.
Choose Circle Graph Labels Dialog Box
Note: You can also open this dialog by picking Choose Circle GraphLabels from the Graph menu.
16
The Graph Club 2.0 Getting Started
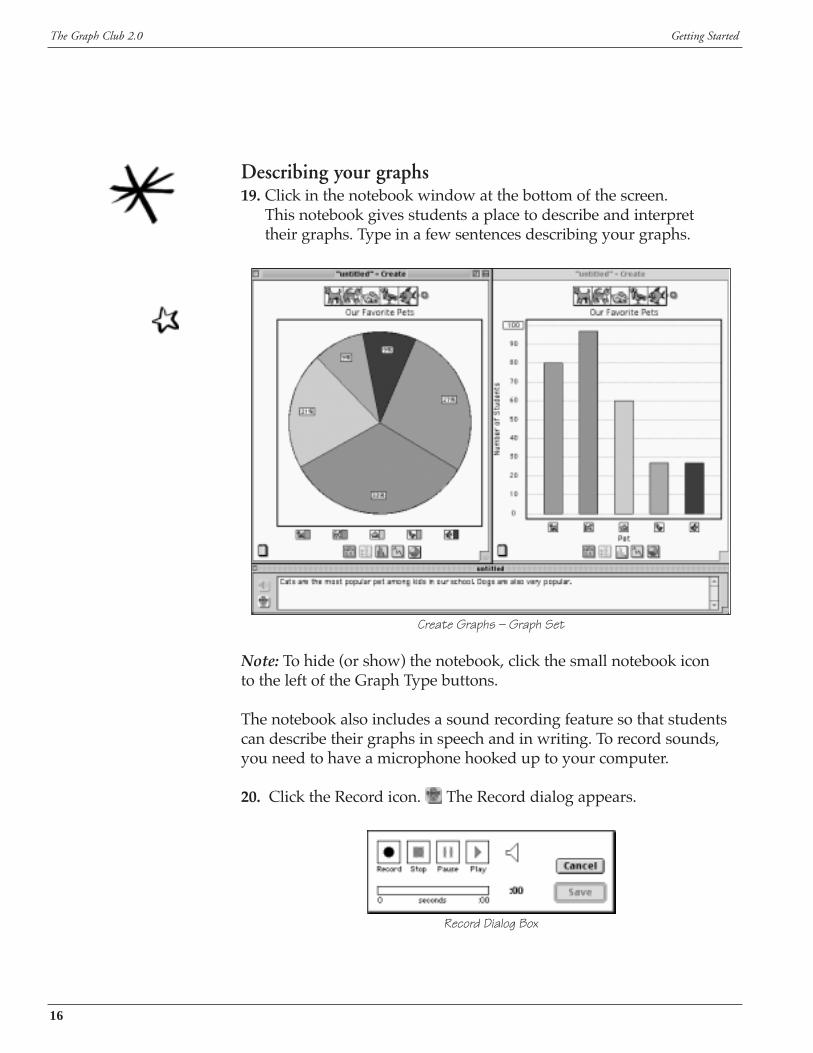
Describing your graphs19. Click in the notebook window at the bottom of the screen.
This notebook gives students a place to describe and interpret their graphs. Type in a few sentences describing your graphs.
Create Graphs – Graph Set
Note: To hide (or show) the notebook, click the small notebook icon to the left of the Graph Type buttons.
The notebook also includes a sound recording feature so that studentscan describe their graphs in speech and in writing. To record sounds,you need to have a microphone hooked up to your computer.
20. Click the Record icon. The Record dialog appears.
Record Dialog Box

17
The Graph Club 2.0 Getting Started
21. Click Record, then speak into the microphone. You may speak for up to 60 seconds. When you are finished recording, click Stop.Click Play if you want to listen to your recording. (You can alwaysrecord a new sound if you don’t like your first attempt.)
22. When you have a recording you like, click Save (Macintosh) or OK (Windows). Your sound is saved with the file.
• To listen to your sound, click the play icon .
• To delete your sound, click the trash icon .
SavingYour graphs are surely masterpieces by now, so let’s save them. (All views of a given data set, along with the notebook, are savedtogether as one file.)
23. Choose Save from the File menu. You can also press U-S(Macintosh) or C-S (Windows).
Printing24. Choose Print Graphs from the File menu. You can also press U-P
(Macintosh) or C-P (Windows).
Print Graphs Dialog Box

18
The Graph Club 2.0 Getting Started
25. Select the graph types you wish to print and they will be displayedin the Print Preview area. You can print up to five on one page. To change page orientation from portrait to landscape, click Page Setup (Macintosh) or Print Setup (Windows) from this screen.
Notice that there are three text fields where you can enter your name and edit your graph title and notebook text. Enter your name.Experiment with checking and unchecking the boxes to the left of thesefields to determine whether a title, notebook text, and name appear onyour printout.
Cool Feature: Print worksheets with blank lines for name, graph title,and graph description. Simply remove all text from each of the threetext fields, but leave the boxes checked.
Match GraphsNow that you’ve created and explored some of your own graphs, let’s try some additional activities. First, let’s look at the Match activity.
26. Choose Close Set from the File menu to close your graphs. The Main Menu screen reappears.
27. Click Match Graphs. In this mode, your job is to create a graph on theright that matches the randomly generated graph on the left. Go to it!
Match Graphs – Graph Set
19
The Graph Club 2.0 Getting Started
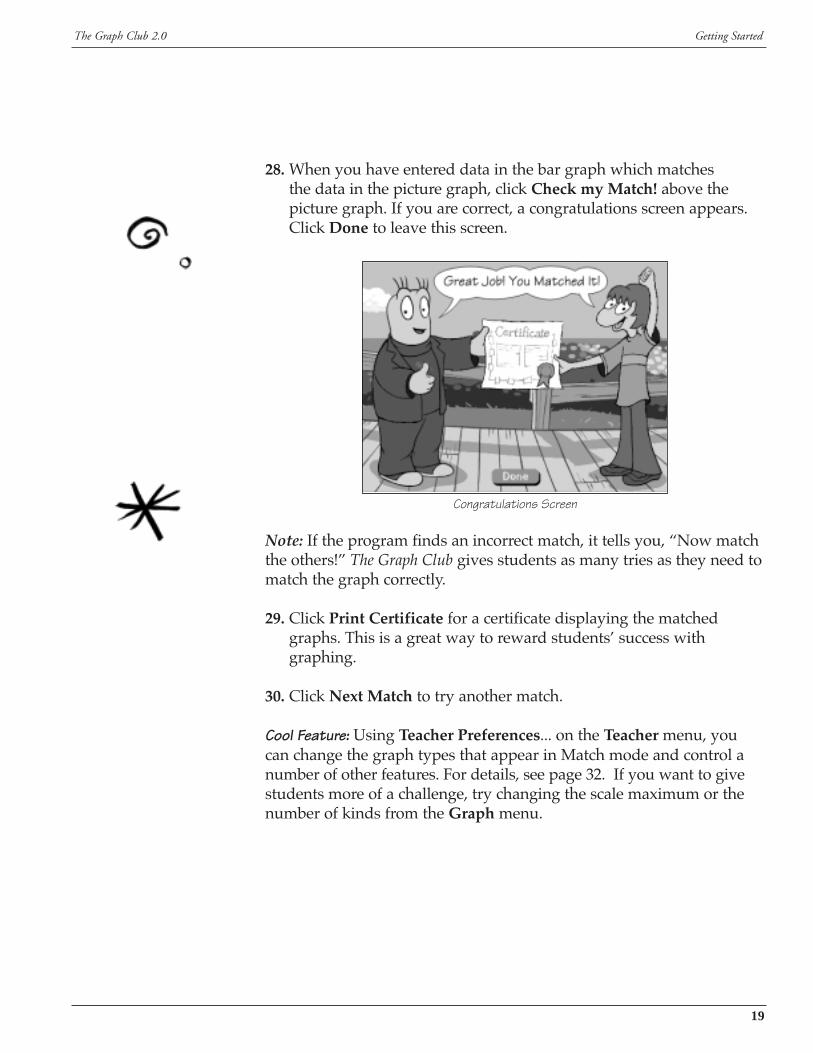
28. When you have entered data in the bar graph which matches the data in the picture graph, click Check my Match! above thepicture graph. If you are correct, a congratulations screen appears.Click Done to leave this screen.
Congratulations Screen
Note: If the program finds an incorrect match, it tells you, “Now matchthe others!” The Graph Club gives students as many tries as they need tomatch the graph correctly.
29. Click Print Certificate for a certificate displaying the matchedgraphs. This is a great way to reward students’ success withgraphing.
30. Click Next Match to try another match.
Cool Feature: Using Teacher Preferences... on the Teacher menu, youcan change the graph types that appear in Match mode and control anumber of other features. For details, see page 32. If you want to givestudents more of a challenge, try changing the scale maximum or thenumber of kinds from the Graph menu.

20
The Graph Club 2.0 Getting Started
ActivitiesThe Graph Club comes with more than 30 ready-made cross-curricularactivities. (Over 75 more are available on the Ready-Made Activities CD,sold separately. See page 6 for more information.) Let’s take a look atsome of these activities!
31. Choose Go to Main Menu from the File menu. From the mainmenu screen, click Activities. The activities menu screen appears.
Activities Menu Screen
32. To choose an activity, click a tab to choose a subject area: Math,Social Studies, Science, or Language Arts. Then click a button tochoose a subcategory. In the resulting dialog, select an activity file,then click Open. (For a matrix of activity files, see pages 54–55.)
Cool Feature: You can also create your own activities and save them as templates by choosing Save As Activity from the Teacher menu. See page 32 for more information.

21
The Graph Club 2.0 Getting Started
Features & Functions
The File MenuGo to Main Menu: Returns to the main menu screen.
Main Menu Screen
New Graph Set: Opens a new graph set in Create Graphs mode.(Available only when a Create Graphs file is currently active.)
New Match: Opens a new graph set in Match Graphs mode. (Available only when a Match Graphs file is currently active.)
Open: Lets you open a previously saved file.
Close: Closes the selected graph view.
Close Set: Closes the notebook and all the views in a graph set.
Create Graphs —create and exploreyour own graphs
(see page 10)
Activities — choose aready-made graphing activity
in math, science, socialstudies, or language arts
(see page 20)
Match Graphs —practice changing one
graph to match another(see page 18)
Tutorial — view a short introduction to
The Graph Club’s features.
Open Graphs — open a previously made
graph set
File Menu (Macintosh)
File Menu (Windows)

22
The Graph Club 2.0 Getting Started
Save: Lets you save a file. When you save, the notebook and all viewsof a given graph set are saved together.
Save As: Lets you save a previously saved file under another name or location.
Export as Graphic: Lets you export the active graph view as a PICT(Macintosh), BMP (Windows), or JPEG (both Macintosh and Windows).
Page Setup (Macintosh) or Print Setup (Windows): Lets you set pageorientation and other specifications for printing graphs.
Print Graphs: Lets you print graphs and notebook text in a variety offormats.
Print Graphs Dialog Box
Edit and print title Print preview
Click here afterselecting all your
print options
Edit and print notebook text
Print one or all fivegraph types
Print bars and circlesegments with solid
fills, patterns, oroutlines only
Choose from three print sizes• regular: 8 1/2" x 11" (1 page)• big book: 17" x 22" (4 pages)• poster: 25 1/2" x 33" (9 pages)
Click Page Setup to change page orientation
Add and print astudent name
23
The Graph Club 2.0 Getting Started
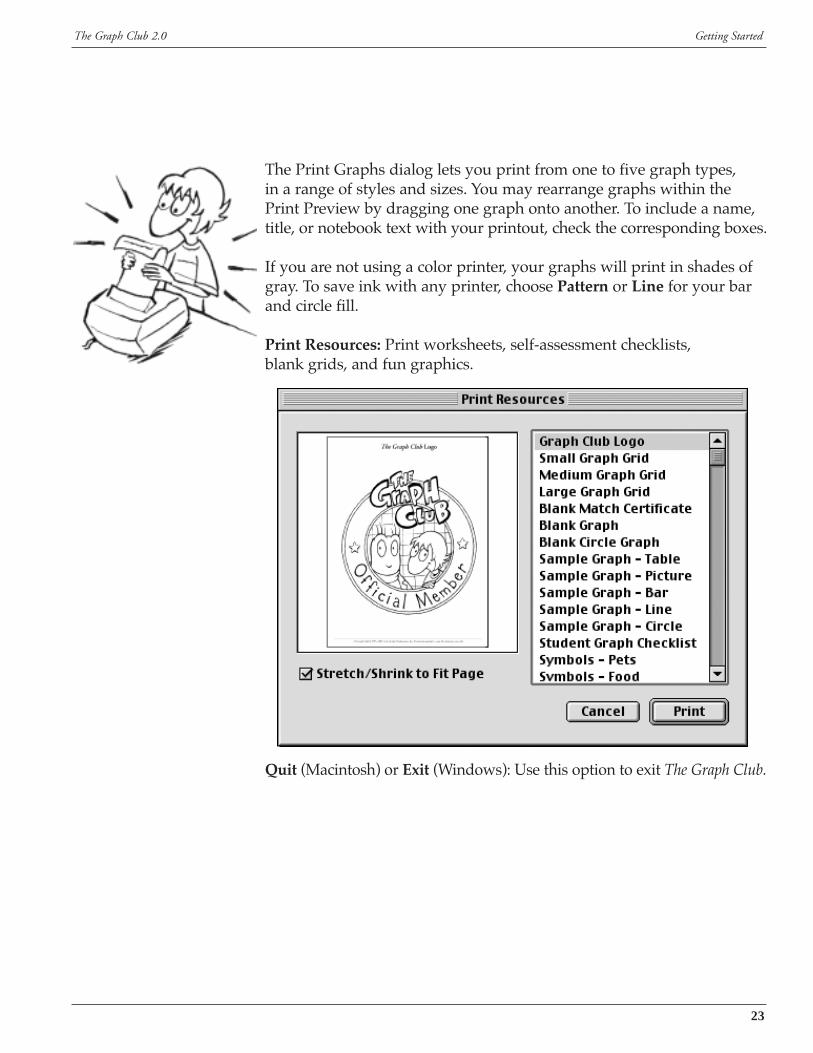
The Print Graphs dialog lets you print from one to five graph types, in a range of styles and sizes. You may rearrange graphs within thePrint Preview by dragging one graph onto another. To include a name,title, or notebook text with your printout, check the corresponding boxes.
If you are not using a color printer, your graphs will print in shades ofgray. To save ink with any printer, choose Pattern or Line for your barand circle fill.
Print Resources: Print worksheets, self-assessment checklists, blank grids, and fun graphics.
Quit (Macintosh) or Exit (Windows): Use this option to exit The Graph Club.

24
The Graph Club 2.0 Getting Started
The Edit MenuThese are basic options found in many applications. If the Edit menu is not accessible, you can perform these actions using the appropriateshortcut keys. (Note: Copy Graph is the only function you can performon graphs. All other functions are performed on text.)
Undo: Undoes your last action.
Cut: Removes selected text so that you can paste it in another location.
Copy: Duplicates selected text so that you can paste a copy in anotherlocation.
Copy Graph: Copies an image of the selected graph view to theclipboard so that you can paste it into a paint or draw program. Afterselecting a graph (by clicking on it), choose Copy Graph. Then open the paint program and paste!
Note: You can also paste graphs into a word-processing program thatsupports graphics.
Paste: Pastes cut or copied items into your document.
Clear: Erases selected text.
Select All (Macintosh only): Selects all text within a text field.
Edit Menu (Macintosh)
Edit Menu (Windows)
The Graph Club 2.0 Getting Started
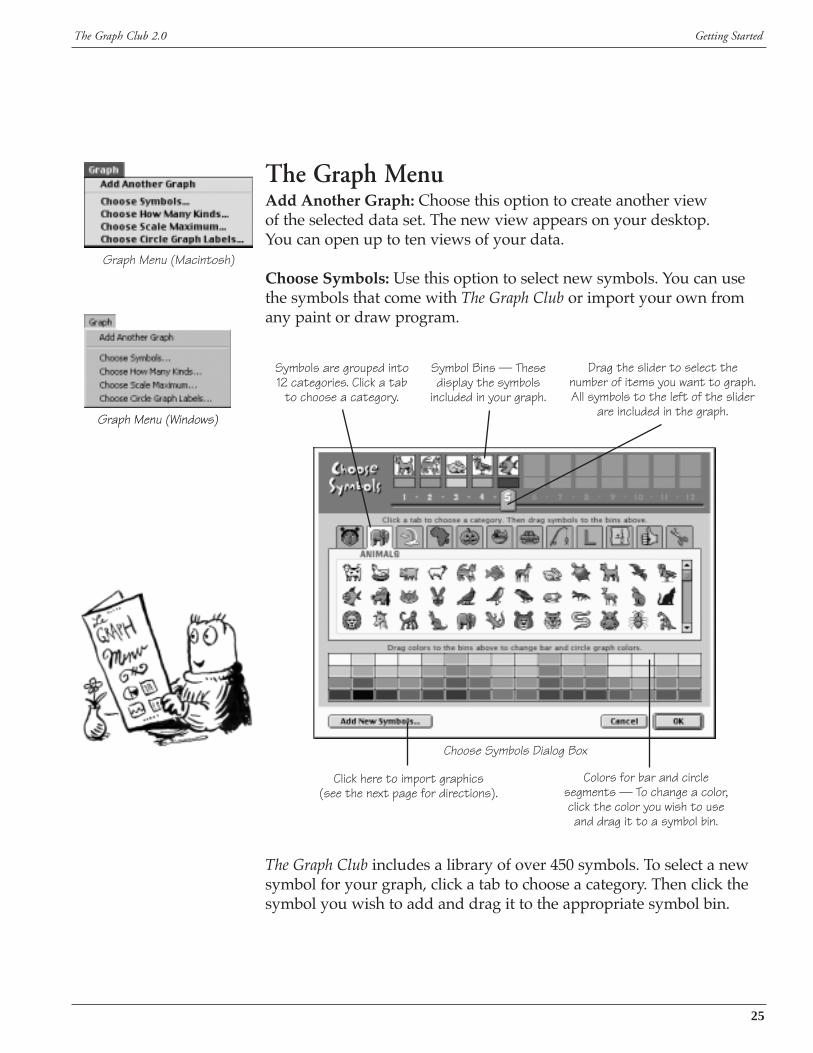
The Graph MenuAdd Another Graph: Choose this option to create another view of the selected data set. The new view appears on your desktop. You can open up to ten views of your data.
Choose Symbols: Use this option to select new symbols. You can usethe symbols that come with The Graph Club or import your own fromany paint or draw program.
Choose Symbols Dialog Box
The Graph Club includes a library of over 450 symbols. To select a newsymbol for your graph, click a tab to choose a category. Then click thesymbol you wish to add and drag it to the appropriate symbol bin.
Graph Menu (Macintosh)
Graph Menu (Windows)
25
Click here to import graphics (see the next page for directions).
Colors for bar and circlesegments — To change a color,click the color you wish to useand drag it to a symbol bin.
Symbol Bins — Thesedisplay the symbols
included in your graph.
Symbols are grouped into12 categories. Click a tab
to choose a category.
Drag the slider to select thenumber of items you want to graph.All symbols to the left of the slider
are included in the graph.

26
The Graph Club 2.0 Getting Started
The Graph Club lets you import your own graphics and save them in the symbol library. It’s easy! Here’s how:
1. Using a paint or drawing program, create your own graphic.
2. Import the graphic into The Graph Club. There are two ways to do this:
Method A– Copy the graphic; it is saved on the computer’s clipboard.– Open The Graph Club and pick Choose Symbols from the
Graph menu. Click Add New Symbols.– Click Paste from Clipboard. Your symbol appears in the
preview window.
Method B– Save the graphic on your hard drive as a PICT (Macintosh only),
BMP (Windows only), or JPEG file. (If you plan to importmultiple symbols, store all your graphics in a single folder.)
– Open The Graph Club and pick Choose Symbols from the Graph menu. Click Add New Symbols.
– Click Browse for Files. An Open dialog appears. Locate the graphic on your hard drive and click Open. Yoursymbol appears in the preview window. (To import multiplegraphics, locate the folder where the graphics are stored. Then shift-click to select more than one file.)
3. Choose the category where you want to store your symbol. (If you want to store all your own symbols in one place, use the My Symbols category.)
4. Click Add. Your symbol is saved in the symbol library.
Technical Note: Symbols in The Graph Club library are 28 x 28 pixels.Imported symbols don’t have to be this size, but the closer yoursymbols are to 28 x 28, the better they look in the program.

27
The Graph Club 2.0 Getting Started
Choose How Many Kinds: Lets you change the number of items youare graphing. Use the arrows to choose any number from 1 to 12. If youreduce the number of items, The Graph Club eliminates symbols startingfrom the right. If you increase the number of items, The Graph Club usesthe additional symbols saved with this graph.
Choose How Many Kinds Dialog Box
Choose Scale Maximum: Use this option to change the scale maximum.(Note: The scale maximum for picture graphs cannot exceed 20.)
Choose Scale Maximum Dialog Box

28
The Graph Club 2.0 Getting Started
Choose Circle Graph Labels: Use this option to label circle graphsseven different ways: None (no label), Symbol, Count, Fraction,Simplified Fraction, Percent, and Decimal. Select the desired option in the dialog, and click OK.
Shortcut: Click any of the labels inside the circle graph to open this same dialog.
Choose Circle Graph Labels Dialog Box

29
The Graph Club 2.0 Getting Started
The Options MenuGraph Vertically: Select this option to give graphs a vertical orientation. This is the default setting.
Graph Horizontally: Select this option to give graphs a horizontalorientation. All views of the selected graph are changed and windows arerearranged on the screen. In this orientation, Symbol Bins are on the leftof the graph window and Graph Type buttons are on the right.
Arrange Graphs: Select this option to arrange all windows in the activegraph set (including graph views and notebook) so that they appearside by side.
Show/Hide Bar and Line Grid: Select this option to show or hide gridlines in bar and line graphs.
Shortcut: Double-click any white area inside a selected graph windowto turn grid lines on and off automatically.
Show/Hide Axis Labels: Select this option to show or hide axis labels.
Show/Hide Title: Select this option to show or hide the graph title.
Show/Hide Notebook: Select this option to show or hide the notebook.You can change the shape, size, and position of the notebook by clickingand dragging its edges. The notebook allows you to type up to 400characters of text. It also includes options to record and play audio.
Notebook
To record audio, click . This opens the Record dialog (see page 16).
Once audio has been recorded, click to play the audio clip. (This button is grayed if no audio has been recorded.)
Click to delete the audio clip.
English: Select this option to display program text in English.
Español: Select this option to display program text in Spanish.
View Full Screen (Windows only): Select or deselect this option tochoose how graphs are displayed. When View Full Screen is checked,the Windows task bar is hidden and graphs appear larger.
Options Menu (Macintosh)
Options Menu (Windows)
Type text hereRecord buttonPlay button
30
The Graph Club 2.0 Getting Started
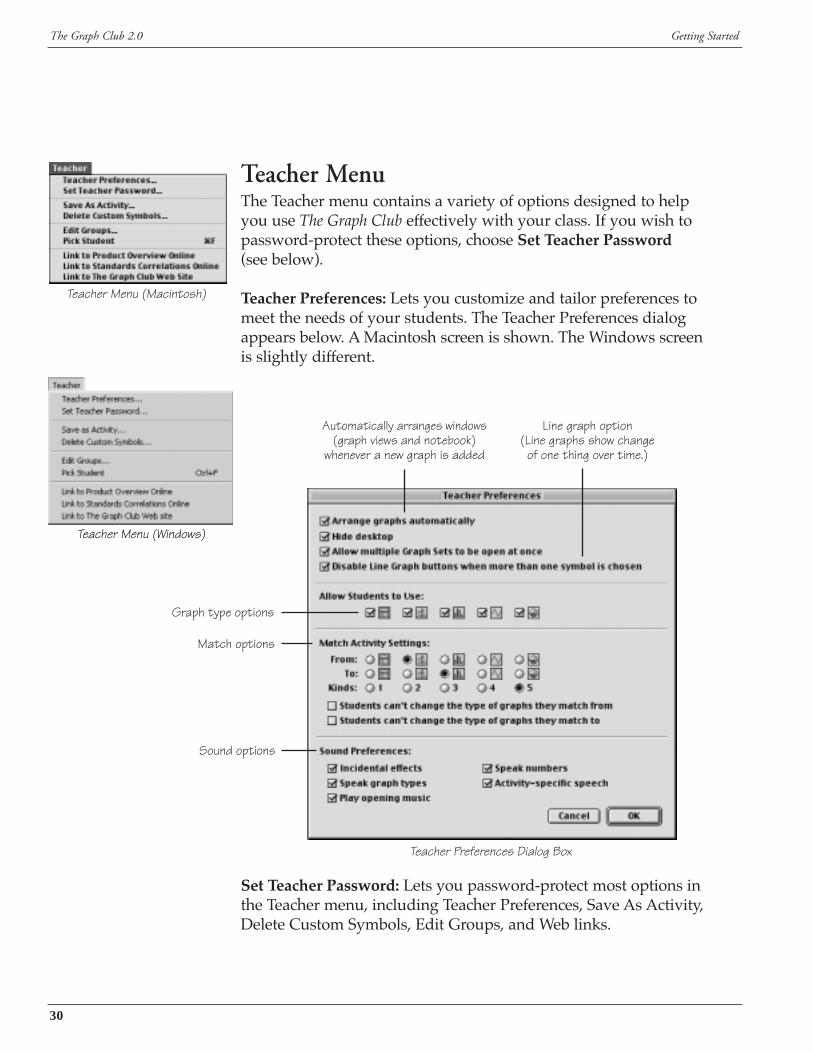
Teacher MenuThe Teacher menu contains a variety of options designed to help you use The Graph Club effectively with your class. If you wish topassword-protect these options, choose Set Teacher Password(see below).
Teacher Preferences: Lets you customize and tailor preferences to meet the needs of your students. The Teacher Preferences dialog appears below. A Macintosh screen is shown. The Windows screen is slightly different.
Teacher Preferences Dialog Box
Set Teacher Password: Lets you password-protect most options in the Teacher menu, including Teacher Preferences, Save As Activity,Delete Custom Symbols, Edit Groups, and Web links.
Teacher Menu (Macintosh)
Teacher Menu (Windows)
Sound options
Graph type options
Line graph option (Line graphs show change
of one thing over time.)
Automatically arranges windows(graph views and notebook)
whenever a new graph is added
Match options

31
The Graph Club 2.0 Getting Started
Here’s how:
1. Choose Set Teacher Password from the Teacher menu.
2. You are prompted for a password. If you’ve previously created a password, type it in. If you haven’t, use the master password. The master password appears in the paper version of this Teacher’s Guide, on page 31. Alternatively, call Technical Support at 1-800-342-0236.
Please Enter the Password Dialog Box
3. Click Change Password and enter your new password, then clickOK. (Note: The password is case sensitive.)
Change/Remove Password Dialog Box
4. Enter your password a second time for confirmation. Click OK.
Verify the Password Dialog Box
Your new password is now in effect. The master password continues to work as well.
If you wish to remove password protection, click Remove Passwordon the Change/Remove Password dialog.

32
The Graph Club 2.0 Getting Started
Save As Activity: Lets you create your own activity files and save them as templates, which your students can access through theActivities menu screen (see page 20).
Note: Templates are read-only and cannot be overwritten. Whenstudents choose an activity, a copy of the original file is created.
Save As Activity Dialog Box
Here’s how to create and save an activity:
1. Create a new file (or open an existing file or activity) and set up thegraph views and notebook to your liking.
2. Select Save As Activity from the Teacher menu.
3. Choose where to store your activity. First select a category (math,social studies, science, language arts). Then select a subcategory.
4. Give your activity a name.
5. Click OK (Macintosh) or Save (Windows). Your activity is saved asa template.

33
The Graph Club 2.0 Getting Started
Delete Custom Symbols: Lets you delete custom symbols. Simply clicka tab to choose the category where the symbol is stored. Then click thesymbol and drag it to the trash. Note: Only imported symbols can be deleted.
Delete Custom Symbols Dialog Box
Edit Groups: Allows you to add and edit classes for use with theRandom Student Picker™. The Random Student Picker — a feature in many Tom Snyder Productions programs — lets you randomly selecta student to enter data, answer a question, interpret a graph, or offer hisor her opinion. It’s a fun way to involve the entire class and keepstudents on their toes!
Edit Groups Dialog Box
Click to save allchanges
Add a student tothe selected groupRemove the
selected group
Create a group
Remove theselected studentfrom the group
Students arepicked from the selected
group.

34
The Graph Club 2.0 Getting Started
Pick Student: Lets you activate the Random Student Picker (see Edit Groups on page 33).
Note: You can also choose this option by pressing U-F (Macintosh) orC-F (Windows). If you have more than one group set up, you need tochoose Edit Groups and select the group you want the program to pickfrom before you choose Pick Student.
Random Student Picker
To leave the Random Student Picker, click anywhere on the graphic.
Link to Product Overview Online: Launches an online moviedescribing The Graph Club 2.0 and its benefits in the classroom.
Link to Standards Correlations Online: Launches a Web site whereyou can search for your state and see how The Graph Club meets yourstate standards.
Link to The Graph Club Web Site: Launches The Graph Club Web site,where you can view lesson ideas, download symbols and sampleactivities, and link to sites with interesting data.

35
The Graph Club 2.0 Getting Started
Help MenuView Teacher’s Guide: Opens a copy of The Graph Club Teacher’sGuide, as a PDF file. (You must have Adobe Acrobat installed in orderto access this file.)
View Tutorial: Lets you view a short tutorial on The Graph Club. The tutorial has four sections: Create Graphs, Describe Your Graphs,Print Graphs, and Activities & More. To view a section, click thecorresponding button.
Tutorial
• To pause the animation, click .
• To resume playing the animation, click .
• To replay an animated section from the beginning, click .
• To close the tutorial, choose Close from the File menu (Macintosh)or click Close Tutorial (Windows).
About The Graph Club: Lets you view program information.
Help Menu (Macintosh)
Help Menu (Windows)

36
The Graph Club 2.0 Getting Started
Entering and Deleting DataBelow is an explanation of how to enter and delete data for all five graph types.
Graph Type Enter Delete
Bar Drag symbols Drag top of bar downDrag top of bar up
Circle Drag symbols Drag wedges counter-Drag wedges clockwise clockwise
Line Drag data points up Drag data points downDrag symbols to desired data points
Picture Drag symbols Click symbols in graph
Table Click number and Click number andtype a new one delete textDrag symbols

37
The Graph Club 2.0 Ideas for the Classroom
Ideas for the Classroom
Whether you are introducing graphing to your students or exploringadvanced concepts, The Graph Club is a great way to teach and enhanceyour curriculum. In this section, we help get you started with ideasand tips for using the program in your classroom.
Getting Started in the Primary Grades (page 38)
Graphing with Manipulatives (page 40)
Making the Most of The Graph Club (page 43)
Choosing the Right Graph Type (page 48)
Graphing Across the Curriculum (page 49)
Printing Ideas (page 52)

38
The Graph Club 2.0 Ideas for the Classroom
Getting Started in the Primary Grades
The following suggestions can help assure success when introducinggraphing concepts and activities in the primary grades.
Start with counting, classifying, and sorting activities. Have studentscount objects, determine categories, and sort. Then have them come upwith new categories and sort again.
Use manipulatives. Provide extensive experience with concreteactivities before moving on to abstract concepts. Create people graphs,object graphs, and block graphs. (See Graphing with Manipulatives onpages 40–42.)
Encourage students to devise their own systems. Ask students howthey would display data. Have them design imaginative displays usingmanipulatives, diagrams, and graphs.
Move on to representational graphs. Use pictures, drawings, andphotographs of real objects. These semi-concrete representations help students make a transition to more abstract forms of graphing.
Make the transition to abstract representations. Introduce the use of uniform ideographs or symbols in the form of picture graphs. Then move on to bar, line, and circle graphs.
Limit the number of graph elements. Start with graphs that includeonly two groups or graph elements. Gradually increase the number of groups.
Select topics to which children can relate. Young children are curiousabout themselves and the world around them. Take advantage of thisnatural curiosity by selecting topics of interest to your students.Encourage students to suggest graphing activities and enlist their helpin identifying appropriate categories for sorting and classifying data.
Provide a meaningful context. Graphing makes more sense andstudents internalize concepts better when graphing activities arepresented in meaningful contexts.
Build graphing activities around a theme. When planning additionalgraphing activities, try to organize them around an ongoing project ortheme. Activities that are drawn from everyday classroom experienceshave the advantage of a meaningful context.

39
The Graph Club 2.0 Ideas for the Classroom
Print. A printed copy makes the abstract more concrete and allowsstudents to share their work.
Talk math, write math. Learning and using the language of mathematicsand graphing helps students internalize concepts. The ability to type orrecord a story or description in the notebook encourages students tocommunicate mathematically. You may want to culminate graphingactivities with creative writing and drawing activities.
Encourage confidence. Success builds confidence. Taking studentsthrough a progression of easy to more difficult graphing activitiesencourages success and builds confidence as students graduallydevelop sophisticated graphing skills.

40
The Graph Club 2.0 Ideas for the Classroom
Graphing with Manipulatives
Children’s first graphing experiences are most successful whencentered on concrete objects. Once students are comfortable with realgraphs (graphs made from real objects), they can progress torepresentational graphs (made from drawings, photos, magazineimages) and then to symbolic graphs.
Use some of the following ideas to implement concrete graphingactivities, or devise your own. Try to pick topics that are conducive tothe use of manipulatives. Also be sure that you encourage yourstudents to suggest and devise original systems for displaying data.
People graphs• Line up desks or chairs in several rows to create a gridlike pattern.
Assign labels to each row — e.g., blue eyes, brown eyes, black eyes,green eyes — and have students choose seats accordingly.
• Create a large reusable floor grid using heavy paper, canvas, or other fabric. Label rows and columns, and have students line up accordingly.
• Use masking tape to create a floor grid or, if you have largerectangular floor tiles, use tape to mark off rows. Assign labels to each row, and have students line up.
Block graphsHave students stack Unifix® cubes, building blocks, Cuisenaire® rods, or any standard-size blocks. If you want, students can paste pictures onblocks or use different colored blocks to represent different categories.
41
The Graph Club 2.0 Ideas for the Classroom
Object graphsUse juice cartons, cereal boxes, shoes, hats, books, toys, stuffed animals,or any other objects to make graphs. Make smaller object graphs withclothespins, tokens, beads, paper clips, plastic or paper chain links,M&M’s, or similar items. Use the following suggestions, or a system ofyour own, to organize object graphs. Better yet, let your students devisea system.
• Place a grid on the blackboard, bulletin board, or wall. Label rows or columns and stack items or attach them with tape.
• Use the floor grid described on page 40 or create a smaller versionwhich can also be used on a desktop.
• Create a rectangular fabric panel approximately 4' x 4' or larger.Divide the panel into squares in a gridlike pattern and sew a pocketon each section. Attach removable labels to each row and let studentstuck items into pockets in the appropriate row.
• Create a large rectangular frame with pigeonholes in a grid-likepattern. Assign labels to different rows or columns, and have students place one item per pigeonhole in appropriate rows.
• For small objects, make copies of the 1" graph paper on page 127.Have students sort objects, label columns, and place objects on thesheet with one per box or “cell.”
• Use egg cartons as ready-made grids.
• Attach magnets in rows or columns to any magnetic surface.
• Hook together links and hang chains side by side.
• Clip clothespins in rows to the sides or bottom of a chart.

42
The Graph Club 2.0 Ideas for the Classroom
Pictures and photographs of real objectsHave students draw pictures, cut pictures from magazines, or usephotographs. Students can use photos or drawings of themselves tocast votes. Have students tape the pictures in rows or columns on theblackboard, bulletin board, or wall. If you want, place a large sheet of paper with a grid on the floor or table, and label rows or columns.
Other concrete graphing activitiesThere are a million uses for graphs. Here are a few activity ideas thatmay spark some interest:
• Have students outline their hands, feet, or entire body, and then cutout their outlines and post them on the blackboard, bulletin board, or wall. Older students can draw horizontal and/or vertical axes andmake appropriate labels.
• Use ribbon, cash register tape, or string to measure students’ height,the circumference of their wrists, or the length or height of any object.Cut appropriate lengths and use them to create “bar graphs.”
• Have students create picture graphs using rubber stamps and inkpads. Use different stamps or identical stamps with a different colorink for each column or row.
• Make copies of the symbols on pages 120–123 of this guide (or printthem from Print Resources) using heavy stock paper if possible. Cut apart and use as manipulatives for students to sort and line up to create graphs. Moving from a paper version of the symbols to the screen version helps students make the transition from concrete to abstract.
• Use string, yarn, or ribbon to connect the tops of the columns in a baror picture graph in order to introduce students to line graphs.
• Use geoboards to create bar or line graphs.
• Use your imagination! Look around you and invent your own uniquemeasuring units.

43
The Graph Club 2.0 Ideas for the Classroom
Making the Most of The Graph Club
The following suggestions can help you make the most of The GraphClub as you incorporate the program into your curriculum.
Create GraphsIn The Graph Club’s main mode — Create Graphs — the programgenerates a pair of graphs that let you explore graphing in an open-ended environment. You can open additional views if you wish to compare three or more graph types.
Below are a variety of ideas for using this portion of the program withyour students.
1. Start with a large group activity such as a class survey to familiarizestudents with the software.
2. Display two (or more) different representations of the same data.For example, show a table or a picture graph in the left window and a bar or circle graph in the right window.
3. Watch as the graphs take shape. Encourage students to notice how a change in one graph is reflected in other views of the same data.
4. Provide hands-on experience. Have fun changing the icons, thenumber of items in your graph, the scale maximum, the graph type,and the graph’s orientation. Encouraging students to drag symbolsand manipulate the graphs helps them make the transition fromconcrete to abstract representations of data. This tactile experiencealso supports a more sensory-oriented learning style.
5. Pump up the volume. When practical, be sure the volume is loudenough so that students can hear items counted as they add to andsubtract from their graphs.
6. Use the Graph Type buttons to display different views of the samedata. Ask students which display is the easiest for them tounderstand. Which do they think best represents the data? Askstudents to explain their answers.

7. Discuss the graphs. Ask students questions such as these:
• What kind of graph is this?• What is this graph about? • What is a good title for this graph?• How many (of each kind) are there?• Of which kind is there the most? The least?• How many more (of one kind) are there than (another kind)?• Is this graph a good way to display the data?• How could you use this information? • What questions would you like to ask about this graph?• How would you like to change this graph?
Encourage students to come up with their own answers by havingthem write, draw, or otherwise record their response before elicitingspoken answers. When there are a limited number of possibleanswers, ask for a hand count to see how many students pickedeach answer. Ask students to give reasons for their answers. Invitestudents to the front of the class to record their answers andreasoning in the notebook.
8. Encourage students to pose questions.
9. Encourage student-initiated data collection activities. Have studentsconduct their own interviews, surveys, and investigations, and useThe Graph Club to display the data.
10. Graph data from other sources. Ask students to find data fromanother source and use The Graph Club to display it. Let themmanipulate the data, play “what if” games, and experiment with different representations of the same data.
11. Use the activities included with the software. These activities areready to use and cover a range of topics and graphing skills. (See pages 53–86 for more information.)
12. Use the Save As Activity feature (see page 32) to create your ownactivity templates.
13. Ask students to add an appropriate title and axis labels to eachgraph they create.
44
The Graph Club 2.0 Ideas for the Classroom

45
The Graph Club 2.0 Ideas for the Classroom
14. Encourage students to write about their graphs, or record their ideasorally, in the notebook. Students can use this space to describe theirgraphs, make predictions, draw conclusions, or write a story abouttheir graphs.
15. Allow students to print their graphs whenever possible. Encourage them to print their notes along with their graphs.
16. Have students share and discuss their graphs.
17. Pose challenges. For example:
• Display a line graph and a bar graph. Ask students what theycould do to the line graph to make all the bars in the bar graph the same height. Let them manipulate the line graph to check their predictions.
• Have students display a bar graph and a circle graph. Ask questions such as these:
If you make all the bars the same height, how will the circle graph look?
If you remove one bar completely, how will the circle graph look?
After students hypothesize, let them manipulate the bar graphand see if they are correct. Ask students to continue this game by asking their own questions.
18. If students are sophisticated enough, introduce a discussion offractions, decimals, and/or percents.
• Display a bar graph on the left and a circle graph on the right.Start with two bars of equal size and ask students what each partof the circle is called. Then have them change the wedge labels tofractions to see if they are correct. (See Choose Circle Graph Labelson page 28.) Ask students to predict what each wedge will becalled if you add another bar of equal size.
• Display two circle graphs and label each differently — e.g., onewith whole numbers and the other with fractions, or one withfractions and the other with percents or decimals. For example,compare fractions and percents. Ask students to predict how achange in one will affect the other.
46
The Graph Club 2.0 Ideas for the Classroom
19. Using a paint or draw program, create custom symbols that representsomething in your school or community (school playground equipment,students’ favorite toys, or candy). You can also import symbols fromother programs, such as Kid Pix. Save these symbols in the symbollibrary (see page 26), and have students use them in their graphs.Alternatively, encourage students to create their own symbols.
20. Create and save “mystery graphs” with no axis labels or title.Challenge students to hypothesize about what the data mightrepresent. This activity encourages critical thinking skills and helpsstudents understand that there are often many good answers to aquestion. For example, a graph using food icons could represent…• How much a family eats in a week.• The food we would have at a family picnic.• My third-grade class’s favorite meats.• The type of food commercials I saw on TV this week.
Encourage students to brainstorm as many interpretations aspossible. Accept zany, imaginary interpretations as well as moremundane suggestions. Ask students to explain their answers. Then ask them to decide which interpretations are the most probable.
21. Be alert for graphing opportunities that emerge naturally from yourclassroom experience. Such activities are often the most meaningfuland best support for your curriculum.

47
The Graph Club 2.0 Ideas for the Classroom
Match GraphsIn Match Graphs mode, the program generates a random graph andchallenges students to create a different type of graph which representsthe same data. This mode gives students hands-on experience readinggraphs and transforming data from one form to another.
1. Start with an easy Match challenge. The program is preset to displaya picture graph on the left and a bar graph on the right. Even if yourstudents are more advanced, starting at this level helps thembecome familiar with the game and experience success.
2. Adapt the program to students’ skill level. You can set the numberof kinds displayed (from 1 to 5) and the types of graphs that studentsmatch from and to using the Teacher Preferences (see page 30).
• Create easier challenges by reducing the number of items beinggraphed and/or using the same type of graph in each view.
• Create more difficult challenges by increasing the number of itemsbeing graphed and/or using a more difficult graph type — e.g.,circle. You can also increase the scale maximum, or increase thenumber of kinds up to 12, using the options in the Graph menu(see pages 25–28).
3. Use Choose Symbols on the Graph menu (see page 25) to selectinteresting and relevant symbols.
4. Encourage cooperation. Have students solve Match challengestogether.
5. Encourage competition. Have students take turns solving Matchchallenges and keep score.
6. Create your own Match challenges, and use the Save As Activityfeature (see page 32) to store these activities as templates accessiblefrom the Activities menu.
7. Have students design Match challenges, save them, and thenchallenge their classmates.
8. Whenever possible, allow students to print the “I Matched It”certificate after completing a challenging match.

48
The Graph Club 2.0 Ideas for the Classroom
Choosing the Right Graph Type
Children need to understand that different types of graphs are used to describe different kinds of data. Consider these guidelines whenplanning and implementing graphing activities with your class.
Table All kinds of dataPicture Things that can be countedBar Things that can be counted or measuredLine Things that change over time, trendsCircle Parts of a whole, parts of a set
The following practices can encourage students to develop skills inidentifying appropriate ways of displaying different types of data:
• Display different representations of the same data side by side forcomparison.
• Use the Graph Type buttons to change data instantly from onerepresentation to another.
• Ask students which type of graph is the easiest for them tounderstand. Which graph do they think makes the most sense? Ask students to give reasons for their opinions.
• Encourage students to examine the ways data is displayed innewspapers, magazines, television, textbooks, and other media.
• Guide students in making generalizations about the types of databest displayed by each graph type.

49
The Graph Club 2.0 Ideas for the Classroom
Graphing Across the Curriculum
After a few exciting adventures with The Graph Club, your students willbegin to notice graphs in magazines, newspapers, books, television, andother media. They will be inspired to create their own graphs and willlikely suggest all kinds of interesting topics for surveys, interviews, andinvestigations. Ideas that emerge naturally from the classroom experiencewill be the most meaningful and will best support the curriculum, solook for these opportunities and encourage students to do so.
To help you get started, we’ve included several dozen graphing ideas.Not all topics are appropriate for every population, so be sure to consideryour student group. Select topics that are age appropriate and insure ahigh interest level and then enlist your students’ help in identifyingappropriate categories. Plan activities that actively engage your studentsin collecting and organizing data, and creating and interpreting graphs.
Some of the following topics are ideal for picture and bar graphs, otherswork best as line graphs, and some suggest the use of circle graphs.Suggested graph types are noted at the top of each list. (In some cases,additional graph types might also be appropriate.) When selecting atopic, consider the type of graph students will be constructing.
Favorite things (Table, Picture, Bar, Circle)Beverage (milk, juice, soda, etc.)Book, type of bookCandy, snack, dessertCerealColorColor for jacket, sweater, hat, etc.CookieDay of the weekDinosaurFast-food restaurantFruitHolidayIce cream flavorMonsterMoviePetPlanet to visitSeasonShoes, sneakers, bootsSong
50
The Graph Club 2.0 Ideas for the Classroom
Sport to watchSport/game to playStorybook characterStuffed animalTelevision showType of toyVacation spotVegetableWay to spend your leisure timeWild animal, zoo animal
How many? (Table, Picture, Bar, Circle)Animals of specific varieties at the zoo (lion, monkeys, giraffes, etc.)Birds (robins, bluebirds, cardinals, etc.)Boys/girls in class, family, club, etc.Children come to school by bus/car/bike/walkChildren have ancestors from Europe, Asia, Africa, Latin America, etc.Children have blue/brown/black/green eyesChildren have brown/blond/red/black hairChildren have relatives in other countries Children were born here/born elsewhere (other town, state, country)Children’s birthdays each seasonGames won/lostSunny/rainy/cloudy/snowy days this week/monthTrees of various kinds (oak, pine, maple, palm, etc.)
How many? (Table, Picture, Bar)Books readChildren in your familyCost of different food itemsCost of different toysDays for different seedlings to sproutDoors in your houseGoals, hits, runs, basketsLegs different animals haveLegs different insects haveTeeth children have lostTelevision shows watched per dayTelevisions/radios/telephones in householdTrash bags filled each week (in classroom or at home)

51
The Graph Club 2.0 Ideas for the Classroom
Measurements (Table, Bar)Blocks/miles to school, park, shopping areaChildren’s heightChildren’s weightHeight of different seedlings/plantsHeight of dolls, teddy bears, toy charactersHeight/length of different animalsHours to drive/fly to other citiesHow far a frog can jumpHow far students can jumpHow far students can throw a ball/beanbagHow high students can climb a ropeInches of rain/snowMinutes to walk to cafeteria/main office/library, etc.
Dividing things up (Table, Picture, Bar, Circle)How children spend their allowanceHow children spend their waking hoursHow money for a party, field trip, etc. is spentHow students share a cake, pie, cookies, pizza, apple, peanuts, etc.Types of recyclable trash collected around classroom, school,
and communityWhere allowance or club money comes from
How things change over time (Table, Picture, Bar, Line)Children’s height over several monthsChildren’s foot size over several monthsHeight/weight/length of animals over timeLength of shadows throughout the dayNumber of children who drink juice for breakfast each day
for several daysNumber of children who drink milk for lunch each day
for several daysPlant’s height over several weeksRainfall for several consecutive monthsTemperature (high/low/average) over several days,
weeks, or months

52
The Graph Club 2.0 Ideas for the Classroom
Printing Ideas
The Graph Club makes it easy to print graphs in a wide variety oflayouts and styles. Students can print up to five graphs on a singlepage, plus corresponding notebook text. All graphs can be printed inthree sizes — standard, big book (2 pages by 2 pages), or poster (3pages by 3 pages). In addition, students can print their graphs in solidcolor, or can use the pattern or outline options to save ink.
The Print Resources dialog (see page 23) also lets you print other neatstuff including assessment checklists, survey templates, and samplegraphs. Here are some suggestions for making the most of The GraphClub’s printing features.
• Have students use the notebook to write a description or story to gowith their graphs, then print the notebook text and graphs together.
• Create a graph but leave the notebook empty. When you print, clickthe Notes box (in the Print Graphs dialog). Your graph will print withthree blank lines. Make copies for each student in the class, and havestudents write a description or story below the graph.
• Print graphs with empty bars or circle segments. (Click the Lineoption in the Print Graphs dialog.) Have students color the graphsthemselves.
• Have students create a book composed entirely of graphs that tell a story. Print the graphs big book-size and bind them together.
• Print graphs poster-size and have students work together to colorthem and write a description or story. Post the finished product in the classroom, hallway, library, or another location in the school orcommunity.
• Create worksheets and quizzes. In the Print Graphs dialog, check theboxes for all three text fields (Your Name, Title of Graph, and Notes),but leave these text fields empty. The graph will print with blanklines where students can fill in their name, graph title, andinterpretation.
53
The Graph Club 2.0 Activities
Activities
The Graph Club is a powerful tool that you can use to teach importantgraphing skills and concepts, with connections across the curriculum. In this section, you’ll find a collection of ready-made graphing activitiesin math, social studies, science, and language arts. There are 33 activitiesincluded with the program and an additional 75 activities available onthe Ready-Made Activities CD, which is sold separately. These activitieslet you start graphing immediately and also provide ideas and modelsfor your own graphing activities.
Each activity includes:
• a graph file that you and students can access by clicking the Activitiesbutton on the main menu screen and then navigating to the relevantsubcategory
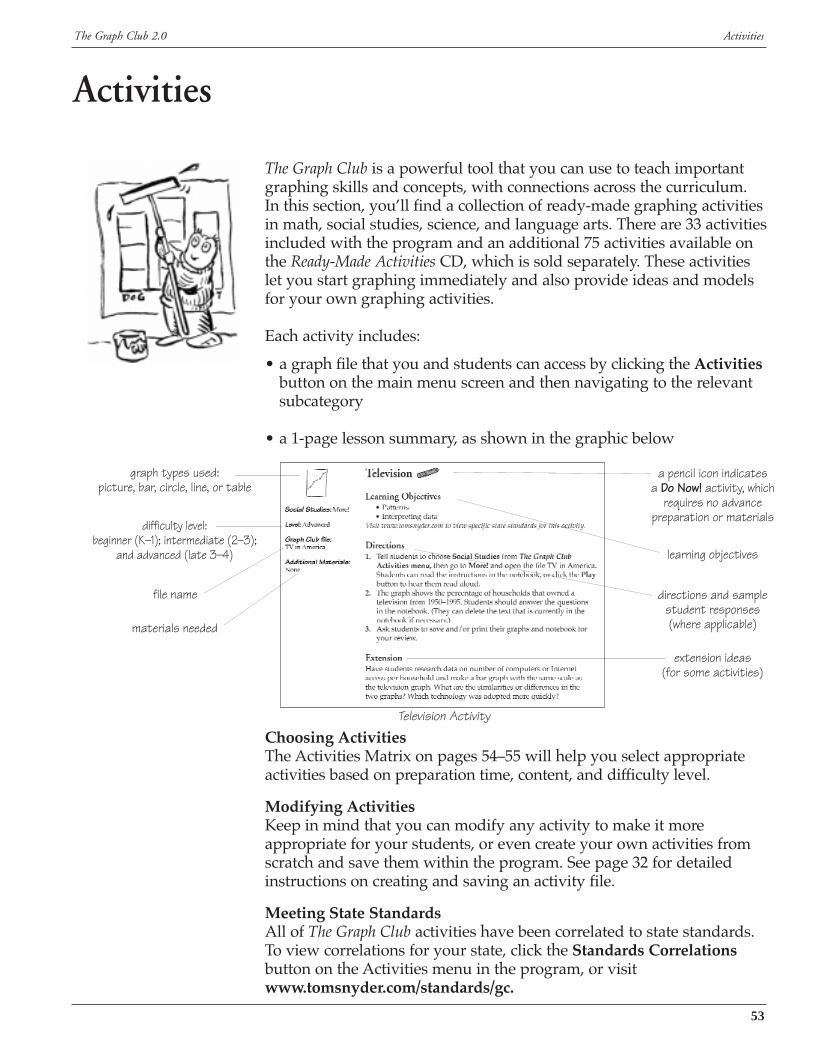
• a 1-page lesson summary, as shown in the graphic below
Choosing ActivitiesThe Activities Matrix on pages 54–55 will help you select appropriateactivities based on preparation time, content, and difficulty level.
Modifying ActivitiesKeep in mind that you can modify any activity to make it moreappropriate for your students, or even create your own activities fromscratch and save them within the program. See page 32 for detailedinstructions on creating and saving an activity file.
Meeting State StandardsAll of The Graph Club activities have been correlated to state standards.To view correlations for your state, click the Standards Correlationsbutton on the Activities menu in the program, or visitwww.tomsnyder.com/standards/gc.
learning objectives
file name
difficulty level: beginner (K–1); intermediate (2–3);
and advanced (late 3–4)
a pencil icon indicates a Do Now! activity, which
requires no advance preparation or materials
graph types used: picture, bar, circle, line, or table
directions and sample student responses (where applicable)
extension ideas (for some activities)
materials needed
Television Activity

54
The Graph Club 2.0 Activities
Activities Matrix
Do N
ow!
Do N
ow!
Do N
ow!
Do N
ow!
Do N
ow!
Do N
ow!
Do N
ow!
Do N
ow!
MA
TH
L
evel
Cat
egor
y &
Fil
eA
ctiv
ity
Tit
lePa
geG
rap
h T
ype
Lear
ning
Obj
ecti
ves
Rep
rod
uci
ble
sBe
ginn
er
Begi
nner
Begi
nner
Begi
nner
Begi
nner
Begi
nner
Inte
rmed
iate
Inte
rmed
iate
Inte
rmed
iate
Inte
rmed
iate
Adv
ance
d
Adv
ance
d
Adv
ance
d
Funn
y Fa
ces
How
Lon
g Is
You
r Pe
ncil?
Gra
phin
g 82
Cen
ts
Favo
rite
Fla
vor
Surv
ey
Mak
e Yo
ur O
wn
Surv
ey
Wha
t Mak
es a
Goo
d Pi
ctur
e G
raph
?
Cla
ss T
rip
Wha
t Mak
es a
Goo
d Ba
r G
raph
?
Wha
t Mak
es a
Goo
d C
ircl
e G
raph
?
Wha
t Mak
es a
Goo
d Ta
ble?
Favo
rite
Sea
sons
Rol
l the
Dic
e
Wha
t Mak
es a
Goo
d Li
ne G
raph
?
56 57 59 60 61 63 58 64 65 67 58 62 66
Pict
ure
& B
ar
Tabl
e &
Bar
Pict
ure
Tabl
e &
Pic
ture
Tabl
e &
Pic
ture
Pict
ure
Tabl
e &
Cir
cle
Bar
Cir
cle
Tabl
e
Tabl
e &
Cir
cle
Tabl
e &
Bar
Line
Funn
y Fa
ces
1 (p
age
110)
Penc
il Le
ngth
(p
age
113)
Surv
ey: D
o Yo
u Li
ke…
?(p
age
114)
Sam
ple
Pict
ure
Gra
ph(p
age
100)
Sam
ple
Bar
Gra
ph
(pag
e 10
1)
Sam
ple
Cir
cle
Gra
ph(p
age
102)
Sam
ple
Tabl
e (p
age
104)
Rol
l the
Dic
e (p
age
115)
Sam
ple
Line
Gra
ph(p
age
103)
• so
rtin
g•
clas
sify
ing
• or
gani
zing
dat
a in
a g
raph
• m
easu
rem
ent
• or
gani
zing
dat
a in
a g
raph
• m
onet
ary
units
• ad
ding
& s
ubtr
actin
g
• co
llect
ing
data
thro
ugh
surv
eys
• in
terp
retin
g da
ta
• ge
nera
ting
ques
tions
• co
llect
ing
data
thro
ugh
surv
eys
• in
terp
retin
g da
ta
• or
gani
zing
dat
a in
a g
raph
• fr
actio
ns
• or
gani
zing
dat
a in
a g
raph
• or
gani
zing
dat
a in
a g
raph
• or
gani
zing
dat
a in
a g
raph
• fr
actio
ns
• co
untin
g•
orga
nizi
ng d
ata
in a
gra
ph•
inte
rpre
ting
data
• pr
obab
ility
• or
gani
zing
dat
a in
a g
raph
Cou
ntin
g &
Sor
ting
Funn
y Fa
ces-
Hai
r
Mea
sure
men
t P
enci
ls
Mon
eyM
oney
-82
Cen
ts
Surv
eys
Surv
ey-F
avor
ite F
lavo
r
Surv
eys
Surv
ey-M
ake
Your
Ow
n
Mor
e!Fi
x a
Pic
ture
Gra
ph
Part
s &
Who
les
Cla
ss T
rip
Mor
e!Fi
x a
Bar
Gra
ph
Mor
e!Fi
x a
Cir
cle
Gra
ph
Mor
e!Fi
x a
Tabl
e
Part
s &
Who
les
Favo
rite
Sea
sons
Mor
e!R
oll t
he D
ice
Mor
e!Fi
x a
Line
Gra
ph
SO
CIA
LS
TU
DIE
S
Lev
elC
ateg
ory
& F
ile
Act
ivit
y T
itle
Page
Gra
ph
Typ
eLe
arni
ng O
bjec
tive
sR
epro
du
cib
les
Begi
nner
Begi
nner
Inte
rmed
iate
Adv
ance
d
Site
s in
Our
Tow
n
Com
pari
son
Shop
ping
How
Do
You
Spen
d Ti
me?
Com
mun
ity S
urve
y
71 73 68 69
Tabl
e &
Bar
Tabl
e &
Bar
Tabl
e &
Cir
cle
Tabl
e &
Pic
ture
Surv
ey: D
o Yo
u A
gree
…?
(pag
e 11
6)
• co
llect
ing
data
thro
ugh
surv
eys
• or
gani
zing
dat
a in
a g
raph
• co
mm
unity
• m
onet
ary
units
• co
llect
ing
data
thro
ugh
obse
rvat
ion
• or
gani
zing
dat
a in
a g
raph
• ec
onom
ics
• or
gani
zing
dat
a in
a g
raph
• ge
nera
ting
ques
tions
• co
llect
ing
data
thro
ugh
surv
eys
• in
terp
retin
g da
ta•
com
mun
ity
Geo
grap
hyTo
wn
Site
s
Econ
omic
sM
ilk P
rice
s
Fam
ily &
Com
mun
itySp
endi
ng T
ime
Fam
ily &
Com
mun
itySu
rvey
-Com
mun
ity Is
sue

55
The Graph Club 2.0 Activities
Do N
ow!
Do N
ow!
Do N
ow!
Do N
ow!
Adv
ance
d
Adv
ance
d
Adv
ance
d
Dai
ry P
rodu
ctio
n
Com
ing
to A
mer
ica
Tele
visi
on
70 72 74
Cir
cle
Line
Line
• ra
tios
& p
erce
ntag
es•
com
pari
ng•
inte
rpre
ting
data
• ag
ricu
ltura
l pro
duct
ion
• pa
tter
ns•
inte
rpre
ting
data
• im
mig
ratio
n•
econ
omic
s•
patt
erns
• in
terp
retin
g da
ta
Geo
grap
hyD
airy
Pro
duct
ion
His
tory
Com
ing
to A
mer
ica
Mor
e!T
V in
Am
eric
a
Do N
ow!
Do N
ow!
Do N
ow!
Do N
ow!
Do N
ow!
Do N
ow!
Begi
nner
Begi
nner
Inte
rmed
iate
Inte
rmed
iate
Inte
rmed
iate
Inte
rmed
iate
Adv
ance
d
Adv
ance
d
Eye
Col
or
Ani
mal
Liv
es
Plan
ts o
n th
e Pl
aygr
ound
Wha
t Mak
es a
Hea
lthy
Die
t?
Suga
r in
Dri
nks
Boun
cing
Bal
l
Use
the
Gra
ph to
Est
imat
e
Riv
er L
engt
h
75 76 77 78 79 80 80 82
Bar
& C
ircl
e
Tabl
e &
Bar
Tabl
e &
Bar
Pict
ure
Tabl
e &
Bar
Tabl
e &
Bar
Tabl
e &
Lin
e
Tabl
e &
Bar
Play
grou
nd P
lant
s(p
age
117)
Food
Gui
de P
yram
id
(pag
e 11
8)
Boun
cing
Bal
l (p
age
119)
• co
llect
ing
data
thro
ugh
obse
rvat
ion
• or
gani
zing
dat
a in
a g
raph
•co
mpa
ring
• in
terp
retin
g da
ta•
anim
als
• cl
assi
fyin
g•
colle
ctin
g da
ta th
roug
h re
sear
ch•
orga
nizi
ng d
ata
in a
gra
ph•
plan
ts
• or
gani
zing
dat
a in
a g
raph
• in
terp
retin
g da
ta•
nutr
ition
• or
gani
zing
dat
a in
a g
raph
• in
terp
retin
g da
ta•
nutr
ition
• m
easu
rem
ent
• co
llect
ing
data
thro
ugh
obse
rvat
ion
• or
gani
zing
dat
a in
a g
raph
• pa
tter
ns•
patt
erns
• in
terp
retin
g da
ta•
wea
ther
• co
llect
ing
data
thro
ugh
rese
arch
• or
gani
zing
dat
a in
a g
raph
• ph
ysic
al fe
atur
es
Mys
elf &
Oth
ers
Eye
Col
or
Ani
mal
s &
Pla
nts
Ani
mal
Liv
es
Ani
mal
s &
Pla
nts
Pla
ygro
und
Pla
nts
Hea
lth &
Nut
ritio
nH
ealth
y D
iet
Hea
lth &
Nut
ritio
nSu
gar
in D
rink
s
Expe
rim
ents
Bou
ncin
g B
all
Wea
ther
Was
hing
ton
Tem
pera
ture
s
Mor
e!R
iver
Len
gth
Begi
nner
Begi
nner
Inte
rmed
iate
Inte
rmed
iate
Inte
rmed
iate
The
Very
Hun
gry
Cat
erpi
llar
Frie
nds
Popu
lar
Aut
hors
Sylla
ble
Cou
nt
Orc
hest
ra In
stru
men
ts
83 84 84 85 86
Pict
ure
Pict
ure
Tabl
e &
Bar
Tabl
e &
Bar
Pict
ure
& B
ar
• co
llect
ing
data
• or
gani
zing
dat
a in
a g
raph
• lit
erat
ure
• in
terp
retin
g da
ta•
narr
ativ
e w
ritin
g
• co
llect
ing
data
thro
ugh
rese
arch
• or
gani
zing
dat
a in
a g
raph
• co
llect
ing
data
thro
ugh
obse
rvat
ion
• or
gani
zing
dat
a in
a g
raph
• ch
arac
teri
stic
s of
wor
ds
• co
llect
ing
data
thro
ugh
obse
rvat
ion
• or
gani
zing
dat
a in
a g
raph
• th
e ar
ts
Favo
rite
Boo
ksV
ery
Hun
gry
Cat
erpi
llar
Cre
ativ
e W
ritin
gM
aria
’s Fr
iend
s
Res
earc
h &
Rep
orts
Pop
ular
Aut
hors
Wor
d Pl
aySy
llabl
e C
ount
Mor
e!In
stru
men
ts
SC
IEN
CE
L
evel
Cat
egor
y &
Fil
eA
ctiv
ity
Tit
lePa
geG
rap
h T
ype
Lear
ning
Obj
ecti
ves
Rep
rod
uci
ble
s
LA
NG
UA
GE
AR
TS
Lev
elC
ateg
ory
& F
ile
Act
ivit
y T
itle
Page
Gra
ph
Typ
eLe
arni
ng O
bjec
tive
sR
epro
du
cib
les
Do N
ow!
Do N
ow!
56
The Graph Club 2.0 Activities
Math Activities
Funny Faces
Learning Objectives• Sorting• Classifying• Organizing data in a graph
Visit www.tomsnyder.com/standards/gc to view state standards for this activity.
Directions1. Ask students to sort the faces on the Funny Faces 1 reproducible by
hairstyle (curly, spiky, or wavy). Young students can circle each facewith a different colored crayon — red for curly hair, black for spikyhair, and yellow for wavy hair (to correspond to the colors used inthe program). Alternatively, you might cut out, or have students cutout, the faces so that they can sort them into piles.
2. Tell students to choose Math from The Graph Club Activities menu,then go to Counting & Sorting and open the file Funny Faces-Hair.Students can read the instructions in the notebook, or click the Play button to hear them read aloud.
3. Have students make a graph of the sorted faces.4. Have students click the button at the bottom of the screen to change
the bar graph into a circle graph. Then have them answer thequestion in the notebook:• Which hairstyle do half the funny faces have? (Wavy)
5. Ask students to save and/or print their graphs for your review.
Student graphs should show the following numbers of hairstyles:Curly = 3Spiky = 3Wavy = 6
ExtensionHave students sort the faces by a different attribute, such as eyes ormouth, or by a combination of attributes. (The Funny Faces 2 reproducibleon page 111 offers more complex combinations of attributes.) Havestudents create a graph to show the results. Alternatively, copy theFunny Faces Clip Art reproducible (page 112) for students to create theirown funny faces with various combinations of attributes.
Math: Counting & Sorting
Level: Beginner
The Graph Club file: Funny Faces - Hair
Additional Materials:• Copies of the Funny Faces 1
reproducible (page 110)• Red, black, and yellow
crayons (optional)• Scissors (optional)

57
The Graph Club 2.0 Activities
How Long Is Your Pencil?Learning Objectives
• Measurement• Organizing data in a graph
Visit www.tomsnyder.com/standards/gc to view state standards for this activity.
Directions1. Have students measure their own pencils and record the
measurement on the Pencil Length reproducible. Students can then ask three friends how long their pencils were, and record thelengths. You might write the length of your pencil on the board forstudents to record, or invite a volunteer to measure your pencil andshare the measurement with the class.
2. Tell students to choose Math from The Graph Club Activities menu,then go to Measurement and open the file Pencils. Students canread the instructions in the notebook, or click the Play button tohear them read aloud.
3. Have students make a bar graph of the measurements they took,and then answer the questions in the notebook.• Who has the shortest pencil?• Whose pencil is the longest?
4. Ask students to save and/or print their graphs for your review.
ExtensionDivide students into groups and have each group measure the pencilsand construct their graphs using different units (for example, centimeters,Unifix cubes, paper clips, thumbs). Then print and compare the graphs.What do students notice about the graphs? How are they similar anddifferent? (Even though different units are used, the relative heights of thebars are the same.)
Math: Measurement
Level: Beginner
The Graph Club file: Pencils
Additional Materials:• Copies of the Pencil Length
reproducible (page 113)• Rulers

58
The Graph Club 2.0 Activities
Class Trip
Learning Objectives• Fractions
Visit www.tomsnyder.com/standards/gc to view state standards for this activity.
Directions1. Tell students to choose Math from The Graph Club Activities menu,
then go to Parts & Wholes and open the file Class Trip. Studentscan read the instructions in the notebook, or click the Play button to hear them read aloud.
2. Have students answer the following questions in the notebook.(They can delete the text that is currently in the notebook, ifnecessary.)• Which place did 1/2 of the students vote for? (the theme park)• Which place did 1/4 of the students vote for? (the beach)• How many students are there in Mrs. O’Brien's class? Explain how
you found your answer. Sample response: There are 24 students inthe class. I got the answer by adding the number of votes in each categoryto find the total number.
3. Ask students to save and/or print their graphs and notebook foryour review.
Favorite Seasons
Learning Objectives• Fractions
Visit www.tomsnyder.com/standards/gc to view state standards for this activity.
Directions1. Tell students to choose Math from The Graph Club Activities menu, then
go to Parts & Wholes and open the file Favorite Seasons. Studentscan read the instructions in the notebook, or click the Play button tohear them read aloud.
2. Have students make a graph which shows the following: in a classof 18 students, 1/2 of the students like summer best; 1/3 like springbest; 1/6 like autumn best; the rest like winter best. Encouragestudents to create this graph by dragging symbols into the picturegraph.
Do Now!Do Now!
Do Now!Do Now!
Math: Parts & Wholes
Level: Advanced
The Graph Club file: Favorite Seasons
Additional Materials:None
Math: Parts & Wholes
Level: Intermediate
The Graph Club file: Class Trip
Additional Materials:None

59
The Graph Club 2.0 Activities
3. Ask students to save and/or print their graphs for your review.
Students’ graphs should show that 9 students liked summer best; 6students liked spring best; 3 students liked autumn best; and no oneliked winter best.
Graphing 82 Cents
Learning Objectives• Monetary units• Adding & subtracting
Visit www.tomsnyder.com/standards/gc to view state standards for this activity.
Directions1. Tell students to choose Math from The Graph Club Activities menu,
then go to Money and open the file Money-82 cents. Students canread the instructions in the notebook, or click the Play button tohear them read aloud.
2. Have students graph a way to make 82 cents using quarter, dime,nickel, and penny symbols in a picture graph.
3. When they’re ready, help students save and print their graphs.4. As a class, compare the graphs. How many ways did the class find
to get to 82 cents? Were there coins that every student had to use tomake 82 cents? (every graph must include at least two pennies)
ExtensionChallenge students to make two graphs: one to show how to get to 82cents (or another amount) with the smallest number of coins; the other,with the largest number of coins. (If the graph is set so that each symbolrepresents 1 unit, the smallest number of coins to make 82 cents is 6 — 3 quarters, 1 nickel, and 2 pennies; the largest number of coins is 19 — 3 dimes, 9 nickels, and 7 pennies.)
You can use this activity as a template for other activities using differentamounts of money. To help younger students make a connection to realcoins, consider making “mystery money” bags with different numbersof coins in them. Students can use the real coins to help them maketheir graphs.
Do Now!Do Now!
Math: Money
Level: Beginner
The Graph Club file: Money-82 cents
Additional Materials:None

60
The Graph Club 2.0 Activities
Favorite Flavor Survey
Learning Objectives• Collecting data through surveys• Interpreting data
Visit www.tomsnyder.com/standards/gc to view state standards for this activity.
Directions1. Using chart paper or the chalkboard, write the question, “What is
your favorite ice-cream flavor?” Then create a 4-column table listingthe flavors (chocolate, vanilla, strawberry, and pistachio) across thetop.
2. Ask students to volunteer to tell you which of the four flavors they like the best. Write students’ names in the chart. Then as aclass, count and record the total number of students in eachcategory. (To challenge older students, have them tally the classchoices individually.)
3. Tell students to choose Math from The Graph Club Activities menu,then go to Surveys and open the file Survey-Favorite Flavor.Students can read the instructions in the notebook, or click the Playbutton to hear them read aloud.
4. Have students make a graph that shows the number of studentswho like each flavor. Then have them write or record in thenotebook their answers to these questions: • What flavor do the most students like? • How many students like strawberry best? • What flavor is the least favorite? (They can delete the text that is currently in the notebook, if necessary.)
5. Ask students to save and/or print their graphs and notebook for your review.
Math: Surveys
Level: Beginner
The Graph Club file:Survey-Favorite Flavor
Additional Materials:Chart paper and markers (or chalkboard)

61
The Graph Club 2.0 Activities
Make Your Own Survey
Learning Objectives• Generating questions• Collecting data through surveys• Interpreting data
Visit www.tomsnyder.com/standards/gc to view state standards for this activity.
Directions1. Hand out copies of the Survey: Do You Like...? reproducible.
Students should fill in the blank to complete the question, “Do you like…?”
2. Give students time to ask their question of at least 10 people. They can ask classmates, students in the cafeteria or at recess, ortheir families at home. (If students don’t yet know how to make tally marks, explain that they should make a mark in one of theboxes for each person who answers their question. When they’refinished, the number of marks equals the number of people whogave that answer.)
3. Tell students to choose Math from The Graph Club Activities menu, then go to Surveys and open the file Survey-Make YourOwn. Students can read the instructions in the notebook, or click the Play button to hear them read aloud.
4. Have students make a picture graph of the results from their survey. Remind students to write a title that explains the topic of the graph, and write or record an interpretation in the notebook.(They can delete the text that is currently in the notebook, ifnecessary).
5. Ask students to save and/or print their graphs and notebook foryour review.
Math: Surveys
Level: Beginner
The Graph Club file:Survey-Make Your Own
Additional Materials:• Copies of the Survey:
Do You Like...? reproducible (page 114)
• Pencils• Clipboards

62
The Graph Club 2.0 Activities
Roll the Dice
Learning Objectives• Counting• Organizing data in a graph• Interpreting data• Probability
Visit www.tomsnyder.com/standards/gc to view state standards for this activity.
Directions1. Have students work in pairs to roll a die 30 times and record
the numbers that come up on the Roll the Dice reproducible. They should also record the total number of times that each number was rolled.
2. Tell students to choose Math from The Graph Club Activities menu,then go to More! and open the file Roll the Dice. Students can readthe instructions in the notebook, or click the Play button to hearthem read aloud.
3. Have students make a bar graph of the results from their experimentand write or record an interpretation in the notebook. (They candelete the text that is currently in the notebook, if necessary.)
4. When they’re ready, help students save and print their graphs withthe notebook text.
5. As a class, discuss the results of the experiment. What number came up the most? Do students have different answers? If you were to roll a die one more time, could students predict which numberwould come up? Are the chances that a 3 would be rolled more than,less than, or about the same as any other number? (about the same)
ExtensionPool the data from each pair of students and make one graph for the whole class. What do students notice about this graph? Howsimilar is it to the graphs they made with their partners?
Math: More!
Level: Advanced
The Graph Club file:Roll the Dice
Additional Materials:• Copies of the Roll the Dice
reproducible (page 115)• Six-sided die or number
cube (one for each pair of students)

63
The Graph Club 2.0 Activities
What Makes a Good Picture Graph?
Learning Objectives• Organizing data in a graph
Visit www.tomsnyder.com/standards/gc to view state standards for this activity.
Directions1. Have students work in pairs or small groups. Alternatively, you can
do this activity with the whole class by connecting your computerto a large-screen display so that all the students can see. Hand outcopies of the Sample Picture Graph reproducible.
2. Launch The Graph Club and choose Math from the Activities menu,then go to More! and open the file Fix a Picture Graph.
3. Tell the class that a student was supposed to make a graph showingthe eye color of all the students in her class. The survey data isshown in the notebook.
4. Have students spend a minute in their groups looking at the picturegraph on the screen and comparing it with the guidelines for picturegraphs on the handout. Ask them to think of at least one changethat would make the on-screen graph better.
5. Have students make suggestions for how to fix the graph. Be sure to cover the following criteria:
Data: the data for blue eyes is incorrect and needs to be increased.
Symbols: the symbol for green eyes does not match the others and should be changed.
Title: the title should describe what the graph is about, for example,“Eye Color in Our Class.”
Interpretation: the interpretation should explain what is shown on the graph, for example, “The largest number of students have brown eyes.”
Labels: the labels should explain what is being graphed and the unit of measure, for example, “Eye Color” on the x-axis and “Number of Students” on the y-axis.
Math: More!
Level: Beginner
The Graph Club file:Fix a Picture Graph
Additional Materials:• Copies of the Sample Picture
Graph reproducible (page 100)
• Optional: television and scan converter or other large-screen display for the computer

64
The Graph Club 2.0 Activities
What Makes a Good Bar Graph?Learning Objectives
• Organizing data in a graphVisit www.tomsnyder.com/standards/gc to view state standards for this activity.
Directions1. Have students work in pairs or small groups. Alternatively, you can
do this activity with the whole class by connecting your computer toa large-screen display so that all the students can see. Hand outcopies of the Sample Bar Graph reproducible.
2. Launch The Graph Club and choose Math from the Activities menu,then go to More! and open the file Fix a Bar Graph.
3. Tell the class that this student, Sam, was supposed to make a graphshowing which sports students like to play after school. The surveydata is shown in the notebook.
4. Have students spend a minute in their groups looking at the bargraph on the screen and comparing it with the guidelines for bargraphs on the handout. Ask them to think of at least one change thatwould make the on-screen graph better.
5. Have students make suggestions for how to fix the graph. Be sure to cover the following criteria:
Data: the data for basketball is missing and needs to be included in the graph.
Symbols: the symbol for swimming is not very clear and should be changed.
Title: the title should describe what the graph is about, for example, “After-School Sports.”
Colors: each bar should be a different color.
Scale: the scale should be smaller to make the bars in the graph more visible.
Interpretation: the interpretation should explain what is shown on the graph, for example, “The largest number of students plays soccer after school.”
Labels: the labels should explain what is being graphed and the unitof measure, for example, “Sports” on the x-axis and “Number of Students” on the y-axis.
Math: More!
Level: Intermediate
The Graph Club file:Fix a Bar Graph
Additional Materials:• Copies of the Sample Bar
Graph reproducible (page 101)• Optional: television and
scan converter or other large-screen display for the computer

65
The Graph Club 2.0 Activities
What Makes a Good Circle Graph?
Learning Objectives• Organizing data in a graph
Visit www.tomsnyder.com/standards/gc to view state standards for this activity.
Directions1. Have students work in pairs or small groups. Alternatively, you can
do this activity with the whole class by connecting your computerto a large-screen display so that all the students can see. Hand outcopies of the Sample Circle Graph reproducible.
2. Launch The Graph Club and choose Math from the Activities menu,then go to More! and open the file Fix a Circle Graph.
3. Tell the class that a student was supposed to make a graph showinghow students in the class get to school. The survey data is shown inthe notebook.
4. Have students spend a minute in their groups looking at the circlegraph on the screen and comparing it with the guidelines for circlegraphs on the handout. Ask them to think of at least one changethat would make the on-screen graph better.
5. Have students make suggestions for how to fix the graph. Be sure to cover the following criteria:
Data: the data for cars is incorrect and needs to be increased.
Symbols: the symbol for walking is not very clear and should be changed.
Title: the title should describe what the graph is about, for example,“How Students Get to School.”
Colors: each segment of the graph should be a different color.
Interpretation: the interpretation should explain what is shown on the graph, for example, “The bus is the most common way to get to school.”
Math: More!
Level: Intermediate
The Graph Club file:Fix a Circle Graph
Additional Materials:• Copies of the Sample Circle
Graph reproducible (page 102)
• Optional: television and scan converter or other large-screen display for the computer

66
The Graph Club 2.0 Activities
What Makes a Good Line Graph?
Learning Objectives• Organizing data in a graph
Visit www.tomsnyder.com/standards/gc to view state standards for this activity.
Directions1. Have students work in pairs or small groups. Alternatively, you can
do this activity with the whole class by connecting your computerto a large-screen display so that all the students can see. Hand outcopies of the Sample Line Graph reproducible.
2. Launch The Graph Club and choose Math from the Activities menu,then go to More! and open the file Fix a Line Graph.
3. Tell the class that a student was supposed to make a graph showingthe temperature for one week. The survey data is shown in thenotebook.
4. Have students spend a minute in their groups looking at the linegraph on the screen and comparing it with the guidelines for linegraphs on the handout. Ask them to think of at least one change that would make the on-screen graph better.
5. Have students make suggestions for how to fix the graph. Be sure to cover the following criteria:
Data: the data for day 5 is incorrect and needs to be increased.
Symbols: the symbols should be changed to make sense with the data. For example, you could use the thermometer symbol (in the Math tab) or a dot or triangle for each data point.
Title: the title should describe what the graph is about, for example, “Temperature for One Week.”
Scale: the scale should be smaller to make the line on the graph more visible.
Interpretation: the interpretation should explain what is shown on the graph, for example, “The temperature increased by 7 degrees from the beginning to the end of the week.”
Labels: time should be on the x-axis and temperature should be on the y-axis. The labels should include names and units, for example, “Time in Days” on the x-axis and “Temperature (Fahrenheit)” on the y-axis.
Math: More!
Level: Advanced
The Graph Club file:Fix a Line Graph
Additional Materials:• Copies of the Sample Line
Graph reproducible (page 103)
• Optional: television and scan converter or other large-screen display for the computer

67
The Graph Club 2.0 Activities
What Makes a Good Table?
Learning Objectives• Organizing data in a graph
Visit www.tomsnyder.com/standards/gc to view state standards for this activity.
Directions1. Have students work in pairs or small groups. Alternatively, you can
do this activity with the whole class by connecting your computerto a large-screen display so that all the students can see. Hand outcopies of the Sample Table reproducible.
2. Launch The Graph Club and choose Math from the Activities menu,then go to More! and open the file Fix a Table.
3. Tell the class that a student was supposed to make a table showingwhich pizza toppings students liked the best. The survey data isshown in the notebook.
4. Have students spend a minute in their groups looking at the tableon the screen and comparing it with the guidelines for tables on thehandout. Ask them to think of at least one change that would makethe on-screen table better.
5. Have students make suggestions for how to fix the table. Be sure to cover the following criteria:
Data: the data for pineapple is missing and needs to be included in the table.
Title: the title should describe what the table is about, for example, “Favorite Pizza Toppings.”
Interpretation: the interpretation should explain what is shown on the table, for example, “Cheese and pepperoni are the most popular toppings.”
Labels: the column labels should explain what is in each column, for example, “Toppings” in the left column and “Number of Students” in the right column.
Math: More!
Level: Intermediate
The Graph Club file:Fix a Table
Additional Materials:• Copies of the Sample Table
reproducible (page 104)• Optional: television and
scan converter or other large-screen display for the computer
68
The Graph Club 2.0 Activities
Social Studies Activities
How Do You Spend Time?
Learning Objectives• Organizing data in a graph
Visit www.tomsnyder.com/standards/gc to view state standards for this activity.
Directions1. Tell students to choose Social Studies from The Graph Club
Activities menu, then go to Family & Community and open the file Spending Time. Students can read the instructions in thenotebook, or click the Play button to hear them read aloud.
2. Have students make a table and circle graph to show how theyspend time on a typical school day. Invite students to add or change symbols in the graph if they want. Then have students write or record in the notebook their answers to these questions: • How do you spend most of your time? • What activity takes the least time?
3. Ask students to save and/or print their graphs and notebook for your review.
ExtensionHave students make a second graph that shows how they spend time on a weekend day, and then compare the two graphs. What arethe similarities and differences?
Do Now!Do Now!
Social Studies:Family & Community
Level: Intermediate
The Graph Club file:Spending Time
Additional Materials:None

69
The Graph Club 2.0 Activities
Community Survey
Learning Objectives• Generating questions• Collecting data through surveys• Interpreting data• Community
Visit www.tomsnyder.com/standards/gc to view state standards for this activity.
Directions1. Distribute copies of the local newspaper and/or recent articles on
a community issue (or have students bring in articles from home).2. After students have had a chance to read about the issue and
discuss it as a class, hand out copies of the Survey: Do You Agree...?reproducible.
3. As a class, discuss how you might complete the question, “Do youagree that…?” and have students fill in the blank on their surveys.(Alternatively, have students come up with their own questions.)
4. Give students time to ask their question of at least 10 communitymembers. They can ask classmates, students in the cafeteria or atrecess, their families at home, or neighbors, and record the answersin the survey.
5. Tell students to choose Social Studies from The Graph ClubActivities menu, then go to Family & Community and open the file Survey-Community Issue. Students can read the instructions in the notebook, or click the Play button to hear them read aloud.
6. Have students make a picture graph of the results from their survey.Remind them to give their graph a title that explains what it’s aboutand write or record an interpretation in the notebook. (They candelete the text that is currently in the notebook, if necessary).
7. Ask students to save and/or print their graphs and notebook foryour review.
ExtensionHave students compile the responses from all their surveys andorganize the data into a bar graph. Students can print the graph andsend it to the local newspapers, mayor’s office, or other involvedorganization with a letter explaining what their survey means.
Social Studies:Family & Community
Level: Advanced
The Graph Club file:Survey-Community Issue
Additional Materials:• Copies of the Survey:
Do You Agree...? reproducible(page 116)
• Pencils, clipboards• Copies of the local
newspaper and/or recent articles on a community issue

70
The Graph Club 2.0 Activities
Dairy Production
Learning Objectives• Ratios & percentages• Comparing• Interpreting data• Agricultural production
Visit www.tomsnyder.com/standards/gc to view state standards for this activity.
Directions1. Tell students to choose Social Studies from The Graph Club
Activities menu, then go to Geography and open the file DairyProduction*. Students can read the instructions in the notebook, or click the Play button to hear them read aloud.
2. Ask students to answer the following questions in the notebook.(They can delete the text that is currently in the notebook, if necessary.)• Which single state produced the largest percentage of milk?
(California)• Which state produced the same percentage of milk as
Pennsylvania? (New York)• Write an interpretation that explains the graph. Sample response:
The graph shows that over half of all milk produced in the United Statescomes from just seven states.
3. Ask students to save and/or print their graphs and notebook for your review.
* The data for this activity is from the U.S. Department of Agriculture publication,Milk Production, Disposition, and Income, 2001 Summary, published by the NationalAgricultural Statistics Service.
Do Now!Do Now!
Social Studies: Geography
Level: Advanced
The Graph Club file:Dairy Production
Additional Materials:None

71
The Graph Club 2.0 Activities
Sites in Our Town
Learning Objectives• Collecting data through surveys• Organizing data in a graph• Community
Visit www.tomsnyder.com/standards/gc to view state standards for this activity.
Directions1. On chart paper or the chalkboard, make a table with five columns
and two rows. Ask a student to volunteer the name of a place intown that he or she has visited (for example, the library, a park, or a historic landmark). Write the name of the place in the top rowand the student’s name below. Then ask other students to raise theirhands if they have ever been to this place, too. Write the students’names in the chart.
2. As a class, count and record the total number of students in eachcategory.
3. Tell students to choose Social Studies from The Graph ClubActivities menu, then go to Geography and open the file TownSites. Students can read the instructions in the notebook, or click the Play button to hear them read aloud.
4. Have students make a graph that shows the number of studentswho have visited each place. Remind them that they can type newlabels and choose new symbols to represent each place. Studentsshould answer the following questions in the notebook. (They candelete the text that is currently in the notebook, if necessary.)• What place have the most students visited?• What place have the fewest students visited?
5. Ask students to save and/or print their graphs and notebook for your review.
Social Studies: Geography
Level: Beginner
The Graph Club file:Town Sites
Additional Materials:Chart paper or chalkboard

72
The Graph Club 2.0 Activities
Coming to America
Learning Objectives• Patterns• Interpreting data• Immigration• Economics
Visit www.tomsnyder.com/standards/gc to view state standards for this activity.
Directions1. Tell students to choose Social Studies from The Graph Club
Activities menu, then go to History and open the file Coming to America*. Let students read the instructions in the notebook, or click the Play button to hear them read aloud.
2. Have students examine the graph showing immigration data for theUnited States from 1995 to 2000. Students should answer thefollowing questions in the notebook. (They can delete the text that iscurrently in the notebook, if necessary.)• In which year did the most people immigrate to the United States?
(1996)• About how many thousand people immigrated to the United
States in 1997? (about 800,000)• Would you predict that more than 500,000 people immigrated
to the United States in 2001? Explain your answer. (Probably morethan 500,000 people immigrated to the United States in 2001, becausethe number was above 500,000 every year before that.)
3. Ask students to save and/or print their graphs and notebook foryour review.
* The data for this activity is from the U.S. Department of Justice, Immigration and Naturalization Service Annual Reports Legal Immigration, Fiscal Year 2001, and Legal Immigration, Fiscal Year 1998, published by the Office of Policy and Planning,Statistics Division.
Do Now!Do Now!
Social Studies: History
Level: Advanced
The Graph Club file:Coming to America
Additional Materials:None

73
The Graph Club 2.0 Activities
Comparison Shopping
Learning Objectives• Monetary units• Collecting data through observation• Organizing data in a graph• Economics
Visit www.tomsnyder.com/standards/gc to view state standards for this activity.
Directions1. On chart paper or the chalkboard, make a list of four local stores
that sell milk. Ask a student to volunteer to check the price of agallon of milk from each store. (Alternatively, you might visit ortelephone four local stores to find out the price.)
2. Make a table showing the different prices of milk from each store.Then work with students to convert the dollar amounts into cents.
3. Tell students to choose Social Studies from The Graph ClubActivities menu, then go to Economics and open the file MilkPrices. Students can read the instructions in the notebook, or clickthe Play button to hear them read aloud.
4. Have students make a graph that shows milk prices at four localstores. Remind them that they can type new labels for each place.Students should answer the following questions in the notebook.(They can delete the text that is currently in the notebook, ifnecessary.)• Which store has the most expensive milk?• How much does milk cost at the least expensive store? • What does this graph show?
5. Ask students to save and/or print their graphs and notebook foryour review.
ExtensionHave students calculate how much money would be saved by buyingmilk at the least expensive store, as compared with the most expensivestore, for one year.
Social Studies: Economics
Level: Beginner
The Graph Club file:Milk Prices
Additional Materials:Chart paper or chalkboard

74
The Graph Club 2.0 Activities
Television
Learning Objectives• Patterns• Interpreting data
Visit www.tomsnyder.com/standards/gc to view state standards for this activity.
Directions1. Tell students to choose Social Studies from The Graph Club Activities
menu, then go to More! and open the file TV in America*. Studentscan read the instructions in the notebook, or click the Play button tohear them read aloud.
2. Have students examine the graph showing the percentage ofhouseholds that owned a television from 1950 to 1995. Then askstudents to answer the following questions in the notebook. (Theycan delete the text that is currently in the notebook, if necessary.)• About what percentage of households owned a TV in 1960?
(about 85%)• During which 5-year period was there the greatest increase
in TV ownership? (between 1950 and 1955)• In what year did the number of households with televisions
reach its peak? (1980)3. Ask students to save and/or print their graphs and notebook
for your review.
ExtensionHave students research data on number of computers or Internet access per household and make a bar graph with the same scale as the television graph. What are the similarities or differences in the two graphs? Which technology was adopted more quickly?
* The data for this activity is from the U.S. Census Bureau. Statistical Abstract of the United States: 1999, No. 1440. Selected Communications Media: 1920–1998. (July 19, 2001)
Do Now!Do Now!
Social Studies: More!
Level: Advanced
The Graph Club file:TV in America
Additional Materials:None

75
The Graph Club 2.0 Activities
Science Activities
Eye Color
Learning Objectives• Collecting data through observation• Organizing data in a graph
Visit www.tomsnyder.com/standards/gc to view state standards for this activity.
Directions1. On chart paper or the chalkboard, make a chart with five different
eye colors: brown, hazel, blue, green, and black. Ask students tovolunteer to tell you what color eyes they have. Write studentsnames in the chart. Then count and record the total number ofstudents in each category.
2. Tell students to choose Science from The Graph Club Activitiesmenu, then go to Myself & Others and open the file Eye Color.Students can read the instructions in the notebook, or click the Play button to hear them read aloud.
3. Have students make a graph which shows the number of studentswith each eye color. They should also write or record in thenotebook their answers to these questions: • What color eyes do the largest number of students have? • What color eyes do the fewest students have? (They can delete the text that is currently in the notebook, ifnecessary.)
4. Ask students to save and/or print their graphs and notebook foryour review.
Science: Myself & Others
Level: Beginner
The Graph Club file:Eye Color
Additional Materials:Chart paper or chalkboard

76
The Graph Club 2.0 Activities
Animal Lives
Learning Objectives• Comparing• Interpreting data• Animals
Visit www.tomsnyder.com/standards/gc to view state standards for this activity.
Directions1. Tell students to choose Science from The Graph Club Activities
menu, then go to Animals & Plants and open the file Animal Lives.Students can read the instructions in the notebook, or click the Playbutton to hear them read aloud.
2. Ask students to look at the graph showing the typical life spans offive animals. Have students answer the following questions in thenotebook. (They can delete the text that is currently in the notebook,if necessary.)• Which animal lives the fewest years? (the mouse)• Which animal lives the longest? (the elephant)
3. Have students save and/or print their graphs and notebook for your review.
Do Now!Do Now!
Science: Animals & Plants
Level: Beginner
The Graph Club file:Animal Lives
Additional Materials:None

77
The Graph Club 2.0 Activities
Plants on the Playground
Learning Objectives• Classifying• Collecting data through research• Organizing data in a graph• Plants
Visit www.tomsnyder.com/standards/gc to view state standards for this activity.
Directions1. To complete this activity, prepare students with some background
knowledge about trees and plants. You might consider collectingleaves and other samples from different kinds of plant (deciduous,evergreen, cactus, and palm) for students to examine before theyhead out to the playground. The books Crinkleroot’s Guide toKnowing the Trees by Jim Arnosky and Trees and Leaves by Altheahave background information on the different kinds of trees.
2. Take students out to the playground, or a park area, to observe the plants. Have them record how many of each kind of plant they find on the Playground Plants reproducible.
3. Tell students to choose Science from The Graph Club Activitiesmenu, then go to Animals & Plants and open the file PlaygroundPlants. Students can read the instructions in the notebook, or clickthe Play button to hear them read aloud.
4. Have students make a graph that shows the number of each kindof plant that they found on the playground. They should also write or record in the notebook their answers to these questions: • What kind of plant is the least common? • Would this plant be able to grow here? Use books to help you
find the answer. (Students answers will vary. Generally, cactuses and palms don’tgrow in cooler climates; deciduous and evergreen trees don’t growin desert climates.) Remind students that they can delete the text that is currently in thenotebook, if necessary.
5. Ask students to save and/or print their graphs and notebook for your review.
Science: Animals & Plants
Level: Intermediate
The Graph Club file:Playground Plants
Additional Materials:• Playground Plants
reproducible (page 117)• Pencils• Clipboards• Books about various types
of trees

78
The Graph Club 2.0 Activities
What Makes a Healthy Diet?
Learning Objectives• Organizing data in a graph• Interpreting data• Nutrition
Visit www.tomsnyder.com/standards/gc to view state standards for this activity.
Directions1. Tell students to choose Science from The Graph Club Activities
menu, then go to Health & Nutrition and open the file Healthy Diet.Students can read the instructions in the notebook, or click the Playbutton to hear them read aloud.
2. Ask students to change the graph to show a balanced diet for oneday. They can use the Food Guide Pyramid reproducible to help them. They should also write or record in the notebook an explanation of the changes they made and why they made them. (They candelete the text that is currently in the notebook, if necessary.)
3. Ask students to save and/or print their graphs and notebook foryour review.
Students’ final graphs should show this information: Fats/Sweets –very little; Milk Group — 2–3 servings; Meat group — 2–3 servings;Vegetables — 3–5 servings; Fruit — 2–4 servings; Grains — 6–11servings. To change the graph to a healthier diet, students should havedecreased the amount of meat, grains, and fats and sweets, andincreased the amount of milk, vegetables, and fruits.
ExtensionEncourage students to keep a record of their own diets for a day or aweek, then graph the results. How many students have healthy diets?What changes would make students’ diets healthier?
Science: Health & Nutrition
Level: Intermediate
The Graph Club file:Healthy Diet
Additional Materials:Copies of the Food GuidePyramid reproducible (page 118)

79
The Graph Club 2.0 Activities
Sugar in Drinks
Learning Objectives• Organizing data in a graph• Interpreting data• Nutrition
Visit www.tomsnyder.com/standards/gc to view state standards for this activity.
Directions1. Tell students to choose Science from The Graph Club Activities
menu, then go to Health & Nutrition and open the file Sugar in Drinks. Students can read the instructions in the notebook, or click the Play button to hear them read aloud.
2. Point students to the graph showing the grams of sugar in an 8-ounce serving of four drinks: milk, orange juice, water, and Coca-Cola. Have students add their own favorite drink in a fifth columnon the graph. They can either estimate the amount of sugar in theirfavorite drink, or use information on the nutrition label. Studentsshould also answer the following questions in the notebook. (Theycan delete the text that is currently in the notebook, if necessary.)• Which drink has the most sugar? (Coca-Cola)• How many grams of sugar would there be in a 16-ounce glass
of milk? (24 grams)3. Ask students to save and/or print their graphs and notebook for
your review.
ExtensionEncourage students to survey the drinks available in the schoolcafeteria and add them to the graph. These graphs could be posted in the cafeteria for all students to view.
You might also consider bringing in a bag of sugar, and having studentsmeasure 1 gram, 2 grams, 3 grams, and so on. This will give them avisual sense of the amount of sugar in each drink.
Science: Health & Nutrition
Level: Intermediate
The Graph Club file:Sugar in Drinks
Additional Materials:Nutrition information labelsfrom students’ favorite drinks(optional)

80
The Graph Club 2.0 Activities
Use the Graph to Estimate
Learning Objectives• Patterns• Interpreting data• Weather
Visit www.tomsnyder.com/standards/gc to view state standards for this activity.
Directions1. Tell students to choose Science from The Graph Club Activities
menu, then go to Weather and open the file WashingtonTemperatures. Students can read the instructions in the notebook,or click the Play button to hear them read aloud.
2. Have students examine the graph showing the temperature from6:00 AM to 6:00 PM (in two-hour increments) on one day inWashington, D.C. The data for 6:00 PM is missing. Have studentsestimate what they think the temperature might have been at 6:00 PMand add their estimate to the graph. Students should also write orrecord in the notebook to explain why they made their estimate.(They can delete the text currently in the notebook, if necessary.)
3. Ask students to save and/or print their graphs and notebook foryour review.
Students’ graphs might show an estimate in the upper 80s, because thetemperature was rising all day. However, the actual recorded temperatureat that time was 81˚ Fahrenheit. As evening approached, the temperaturebegan to drop.
Bouncing Ball
Learning Objectives• Measurement• Collecting data through observation• Organizing data in a graph• Patterns
Visit www.tomsnyder.com/standards/gc to view state standards for this activity.
Directions1. Find a spot, such as a brick or cement wall, next to a paved area
where students can mark their ball bounces on the wall with chalk.
Do Now!Do Now!
Science: Weather
Level: Advanced
The Graph Club file:Washington Temperatures
Additional Materials:None
Science: Experiments
Level: Intermediate
The Graph Club file:Bouncing Ball
Additional Materials:• Copies of the Bouncing Ball
reproducible (page 119)• 1 tennis ball for each pair
of students• Tape measure and chalk

81
The Graph Club 2.0 Activities
Alternatively, tape chart paper to a wall in the classroom or hallway.Mark off (or have students mark) height measurements on the wallin 1-foot increments.
2. Have students follow the instructions on the Bouncing Ballreproducible to drop a ball from different heights, using the markson the wall as a guide, and record how high the ball bounces. (You might demonstrate to students how to drop the ball and record the height of its bounce.)
3. Tell students to choose Science from The Graph Club Activitiesmenu, then go to Experiments and open the file Bouncing Ball.Students can read the instructions in the notebook, or click the Play button to hear them read aloud.
4. Have students make a graph that shows how high the ball bouncedwhen dropped from 2, 4, and 6 feet. Ask them to also write or recordin the notebook their prediction of how high the ball might bouncewhen dropped from 8 feet. (Students’ answers will vary. Generally,the higher the drop, the higher the bounce.) They can delete the textcurrently in the notebook, if necessary.
5. Ask students to save and/or print their graphs and notebook foryour review.
6. As a class, discuss students’ predictions. How high did they estimatethe ball would bounce when dropped from 8 feet? Conclude theexperiment by dropping a ball from 8 feet. How close werestudents’ predictions?
ExtensionHave students conduct this experiment with several types of balls suchas a ping-pong ball, basketball, rubber playground ball, and beach ball.They can compare how high the different kinds of balls bounce. Whatpatterns or relationships do they see? Alternatively, have students bouncethe same kind of ball on a variety of surfaces. How do different surfaceschange how high the ball bounces?

82
The Graph Club 2.0 Activities
River Length
Learning Objectives• Collecting data through research• Organizing data in a graph• Physical features
Visit www.tomsnyder.com/standards/gc to view state standards for this activity.
Directions1. Tell students to choose Science from The Graph Club Activities
menu, then go to More! and open the file River Length. Studentscan read the instructions in the notebook, or click the Play button to hear them read aloud.
2. Have students use books or the Internet to research the lengths of five rivers: the Gila (in Arizona); the Pecos (in Texas); the Platte(in Nebraska); the Susquehanna (in Maryland); and the Willamette(in Oregon). Then have them make a bar graph of the lengths.Remind students to cite their sources in the notebook. (They candelete the text currently in the notebook, if necessary.)
3. Ask students to save and/or print their graphs and notebook foryour review.
Students’ final graphs should show this information: Gila, 649 miles;Pecos, 926 miles; Platte, 990 miles; Susquehanna, 447 miles; Willamette,309 miles.*
ExtensionEncourage students to research a local river and add it to the graph.
* This data is from the U.S. Geological Survey publication Water Fact Sheet: LargestRivers in the United States by J.C. Kammerer. Students’ data may vary slightlydepending on their sources.
Science: More!
Level: Advanced
The Graph Club file:River Length
Additional Materials:Library books or Internet access

83
The Graph Club 2.0 Activities
Language Arts Activities
The Very Hungry Caterpillar
Learning Objectives• Collecting data• Organizing data in a graph• Literature
Visit www.tomsnyder.com/standards/gc to view state standards for this activity.
Directions1. Have students read (or read aloud to them) the book The Very
Hungry Caterpillar by Eric Carle.2. Tell students to choose Language Arts from The Graph Club
Activities menu, then go to Favorite Books and open the file Very Hungry Caterpillar. Students can read the instructions in the notebook, or click the Play button to hear them read aloud.
3. Point students to the graph showing the days of the week, andsome of the items that the caterpillar ate. Have students use theinformation in the book to make a graph of what the caterpillar ate.Remind them to add a title to the graph.
4. Ask students to save and/or print their graphs and notebook foryour review.
5. Discuss with students what the hungry caterpillar ate on the lastday (Saturday). How might you represent those items on the graph?
Students’ graphs should show that the caterpillar ate:Monday — 1 appleTuesday — 2 pearsWednesday — 3 plumsThursday — 4 strawberriesFriday — 5 orangesSample title: What the Hungry Caterpillar Ate
Language Arts:Favorite Books
Level: Beginner
The Graph Club file:Very Hungry Caterpillar
Additional Materials:Copies of the book The Very Hungry Caterpillarby Eric Carle

84
The Graph Club 2.0 Activities
Friends
Learning Objectives• Interpreting data• Narrative writing
Visit www.tomsnyder.com/standards/gc to view state standards for this activity.
Directions1. Tell students to choose Language Arts from The Graph Club
Activities menu, then go to Creative Writing and open the fileMaria’s Friends. Students can read the instructions in the notebook,or click the Play button to hear them read aloud.
2. Have students look at the graph showing the number of friends thatMaria played with at recess on each day of one week. Ask studentsto add a title to the graph, and then write a story to go with the graph.Students can write their stories in the notebook, or since notebookspace is limited, they can write their stories on paper and then printthe graph to attach to the story.
Popular Authors
Learning Objectives• Collecting data through research• Organizing data in a graph
Visit www.tomsnyder.com/standards/gc to view state standards for this activity.
Directions1. Have students work individually or in groups to research the number
of books published by five popular children’s authors: Marc Brown,Roald Dahl, Dr. Seuss, Jan Brett, and Eric Carle, as well as their ownfavorite author. (One helpful library resource might be the JuniorAuthors & Illustrators series, edited by Sally Holmes Holtze andpublished by H. W. Wilson.)
Do Now!Do Now!
Language Arts:Research & Reports
Level: Intermediate
The Graph Club file:Popular Authors
Additional Materials:Library or Internet access
Language Arts:Creative Writing
Level: Beginner
The Graph Club file:Maria’s Friends
Additional Materials:• Paper • Pencil

85
The Graph Club 2.0 Activities
2. Tell students to choose Language Arts from The Graph ClubActivities menu, then go to Research & Reports and open the file Popular Authors. Students can read the instructions in thenotebook, or click the Play button to hear them read aloud.
3. Have students use the information they’ve gathered about theauthors to make a graph of books the authors have published.Remind students to add their own favorite author to the graph.
4. Ask students to save and/or print their graphs and notebook foryour review.
Students’ graphs should include the following authors: Marc Brown (81 books), Roald Dahl (31 books), Dr. Seuss (36 books), Jan Brett (28 books),Eric Carle (72 books) (books published as of 2002).
ExtensionStudents could make a circle graph to show how many books they haveread out of the total number of books a favorite author has written.
Syllable Count
Learning Objectives• Collecting data through observation• Organizing data in a graph• Characteristics of words
Visit www.tomsnyder.com/standards/gc to view state standards for this activity.
Directions1. Provide students with a variety of children’s books and have them
choose one (or their favorite book). Students should look at the firstthree sentences of a book and count the number of words that haveone, two, three, four, or five syllables.
2. Tell students to choose Language Arts from The Graph ClubActivities menu, then go to Word Play and open the file SyllableCount. Students can read the instructions in the notebook, or clickthe Play button to hear them read aloud.
3. Have students make a graph of the syllables they counted. Studentsthen answer the following question, “Which number of syllableswas the most common?”
Language Arts: Word Play
Level: Intermediate
The Graph Club file:Syllable Count
Additional Materials:An assortment of children’s books

86
The Graph Club 2.0 Activities
4. Ask students to save and/or print their graphs and notebook foryour review.
5. Discuss the graphs as a class. What does the information onsyllables tell you about how easy or hard it is to read the text?
ExtensionHave students look at and count other features of words, such as how many have vowel pairs, silent E, number of letters in the words,and so on.
Orchestra Instruments
Learning Objectives• Collecting data through observation• Organizing data in a graph• The arts
Visit www.tomsnyder.com/standards/gc to view state standards for this activity.
Directions1. Help students research the number of five different instruments in
the school (or local) orchestra: violin, trumpet, flute, piano, and drum. (Alternatively, for a more intensive study of orchestralinstruments, have students research instrument families includingstringed, brass, wind, keyboard, and percussion.)
2. Tell students to choose Language Arts from The Graph ClubActivities menu, then go to More! and open the file Instruments.Students can read the instructions in the notebook, or click the Play button to hear them read aloud.
3. Direct students to use the information they’ve gathered about theinstruments to make a graph.
4. Ask students to save and/or print their graphs for your review.
Language Arts: More!
Level: Intermediate
The Graph Club file:Instruments
Additional Materials:• Access to the school
orchestra (or a local orchestra)
• Paper• Pencils

87
The Graph Club 2.0 Assessment
Assessment
The Graph Club provides many opportunities to assess students’understanding of graphing concepts and skills. Both in the program and in this Teacher’s Guide, you’ll find many tools to help you assess students’ progress.
Assessment Checklists for Teachers (pages 89–93)On the following pages you’ll find easy-to-use checklists to help you quickly assess students’ work. Use these for graded graphing projects.There is one checklist for each type of graph — picture, bar, circle, line, and table.
Graph Rubrics (pages 94–98)The graph rubrics (one for each graph type) can be used to help you define both the graphing skills you want to teach and yourexpectations for student-created graphs.
Student Graph Checklist (page 99)The Student Graph Checklist includes general graphing tips that can apply to any type of graph. You can hand it out to students to keep for reference or to use before turning in a final project forevaluation. The Student Graph Checklist can also be a useful tool for peer evaluations.
Sample Graphs (pages 100–104)The sample graphs show models of good graphs and offer tips for making graphs. You can use them to help introduce each type of graph, or enlarge them for classroom display. In the Activities section, you’ll findwhole-class lessons you can use in conjunction with the printed samplegraphs to help students understand what makes a good graph of eachtype (see pages 63–67).

88
The Graph Club 2.0 Assessment
Match ModeUse the program’s Match mode to evaluate students’ understanding of the relationship between different representations of the same data(see page 18).
ActivitiesMany of the cross-curricular activities included with the The Graph Clubask students to collect data (through a survey, field study, or research),then graph that data and write an interpretation of their findings in the program’s notebook. Any of these activities could be used as aculminating project for assessment. Other activities present studentswith a completed graph and ask them to write an interpretation oranswer specific questions about the graph in the notebook. Completedactivities can be saved and printed to add to students’ portfolios. See the Activities section of this guide (beginning on page 53) for more information.

89The Graph Club ©1993–2003 Tom Snyder Productions, Inc. Permission granted to copy for classroom use only.
Assessment Checklist for Picture Graphs
Use this checklist to help you review students’ picture graphs created with The Graph Club software. You may wish topick and choose criteria from this list depending on your students’ grade level and ability.
Beginning — the student doesn’t understand the concept or demonstrate the skill, and needs continuous support fromthe teacher to complete the task to grade-level expectations
Developing — the student has some understanding of the concept or grasp of the skill, but may still need somesupport from the teacher to complete the task to grade-level expectations
Accomplished — the student understands the concept or appropriately applies the skill, and can work independentlyof the teacher to complete the task to grade-level expectations
Beg
inn
ing
Dev
elop
ing
Acc
omp
lish
ed
❒ ❒ ❒
❒ ❒ ❒
❒ ❒ ❒
❒ ❒ ❒
❒ ❒ ❒
❒ ❒ ❒
❒ ❒ ❒
DataThe data is accurate and complete.
SymbolsThe symbols selected are a logical choice for the data.
Graph TypeThe picture graph is an appropriate graph type and makes the data easy tointerpret at a glance.
TitleThe title is clear and reflects the graph topic.
InterpretationThe interpretation is clearly written and shows insight by accuratelyexplaining relationships or making predictions based on the data.
LabelsThe axis labels are clear and include both units and names where applicable.The x-axis label describes what is being graphed and the y-axis labeldescribes the unit of measure.
SpellingCorrect spelling is used in title, labels, and interpretation.
Notes
Student Name: _________________________________________
Assignment: ___________________________________________
Date: _________________________________________________
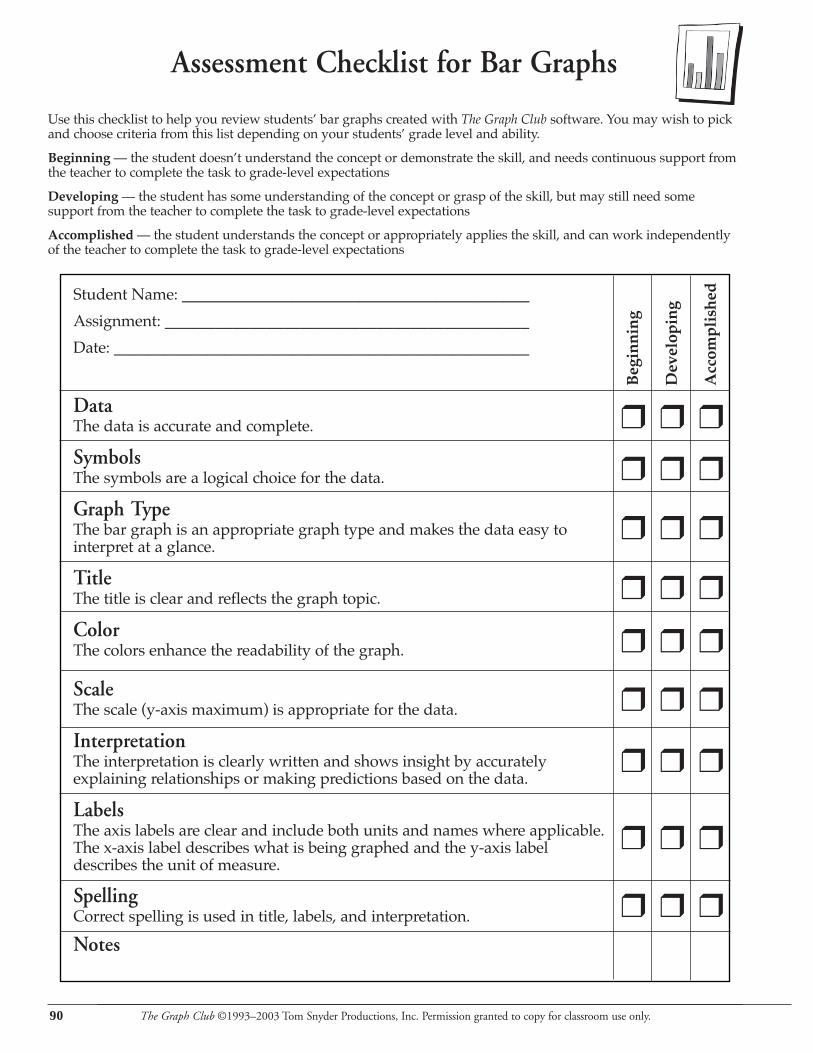
90 The Graph Club ©1993–2003 Tom Snyder Productions, Inc. Permission granted to copy for classroom use only.
Assessment Checklist for Bar Graphs
Use this checklist to help you review students’ bar graphs created with The Graph Club software. You may wish to pickand choose criteria from this list depending on your students’ grade level and ability.
Beginning — the student doesn’t understand the concept or demonstrate the skill, and needs continuous support fromthe teacher to complete the task to grade-level expectations
Developing — the student has some understanding of the concept or grasp of the skill, but may still need somesupport from the teacher to complete the task to grade-level expectations
Accomplished — the student understands the concept or appropriately applies the skill, and can work independentlyof the teacher to complete the task to grade-level expectations
Beg
inn
ing
Dev
elop
ing
Acc
omp
lish
ed
❒ ❒ ❒
❒ ❒ ❒
❒ ❒ ❒
❒ ❒ ❒
❒ ❒ ❒
❒ ❒ ❒
❒ ❒ ❒
❒ ❒ ❒
❒ ❒ ❒
DataThe data is accurate and complete.
SymbolsThe symbols are a logical choice for the data.
Graph TypeThe bar graph is an appropriate graph type and makes the data easy tointerpret at a glance.
TitleThe title is clear and reflects the graph topic.
ColorThe colors enhance the readability of the graph.
ScaleThe scale (y-axis maximum) is appropriate for the data.
InterpretationThe interpretation is clearly written and shows insight by accuratelyexplaining relationships or making predictions based on the data.
LabelsThe axis labels are clear and include both units and names where applicable.The x-axis label describes what is being graphed and the y-axis labeldescribes the unit of measure.
SpellingCorrect spelling is used in title, labels, and interpretation.
Notes
Student Name: _________________________________________
Assignment: ___________________________________________
Date: _________________________________________________

91The Graph Club ©1993–2003 Tom Snyder Productions, Inc. Permission granted to copy for classroom use only.
Assessment Checklist for Circle Graphs
Use this checklist to help you review students’ circle graphs created with The Graph Club software. You may wish topick and choose criteria from this list depending on your students’ grade level and ability.
Beginning — the student doesn’t understand the concept or demonstrate the skill, and needs continuous support fromthe teacher to complete the task to grade-level expectations
Developing — the student has some understanding of the concept or grasp of the skill, but may still need somesupport from the teacher to complete the task to grade-level expectations
Accomplished — the student understands the concept or appropriately applies the skill, and can work independentlyof the teacher to complete the task to grade-level expectations
Beg
inn
ing
Dev
elop
ing
Acc
omp
lish
ed
❒ ❒ ❒
❒ ❒ ❒
❒ ❒ ❒
❒ ❒ ❒
❒ ❒ ❒
❒ ❒ ❒
❒ ❒ ❒
DataThe data is accurate and complete.
SymbolsThe symbols are a logical choice for the data.
Graph TypeThe circle graph is an appropriate graph type and makes the data easy tointerpret at a glance.
TitleThe title is clear and reflects the graph topic.
ColorThe colors enhance the readability of the graph.
InterpretationThe interpretation is clearly written and shows insight by accuratelyexplaining relationships or making predictions based on the data.
SpellingCorrect spelling is used in title, labels, and interpretation.
Notes
Student Name: _________________________________________
Assignment: ___________________________________________
Date: _________________________________________________

92 The Graph Club ©1993–2003 Tom Snyder Productions, Inc. Permission granted to copy for classroom use only.
Assessment Checklist for Line Graphs
Use this checklist to help you review students’ line graphs created with The Graph Club software. You may wish to pickand choose criteria from this list depending on your students’ grade level and ability.
Beginning — the student doesn’t understand the concept or demonstrate the skill, and needs continuous support fromthe teacher to complete the task to grade-level expectations
Developing — the student has some understanding of the concept or grasp of the skill, but may still need somesupport from the teacher to complete the task to grade-level expectations
Accomplished — the student understands the concept or appropriately applies the skill, and can work independentlyof the teacher to complete the task to grade-level expectations
Beg
inn
ing
Dev
elop
ing
Acc
omp
lish
ed
❒ ❒ ❒
❒ ❒ ❒
❒ ❒ ❒
❒ ❒ ❒
❒ ❒ ❒
❒ ❒ ❒
❒ ❒ ❒
❒ ❒ ❒
DataThe data is accurate and complete. Time is on the x-axis and units of valueare on the y-axis.
SymbolsThe symbols enhance the readability of the graph. (A consistent symbol isused to represent the data points, or multiple symbols are used andorganized in a logical way.)
Graph TypeThe line graph is an appropriate graph type and makes the data easy tointerpret at a glance.
TitleThe title is clear and reflects the graph topic.
ScaleThe scale (y-axis maximum) is appropriate for the data.
InterpretationThe interpretation is clearly written and shows insight by accuratelyexplaining relationships or making predictions based on the data.
LabelsThe axis labels are clear and include both units and names where applicable.The x-axis label describes the unit of time and the y-axis label describes theunit of measure.
SpellingCorrect spelling is used in title, labels, and interpretation.
Notes
Student Name: _________________________________________
Assignment: ___________________________________________
Date: _________________________________________________

93The Graph Club ©1993–2003 Tom Snyder Productions, Inc. Permission granted to copy for classroom use only.
Assessment Checklist for Tables
Use this checklist to help you review students’ tables created with The Graph Club software. You may wish to pick andchoose criteria from this list depending on your students’ grade level and ability.
Beginning — the student doesn’t understand the concept or demonstrate the skill, and needs continuous support fromthe teacher to complete the task to grade-level expectations
Developing — the student has some understanding of the concept or grasp of the skill, but may still need somesupport from the teacher to complete the task to grade-level expectations
Accomplished — the student understands the concept or appropriately applies the skill, and can work independentlyof the teacher to complete the task to grade-level expectations
Beg
inn
ing
Dev
elop
ing
Acc
omp
lish
ed
❒ ❒ ❒
❒ ❒ ❒
❒ ❒ ❒
❒ ❒ ❒
❒ ❒ ❒
❒ ❒ ❒
❒ ❒ ❒
DataThe data is accurate and complete.
SymbolsThe symbols are a logical choice for the data.
Graph TypeThe table is appropriate and makes the data easy to interpret at a glance.
TitleThe title is clear and reflects the topic.
InterpretationThe interpretation is clearly written and shows insight by accuratelyexplaining relationships or making predictions based on the data.
LabelsThe column labels are clear and include both units and names whereapplicable.
SpellingCorrect spelling is used in title, labels, and interpretation.
Notes
Student Name: _________________________________________
Assignment: ___________________________________________
Date: _________________________________________________
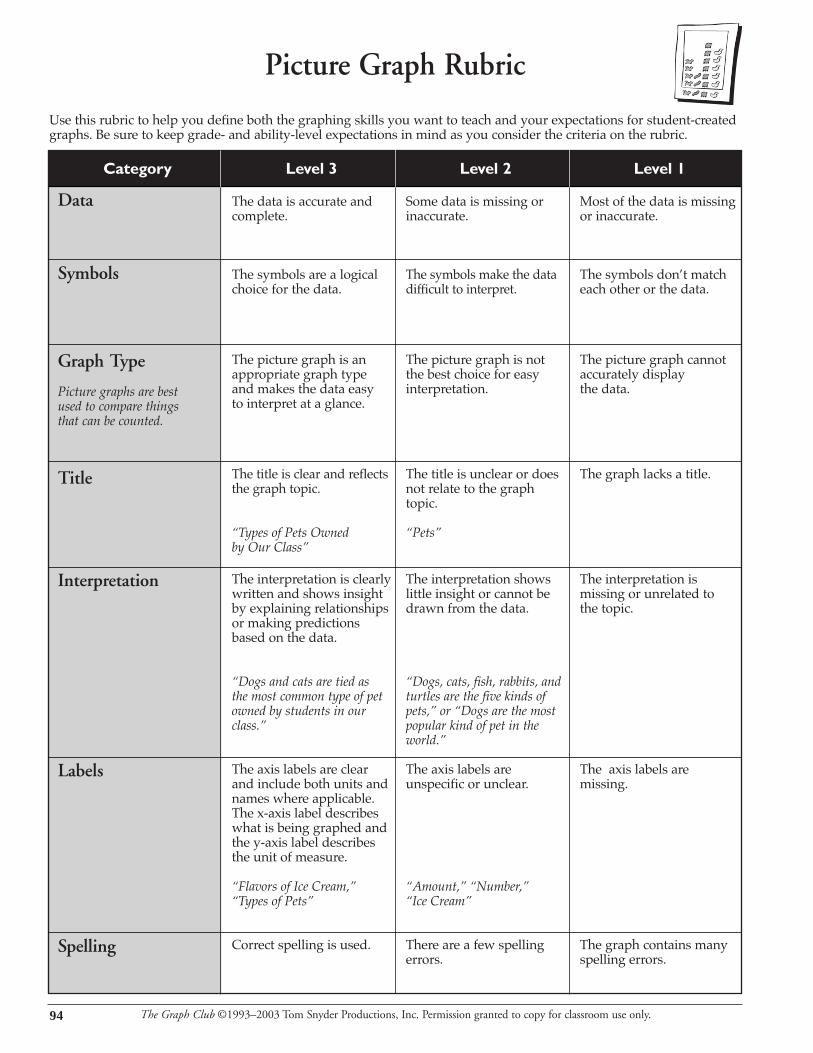
94
Category
Data
Symbols
Graph Type
Picture graphs are best used to compare things that can be counted.
Title
Interpretation
Labels
Spelling
Level 3
The data is accurate andcomplete.
The symbols are a logical choice for the data.
The picture graph is anappropriate graph type and makes the data easy to interpret at a glance.
The title is clear and reflectsthe graph topic.
“Types of Pets Owned by Our Class”
The interpretation is clearlywritten and shows insightby explaining relationshipsor making predictionsbased on the data.
“Dogs and cats are tied as the most common type of petowned by students in ourclass.”
The axis labels are clearand include both units andnames where applicable.The x-axis label describeswhat is being graphed andthe y-axis label describesthe unit of measure.
“Flavors of Ice Cream,”“Types of Pets”
Correct spelling is used.
Level 2
Some data is missing orinaccurate.
The symbols make the datadifficult to interpret.
The picture graph is notthe best choice for easyinterpretation.
The title is unclear or doesnot relate to the graphtopic.
“Pets”
The interpretation showslittle insight or cannot bedrawn from the data.
“Dogs, cats, fish, rabbits, andturtles are the five kinds ofpets,” or “Dogs are the mostpopular kind of pet in theworld.”
The axis labels areunspecific or unclear.
“Amount,” “Number,” “Ice Cream”
There are a few spellingerrors.
Level 1
Most of the data is missingor inaccurate.
The symbols don’t matcheach other or the data.
The picture graph cannotaccurately display the data.
The graph lacks a title.
The interpretation ismissing or unrelated to the topic.
The axis labels aremissing.
The graph contains manyspelling errors.
Picture Graph Rubric
Use this rubric to help you define both the graphing skills you want to teach and your expectations for student-createdgraphs. Be sure to keep grade- and ability-level expectations in mind as you consider the criteria on the rubric.
The Graph Club ©1993–2003 Tom Snyder Productions, Inc. Permission granted to copy for classroom use only.

95The Graph Club ©1993–2003 Tom Snyder Productions, Inc. Permission granted to copy for classroom use only.
Bar Graph Rubric
Category
Data
Symbols
Graph TypeBar graphs are best used to compare things that can be counted or measured.
Title
Color
Scale(y-axis maximum)
Interpretation
Labels
Spelling
Level 3
The data is accurate andcomplete.
The symbols are a logical choice for the data.
The bar graph is anappropriate graph typeand makes the data easy tointerpret at a glance.
The title is clear and reflects the graph topic.
“Favorite Fruits in OurClass”
The colors enhance thereadability of the graph.
The scale is appropriate forthe data.
The interpretation is clearlywritten and shows insightby explaining relationshipsor making predictionsbased on the data.
“Dogs and cats are tied as the most common type of petowned by students in ourclass.”
The axis labels are clear andinclude both units andnames where applicable.The x-axis label describeswhat is being graphed andthe y-axis label describesthe unit of measure.
“Flavors of Ice Cream,” “Typesof Pets,” “Number of Votes”
Correct spelling is used.
Level 2
Some data is missing orinaccurate.
The symbols make the datadifficult to interpret.
The bar graph is not thebest choice for easyinterpretation.
The title is unclear or doesnot relate to the graphtopic.
“Fruit”
The colors are notdistinctly different and/ordo not enhance readability.
The scale is too high for thedata.
The interpretation showslittle insight or cannot bedrawn from the data.
“Dogs, cats, fish, rabbits, andturtles are the five kinds ofpets,” or “Dogs are the mostpopular kind of pet in theworld.”
The axis labels areunspecific or unclear.
“Amount,” “Number,” “Ice Cream”
There are a few spellingerrors.
Level 1
Most of the data is missingor inaccurate.
The symbols don’t matcheach other or the data.
The graph lacks a title.
Some or all of the colorsare the same and/or are apoor choice for the data.
The scale is too low todisplay all the data.
The interpretation ismissing or unrelated to the topic.
The axis labels are missing.
The graph contains manyspelling errors.
Use this rubric to help you define both the graphing skills you want to teach and your expectations for student-createdgraphs. Be sure to keep grade- and ability-level expectations in mind as you consider the criteria on the rubric.
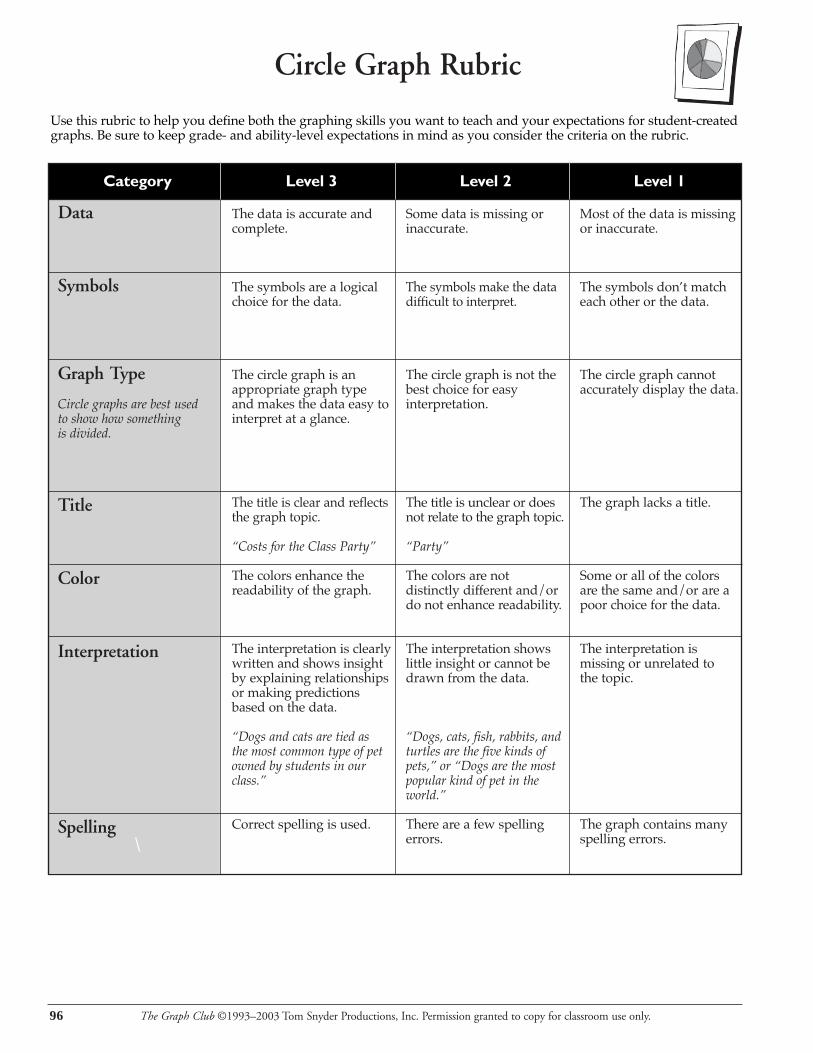
96 The Graph Club ©1993–2003 Tom Snyder Productions, Inc. Permission granted to copy for classroom use only.
Circle Graph Rubric
Category
Data
Symbols
Graph Type
Circle graphs are best used to show how something is divided.
Title
Color
Interpretation
Spelling\
Level 3
The data is accurate andcomplete.
The symbols are a logical choice for the data.
The circle graph is anappropriate graph typeand makes the data easy tointerpret at a glance.
The title is clear and reflectsthe graph topic.
“Costs for the Class Party”
The colors enhance thereadability of the graph.
The interpretation is clearlywritten and shows insightby explaining relationshipsor making predictionsbased on the data.
“Dogs and cats are tied as the most common type of petowned by students in ourclass.”
Correct spelling is used.
Level 2
Some data is missing orinaccurate.
The symbols make the datadifficult to interpret.
The circle graph is not thebest choice for easyinterpretation.
The title is unclear or doesnot relate to the graph topic.
“Party”
The colors are notdistinctly different and/ordo not enhance readability.
The interpretation showslittle insight or cannot bedrawn from the data.
“Dogs, cats, fish, rabbits, andturtles are the five kinds ofpets,” or “Dogs are the mostpopular kind of pet in theworld.”
There are a few spellingerrors.
Level 1
Most of the data is missingor inaccurate.
The symbols don’t matcheach other or the data.
The circle graph cannotaccurately display the data.
The graph lacks a title.
Some or all of the colorsare the same and/or are apoor choice for the data.
The interpretation ismissing or unrelated to the topic.
The graph contains manyspelling errors.
Use this rubric to help you define both the graphing skills you want to teach and your expectations for student-createdgraphs. Be sure to keep grade- and ability-level expectations in mind as you consider the criteria on the rubric.

97The Graph Club ©1993–2003 Tom Snyder Productions, Inc. Permission granted to copy for classroom use only.
Line Graph Rubric
Category
Data
Symbols
Graph TypeLine graphs are best used to show how something changesover time.
Title
Scale(y-axis maximum)
Interpretation
Labels
Spelling
Level 3
The data is accurate andcomplete. Time is on the x-axis and units of value are on the y-axis.
The symbols enhance thereadability of the graph. Aconsistent symbol is used, ormultiple symbols are usedand organized in a logical way.
The line graph is anappropriate graph type andmakes the data easy tointerpret at a glance.
The title is clear and reflects the graph topic.
“Growth of a Plant in One Month”
The scale is appropriate for thedata.
The interpretation is clearlywritten and shows insight byexplaining relationships ormaking predictions based onthe data.
“The tomato plant doubled inheight in the first two weeks.Then the growth slowed down.”
The axis labels are clear andinclude both units and nameswhere applicable. The x-axislabel describes the unit of timeand the y-axis label describesthe unit of measure.
“Height in Inches,” “Number of Sales,” “Time in Days”
Correct spelling is used.
Level 2
Some data is inaccurate ormissing, or time is on the y-axis and units of value are on the x-axis.
The symbols make the datadifficult to interpret.
The line graph is not the bestchoice for easy interpretation.
The title is unclear or does notrelate to the graph topic.
“Tomatoes”
The scale is too high for thedata.
The interpretation shows littleinsight or cannot be drawnfrom the data.
“The tomato plant grew 14inches,” or “This plant wouldgrow faster if it got moresunlight.”
The axis labels are unspecificor unclear.
“Amount,” “Number,” “Ice Cream”
There are a few spellingerrors.
Level 1
Most of the data is missing orinaccurate.
The symbols don’t match eachother or the data.
The line graph cannotaccurately display the data.
The graph lacks a title.
The scale is too low to displayall the data.
The interpretation is missingor unrelated to the topic.
The axis labels are missing.
The graph contains manyspelling errors.
Use this rubric to help you define both the graphing skills you want to teach and your expectations for student-createdgraphs. Be sure to keep grade- and ability-level expectations in mind as you consider the criteria on the rubric.

98 The Graph Club ©1993–2003 Tom Snyder Productions, Inc. Permission granted to copy for classroom use only.
Table Rubric
Category
Data
Symbols
Graph Type
Tables can be used to show any kind of data.
Title
Interpretation
Labels
Spelling
Level 3
The data is accurate andcomplete.
The symbols are a logical choice for the data.
The table is appropriateand makes the data easy tointerpret at a glance.
The title is clear and reflectsthe topic.
“Eye Color in Our Class”
The interpretation is clearlywritten and shows insightby explaining relationshipsor making predictionsbased on the data.
“Dogs and cats are tied as the most common type of petowned by students in ourclass.”
The column labels are clearand include both units andnames where applicable.
“Flavors of Ice Cream,” “Eye Color,” “Number of Students”
Correct spelling is used.
Level 2
Some data is missing orinaccurate.
The symbols make the datadifficult to interpret.
The table is not the bestchoice for easyinterpretation.
The title is unclear or doesnot relate to the topic.
“Colors”
The interpretation showslittle insight or cannot bedrawn from the data.
“Dogs, cats, fish, rabbits, andturtles are the five kinds ofpets,” or “Dogs are the mostpopular kind of pet in theworld.”
The column labels areunspecific or unclear.
“Amount,” “Number,” “Ice Cream”
There are a few spellingerrors.
Level 1
Most of the data is missingor inaccurate.
The symbols don’t matcheach other or the data.
The table lacks a title.
The interpretation ismissing or unrelated to the topic.
The column labels aremissing.
The graph contains manyspelling errors.
Use this rubric to help you define both the graphing skills you want to teach and your expectations for student-createdgraphs. Be sure to keep grade- and ability-level expectations in mind as you consider the criteria on the rubric.

99The Graph Club ©1993–2003 Tom Snyder Productions, Inc. Permission granted to copy for classroom use only.
Name Date
❒ DataDid you show all the data on the graph?
❒ SymbolsDid you pick symbols that clearly represent the data?
❒ Graph TypeDid you choose the best kind of graph for your data?
❒ TitleDoes your title tell what the graph is about?
❒ ColorsDo the colors help make the graph easy to read?
Student Graph Checklist
Before you finish your graph, use this list to make sure it’s complete.
❒ Scale (for bar and line graphs)Is the scale appropriate for the data you are showingon your graph?
❒ InterpretationDid you write an interpretation to explain what the graph means?
❒ LabelsDid you write clear labels that tell what you are graphing, and what unit of measure you are using?
❒ SpellingDid you check your spelling?
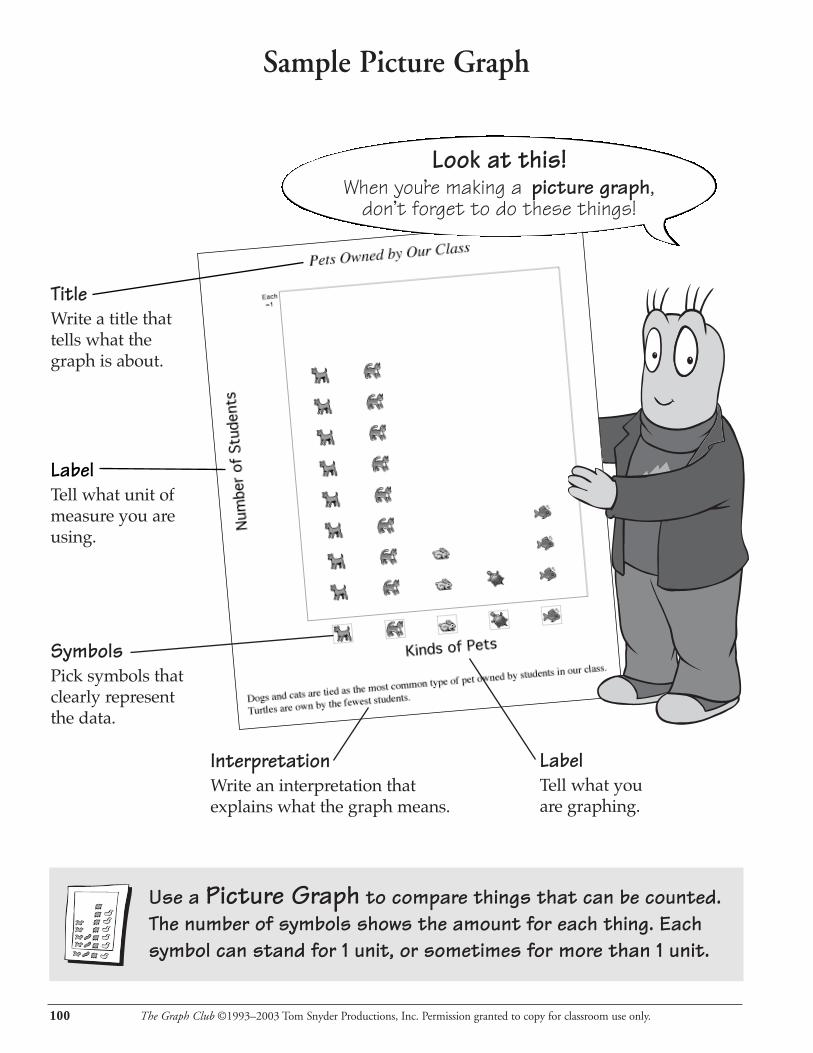
100 The Graph Club ©1993–2003 Tom Snyder Productions, Inc. Permission granted to copy for classroom use only.
Sample Picture Graph
Use a Picture Graph to compare things that can be counted.The number of symbols shows the amount for each thing. Eachsymbol can stand for 1 unit, or sometimes for more than 1 unit.
LabelTell what unit ofmeasure you areusing.
SymbolsPick symbols thatclearly represent the data.
InterpretationWrite an interpretation thatexplains what the graph means.
TitleWrite a title thattells what thegraph is about.
LabelTell what youare graphing.
Look at this!When you’re making a picture graph,
don’ t forget to do these things!

101The Graph Club ©1993–2003 Tom Snyder Productions, Inc. Permission granted to copy for classroom use only.
Sample Bar Graph
Use a Bar Graph to compare things that can be counted or measured. The height of each bar shows the amount for each thing.
ScaleSet the scale so that it’seasy to see the differencesin the heights of the bars.
LabelTell what unit of measureyou are using.
SymbolsPick symbols that clearlyrepresent the data.
InterpretationWrite an interpretation thatexplains what the graph means.
TitleWrite a title that tells what the graph is about.
Hey, graphers!Here are some ways you can make
your bar graphs great!
LabelTell what youare graphing.
ColorsPick a different color for each bar.

102 The Graph Club ©1993–2003 Tom Snyder Productions, Inc. Permission granted to copy for classroom use only.
Sample Circle Graph
Use a Circle Graph to show how something is divided. Each segment in the circle represents one part of the whole.
SymbolsPick symbols that clearlyrepresent the data.
InterpretationWrite an interpretation thatexplains what the graph means.
TitleWrite a title that tellswhat the graph is about.
ColorsPick a different color for each section.
Look at this great graph!Use these tips to make a great circle graph!

103The Graph Club ©1993–2003 Tom Snyder Productions, Inc. Permission granted to copy for classroom use only.
Sample Line Graph
Use a Line Graph to show how something changes over time.Each symbol on the graph shows the value at a given point intime. The line shows how the value has changed between eachpoint in time.
ScaleSet the scalemaximum just above the highestdata point.
LabelTell what unit ofmeasure you are using.
SymbolsPick a plain symbol, and use thesame symbol for each data point.
InterpretationWrite an interpretation thatexplains what the graph means.
TitleWrite a title thattells what thegraph is about.
Attention, graphers!Here are the secrets to making
a great line graph!
LabelTell what unit oftime you are using.
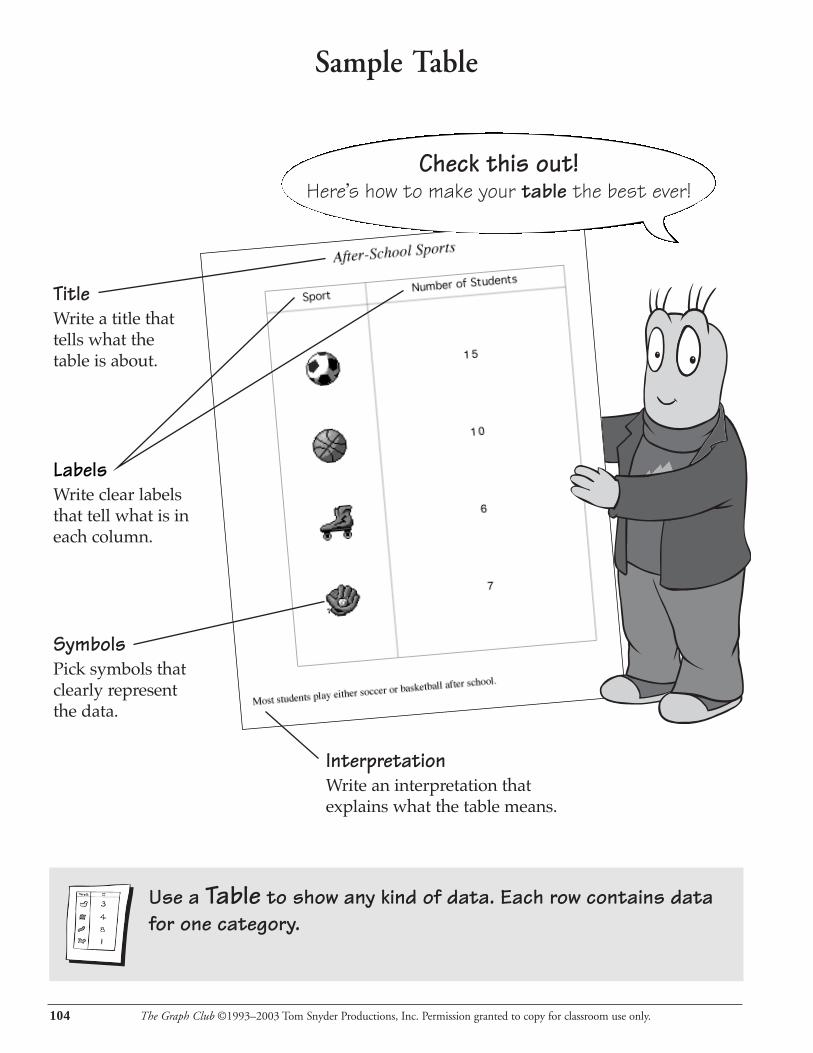
104 The Graph Club ©1993–2003 Tom Snyder Productions, Inc. Permission granted to copy for classroom use only.
Sample Table
Use a Table to show any kind of data. Each row contains datafor one category.
LabelsWrite clear labelsthat tell what is ineach column.
SymbolsPick symbols thatclearly represent the data.
InterpretationWrite an interpretation thatexplains what the table means.
TitleWrite a title thattells what thetable is about.
Check this out!Here’ s how to make your table the best ever!

105
The Graph Club 2.0 Reading List
Reading List: Counting
Each of the entries below is a counting book which lends itself tonumerous graphing opportunities.
Aylesworth, Jim. One Crow: A Counting Rhyme. New York: Lippincott, 1988.
Baker, Jeanne. One Hungry Spider. London: Andre Deutsch, 1982.
Baker, Jeanne. Window. New York: Greenwillow, 1991.
Blumenthal, Nancy. Count-a-saurus. New York: Macmillan, 1989.
Bucknall, Caroline. One Bear All Alone. New York: Dial, 1989.
Carle, Eric. What’s For Lunch? New York: Putnam Publishing Group, 1982.
Crews, Donald. The Bicycle Race. New York: Greenwillow, 1985.
Dunrea, Olivier. Deep Down Underground. New York: Macmillan, 1989.
Ehlert, Lois. Fish Eyes: A Book You Can Count On. San Diego: Harcourt Brace Jovanovich, 1990.
Froman, Robert. Bigger and Smaller. New York: Crowell, 1971.
Galdone, Paul. The Little Red Hen. New York: Seabury, 1973.
Ginsburg, Mirra. Across the Stream. New York: Greenwillow, 1982.
Hagne, Kathleen. Numbears: A Counting Book. New York: Holt, 1986.
Hammond, Franklin. Ten Little Ducks. New York: Scholastic, 1987.
Hoban, Russell. Ten What? New York: Scribners, 1974.
Hoban, Tana. Big Ones Little Ones. New York: Greenwillow, 1976.
Koch, Michelle. Just One More. New York: Greenwillow, 1989.
Leedy, Loreen. A Number of Dragons. New York: Holiday House, 1985.
Medearis, Angela. Picking Peas for a Penny. Austin, TX: State House, 1990.
Noll, Sally. Off and Counting. New York: Greenwillow, 1984.
O’Neill, Mary. Take a Number. Garden City, NY: Doubleday, 1968.
Peek, Merle. The Balancing Act: A Counting Song. New York: Clarion, 1987.
Pomerantz, Charlotte. The Mango Tooth. New York: Greenwillow, 1977.
Rockwell, Anne F. Willy Can Count. New York: Arcade Publishing, 1989.
Russo, Marisabina. Only Six More Days. New York: Greenwillow, 1988.
Sendak, Maurice. Seven Little Monsters. New York: Harper and Row, 1977.
Sherrow, Victoria. Wilbur Waits. New York: Harper and Row, 1990.
Shulevitz, Uri. One Monday Morning. New York: Scribner, 1967.
Tafuri, Nancy. Who’s Counting? New York: Greenwillow, 1986.
Tudor, Tasha. 1 is One. New York: H. Z. Walck, 1956.
Walsh, Ellen S. Mouse Count. San Diego: Harcourt Brace Jovanovich, 1991.
Wood, Audrey. The Napping House. San Diego: Harcourt Brace Jovanovich, 1984.

106
The Graph Club 2.0 Reading List
Reading List: Math & Language Arts
The following books will spark many graphing ideas and provide an excellent way to combine math and language arts.
Anno and Nazaki. Anno’s Mysterious Multiplying Jar. New York: Philomel Books, 1983.Groups, bundles, and bunches are highlighted in this beautifully illustrated book ofmultiplication.
Anno, Mitsumasa. Anno’s Counting Book. New York: Harper Junior Books, 1977. This wordless counting book provides many opportunities for sorting andcategorizing common objects.
Archambault, John. Counting Sheep. New York: Trumpet Club, 1989. Counting Sheepprovides a silly animal tale that reinforces counting, graphing, sorting, andclassification.
Bang, Molly. Ten, Nine, Eight. New York: Greenwillow, 1983. The nighttime routine isfulfilled as a father and a young child prepare for bed. Counting backward from ten,they explore sets of objects in the quiet room.
Butler, Christina. Too Many Eggs — A Counting Book. Boston: D. R. Godine, 1988. What happens when Mrs. Beau forgets how many eggs she has placed in the birthdaycake mix? This counting book examines whole numbers to 20.
Carle, Eric. My Very First Book of Numbers. New York: Trumpet Club, 1974. This counting book provides realistic illustrations for the numbers 1–10.
Carle, Eric. 1, 2, 3 To The Zoo. New York: World, 1968. This counting book takes thereader on a field trip to the zoo where the animals teach the concept of numbers.
Crews, Donald. Ten Black Dots. New York: Greenwillow, 1986. This book reinforcesnumbers 1–10. Presented in poetic genre, Ten Black Dots features two different picturesfor each number.
Dee, Ruby. Two Ways to Count to Ten. New York: Henry Holt, 1988. This counting bookreinforces the sequence of numbers to 10.
Feelings, Muriel. Moja Means One (Swahili Counting Book). New York: Pied PiperBooks, 1971. Number words 1 to 10 are reinforced in this unique book. Scenesdepicting the natural landscape and village life are used to illustrate each Swahilinumber word from one to ten.
Giganti, P. How Many Snails? New York: Greenwillow, 1988. This predictable storypresents a set of three classification questions for each of its illustrations, and providesan excellent interactive story for any age.
Gray, Catherine. One, Two, Three, and Four. No More? Boston: Houghton Mifflin, 1988.This catchy story provides several opportunities for students to count and sort.
Grossman, V. and Long, S. Ten Little Rabbits. San Francisco: Chronicle Books, 1991. Thisbook not only reinforces counting but also highlights various Native American traditions.

107
The Graph Club 2.0 Reading List
Hoban, Tana. Count and See. New York: Collier Books, 1972. A unique book in whicheach photograph is accompanied by three representations of a number: the largenumeral, the number word, and a series of dots.
Hutchins, Pat. 1 Hunter. New York: Greenwillow, 1982. 1 Hunter is a unique countingbook that children will surely enjoy.
Hutchins, Pat. The Doorbell Rang. New York: Greenwillow, 1986. Read and find outwhat happens as the children learn to divide their cookies evenly among each personwho rings the doorbell.
Kellogg, Steven. Much Bigger Than Martin. New York: Dial Books, 1976. Find out theimportance of size in this humorous story about Martin.
Kitamura, Satoshi. When Sheep Cannot Sleep. New York: Farrar, Straus & Giroux, 1986.What happens when sheep cannot sleep? Find out in this predictable book thatreinforces counting concepts.
Kitchen, Bert. Animal Numbers. New York: Dial Books, 1987. Number concepts arehighlighted in this book of animals and their offspring.
Lindbergh, Reeve. The Midnight Farm. New York: Dial Books, 1987. In this gentle andreassuring counting book, a sensitive mother helps her child understand how thedarkness of night can provide comfort and safety.
Lionni, Leo. Inch by Inch. New York: Astor-Honor, 1960. A unique twist is presented inthis story of a quick-thinking inchworm who saves his life by offering to measure thebirds who want to eat him.
MacCarthy, Patricia. Ocean Parade. New York: Dial Books, 1990. Ocean life is creativelyportrayed in this unique counting book.
Mack, Stan. Ten Bears in My Bed. New York: Pantheon, 1974. In this countdown book,ten bears have crowded into a small boy’s bed and he wants them out. One by onethey leave in the most delightful ways.
McMillan, Bruce. Counting Wildflowers. New York: Lothrop, Lee & Shepard, 1986. Thisbook uses a series of color photographs to represent the counting numbers from 1 to 20.
Merriam, Eve. Train Leaves the Station. New York: Trumpet Club, 1988.
Morozumi, Atsuko. One Gorilla. New York: Farrar, Straus & Giroux, 1990. Numberconcepts are presented in this humorous counting book.
Trinca, Rod and Argent, Kerry. One Wooly Wombat. New York: Kane/Miller, 1982. This counting book introduces the reader to Australian animals. Number concepts are reinforced throughout this text.
Wood, Jakki. One Bear with Bees in His Hair. New York: Trumpet Club, 1990. This humorous story combines number concepts, rhyming words, and appealingillustrations that bring the text to life.

108
The Graph Club 2.0 Math Curriculum Matrix
The Graph Club 2.0 K–4
Neighborhood MapMachine 1–5
Community Construction Kit 1–5
Classroom StoreWorks 2–6
Fizz & Martina’s Math Adventures
• Buddies for Life 1–2
• Caves of Blue Falls 2–3
• Blue Falls Elementary 3–4• Project Sphinx 4–5
• Lights, Camera, Fractions! 5–6
Science Court: Statistics 4–6
PrimeTime Math
• Adrift! 4–5
• Lost! 5–6
• Cliffbound! 6–7
• Stakeout! 6–7• Emergency! 7–8
• Fire! 8–9
Math Mysteries
• Whole Numbers 4–5
• Advanced Whole Numbers 4–5
• Fractions 5–6
• Advanced Fractions 6–7
• Measurement 4–5
Tessellation Exploration 4–8Graph Master 4–8
Who
le N
umbe
r O
pera
tions
Frac
tions
&D
ecim
als
Ratio
s &
Per
cent
ages
Den
omin
atio
ns &
Plac
e Va
lues
Estim
atio
n
Gra
phs
&C
hart
s
Dat
a C
olle
ctio
n &
Ana
lysis
Rand
om S
ampl
e &
Bias
Shap
es
Scale
&Pr
opor
tion
Spat
ial S
ense
Sym
met
ry &
Tran
sform
atio
ns
Stan
dard
Uni
ts
Dist
ance
,Rat
e &
Tim
e
Patte
rns
Equa
tions
&Fu
nctio
ns
Solve
Pro
blem
s
App
ly St
rate
gies
Expr
ess
Mat
hem
atica
l Ide
as
Num
ber
&O
pera
tion
s
Dat
a A
naly
sis
&P
roba
bilit
y
Geo
met
ry
Mea
sure
men
t
Alg
ebra
Pro
blem
Solv
ing
Math Curriculum Matrix
Com
mun
icat
ionThis curriculum matrix shows
how Tom Snyder Productionsproducts address a range of math curriculum objectives.

109
The Graph Club 2.0 Reproducible Masters
Reproducible Masters
ActivitiesFunny Faces 1............................................................................................110Funny Faces 2............................................................................................111Funny Faces Clip Art ................................................................................112Pencil Length ............................................................................................113Survey: Do You Like…? ............................................................................114Roll the Dice ............................................................................................115Survey: Do You Agree…? ..........................................................................116Playground Plants ......................................................................................117Food Guide Pyramid ................................................................................118Bouncing Ball ............................................................................................119
Symbols for SortingPet Symbols ..............................................................................................120Travel Symbols ..........................................................................................121Sport Symbols............................................................................................122Food Symbols ............................................................................................123
Blank Grids and GraphsBlank Graph ..............................................................................................124Small Graph Grid (1 x 1 cm.)....................................................................125Medium Graph Grid (1/2 x 1/2 in.)..........................................................126Large Graph Grid (1 x 1 in.) ....................................................................127Blank Circle Graph....................................................................................128
MiscellaneousThe Graph Club Logo ................................................................................129Software Symbols ......................................................................................130

110 The Graph Club ©1993–2003 Tom Snyder Productions, Inc. Permission granted to copy for classroom use only.
Name Funny Faces 1

111The Graph Club ©1993–2003 Tom Snyder Productions, Inc. Permission granted to copy for classroom use only.
Name Funny Faces 2

112 The Graph Club ©1993–2003 Tom Snyder Productions, Inc. Permission granted to copy for classroom use only.
Name Funny Faces Clip Art

113The Graph Club ©1993–2003 Tom Snyder Productions, Inc. Permission granted to copy for classroom use only.
Name Date
Pencil Length
You will need:• a pencil• a ruler• 3 friends and your teacher
What to do:1. Measure your own pencil (in inches). Write the measurement in the table below.2. Measure the pencils of three friends and your teacher, and record the measurements.
Pencil Length in Inches
__________ inchesnumber
__________ inchesnumber
__________ inchesnumber
__________ inchesnumber
__________ inchesnumber
Your Pencil
Your Teacher’s Pencil
Friend’s Pencil______________
Name
Friend’s Pencil______________
Name
Friend’s Pencil______________
Name

114 The Graph Club ©1993–2003 Tom Snyder Productions, Inc. Permission granted to copy for classroom use only.
Name Date
SurveyDo You Like...?
Answer Number of People
Write a question in the blank.
Do you like ______________________________________________________
_______________________________________________________________ ?
Ask your question to 10 people (or more). Mark the answers below.
NoI don’t like it
So-soI’m in between
YesI like it

115The Graph Club ©1993–2003 Tom Snyder Productions, Inc. Permission granted to copy for classroom use only.
Name Date
Roll the Dice
Work with a partner. Roll a six-sided die or number cube 15 times. Have your partner record thenumber that comes up each time. Then trade jobs, and have your partner roll the die 15 timeswhile you record the number each time.
Roller Name:
Roll
123456789101112131415
Recorder Name:
Number
Recorder Name:
Number
Roller Name:
Roll
161718192021222324252627282930
Now, count how many times you and your partner rolled each number.
How many times did you roll…
1 42 53 6

116 The Graph Club ©1993–2003 Tom Snyder Productions, Inc. Permission granted to copy for classroom use only.
Name Date
SurveyDo You Agree...?
Answer Number of People
Write a question in the blank.
Do you agree that _________________________________________________
________________________________________________________________ ?
Ask your question to 10 people (or more). Mark the answers below.
NoI disagree
So-soI’m not sure
YesI agree

117The Graph Club ©1993–2003 Tom Snyder Productions, Inc. Permission granted to copy for classroom use only.
Name Date
Kind of Plant Number
Deciduous Tree
Evergreen Tree
Palm Tree
Cactus
Playground Plants
Count the number of each kind of plant on your school’s playground. Record the numbers below.Then make a graph of the results.
Deciduous trees lose most or all of their leaves each year, usually in the autumn and winter. Many deciduous trees also have flowers and bear seeds enclosed in a fruit (such as an acorn).Common deciduous trees are oaks, maples, elms, and ashes.
Evergreen trees are never completely without leaves, even in winter. Many evergreens areconifers. Most have leaves that are shaped like needles and bear seeds in a cone. Commonevergreen trees are pines, spruces, and firs. Some conifers are among the world’s tallest trees, such as the giant redwood and sequoia trees in California.
Palm trees are usually tall with a single trunk and a large cluster of leaves at the top. The leaves are large (2 feet or longer each) and either feather-shaped or fan-shaped. The most well-knownpalm fruits are coconuts and dates. Some common palm trees are the Washingtonia palm, thequeen palm, the royal palm, and the cabbage palm (the official state tree of Florida).
Cactus plants are succulents — able to store water for long periods of time to survive in dry desert environments. Cacti usually have large, leafless stems, often covered with clusters of spines. Some common cactus plants are the saguaro, the cholla, the elephant cactus, and the barrel cactus. The prickly pear cactus is also common, and its fruit is eaten by many people in the southwestern United States.

118 The Graph Club ©1993–2003 Tom Snyder Productions, Inc. Permission granted to copy for classroom use only.
Name Date

119The Graph Club ©1993–2003 Tom Snyder Productions, Inc. Permission granted to copy for classroom use only.
Name Date
Height of Drop (in feet) Height of Bounce (in inches)
2 feet __________ inches
4 feet __________ inches
6 feet __________ inches
Bouncing Ball
You will need:• a tennis ball (or other kind of ball)• a tape measure• a wall that you can draw on, with heights marked in feet• chalk to draw on the wall• a partner
What to do:1. Stand next to the wall. Hold the ball 2 feet off the ground (use the marks on the wall to help
you find the correct height).2. With your partner standing nearby, drop the ball.3. Observe how high the ball bounces on the first bounce. Have your partner place his or her hand
on the wall at the height the ball bounced.4. On the wall, mark how high the ball bounced.5. Measure the distance from the ground to the mark you made. Record the measurement below.6. Repeat steps 1–5 to measure how high the ball bounces when dropped from 4 feet and from
6 feet off the ground.
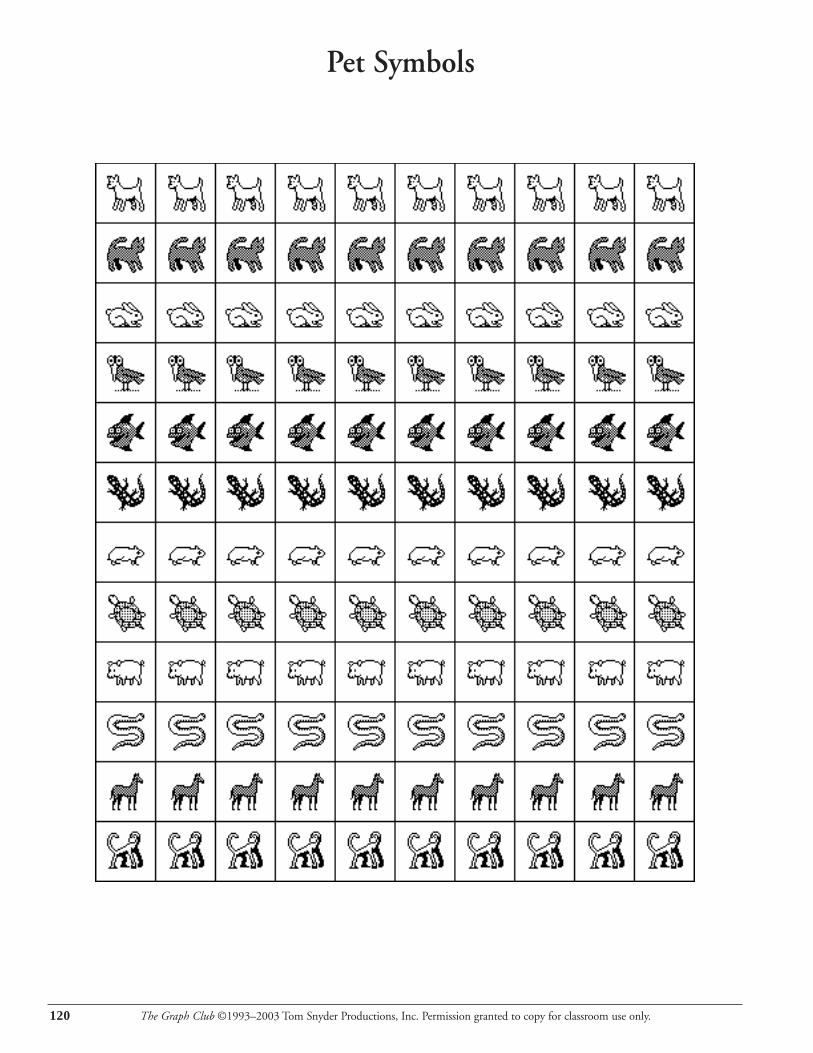
120 The Graph Club ©1993–2003 Tom Snyder Productions, Inc. Permission granted to copy for classroom use only.
Pet Symbols

121The Graph Club ©1993–2003 Tom Snyder Productions, Inc. Permission granted to copy for classroom use only.
Travel Symbols

122 The Graph Club ©1993–2003 Tom Snyder Productions, Inc. Permission granted to copy for classroom use only.
Sport Symbols

123The Graph Club ©1993–2003 Tom Snyder Productions, Inc. Permission granted to copy for classroom use only.
Food Symbols
124 The Graph Club ©1993–2003 Tom Snyder Productions, Inc. Permission granted to copy for classroom use only.
Name Blank Graph
Title:
How many? How many? How many? How many?
10
9
8
7
6
5
4
3
2
1

125The Graph Club ©1993–2003 Tom Snyder Productions, Inc. Permission granted to copy for classroom use only.
Name Small Graph Grid (1 x 1 cm)

126 The Graph Club ©1993–2003 Tom Snyder Productions, Inc. Permission granted to copy for classroom use only.
Name Medium Graph Grid (1/2 x 1/2 in)

127The Graph Club ©1993–2003 Tom Snyder Productions, Inc. Permission granted to copy for classroom use only.
Name Large Graph Grid (1 x 1 in)

128 The Graph Club ©1993–2003 Tom Snyder Productions, Inc. Permission granted to copy for classroom use only.
Name Blank Circle Graph

129The Graph Club ©1993–2003 Tom Snyder Productions, Inc. Permission granted to copy for classroom use only.
The Graph Club Logo

130 The Graph Club ©1993–2003 Tom Snyder Productions, Inc. Permission granted to copy for classroom use only.
Software Symbols
People
People
Characters
Expressions
Body Parts
“Funny Faces” Characteristics
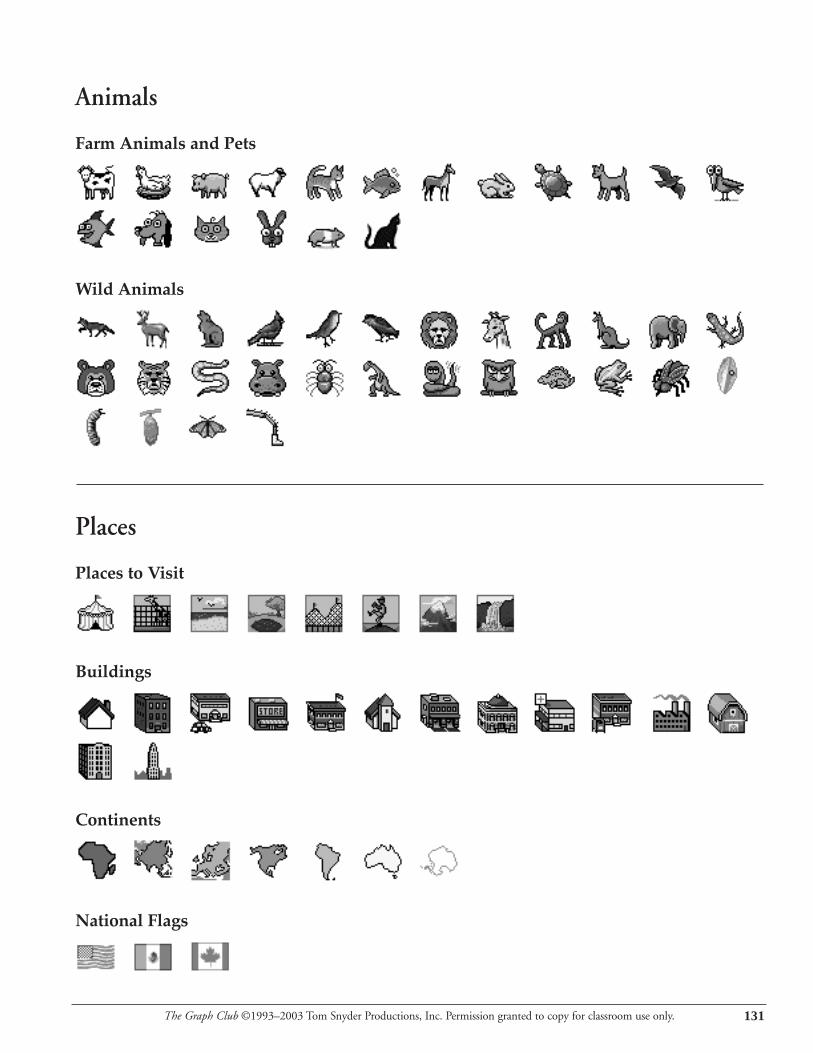
131The Graph Club ©1993–2003 Tom Snyder Productions, Inc. Permission granted to copy for classroom use only.
Animals
Farm Animals and Pets
Wild Animals
Places
Places to Visit
Buildings
Continents
National Flags

132 The Graph Club ©1993–2003 Tom Snyder Productions, Inc. Permission granted to copy for classroom use only.
Earth & Space
Seasons
Plants
Weather
Space
Landforms
Food
Fruits & Vegetables

133The Graph Club ©1993–2003 Tom Snyder Productions, Inc. Permission granted to copy for classroom use only.
Meats & Proteins
Grains & Cereal
Dairy Products
Miscellaneous Foods
Holidays

134 The Graph Club ©1993–2003 Tom Snyder Productions, Inc. Permission granted to copy for classroom use only.
Sports & Hobbies
Sports
Music & Art
Transportation
Letters

135The Graph Club ©1993–2003 Tom Snyder Productions, Inc. Permission granted to copy for classroom use only.
Math
Numbers & Symbols
Graphs
Money
Shapes & Solids
Probability
Measurements & More

136 The Graph Club ©1993–2003 Tom Snyder Productions, Inc. Permission granted to copy for classroom use only.
More!
Colors
Everyday Objects
Clothing
Creatures
Miscellaneous

137
The Graph Club 2.0 Index
Index
AActivities 9, 21, 53
Activities Menu screen 20Lesson Summaries 56-86Matrix 54-55Saving your own 32Templates 32
Add Another Graph 14, 25Add New Symbols 25Arrange Graphs 14, 29Assessment 87
Assessment Checklist 89-93Graph Rubrics 94-98Sample Graphs 100-104Student Graph Checklist 99
Axis Labels 13, 29
BBar Graph 11, 13
Assessing 90, 95, 101Entering/deleting data 11, 36
Bar or Circle Fill 17, 22
CCertificate, Match 19Choose Circle Graph Labels 15, 28Choose How Many Kinds 12, 27Choose Scale Maximum 14, 27Choose Symbols 12, 25, 26Circle Graph 14-15
Assessing 91, 96, 102Entering/deleting data 14, 36Labels 15, 28
Circle Graph Labels 15, 28Clear 24Close 21Close Set 21Copy 24Copy Graph 24Create Graphs 9, 10, 11Cut 24
DData, entering and deleting 36Delete Custom Symbols 33
EEdit Groups 33Edit Menu 24English 29Español 29Exit 23Export as Graphic 22
FFile, The Graph Club 10File Menu 21Full Screen 29
GGo to Main Menu 20, 21Graph Horizontally/Vertically 29Graph Menu 25Graph Set 21, 10Graph Type buttons 13Grid, Bar and Line 29
HHelp Menu 35
IImporting Symbols 26Installation 7
JLine Graph
Assessing 92, 97, 103Entering/deleting data 36Restricting use of 30
LLanguage Arts Activities 83Link to Product Overview Online 34Link to Standards Correlations Online 34Link to The Graph Club Web Site 34
138
The Graph Club 2.0 Index
MMain Menu screen 9Master Password 31Match Graphs 9, 18-19, 30Math Activities 56Math Curriculum Matrix 108
NNew Graph Set 21New Match 21Notebook 16, 29
OOpen 21Open Graphs 9Options Menu 29
PPage Setup 18, 22Password 30-31Paste 24Pick Student 34Picture Graph
Assessing 89, 94, 100Entering/deleting data 11, 36
Print Certificate 19Print Graphs 17, 22-23Print Resources 23Print Setup 18, 22Printing 17-18, 22, 52
QQuit 23
RRandom Student Picker 33Reading List 105, 106Record audio 16-17, 29Reproducible Masters 109-136Rubric 94
SSample Graphs 100-104Save 17, 22Save As 22Save as Activity 32 Scale Maximum 14, 27Science Activities 75Select All 24Set Teacher Password 30Show/Hide Axis Labels 29Show/Hide Bar and Line Grid 29Show/Hide Notebook 29Show/Hide Title 29Social Studies Activities 68Standards Correlations 5, 20, 34Student Graph Checklist 99Symbol Bins 10, 25Symbols 130-136
Choosing 12, 25, 26Importing 26
TTable
Assessing 93, 98, 104Entering/deleting data 36
Teacher Menu 30Teacher Preferences… 30Technical Support 6Templates, Activity 32Title 13, 22, 29Title screen 8Tutorial 7, 9
UUndo 24
VView Full Screen 29View Teacher’s Guide 35View Tutorial 35