Embed Size (px)
Citation preview
antioxidants
Article
Use of Sieving as a Valuable Technology to ProduceEnriched Buckwheat Flours: A Preliminary Study
Beatriz Martín-García 1, Federica Pasini 2, Vito Verardo 3,4,* , Ana María Gómez-Caravaca 1,Emanuele Marconi 5 and Maria Fiorenza Caboni 2,6
1 Department of Analytical Chemistry, Faculty of Sciences, University of Granada, Avd. Fuentenueva s/n,18071 Granada, Spain; [email protected] (B.M.-G.); [email protected] (A.M.G.-C.)
2 Department of Agricultural and Food Sciences, University of Bologna, Piazza Goidanich 60,47521 Cesena, Italy; [email protected] (F.P.); [email protected] (M.F.C.)
3 Department of Nutrition and Food Science, University of Granada, Campus of Cartuja, 18071 Granada, Spain4 Institute of Nutrition and Food Technology ‘José Mataix’, Biomedical Research Center,
University of Granada, Avda del Conocimiento sn., 18100 Armilla, Granada, Spain5 Dipartimento Agricoltura, Ambiente e Alimenti, Università del Molise, via De Sanctis s/n,
I-86100 Campobasso, Italy; [email protected] Interdepartmental Centre for Agri-Food Industrial Research, Alma Mater Studiorum, Università di Bologna,
via Quinto Bucci 336, 47521 Cesena, Italy* Correspondence: [email protected]; Tel.: +34-958-243-863
Received: 23 October 2019; Accepted: 20 November 2019; Published: 25 November 2019 �����������������
Abstract: Fractionation processes based on physical separation are a good strategy to produceenriched cereal flours. Therefore, the aim of this work is to evaluate the suitability of sieving ofbuckwheat flours to produce protein and phenolic (especially rutin) enriched fractions. Because of that,dehulled whole buckwheat flour (GSTQ) was sieved obtaining fractions with a particle size of 215 µm,160 µm, 85 µm, and 45 µm (GS215, GS160, GS85, and GS45). For that purpose, the determinationof protein, ash, and total starch content and free and bound phenolic compounds was carried out.The highest content of total phenolic compounds was obtained in GS215 (3118.84 mg kg−1 d.w.),followed by GS160 (2499.11 mg kg−1 d.w.), GS85 (989.46 mg kg−1 d.w.), GSTQ (983.15 mg kg−1 d.w.),and GS45 (481.31 mg kg−1 d.w.). Therefore, the phenolic content decreased with the particle sizedecrease from 215 µm to 45 µm. Besides, there were no significant differences between the totalphenolic content in GS85 and GSTQ. The fraction with 215 µm reported the highest protein andmineral salt content and presented rutin amounts four times higher than GSTQ.
Keywords: common buckwheat; free and bound phenolic compounds; HPLC-MS; sieving;proteins; starch
1. Introduction
Buckwheat (Fagopyrum esculentum Moench) is a rich source of protein, vitamins, starch, dietary fiber,and essential minerals [1–3]. Buckwheat also contains a high quantity of phenolic compounds, includingrutin, orientin, vitexin, quercetin, isovitexin, kaempferol-3-rutinoside, isoorientin, and catechins [4].Buckwheat contains more rutin than most of the other plants, which exhibits anti-inflammatory,antimutagenic, anticarcinogenic, antihemorrhagic, antioxidative, hypotensive, antihemorrhagic, andblood vessel protecting properties [5–8]. Phenolic compounds are presented in both free and boundforms. Whole buckwheat contains 2–5 times more phenolic compounds than oats or barley, whilebuckwheat bran and hulls have 2–7 times higher antioxidant activity than barley, triticale, and oats [9].Most studies have reported that phenolic compounds are mostly bound to cell wall components in thebran and hull of most cereal grains [10]. Nevertheless, in buckwheat most phenolic compounds are
Antioxidants 2019, 8, 583; doi:10.3390/antiox8120583 www.mdpi.com/journal/antioxidants
Antioxidants 2019, 8, 583 2 of 12
found in the free form distributed throughout the entire grain (hull, seed coat, endosperm embryoaxis, and cotyledons) [5,11]. The greatest concentration of these phenolic compounds is presentedin the outer layers (seed coat and hull) of the grain [5]. During buckwheat flour processing, hull isremoved from buckwheat seeds by impact milling and the resulting groat (or the intact achene) isroller-milled and the product is sieved to remove the fragmented hull to obtain bran flour that containsseed coat and light flour that is composed mainly of the endosperm [1,12]. One study has shownthat seed coat is the part with the highest total content of phenolics from all parts of the groat [13].Inglett et al. [11] evaluated the phenolic content in fancy (endosperm), farinetta (seed coat), supreme(whole groat), and whole buckwheat flour (whole grain), being the farinetta (seed coat) flour the mostconcentrated in phenolic compounds. Therefore, consumption of buckwheat flours that contents seedcoat is considered to have significant nutritional or medicinal benefits [4].
The trend toward fractionation/enrichment and recombination techniques has captured theattention of the food industry in order to identify and develop green new processes respectful ofthe nutritional and hygienic quality of the matrix and increasing the quality of foods. In this way,separation and/or enrichment with dry fractionation technologies such as pearling/grinding, sieving,and air classification could be useful to obtain grain fractions with added value. Moreover, theproducts obtained with these technologies have considerable high quality in the safety point of view,compared with those obtained with other traditional methods that use the solvent extraction orchemical fractionation as enrichment process [14–16].
One study reported the distribution of phenolic compounds in buckwheat graded fractions, wherethe hull was removed from whole buckwheat grains by dehulling apparatus with disks, and theremained groats with endosperm and bran were milled to buckwheat flours and separated by weightfrom outer to inner parts in 16 fractions, with the fraction that contained the outermost part of the grain(bran) being the most concentrated in phenolic content [5]. It has been reported that whole grain riceflours, whole grain wheat flours, and wheat bran fours sieved with different particle size have showndifferent phenolic concentrations because of the different parts obtained from the buckwheat after thesieving [17–19]. Nevertheless, there is no study about buckwheat flour fractions from whole grainwith different particle size, which would allow a gradual reduction milling system and this could beadvantageous in order to obtain enriched flour fractions for the obtention of desired end-use productsof high functionality [11].
For that reason, in this work the sieving of whole buckwheat flours at different particle size wascarried out in order to evaluate the fractions enriched in phenolic compounds with particular attentionto rutin and protein. The determination of ashes, proteins, total starch, and free and bound phenoliccompounds in buckwheat flours was carried out.
2. Materials and Methods
2.1. Sample
Dehulled buckwheat grain meal (GSTQ) was obtained from buckwheat (cv. Darja) harvested inMatrice (Italy) (41◦37′00” N 14◦43′00” E), situated in a hilly location 750 m above sea level. The fieldpresented high tenacity of the soil because of the presence of clay. Harvesting took place on September2018. Dehulled buckwheat achenes were milled by hammer mill (model 8/B, Beccaria srl, Scarnafigi(CN), Italy); GSTQ meal was sieved to obtain four fractions with different particle size: 215 µm (GS215),160 µm (GS160), 85 µm (GS85), and 45 µm (GS45).
2.2. Reagents and Chemicals
HPLC-grade acetonitrile, water, methanol, acetone, acetic acid, ethanol, hexane, ethyl acetate,diethyl ether, hydrochloric acid, sulphuric acid, ammonium sulphate, and boric acid were purchasedfrom Merck KGaA (Darmstadt, Germany). Hydroxide sodium was from Fluka (Buchs, Switzerland).Ferulic acid, catechin, quercetin, and rutin (Sigma-Aldrich, St. Louis, MO, USA) were used for the
Antioxidants 2019, 8, 583 3 of 12
calibration curves. Glucosidase, amyloglucosidase, peroxidase, and α-amylase were purchased fromSigma-Aldrich (St. Louis, MO, USA).
2.3. Protein, Ashes, and Total Starch Determination in Buckwheat Samples
2.3.1. Determination of Protein
Determination of protein in buckwheat samples was carried out according to ICC method 105/2(1995) [20]. Briefly, 1 g of sample was subjected to mineralization of organic matter with 10 mLof sulphuric acid in the presence of copper sulphate. Hence, nitrogen was changed in ammoniumsulphate and treated with NaOH. The ammonia released was gathered in a solution of 4% boric acidand titrated with 0.1 N sulphuric acid.
2.3.2. Determination of Ashes Content
Determination of ashes content was carried out according to ICC method 104/1 (1995) [21]. A totalof 1 g of buckwheat flour was collected in a porcelain crucible in muffle furnace at 525 ◦C for 1 h andthen cooled. After that, the sample was charred with ethanol and put in muffle at 525 ◦C. Ashingwas completed when the cooled residue was white or nearly white. Finally, porcelain crucibles wereweighed, and ashes content was calculated.
2.3.3. Determination of Total Starch
The total starch in buckwheat samples was determined according to an enzymatic colorimetricmethod, AOAC International method 996.11 (AOAC, 2007) [22], with an assay kit from MegazymeInternational Ltd. (Wicklow, Ireland). Samples were ground through a 0.5-mm screen and 100.0 mg ofsample was incorporated to a test tube. After that, 0.2 mL of ethanol solution (80%, v/v) was addedinto the tube and mixed to wet the sample. Then, 3 mL of thermostable α-amylase was added, andthe tubes were boiled for 6 min and were shaken at intervals of 2 min. Tubes were placed in a 50 ◦Cbath to rest for 5 min. Next, 0.1 mL of amyloglucosidase was added into each tube. Tubes were thenshaken and incubated over 30 min and then filled to a volume of 10 mL with distilled water followedby centrifugation at 1800 rpm for 10 min. Then, 1.0 mL of aliquots from the supernatant was dilutedin a proportion of 1/10. Next, 0.1 mL of this solution was placed into a test tube. Total of 3 mL ofglucose oxidase/peroxidase reagent was added to each tube and incubated at 50 ◦C for 20 min. A totalof 0.1 mL of water was used for blanks rather than 0.1 mL of diluted solution, and the other addedreagents were all the same. Samples were read at 510 nm.
2.4. Extraction Methods
Extraction of free phenolic compounds from buckwheat flour fractions was carried out accordingto the method established by Hung and Morita [5] with certain modifications in the extraction techniqueand the solvent used to reconstitute the dry extract. One gram of buckwheat flour was extracted thricein an ultrasonic bath Starsonic 90 Liarre (Bologna, Italy) equipment with frequency 34 kHz, outputpower (W) 190RMS, dimensions (H ×W × D) 345 × 315 × 246 cm with a solution of ethanol/water(4:1 v/v) for 10 min. The supernatants were collected, centrifuged at 2500 rpm for 10 min, evaporated andreconstituted with 1 mL of methanol/water (1:1 v/v). The extracts were stored at −18 ◦C until analysis.
Extraction of bound phenolic compounds was carried out according to the method established byVerardo et al. (2011) [23]: Residues of free phenolic extraction were digested with 25 mL of 1M NaOHat room temperature for 18 h by shaking under nitrogen gas. The mixture was acidified (pH = 2.2–2.5)with hydrochloric acid in a cooling ice bath and extracted with 250 mL of hexane to remove the lipids.The aqueous solution was extracted five times with 50 mL of 1:1 diethyl ether/ethyl acetate (v/v).The organic fractions were collected and evaporated at 40 ◦C in a rotary evaporator. The dry extractwas reconstituted in 1 mL of methanol/water (1:1 v/v) and stored at −18 ◦C until analysis.
Antioxidants 2019, 8, 583 4 of 12
2.5. Determination of Free and Bound Phenolic Compounds by HPLC- MS
A liquid chromatography apparatus HP 1100 Series (Agilent Technologies, Palo Alto, CA, USA)equipped with a degasser, a binary pump delivery system, and an automatic liquid sampler, andcoupled to single quadrupole mass spectrometer detector was used. Separation of free and boundphenolic compounds from buckwheat flour fractions was carried out using a C-18 column (Poroshell120, SB-C18, 3.0 × 100 mm, 2.7 µm from Agilent Technologies, Palo Alto, CA, USA). The gradientelution was the same as previously established by Gómez-Caravaca et al. (2014) [24] using a mobilephase A acidified water (1% acetic acid) and mobile phase B acetonitrile. MS analysis were carried outusing an electrospray ionization (ESI) interface in negative ionization mode at the following conditions:drying gas flow (N2), 9.0 L/min; nebulizer pressure, 50 psi; gas drying temperature, 350 ◦C; capillaryvoltage, 4000 V. The fragmentor and m/z range used for HPLC-ESI/MS analyses were 80 V and m/z50–1000, respectively.
Calibration curves were arranged from LOQ-500 mg/L at six concentration levels, plotting peakarea vs. analyte concentration.
2.6. Statistical Analysis
The results of quantification reported in this work are the averages of three repetitions (n = 3).Tukey’s honest significant difference multiple comparison (one-way ANOVA) at the p < 0.05 level wereevaluated by using the Statistica 7.0 software (StatSoft, Tulsa, OK, USA)
3. Results and Discussion
3.1. Yield, and Protein, Starch, and Ashes Composition in Buckwheat Samples
One of the main trends in food technologies is the use of the technological model known asfractionation/enrichment and food recombination. It consists of a preliminary extraction of constituentsor enrichment of fractions (proteins, lipids, carbohydrates, fibers, flavors, dyes, etc.), which aresubsequently recombined in order to obtain improved products in terms of nutritional value anddietary value. Table 1 shows the values of yield and some chemical components (protein ashes andtotal starch) in dehulled buckwheat flour (GSTQ) and its sieved fractions with 215 µm, 160 µm, 85 µm,and 45 µm in order to evaluate the most nutritionally adequate fraction.
Table 1. Evaluation of some chemical components (g/100 g d.w.) of dehulled buckwheat and fractionsresults from sieving.
GSTQ GS215 GS160 GS85 GS45
Yield 100 13.5 8.7 32.0 43.3Protein (N × 6.25) 16.4 ± 0.04 35.2 ± 0.03 29.8 ± 0.04 11.3 ± 0.02 8.1 ± 0.06
Ashes 2.36 ± 0.003 6.05 ± 0.002 5.56 ± 0.001 1.51 ± 0.003 0.31 ± 0.002Total Starch 72.6 ± 1.49 34.4 ± 1.10 43.3 ± 1.43 76.7 ± 2.00 81.2 ± 1.13
GSTQ: Dehulled buckwheat flour; GS215, GS160, GS85 and GS45: Sieved fractions with 215, 160, 85 and45 µm, respectively.
As expected, the yield of GS215 and GS160 fraction is enormously lower than GS85 and GS45fraction that correspond to the inner layers of buckwheat achene.
Protein content increased two-fold in GS215 and GS160 fractions; in contrary, it halves in GS85 andGS45 fractions. According to Schutyser et al. (2011) [25] these results confirmed that dry fractionationtechnologies such as sieving are a valuable tool to produce enriched protein fractions, moreover, thesame authors declared that this type of technology is extremely energy efficient and is able to produceenriched fractions with retained (native) functionality compared to other green technologies such aswet fractionation.
Antioxidants 2019, 8, 583 5 of 12
GS 215 and GS 160 also triple the ashes content that could be related to the mineral amount;otherwise, the fractions with highest particle size showed middle content of total starch comparedwith GS 85 and GS45 samples.
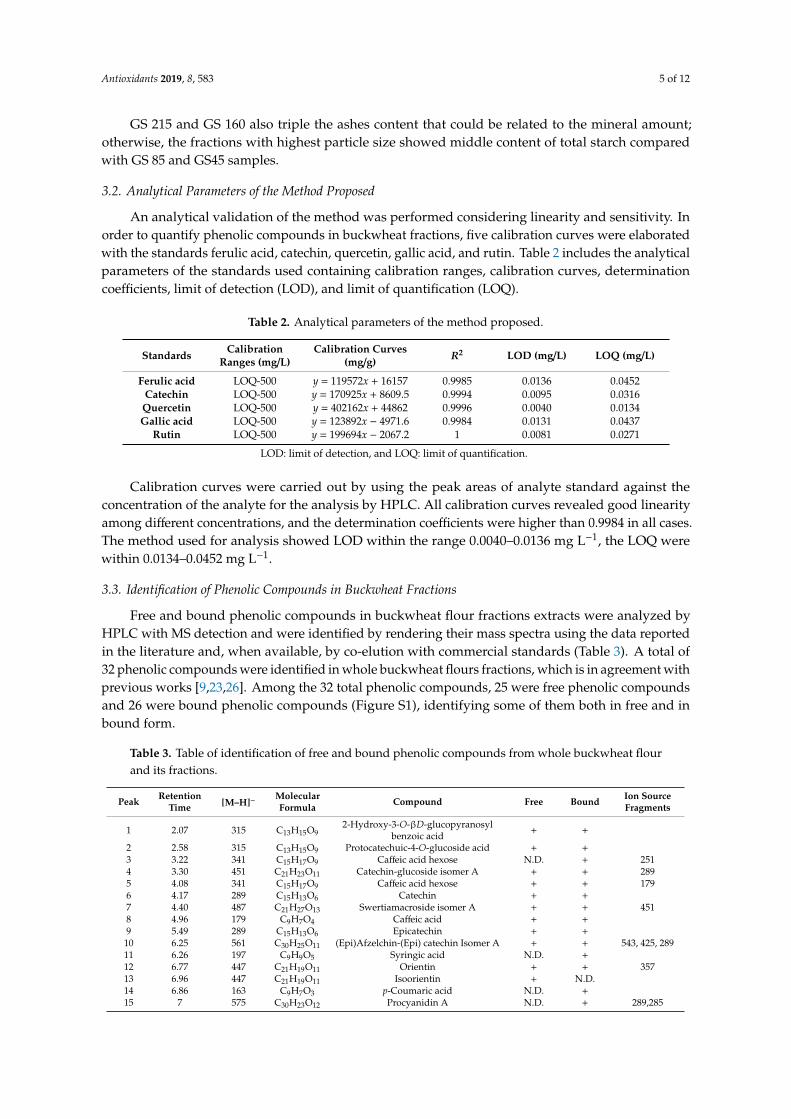
3.2. Analytical Parameters of the Method Proposed
An analytical validation of the method was performed considering linearity and sensitivity. Inorder to quantify phenolic compounds in buckwheat fractions, five calibration curves were elaboratedwith the standards ferulic acid, catechin, quercetin, gallic acid, and rutin. Table 2 includes the analyticalparameters of the standards used containing calibration ranges, calibration curves, determinationcoefficients, limit of detection (LOD), and limit of quantification (LOQ).
Table 2. Analytical parameters of the method proposed.
Standards CalibrationRanges (mg/L)
Calibration Curves(mg/g) R2 LOD (mg/L) LOQ (mg/L)
Ferulic acid LOQ-500 y = 119572x + 16157 0.9985 0.0136 0.0452Catechin LOQ-500 y = 170925x + 8609.5 0.9994 0.0095 0.0316
Quercetin LOQ-500 y = 402162x + 44862 0.9996 0.0040 0.0134Gallic acid LOQ-500 y = 123892x − 4971.6 0.9984 0.0131 0.0437
Rutin LOQ-500 y = 199694x − 2067.2 1 0.0081 0.0271
LOD: limit of detection, and LOQ: limit of quantification.
Calibration curves were carried out by using the peak areas of analyte standard against theconcentration of the analyte for the analysis by HPLC. All calibration curves revealed good linearityamong different concentrations, and the determination coefficients were higher than 0.9984 in all cases.The method used for analysis showed LOD within the range 0.0040–0.0136 mg L−1, the LOQ werewithin 0.0134–0.0452 mg L−1.
3.3. Identification of Phenolic Compounds in Buckwheat Fractions
Free and bound phenolic compounds in buckwheat flour fractions extracts were analyzed byHPLC with MS detection and were identified by rendering their mass spectra using the data reportedin the literature and, when available, by co-elution with commercial standards (Table 3). A total of32 phenolic compounds were identified in whole buckwheat flours fractions, which is in agreement withprevious works [9,23,26]. Among the 32 total phenolic compounds, 25 were free phenolic compoundsand 26 were bound phenolic compounds (Figure S1), identifying some of them both in free and inbound form.
Table 3. Table of identification of free and bound phenolic compounds from whole buckwheat flourand its fractions.
Peak RetentionTime [M–H]−
MolecularFormula Compound Free Bound Ion Source
Fragments
1 2.07 315 C13H15O92-Hydroxy-3-O-βD-glucopyranosyl
benzoic acid + +
2 2.58 315 C13H15O9 Protocatechuic-4-O-glucoside acid + +3 3.22 341 C15H17O9 Caffeic acid hexose N.D. + 2514 3.30 451 C21H23O11 Catechin-glucoside isomer A + + 2895 4.08 341 C15H17O9 Caffeic acid hexose + + 1796 4.17 289 C15H13O6 Catechin + +7 4.40 487 C21H27O13 Swertiamacroside isomer A + + 4518 4.96 179 C9H7O4 Caffeic acid + +9 5.49 289 C15H13O6 Epicatechin + +10 6.25 561 C30H25O11 (Epi)Afzelchin-(Epi) catechin Isomer A + + 543, 425, 28911 6.26 197 C9H9O5 Syringic acid N.D. +12 6.77 447 C21H19O11 Orientin + + 35713 6.96 447 C21H19O11 Isoorientin + N.D.14 6.86 163 C9H7O3 p-Coumaric acid N.D. +15 7 575 C30H23O12 Procyanidin A N.D. + 289,285

Antioxidants 2019, 8, 583 6 of 12
Table 3. Cont.
Peak RetentionTime [M–H]−
MolecularFormula Compound Free Bound Ion Source
Fragments
16 7.46 317 C15H9O8 Myricetin N.D. +17 7.76 431 C21H19O10 Vitexin + +18 7.92 609 C27H29O16 Rutin + +19 7.94 441 C22H17O10 Epicatechin gallate + + 289, 16920 7.96 833 C45H37O16 Epiafzelchin–epiafzelchin–epicatechin + N.D.21 8.21 451 C21H23O11 Catechin-glucoside isomer B N.D. + 28922 8.23 487 C21H27O13 Swertiamacroside isomer B + + 45123 8.28 463 C21H19O12 Hyperin + N.D.24 8.73 727 C38H31O15 Epiafzelchin–epicatechin-O-methylgallate + + 461, 28925 9.31 163 C9H7O3 p-Coumaric acid N.D. +26 9.43 455 C23H19O10 (−)-Epicatechin-3-(3′’-O-methyl) gallate + + 289, 18327 9.47 561 C30H25O11 (Epi)afzelchin-(Epi) catechin Isomer B + N.D. 543, 425, 28928 9.9 757 C39H33O16 Procyanidin B2-dimethylgallate + N.D. 28929 10.71 741 C39H33O15 Epiafzelchin–epicatechin-O-Dimethylgallate + N.D. 469, 319, 27130 11.50 469 C24H21O10 Epicatechin-O-3,4-Dimethylgallate + + 319, 27131 12.35 463 C21H19O12 Isoquercitrin + +32 12.56 301 C15H10O7 Quercetin + +
+: detected, N.D.: not detected.
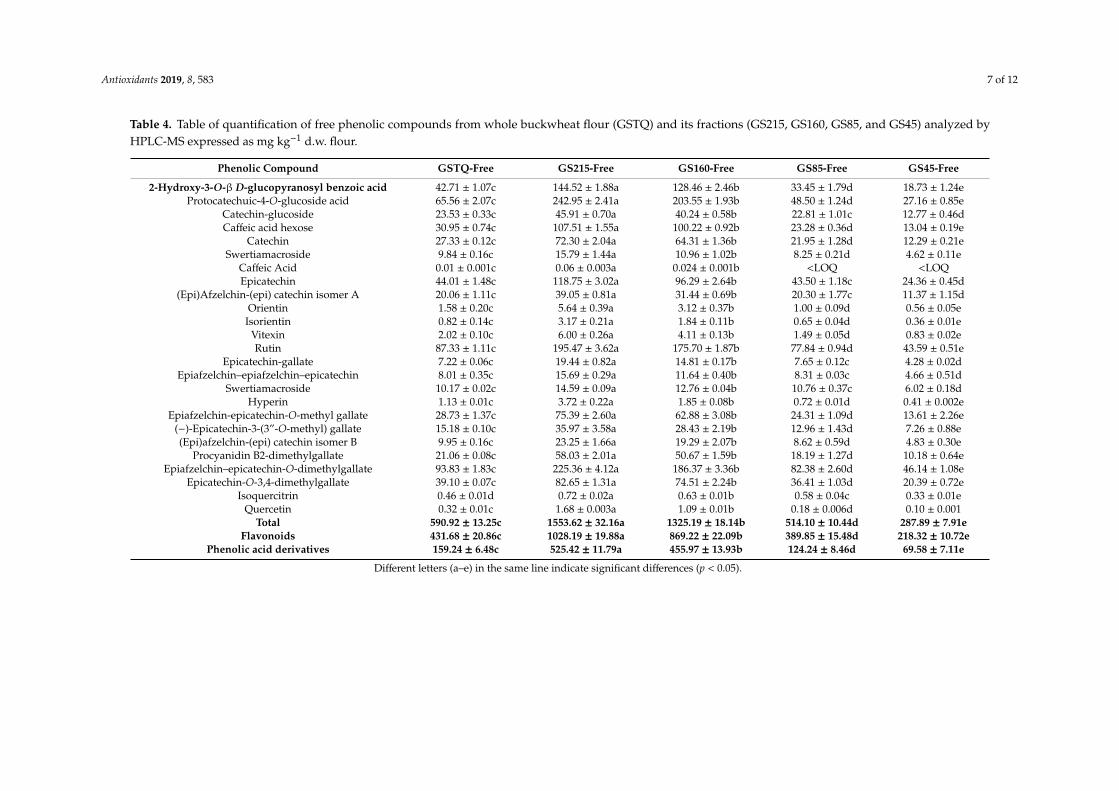
3.4. Quantification of Phenolic Compounds in Buckwheat Fractions
A total of 25 free phenolic compounds were quantified in whole grain flour (GSTQ) and itsfractions (GS215, GS160, GS85, and GS45) (Table 4). Flavonoids are the most abundant free phenoliccompounds in buckwheat, which represented 73%, 66.2%, 65.6%, 75.8, and 75.8% of total phenoliccontent in whole grain flour and fractions (GSTQ, GS215, GS85, and GS45). The most concentratedflavonoid was epiafzelchin–epicatechin-O-dimethylgallate, which corresponded around 14–16%of total free phenolic compounds in whole grain flour and its fractions. The highest content ofepiafzelchin–epicatechin-O-dimethylgallate was obtained in GS215 (225.36 mg kg−1 d.w.), in which thevalue was 58.4%, 17.3%, 63.4%, 79.5% higher than in GSTQ, GS160, GS85, and GS45. Besides that, themost concentrated phenolic acid derivative was protocatechuic-4-O-glucoside acid, which represented11.1%, 15.7%, 15.4%, 9.4%, and 9.4% of the total free phenolic content, in which the highest value wasobtained for GS215 followed by GS160, GSTQ, GS85, and GS45. Rutin was the second most abundantphenolic compound in whole grain flour and its sieved fractions with 45 µm and 85 µm, whereas thiscompound was the third most abundant in sieved fractions with 215 µm and 160 µm. Concentration ofrutin in buckwheat flours decreased in the following order: GS215 > GS160 > GSTQ > GS85 > GS45(195.47, 175.70, 87.33, 77.84, and 43.59 mg kg−1 d.w.).
Total free phenolic concentration decreased in the following order: GS215 > GS160 > GSTQ >
GS85 > GS45. Therefore, the greatest content of free phenolic compounds was obtained in GS215(1153.52 mg kg−1 d.w.), in which the value was 14.7%, 66.9%, 61.9%, and 81.5% higher than thatobtained in GS160, GS85, GSTQ, and GS45.
Comparing our results of phenolic content in whole buckwheat flour (GSTQ) with previousworks, Verardo et al. (2011) [23] obtained a total free phenolic content in whole buckwheat flourof 1008.91 mg kg−1 d.w., which was 41.43% higher than that obtained in our work. But thesedifferences could be due to the different cultivar. Verardo et al. (2011) [23] reported that thehighest free flavonoid was the rutin, whereas in our work, the most concentrated flavonoid wasepiafzelchin–epicatechin-O-dimethylgallate followed by rutin. Kalinová et al. (2019) [13] reported thephenolic content in different parts of common buckwheat, in which the content of catechin, epicatechin,and rutin (20.87, 56.51 and 52.48 mg kg−1 d.w.) in groat was in the same order of magnitude as thatobtained for whole buckwheat flour in our work [13]. Liu et al. (2019) [27] reported the phenolicprofiles and antioxidant capacities of common buckwheat and Tartary buckwheat, in which the contentof rutin in common buckwheat was 62.19 mg kg−1 d.w. and this value was similar to that obtained inwhole buckwheat in the present study (87.33 mg kg−1 d.w.) [27]. Hence, our results are in accordancewith the previous studies.
Antioxidants 2019, 8, 583 7 of 12
Table 4. Table of quantification of free phenolic compounds from whole buckwheat flour (GSTQ) and its fractions (GS215, GS160, GS85, and GS45) analyzed byHPLC-MS expressed as mg kg−1 d.w. flour.
Phenolic Compound GSTQ-Free GS215-Free GS160-Free GS85-Free GS45-Free
2-Hydroxy-3-O-β D-glucopyranosyl benzoic acid 42.71 ± 1.07c 144.52 ± 1.88a 128.46 ± 2.46b 33.45 ± 1.79d 18.73 ± 1.24eProtocatechuic-4-O-glucoside acid 65.56 ± 2.07c 242.95 ± 2.41a 203.55 ± 1.93b 48.50 ± 1.24d 27.16 ± 0.85e
Catechin-glucoside 23.53 ± 0.33c 45.91 ± 0.70a 40.24 ± 0.58b 22.81 ± 1.01c 12.77 ± 0.46dCaffeic acid hexose 30.95 ± 0.74c 107.51 ± 1.55a 100.22 ± 0.92b 23.28 ± 0.36d 13.04 ± 0.19e
Catechin 27.33 ± 0.12c 72.30 ± 2.04a 64.31 ± 1.36b 21.95 ± 1.28d 12.29 ± 0.21eSwertiamacroside 9.84 ± 0.16c 15.79 ± 1.44a 10.96 ± 1.02b 8.25 ± 0.21d 4.62 ± 0.11e
Caffeic Acid 0.01 ± 0.001c 0.06 ± 0.003a 0.024 ± 0.001b <LOQ <LOQEpicatechin 44.01 ± 1.48c 118.75 ± 3.02a 96.29 ± 2.64b 43.50 ± 1.18c 24.36 ± 0.45d
(Epi)Afzelchin-(epi) catechin isomer A 20.06 ± 1.11c 39.05 ± 0.81a 31.44 ± 0.69b 20.30 ± 1.77c 11.37 ± 1.15dOrientin 1.58 ± 0.20c 5.64 ± 0.39a 3.12 ± 0.37b 1.00 ± 0.09d 0.56 ± 0.05e
Isorientin 0.82 ± 0.14c 3.17 ± 0.21a 1.84 ± 0.11b 0.65 ± 0.04d 0.36 ± 0.01eVitexin 2.02 ± 0.10c 6.00 ± 0.26a 4.11 ± 0.13b 1.49 ± 0.05d 0.83 ± 0.02eRutin 87.33 ± 1.11c 195.47 ± 3.62a 175.70 ± 1.87b 77.84 ± 0.94d 43.59 ± 0.51e
Epicatechin-gallate 7.22 ± 0.06c 19.44 ± 0.82a 14.81 ± 0.17b 7.65 ± 0.12c 4.28 ± 0.02dEpiafzelchin–epiafzelchin–epicatechin 8.01 ± 0.35c 15.69 ± 0.29a 11.64 ± 0.40b 8.31 ± 0.03c 4.66 ± 0.51d
Swertiamacroside 10.17 ± 0.02c 14.59 ± 0.09a 12.76 ± 0.04b 10.76 ± 0.37c 6.02 ± 0.18dHyperin 1.13 ± 0.01c 3.72 ± 0.22a 1.85 ± 0.08b 0.72 ± 0.01d 0.41 ± 0.002e
Epiafzelchin-epicatechin-O-methyl gallate 28.73 ± 1.37c 75.39 ± 2.60a 62.88 ± 3.08b 24.31 ± 1.09d 13.61 ± 2.26e(−)-Epicatechin-3-(3”-O-methyl) gallate 15.18 ± 0.10c 35.97 ± 3.58a 28.43 ± 2.19b 12.96 ± 1.43d 7.26 ± 0.88e(Epi)afzelchin-(epi) catechin isomer B 9.95 ± 0.16c 23.25 ± 1.66a 19.29 ± 2.07b 8.62 ± 0.59d 4.83 ± 0.30e
Procyanidin B2-dimethylgallate 21.06 ± 0.08c 58.03 ± 2.01a 50.67 ± 1.59b 18.19 ± 1.27d 10.18 ± 0.64eEpiafzelchin–epicatechin-O-dimethylgallate 93.83 ± 1.83c 225.36 ± 4.12a 186.37 ± 3.36b 82.38 ± 2.60d 46.14 ± 1.08e
Epicatechin-O-3,4-dimethylgallate 39.10 ± 0.07c 82.65 ± 1.31a 74.51 ± 2.24b 36.41 ± 1.03d 20.39 ± 0.72eIsoquercitrin 0.46 ± 0.01d 0.72 ± 0.02a 0.63 ± 0.01b 0.58 ± 0.04c 0.33 ± 0.01e
Quercetin 0.32 ± 0.01c 1.68 ± 0.003a 1.09 ± 0.01b 0.18 ± 0.006d 0.10 ± 0.001Total 590.92 ± 13.25c 1553.62 ± 32.16a 1325.19 ± 18.14b 514.10 ± 10.44d 287.89 ± 7.91e
Flavonoids 431.68 ± 20.86c 1028.19 ± 19.88a 869.22 ± 22.09b 389.85 ± 15.48d 218.32 ± 10.72ePhenolic acid derivatives 159.24 ± 6.48c 525.42 ± 11.79a 455.97 ± 13.93b 124.24 ± 8.46d 69.58 ± 7.11e
Different letters (a–e) in the same line indicate significant differences (p < 0.05).
Antioxidants 2019, 8, 583 8 of 12
Second, a total of 26 bound phenolic compounds were quantified in whole buckwheat flours(GSTQ) and its fractions (GS215, GS160, GS85, and GS45) (Table 5). Among them, flavonoids represented63–68% of total bound phenolic content. The most concentrated flavonoid was catechin, in which thehighest value was obtained in GS215 (320.22 mg kg−1 d.w.), followed by GS160 (241.04 mg kg−1 d.w.),GS85 (80.05 mg kg−1 d.w.), GSTQ (77.79 mg kg−1 d.w.), and GS45 (36.05 mg kg−1 d.w.). The secondmost abundant flavonoid was epicatechin, in which the greatest value appeared in fraction with 215 µm(202.64 mg kg−1), this value was 32.4, 75.3, 76.3, and 89.1% higher than that obtained in GS160, GS85,GSTQ, and GS45. Rutin was an abundant flavonoid in all fractions that represented 10–14% of totalphenolic compounds, in which the highest value was obtained in GS215 (173.97 mg kg−1 d.w.), followby GS160 (127.24 mg kg−1 d.w.), GS85 (59.09 mg kg−1 d.w.), GSTQ (40.09 mg kg−1 d.w.), and GS45(27.09 mg kg−1 d.w.). The most abundant phenolic acid derivative was syringic acid, in which thegreatest concentration was obtained in GS215 (100.73 mg kg−1 d.w.), this concentration was 21.5%,68.9%, 69%, and 89.4% higher than that obtained in GS160, GSTQ, GS85, and GS45. There were nosignificant differences between the concentration of syringic acid obtained in GSTQ and GS85.
Total bound phenolic content was higher in GS215 (1565.22 mg kg−1 d.w.), in which the value was25%, 69.6%, 74.9%, and 87.6% higher than that obtained in GS160, GSTQ, GS85, and GS45. Therefore,bound phenolic content decreases as the particle size falls.
By comparison of bounds phenolic compounds analyzed in whole buckwheat flours, Verardo et al.(2011) [23] reported that the total bound phenolic compounds in buckwheat was 612.33 mg kg−1 d.w.and this value was in the same order of magnitude as that obtained in our work. Catechin, epicatechin,and syringic acid were the most concentrated bound phenolic compounds; these results coincidedwith ours.

Antioxidants 2019, 8, 583 9 of 12
Table 5. Table of quantification of bound phenolic compounds from whole buckwheat flour (GSTQ) and its fractions (GS215, GS160, GS85, and GS45) analyzed byHPLC-MS expressed as mg kg−1 d.w. flour. Different letters (a–e) in the same line indicate significant differences (p < 0.05).
Phenolic Compound GSTQ GS215 GS160 GS-85 GS45
2-hydroxy-3-O-β-D-glucopyranosylbenzoic acid 6.34 ± 0.08d 30.53 ± 1.22a 26.42 ± 1.43b 11.65 ± 0.04c 5.24 ± 0.02e
Protocatechuic-4-O-glucoside acid 4.26 ± 0.13d 18.50 ± 1.05a 15.77 ± 0.49b 8.24 ± 0.36c 3.20 ± 0.11eCaffeic acid hexose 0.51± 0.04e 3.27 ± 0.05a 2.89 ± 0.18b 1.07 ± 0.06c 0.80 ± 0.001d
Catechin-glucoside isomer a 0.48 ± 0.01c 2.03 ± 0.04a 1.12 ± 0.01b 0.50 ± 0.02c 0.05 ± 0.0003dCaffeic acid hexose 20.33 ± 0.12d 82.34 ± 2.10a 56.26 ± 0.86b 30.25 ± 1.15c 10.10 ± 0.46e
Catechin 77.79 ± 2.61c 320.22 ± 3.09a 241.04 ± 1.82b 80.05 ± 1.94c 36.05 ± 0.76dSwertiamacroside 38.30 ± 3.28c 130.85 ± 1.28a 88.47 ± 1.56b 40.03 ± 2.46c 12.06 ± 0.18d
Caffeic acid 0.13 ± 0.001c 1.02 ± 0.04a 0.64 ± 0.02b 0.13 ± 0.01c 0.06 ± 0.001dEpicatechin 47.93 ± 0.09d 202.64 ± 3.01a 136.89 ± 2.74b 50.05 ± 1.10c 22.05 ± 2.63e
(Epi)afzelchin-(epi) catechin 0.48 ± 0.03d 3.52 ± 0.11a 2.91 ± 0.004b 1.05 ± 0.01c 0.05 ± 0.002eSyringic acid 31.28 ± 0.90c 100.73 ± 1.99a 79.03 ± 0.69b 31.26 ± 1.24c 10.72 ± 0.57e
Orientin 0.48 ± 0.02d 3.15 ± 0.09a 2.31 ± 0.003b 0.96 ± 0.01c 0.05 ± 0.003ep-Coumaric acid 2.11 ± 0.10d 9.47 ± 0.11a 6.42 ± 0.30b 3.11 ± 0.14c 1.10 ± 0.02eProcyanidin A 4.06 ± 0.08c 11.88 ± 0.32a 9.60 ± 0.24b 4.04 ± 0.07c 1.04 ± 0.04d
Myricetin 0.05 ± 0.001c 0.12 ± 0.01a 0.09 ± 0.001b 0.05 ± 0.0001c 0.01 ± 0.002dVitexin 3.10 ± 0.10d 14.29 ± 0.46a 11.08 ± 0.29b 5.01 ± 0.06c 2.01 ± 0.01eRutin 40.09 ± 2.24d 173.97 ± 2.08a 127.24 ± 1.75b 59.09 ± 0.28c 27.09 ± 1.15e
Epicatechin gallate 13.24 ± 0.69c 50.94 ± 1.30a 39.92 ± 0.84b 12.07 ± 0.45c 5.95 ± 0.28dCatechin-glucoside isomer b 18.04 ± 0.25d 78.06 ± 0.92a 70.34 ± 1.37b 30.04 ± 0.66c 10.03 ± 0.49e
Swertiamacroside 30.04 ± 0.38d 105.31 ± 1.56a 89.39 ± 2.61b 35.07 ± 0.81c 14.05 ± 0.10eEpiafzelchin–epicatechin-O-methylgallate 8.05 ± 0.11d 35.64 ± 0.86a 26.18 ± 1.27b 18.05 ± 0.78c 8.05 ± 0.04d
p-Coumaric acid 5.44 ± 0.44d 22.47 ± 0.19a 16.77 ± 1.06b 13.55 ± 0.07c 6.16 ± 0.86d(−)-Epicatechin-3-(3”-O-methyl) gallate 14.22 ± 0.16c 49.21 ± 0.88a 28.58 ± 1.63b 11.83 ± 0.23d 6.42 ± 0.08d
Epicatechin-O-3,4-dimethylgallate 1.31 ± 0.07d 5.36 ± 0.20a 3.89 ± 0.14b 2.10 ± 0.11c 0.94 ± 0.03eIsoquercitrin 4.10 ± 0.04d 17.61 ± 0.17a 13.62 ± 1.31b 6.11 ± 0.08c 3.10 ± 0.21e
Quercitrin 20.10 ± 1.13c 92.09 ± 3.44a 77.05 ± 1.83b 20.01 ± 2.06c 7.05 ± 0.66dTotal 392.23 ± 12.63d 1565.22 ± 14.88a 1173.92 ± 20.47b 475.37 ± 9.12c 193.41 ± 4.62e
Flavonoids 253.51 ± 4.80d 1060.73 ± 13.57a 791.86 ± 11.08b 301.01 ± 7.12c 129.92 ± 6.61ePhenolic acids 138.72 ± 8.15d 504.49 ± 5.76a 382.06 ± 6.94b 174.36 ± 10.15c 63.50 ± 2.89e
Antioxidants 2019, 8, 583 10 of 12
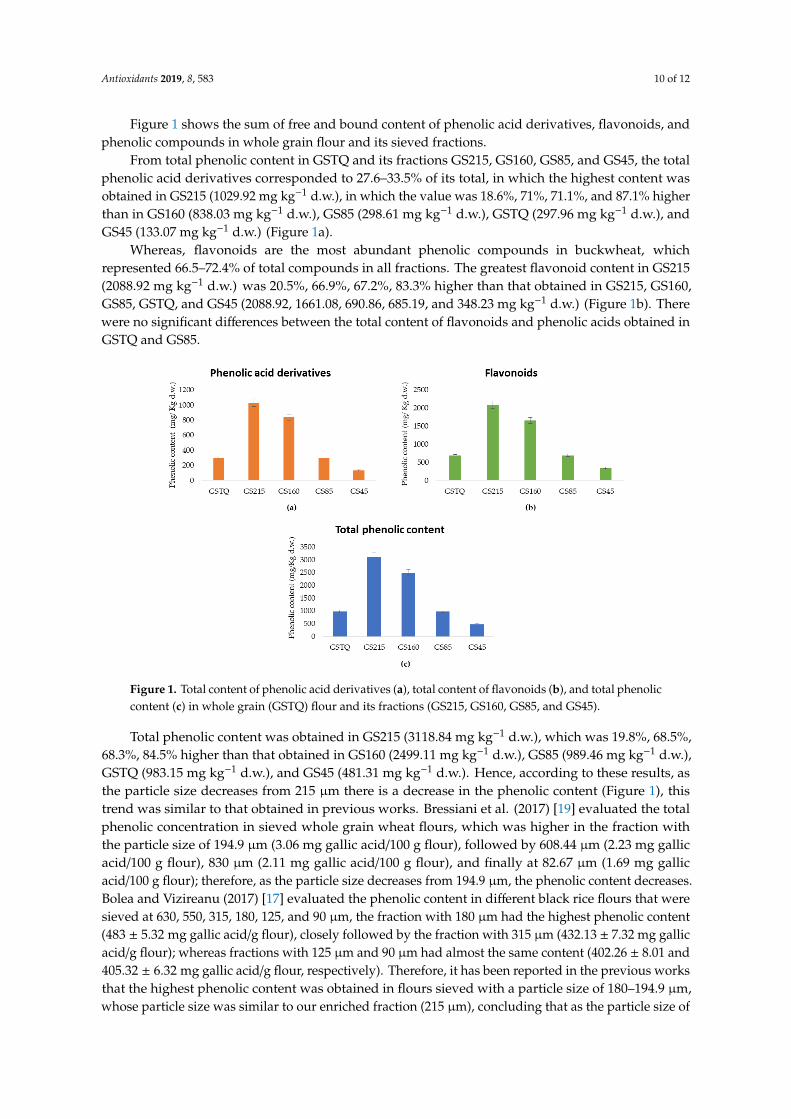
Figure 1 shows the sum of free and bound content of phenolic acid derivatives, flavonoids, andphenolic compounds in whole grain flour and its sieved fractions.
From total phenolic content in GSTQ and its fractions GS215, GS160, GS85, and GS45, the totalphenolic acid derivatives corresponded to 27.6–33.5% of its total, in which the highest content wasobtained in GS215 (1029.92 mg kg−1 d.w.), in which the value was 18.6%, 71%, 71.1%, and 87.1% higherthan in GS160 (838.03 mg kg−1 d.w.), GS85 (298.61 mg kg−1 d.w.), GSTQ (297.96 mg kg−1 d.w.), andGS45 (133.07 mg kg−1 d.w.) (Figure 1a).
Whereas, flavonoids are the most abundant phenolic compounds in buckwheat, whichrepresented 66.5–72.4% of total compounds in all fractions. The greatest flavonoid content in GS215(2088.92 mg kg−1 d.w.) was 20.5%, 66.9%, 67.2%, 83.3% higher than that obtained in GS215, GS160,GS85, GSTQ, and GS45 (2088.92, 1661.08, 690.86, 685.19, and 348.23 mg kg−1 d.w.) (Figure 1b). Therewere no significant differences between the total content of flavonoids and phenolic acids obtained inGSTQ and GS85.
Antioxidants 2019, 8, 583; doi:10.3390/antiox8120583 www.mdpi.com/journal/antioxidants
Figure 1. shows the sum of free and bound content of phenolic acid derivatives, flavonoids, and
phenolic compounds in whole grain flour and its sieved fractions.
From total phenolic content in GSTQ and its fractions GS215, GS160, GS85, and GS45, the total
phenolic acid derivatives corresponded to 27.6–33.5% of its total, in which the highest content was
obtained in GS215 (1029.92 mg Kg−1 d.w.), in which the value was 18.6%, 71%, 71.1%, and 87.1%
higher than in GS160 (838.03 mg Kg−1 d.w.), GS85 (298.61 mg Kg−1 d.w.), GSTQ (297.96 mg Kg−1 d.w.),
and GS45 (133.07 mg Kg−1 d.w.) (Figure 1a).
Whereas, flavonoids are the most abundant phenolic compounds in buckwheat, which
represented 66.5–72.4% of total compounds in all fractions. The greatest flavonoid content in GS215
(2088.92 mg Kg−1 d.w.) was 20.5%, 66.9%, 67.2%, 83.3% higher than that obtained in GS215, GS160,
GS85, GSTQ, and GS45 (2088.92, 1661.08, 690.86, 685.19, and 348.23 mg Kg−1 d.w.) (Figure 1b). There
were no significant differences between the total content of flavonoids and phenolic acids obtained
in GSTQ and GS85.
Figure 1. Total content of phenolic acid derivatives (a), total content of flavonoids (b), and total
phenolic content (c) in whole grain (GSTQ) flour and its fractions (GS215, GS160, GS85, and GS45).
Total phenolic content was obtained in GS215 (3118.84 mg Kg−1 d.w.), which was 19.8%, 68.5%,
68.3%, 84.5% higher than that obtained in GS160 (2499.11 mg Kg−1 d.w.), GS85 (989.46 mg Kg−1
d.w.), GSTQ (983.15 mg Kg−1 d.w.), and GS45 (481.31 mg Kg−1 d.w.). Hence, according to these
results, as the particle size decreases from 215 µm there is a decrease in the phenolic content (Figure
1), this trend was similar to that obtained in previous works. Bressiani et al. (2017) [19] evaluated the
total phenolic concentration in sieved whole grain wheat flours, which was higher in the fraction
with the particle size of 194.9 µm (3.06 mg gallic acid/100 g flour), followed by 608.44 µm (2.23 mg
gallic acid/100 g flour), 830 µm (2.11 mg gallic acid/100 g flour), and finally at 82.67 µm (1.69 mg
gallic acid/100 g flour); therefore, as the particle size decreases from 194.9 µm, the phenolic content
decreases. Bolea and Vizireanu (2017) [17] evaluated the phenolic content in different black rice
flours that were sieved at 630, 550, 315, 180, 125, and 90 µm, the fraction with 180 µm had the
highest phenolic content (483 ± 5.32 mg gallic acid/g flour), closely followed by the fraction with 315
µm (432.13 ± 7.32 mg gallic acid/g flour); whereas fractions with 125 µm and 90 µm had almost the
same content (402.26 ± 8.01 and 405.32 ± 6.32 mg gallic acid/g flour, respectively). Therefore, it has
Figure 1. Total content of phenolic acid derivatives (a), total content of flavonoids (b), and total phenoliccontent (c) in whole grain (GSTQ) flour and its fractions (GS215, GS160, GS85, and GS45).
Total phenolic content was obtained in GS215 (3118.84 mg kg−1 d.w.), which was 19.8%, 68.5%,68.3%, 84.5% higher than that obtained in GS160 (2499.11 mg kg−1 d.w.), GS85 (989.46 mg kg−1 d.w.),GSTQ (983.15 mg kg−1 d.w.), and GS45 (481.31 mg kg−1 d.w.). Hence, according to these results, asthe particle size decreases from 215 µm there is a decrease in the phenolic content (Figure 1), thistrend was similar to that obtained in previous works. Bressiani et al. (2017) [19] evaluated the totalphenolic concentration in sieved whole grain wheat flours, which was higher in the fraction withthe particle size of 194.9 µm (3.06 mg gallic acid/100 g flour), followed by 608.44 µm (2.23 mg gallicacid/100 g flour), 830 µm (2.11 mg gallic acid/100 g flour), and finally at 82.67 µm (1.69 mg gallicacid/100 g flour); therefore, as the particle size decreases from 194.9 µm, the phenolic content decreases.Bolea and Vizireanu (2017) [17] evaluated the phenolic content in different black rice flours that weresieved at 630, 550, 315, 180, 125, and 90 µm, the fraction with 180 µm had the highest phenolic content(483 ± 5.32 mg gallic acid/g flour), closely followed by the fraction with 315 µm (432.13 ± 7.32 mg gallicacid/g flour); whereas fractions with 125 µm and 90 µm had almost the same content (402.26 ± 8.01 and405.32 ± 6.32 mg gallic acid/g flour, respectively). Therefore, it has been reported in the previous worksthat the highest phenolic content was obtained in flours sieved with a particle size of 180–194.9 µm,whose particle size was similar to our enriched fraction (215 µm), concluding that as the particle size of

Antioxidants 2019, 8, 583 11 of 12
the fractions decreases a decrease in the concentration of phenolic compounds is obtained. This couldbe due to the fact that the most enriched fraction contains bran in a high proportion which possess ahigher phenolic content than endosperm, and bran could be lost with the sieving at lower particle size,obtaining thereby a fine fraction which is composed mainly of endosperm that contain lower phenoliccontent than bran.
4. Conclusions
In this study, sieving was tested as a dry green technology in order to produce functionalbuckwheat flours. An HPLC-MS has been used for the determination of free and bound phenoliccompounds in whole grain flour and its fractions sieved with 215 µm, 160 µm, 85 µm, and 45 µm ofparticle size. According to the results, the highest free and the bound phenolic content was obtained inbuckwheat fraction with 215 µm (GS215), in which the value decreases as the particle size decreases.
Therefore, the process of milling and sieving could be used with success to increase/enrichmeaningfully the content of phenolic compounds in sieved fractions from buckwheat. In fact, theconcentration of rutin was 40 mg kg−1 d.w. in GSTQ, whereas it increased in GS215 (174 mg kg−1 d.w.).At the same time, the GS215 fraction reported protein and ashes amounts two times higher than theGSTQ flours.
To our knowledge, this is the first report on the use of sieving to enrich buckwheat flour withphenolic compounds (rutin among them) and protein. These preliminary results showed that thistechnology could be used to produce buckwheat flours, naturally enriched in proteins and phenoliccompounds (rutin among others); while other fractions could be concentrated of starch. Briefly, sievedGS215 flour could be considered as naturally rich in phenolic compounds and protein buckwheat flourthat could be used as an ingredient/raw material to develop functional food.
Supplementary Materials: The following are available online at http://www.mdpi.com/2076-3921/8/12/583/s1,Figure S1: Base peak chromatogram (BPC) of bound phenolic compounds in buckwheat flour fraction GST215,obtained by HPLC-MS. See Table 3 for identification numbers.
Author Contributions: Conceptualization, V.V. and A.M.G.-C.; investigation, B.M.-G. and F.P.; supervision, V.V.,A.M.G.-C., and M.F.C.; writing—original draft, B.M.-G.; writing—review and editing, F.P., V.V., A.M.G.-C., E.M.,and M.F.C.
Funding: This research received no external funding.
Acknowledgments: Vito Verardo thanks the Spanish Ministry of Economy and Competitiveness (MINECO) for“Ramon y Cajal” contract (RYC-2015-18795). Beatriz Martín García would like to thank the University of Granadafor the “Convocatoria de movilidad internacional de estudiantes de doctorado” grant.
Conflicts of Interest: The authors declare no conflict of interest.
References
1. Bonafaccia, G.; Marocchini, M.; Kreft, I. Composition and technological properties of the flour and bran fromcommon and tartary buckwheat. Food Chem. 2003, 80, 9–15. [CrossRef]
2. Skrabanja, V.; Kreft, I.; Golob, T.; Modic, M.; Ikeda, S.; Ikeda, K.; Kreft, S.; Bonafaccia, G.; Knapp, M.;Kosmelj, K. Nutrient Content in Buckwheat Milling Fractions. Cereal Chem. 2004, 81, 172–176. [CrossRef]
3. Steadman, K.J.; Burgoon, M.S.; Lewis, B.A.; Edwardson, S.E.; Obendorf, R.L. Minerals, phytic acid, tanninand rutin in buckwheat seed milling fractions. J. Sci. Food Agric. 2001, 81, 1094–1100. [CrossRef]
4. Sedej, I.; Sakac, M.; Mandic, A.; Mišan, A.; Tumbas, V.; Canadanovic-Brunet, J. Buckwheat (Fagopyrumesculentum Moench) Grain and Fractions: Antioxidant Compounds and Activities. J. Food Sci. 2012, 77,C954–C959. [CrossRef] [PubMed]
5. Van Hung, P.; Morita, N. Distribution of phenolic compounds in the graded flours milled from wholebuckwheat grains and their antioxidant capacities. Food Chem. 2008, 109, 325–331. [CrossRef] [PubMed]
6. Ahmed, A.; Khalid, N.; Ahmad, A.; Abbasi, N.A.; Latif, M.S.Z.; Randhawa, M.A. Phytochemicals andbiofunctional properties of buckwheat: A review. J. Agric. Sci. 2014, 152, 349–369. [CrossRef]
Antioxidants 2019, 8, 583 12 of 12
7. Mikulajová, A.; Šedivá, D.; Hybenová, E.; Mošovská, S. Buckwheat cultivars—Phenolic compounds profilesand antioxidant properties. Acta Chim. Slovaca 2016, 9, 124–129. [CrossRef]
8. Lee, C.C.; Shen, S.R.; Lai, Y.J.; Wu, S.C. Rutin and quercetin, bioactive compounds from tartary buckwheat,prevent liver inflammatory injury. Food Funct. 2013, 4, 794–802. [CrossRef]
9. Inglett, G.E.; Chen, D.; Berhow, M.; Lee, S. Antioxidant activity of commercial buckwheat flours and theirfree and bound phenolic compositions. Food Chem. 2011, 125, 923–929. [CrossRef]
10. Adom, K.K.; Liu, R.H. Antioxidant activity of grains. J. Agric. Food Chem. 2002, 50, 6182–6187. [CrossRef]11. Bobkov, S. Biochemical and Technological Properties of Buckwheat Grains. In Molecular Breeding and
Nutritional Aspects of Buckwheat; Academic Press-Elsevier: Cambridge, MA, USA, 2016; ISBN 9780128036921.12. Steadman, K.J.; Burgoon, M.S.; Lewis, B.A.; Edwardson, S.E.; Obendorf, R.L. Buckwheat seed milling fractions:
Description, macronutrient composition and dietary fibre. J. Cereal Sci. 2001, 33, 271–278. [CrossRef]13. Kalinová, J.P.; Vrchotováb, N.; Tríska, J. Phenolics levels in different parts of common buckwheat (Fagopyrum
esculentum) achenes. J. Cereal Sci. 2019, 85, 243–248. [CrossRef]14. Vasanthan, T.; Temelli, F. Grain fractionation technologies for cereal beta-glucan concentration. Food Res. Int.
2008, 41, 876–881. [CrossRef]15. Kołodziejczyk, P.; Makowska, A.; Pospieszna, B.; Michniewicz, J.; Paschke, H. Chemical and nutritional
characteristics of high-fibre rye milling fractions. Acta Sci. Pol. Technol. Aliment. 2018, 17, 149–157. [PubMed]16. Delcour, J.A.; Rouau, X.; Courtin, C.M.; Poutanen, K.; Ranieri, R. Technologies for enhanced exploitation of
the health-promoting potential of cereals. Trends Food Sci. Technol. 2012, 25, 78–86. [CrossRef]17. Bolea, C.-A.; Vizireanu, C. Polyphenolic content and antioxidant properties of black rice flour. Food Technol.
2017, 41, 75–85.18. Renee, L.; Kubola, J.; Siriamornpun, S.; Herald, T.J.; Shi, Y. Wheat bran particle size influence on phytochemical
extractability and antioxidant properties. Food Chem. 2014, 152, 483–490.19. Bressiani, J.; Oro, T.; Santetti, G.S.; Almeida, J.L.; Bertolin, T.E.; Gómez, M.; Gutkoski, L.C. Properties of
whole grain wheat flour and performance in bakery products as a function of particle size. J. Cereal Sci. 2017,75, 269–277. [CrossRef]
20. ICC method 105/2. Standard Methods of the International Association for Cereal Science and Technology;International Association for Cereal Science and Technology Press: Vienna, Austria, 1995.
21. ICC method 104/1. Standard Methods of the International Association for Cereal Science and Technology;International Association for Cereal Science and Technology Press: Vienna, Austria, 1995.
22. Official Methods of Analysis of AOAC International 18th Edition; AOAC International Press: Gaithersburg, MD,USA, 2007.
23. Verardo, V.; Arráez-Román, D.; Segura-Carretero, A.; Marconi, E.; Fernández-Gutiérrez, A.; Caboni, M.F.Determination of free and bound phenolic compounds in buckwheat spaghetti by RP-HPLC-ESI-TOF-MS:Effect of thermal processing from farm to fork. J. Agric. Food Chem. 2011, 59, 7700–7707. [CrossRef]
24. Gómez-Caravaca, A.M.; Verardo, V.; Berardinelli, A.; Marconi, E.; Caboni, M.F. A chemometric approachto determine the phenolic compounds in different barley samples by two different stationary phases:A comparison between C18 and pentafluorophenyl core shell columns. J. Chromatogr. A 2014, 1355, 134–142.[CrossRef]
25. Schutyser, M.A.I.; van der Goot, A.J. The potential of dry fractionation processes for sustainable plant proteinproduction. Trends Food Sci. Technol. 2011, 22, 154–164. [CrossRef]
26. Verardo, V.; Arráez-Román, D.; Segura-Carretero, A.; Marconi, E.; Fernández-Gutiérrez, A.; Caboni, M.F.Identification of buckwheat phenolic compounds by reverse phase high performance liquid chromatographye electrospray ionization-time of flight-mass spectrometry (RP-HPLC e ESI-TOF-MS). J. Cereal Sci. 2010, 52,170–176. [CrossRef]
27. Liu, Y.; Cai, C.; Yao, Y.; Xu, B. Alteration of phenolic profiles and antioxidant capacities of common buckwheatand tartary buckwheat produced in China upon thermal processing. J. Sci. Food Agric. 2019, 99, 5565–5576.[CrossRef] [PubMed]
© 2019 by the authors. Licensee MDPI, Basel, Switzerland. This article is an open accessarticle distributed under the terms and conditions of the Creative Commons Attribution(CC BY) license (http://creativecommons.org/licenses/by/4.0/).


