Embed Size (px)
Citation preview

HAL Id: hal-03008908https://hal.archives-ouvertes.fr/hal-03008908
Submitted on 3 Dec 2020
HAL is a multi-disciplinary open accessarchive for the deposit and dissemination of sci-entific research documents, whether they are pub-lished or not. The documents may come fromteaching and research institutions in France orabroad, or from public or private research centers.
L’archive ouverte pluridisciplinaire HAL, estdestinée au dépôt et à la diffusion de documentsscientifiques de niveau recherche, publiés ou non,émanant des établissements d’enseignement et derecherche français ou étrangers, des laboratoirespublics ou privés.
Use of recurrence plots for identification and extractionof patterns in humpback whale song recordings
Franck Malige, Divna Djokic, Julie Patris, Renata Sousa-Lima, Hervé Glotin
To cite this version:Franck Malige, Divna Djokic, Julie Patris, Renata Sousa-Lima, Hervé Glotin. Use of recurrence plotsfor identification and extraction of patterns in humpback whale song recordings. Bioacoustics, Taylorand Francis, 2020, pp.1 - 16. �10.1080/09524622.2020.1845240�. �hal-03008908�

RESEARCH REPORT
Franck MALIGE, Universit d’Aix Marseille, Univ de Toulon, LIS quipe DYNIDivna DJOKIC, Laboratory of Bioacoustics (UFRN), Natal, Brazil Graduate
Program of Psychobiology, Biosciences Center, UFRN, Natal, BrazilJulie PATRIS, Universit d’Aix Marseille, Univ de Toulon, LIS quipe DYNIRenata SOUSA LIMA Laboratory of Bioacoustics (UFRN), Natal, BrazilHerv GLOTIN, Universit d’Aix Marseille, Univ de Toulon, LIS quipe DYNI
November 2020
Use of recurrence plots for identification and extraction
of patterns in humpback whale song recordings
A published version of this work in “bioacoustics” is available at“F. Malige , D. Djokic , J. Patris , R. Sousa-Lima H. Glotin (2020): Use of recurrence
plots for identification and extraction of patterns in humpback whale song recordings,Bioacoustics”
1

Use of recurrence plots for identification and extraction of patterns
in humpback whale song recordings
F. Maligea, D. Djokic b,c, J. Patrisa, R. Sousa-Lima b,c and H. Glotin a
a Universite de Toulon, Aix-Marseille Universite, CNRS, LIS, DYNI team, Marseilles, Franceb Laboratory of Bioacoustics, Department of Physiology and Behavior, Universidade Federaldo Rio Grande do Norte (UFRN), Natal, Brazilc Graduate Program of Psychobiology, Biosciences Center, UFRN, Natal, Brazil
ARTICLE HISTORY
Compiled December 3, 2020
ABSTRACT
Humpback whale song is comprised of well-structured distinct levels of organi-zation: combinations of sounds, repetition of combinations, and a sequence of rep-etitions, which have no clear silent intervals. This continuous sound output can behard to delimit, rather, it could be interpreted as a long series of states of a system.Recurrence plots are graphical representations of such series of states and have beenused to describe animal behavior previously. Here, we aim to apply this tool to visu-alize and recognize structures traditionally used in inferences about behavior (songsand themes) in the series of units manually extracted from recordings of humpbackwhales. Data from the Abrolhos bank, Brazil were subjected to these analyses. Ouranalytical tool has proven efficient in identifying themes and songs from continuousrecordings avoiding some of the human perception bias and caveats. Furthermore,our song extraction is robust to errors coming from both manual and automatedtranscriptions, constructing a level of description largely independent of the firststage of analysis.
HIGHLIGHTS
• The complex hierarchical and cyclical structure of humpback whale song can bevisually represented in recurrence plots
• Recurrence plots of humpback whale singing provide insights into the intra-individual variation in song structures of a male
• Our tool can help extracting structures, from long recordings, removing somehuman perceptual caveats
KEYWORDS
Humpback whale, song, recurrence plot, song structure, sound visualization, soundtranscription, sound sequences
1. Introduction
Songs usually describe sequences of sounds showing some structure. Complex strings orsequences of sounds have evolved in many taxa (Kershenbaum et al. 2014) and animals
CONTACT F.Malige. Email: [email protected]

may sing with varying degrees of complexity. Depending on the research question, onemay or may not consider the adjacent acoustic context in which such songs, or soundsequences, are delivered, i.e., some are separated by silent intervals, but some are not.These long and continuous complex sequences of sounds impose the added challengeof limiting when one biological meaningful sequence ends, and another begins. Thehumpback whale male song is an example of such an animal acoustic output structurewhich is very hard to characterize due to the issues just described.
1.1. Structure of humpback whales songs
Schreiber (1952) was the first to describe sounds recorded in the ocean by the U. S.Navy in 1951 which were later attributed to humpback whales,Megaptera novaeangliae(Schevill and Watkins 1962). Nonetheless, the complex structure of the humpbackwhale acoustic display - the song - was noticed almost a decade later by Katy and RogerPayne in 1969 and formally published by Payne and McVay (1971). Three decadesafter that, genetic confirmation (Darling and Brub 2001) supported the behavioraland morphological evidence that only males sing (Darling (1983), Glockner (1983)).
According to Payne and McVay’s description, singing males emit sound units thatare arranged in phrases that are repeated to form a theme. Themes are sung in afixed order which is a song, and a song session is the continued rendition of the song.Constant changes in the song throughout the singing season, called song evolutioncharacterize the dynamic of singing activity in humpback whales (Payne et al. 1983).This hierarchical song structure that cycles in a fixed order was revised by Cholewiaket al. (2013) to incorporate multi-level variation in song structure and to addresssome caveats with the original structure and order proposition. Fundamental differ-ences between bird song literature that inspired Payne and McVay (1971), such as thelack of silences between song renditions, hindered the acknowledgement that boxinghumpback whale song into static artificial hierarchical levels was potentially mislead-ing inferences (Cholewiak et al. 2013). Specially complicated is to arbitrarily definelimits of songs and themes that would vary depending on who was describing it.
Methodology on humpback whale song elements identification (and extraction) isstill advancing, as consensus on the best protocols are not yet established. As the songand its elements vary in length and order (Cholewiak et al. 2013), it is challengingto manually identify them (and their limits) without subjectivity. Automating theprocess of song structure recognition would significantly reduce the frequent humanbias. As a mean of going a step closer to this goal of automation, we propose a methodbased on the “unit” level of the vocalization. Unit is the best defined element of thehumpback whale song, and can be described as “the shortest sound entity recognizedby the human ear, separated from other sounds by a short period of silence” (Payneand McVay 1971). Even though classifying units can be a tricky process since there issome versatility in the renditions of the same unit, yet as an entity, unit remains themost unambiguous element of the humpback whale song hierarchy.
In order to reliably define patterns of higher hierarchical level - themes and songs, asassemblies of units, we propose a new method to remove some of the human influence indefining the start and end points of songs. This is done by adopting a semi-automatedprotocol to detect, analyze or extract the aforementioned features from transcribedunit label strings.
3

1.2. Recurrence plots
Recurrence plots are used to visualize and analyze, at a global level, long series of statesof a system (see definition by Eckmann et al. (1987) in the case of a general dynamicalsystem). This tool and its graphical representation have been used in several scientifictopics : first in medicine in Zbilut et al. (1990) and then in astronomy, neuroscience,mechanics, geology, climate changes (see review by Marwan et al. (2007)). This tool hasrecently been proposed to study structures in animal movements or communicationin Ravignani and Norton (2017). It was used in acoustics - monitoring of air guns(Miralles et al. 2015), and bioacoustics - shrimps sound production (Hee-Wai et al.2013). A closer application to our problem of analyzing humpback whale songs hasbeen to visualize structures of a music extract (Foote 1999) or to cut it automaticallyas in Foote (2000) or Paulus et al. (2010). It has recently been used to study therhythm of humpback whale sound production in Schneider and Mercado-III (2018),without focusing on the spectral content of the sounds.
The main topic of this paper is to apply this tool to visualize and recognize the mainstructures (songs and themes) in unit series of humpback whales. We apply this methodto data taken in Abrolhos bank, off the northeastern coast of Brazil (see section 2.1).Theses recordings were manually transcribed into a string of units named as letters (seesection 2.2). On this input, a matrix of distances, based on the Levenshtein distanceis computed as done in recurrence plots (see section 3). A method for the automaticextraction of songs in the series of units is proposed (see section 4) and tested on ourdata set in the final section 5.
2. Data collection and sound units transcription
2.1. Data collection
Data was collected in the Abrolhos bank, located off the Northeastern coast of Brazil(17oS and 38oW) where humpback whales come during the austral winter and whichis considered the main calving grounds for the species in the western south AtlanticOcean (Martins et al. (2001) and Andriolo et al. (2006)). During 2000 and 2001 re-search cruises, groups of humpback whales were sighted and monitored for acousticactivity using one HTI 90 min hydrophone connected to a portable DAT Sony TCDD-10 (sampling rate 48 kHz). Vocalizing males were then identified and located bymonitoring the amplitude decrease of an individual’s sounds as it surfaced to breath.Silent approaches to these focal singers were performed using a small zodiac with animprovised sail. Songs were collected from the zodiac at distances that varied from100-500m to the focal male while its behavioral activity was continuously registered.Several recordings were made but only the best quality ones were used in our analy-ses. Selected recordings made in September of the year 2000 generated 3 high qualityaudio files (recordings #1,2,3) lasting respectively 58 minutes, 1 hour 37 minutes and2 hours and 7 minutes. In September of 2001 the two selected audio files (recordings#4,5) were respectively 26 minutes and 1 hour and 38 minutes long. Another studyof song sessions in the same place in 2000 will serve as a comparison for the data wepresent (Arraut and Vielliard 2004).
4

Figure 1. Time (min:sec) / frequency (kHz) representation of an extract of recording #3 (from Abrolhos
Archipelago 2000), 1024 point FFTs, Hann window, 43.1 Hz resolution and 50% overlap. Unit transcriptioninto letters is signaled above the boxes
2.2. Sound unit transcription
Classifying units into specific types is a complex problem, since there is a large ver-satility in the acoustical properties of a single unit (Janik 1999). First, there is aseemingly infinite number of different unit types used by whales, in an ever-changingsong. Second, even the units belonging to the same type may vary to a certain levelthroughout the same song, in the recordings of different singers, and depending on thequality of the dataset. Thus, a different final product of classification can arise fromthe same dataset due to differences in the methods used to determine the units. Thefinal number of different unit types in different studies varies greatly, from twelve tomore than one-hundred (Pines 2018). Challenge to group the units by type (as similaror different), opens the debate on what is the acceptable level of variation within thesame unit type.
In order to overcome this difficulty, we used the context i.e. the position of theunit in the song (or more commonly in the phrases within each theme), defined bythe arrangement of adjacent units (Green et al. 2011). The context has proven as agood way to help determine the unit type (Cholewiak et al. 2013). For this work,all recordings were inspected by hand. Spectrograms were created using 1024 pointFFTs, Hann window, 43.1 Hz resolution and 50% overlap (created by software Ravenpro 1.5 - Cornell Lab of Ornithology, Ithaca, NY, Program (2014)), and subjected toaural and visual inspection by two trained analysts. Each analyst separately inspectedand labeled the whole dataset. This procedure is a common protocol adopted byhumpback whale song researchers (Payne and McVay (1971), Darling et al. (2019)).Our protocol for unit classification also takes context into consideration, i.e. wherethe unit is placed, so that other hierarchical levels of organization can help define howmuch variation is allowed in a single unit type. Note that even when studies carry onunit annotation using computational methods, the results are usually validated usingmanual classification (Pace et al. (2010), Garland et al. (2013), Allen et al. (2017)).
The labeling was done in the following way: every unit type was attributed an alpha-bet letter based on its distinctiveness from other units (Darling et al. 2019). Analystsconsidered visually and auditory perceptual characteristics for classification such asunit tonal or pulsed quality, its pitch content and frequency modulation pattern, itsduration, and its placement within phrases (context). Each time the specific unit wouldarise in the recording, it was labeled in Raven, according to its type, minding its con-text (adjacent units). The final product of every separate recording would be a list
5

of N consecutive letters, the way the units appeared in that specific humpback whalevocalization (see figure 1 and supplementary material #1). This list of letters (units)will, in the later steps of the method, serve as an input for computing recurrence plots(section 3). Finally, an inexperienced analyst, using another software (Audacity, usinga 8192 points FFT, Hanning window, 99% overlap) independently transcribed part ofrecording #3 into a series of units as a comparison with the first transcription and acheck on the robustness of our method (see section 5.2).
3. The Levenshtein distance recurrence plots
3.1. Definition of the Levenshtein distance recurrence plot of order n
To visualize the structures contained in a recording, we compute a distance matrix, us-ing OCTAVE (Eaton et al. 2009) in the following way. Each recording is transcribed asa string of N letters representing sound units (see section 2.2). Then we define extractias an n-letter extract beginning with unit number i. The length of the extracts n istaken much smaller than the total length of the string N . The Levenshtein distancesdij = Levenshtein distance (extracti, extractj) between all pairs of n-letters extractsare computed.
0
200
400
600
800
1000
1200
0 200 400 600 800 1000 1200
po
sit
ion
of
the s
eco
nd
5 lett
er
extr
act
position of the first 5 letter extract
0
0.2
0.4
0.6
0.8
1
Figure 2. Example of a Levenshtein distance recurrence plot (5
letter extracts) created form recording number #2 from AbrolhosArchipelago (2000). The number of units of this recording is N =1260. The coefficients of the matrix denote correlation between 5letter extracts (0 is no correlation, 1 is maximal correlation)
The Levenshtein dis-tance between two stringsis the minimum numberof insertions, deletions andsubstitutions necessary totransform one string into theother (Levenshtein. 1965).Note that the computationof other types of distancematrix could be achievedchoosing other distancesbetween two strings of letters: Jaro-Winkler, Damerau-Levenshtein and Hammingdistances for example.
For convenience, we defineda correlation index by :
cij =n− dij
n
Thus the coefficients of thematrix satisfy cij ∈ [0; 1] . Thecoefficient 0 means maximum Levenstein distance and thus minimal correlation. Thecoefficient 1 means zero Levenstein distance and thus maximal correlation.
The resulting matrix (cij) is a square matrix of size N − n + 1 ≃ N , symmetrical,and has ones on its diagonal (maximal correlation between one element and itself). Asan example, figure 2 shows the graphical representation of this Levenshtein distancematrix of recording #2 (a total of N =1260 units), with 5-letters extracts (n=5).
The result is a recurrence plot of a dynamical system (as defined in Eckmannet al. (1987)) in which a state is a vector of n letters. We call this special recurrence
6

plot the Levenshtein distance recurrence plot of order n (LDRPn).
0
100
200
300
400
500
600
700
800
0 100 200 300 400 500 600 700 800
po
sit
ion
of
the s
eco
nd
2 lett
er
extr
act
position of the first 2 letter extract
0
0.2
0.4
0.6
0.8
1
0
100
200
300
400
500
600
700
8000 100 200 300 400 500 600 700 800
po
sit
ion
of
the s
eco
nd
12 lett
er
extr
act
position of the first 12 letter extract
0
0.2
0.4
0.6
0.8
1
0
100
200
300
400
500
600
700
800
0 100 200 300 400 500 600 700 800
po
sit
ion
of
the s
eco
nd
7 lett
er
extr
act
position of the first 7 letter extract
0
0.2
0.4
0.6
0.8
1
0
100
200
300
400
500
600
700
0 100 200 300 400 500 600 700
po
sit
ion
of
the s
eco
nd
17 lett
er
extr
act
position of the first 17 letter extract
0
0.2
0.4
0.6
0.8
1
n=2
n=12 n=17
n=7
Figure 3. Recording #5 (from Abrolhos Archipelago 2001) : Lev-enshtein distances recurrence plots for different values of the lengthn of the extract (2,7,12 and 17)
The value of n is chosen bythe analyst. In our data, the vi-sual information is basically thesame when n varies (see figure3). For low values of n, thereare few levels of Grey. For highvalues of n, the resulting fig-ure is more blurred (see figure3), and the computation of Lev-enshtein distance is rather timeconsuming (the time of compu-tation of the distance betweentwo strings of n letters is pro-portional to n2 (Wagner andFischer 1974)). The computa-tion of the LDRPn for n = 17and N = 800 in figure 3, takesaround one hour in a domesticcomputer. The parameter n canbe adapted depending on theuse of the LDRPn : visual anal-ysis, extraction of structures, etc...
3.2. Visual identification of main structures in the recurrence plot
0
200
400
600
800
1000
0 200 400 600 800 1000
po
sit
ion
of
the
se
co
nd
5 l
ett
er
ex
tra
ct
position of the first 5 letter extract
0
0.2
0.4
0.6
0.8
1
THEMES
SONG RENDITIONS
Figure 4. Recording #1 from Abrolhos archipelago, 2000 : Leven-shtein distances recurrence plot commented (n=5). The main struc-tures of humpback whale sound production appear : songs in blue,
themes in yellow.
Figures 2, 3 and 4 showobvious structures in therecording. On the diagonalof the matrix, squares repre-sent auto-similar structures.Rectangles out of the diag-onal show whether thesesstructures correlate with eachother. The high contrast ofthis representation is due tothe sparsity of input repre-sentation (letters) added tothe efficiency of the distanceoperator.
In figure 4, we annotatedthe two different scales ofstructures found in all record-ings of this study. First, aglobal pattern can be seenthat is reproduced periodi-cally (the “period” can beseen in the horizontal or verti-cal regularly spaced correlations of parts of the recording). We thus define a song as
7
0 0.005
0
0.005
frequency (in /units)
freq
uenc
y (in
/uni
ts)
200 400 600 800 10000
500
1000
1500
position of the 5 letter extract
sum
of t
he s
elec
ted
colu
mns
of t
he L
DR
P
200 400 600 800 10000
5000
10000
15000
20000
25000
position of the 5 letter extract
conv
olut
ion
of th
e su
m w
ith th
e st
ep fi
lter SONG
occurence 1 occurence 2
SONG SONG SONG
occurence 3 occurence 4
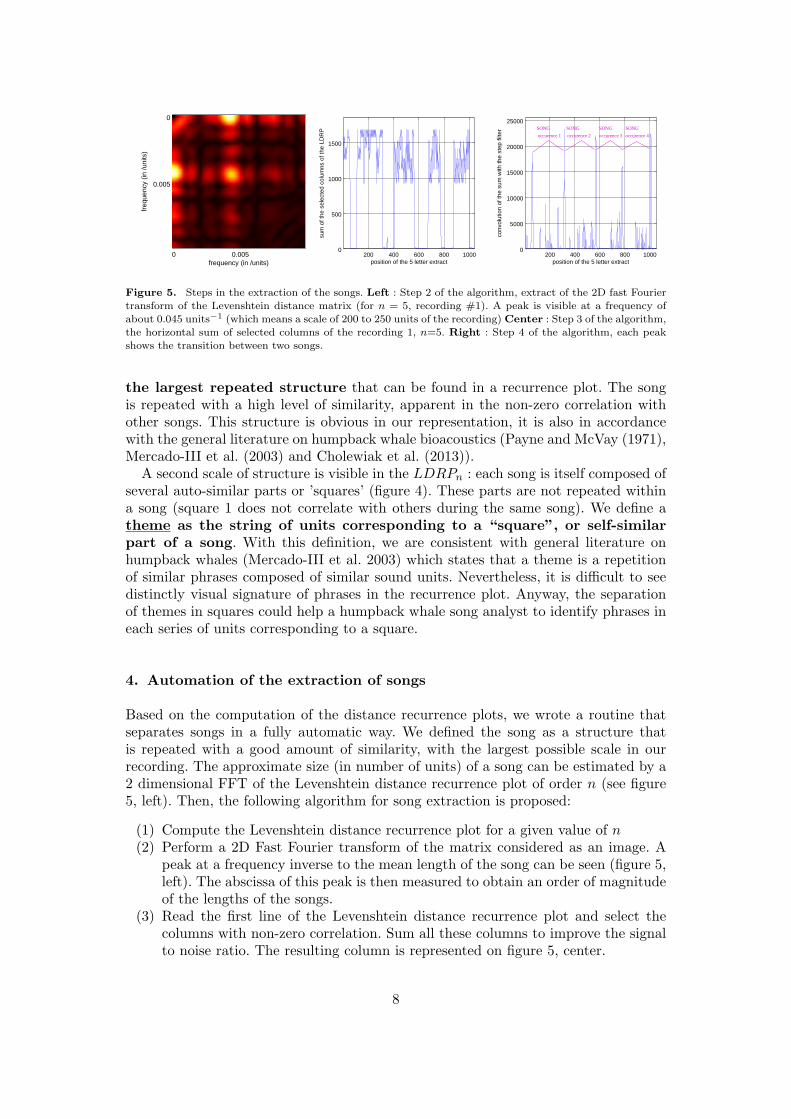
Figure 5. Steps in the extraction of the songs. Left : Step 2 of the algorithm, extract of the 2D fast Fouriertransform of the Levenshtein distance matrix (for n = 5, recording #1). A peak is visible at a frequency ofabout 0.045 units−1 (which means a scale of 200 to 250 units of the recording) Center : Step 3 of the algorithm,
the horizontal sum of selected columns of the recording 1, n=5. Right : Step 4 of the algorithm, each peakshows the transition between two songs.
the largest repeated structure that can be found in a recurrence plot. The songis repeated with a high level of similarity, apparent in the non-zero correlation withother songs. This structure is obvious in our representation, it is also in accordancewith the general literature on humpback whale bioacoustics (Payne and McVay (1971),Mercado-III et al. (2003) and Cholewiak et al. (2013)).
A second scale of structure is visible in the LDRPn : each song is itself composed ofseveral auto-similar parts or ’squares’ (figure 4). These parts are not repeated withina song (square 1 does not correlate with others during the same song). We define atheme as the string of units corresponding to a “square”, or self-similarpart of a song. With this definition, we are consistent with general literature onhumpback whales (Mercado-III et al. 2003) which states that a theme is a repetitionof similar phrases composed of similar sound units. Nevertheless, it is difficult to seedistinctly visual signature of phrases in the recurrence plot. Anyway, the separationof themes in squares could help a humpback whale song analyst to identify phrases ineach series of units corresponding to a square.
4. Automation of the extraction of songs
Based on the computation of the distance recurrence plots, we wrote a routine thatseparates songs in a fully automatic way. We defined the song as a structure thatis repeated with a good amount of similarity, with the largest possible scale in ourrecording. The approximate size (in number of units) of a song can be estimated by a2 dimensional FFT of the Levenshtein distance recurrence plot of order n (see figure5, left). Then, the following algorithm for song extraction is proposed:
(1) Compute the Levenshtein distance recurrence plot for a given value of n(2) Perform a 2D Fast Fourier transform of the matrix considered as an image. A
peak at a frequency inverse to the mean length of the song can be seen (figure 5,left). The abscissa of this peak is then measured to obtain an order of magnitudeof the lengths of the songs.
(3) Read the first line of the Levenshtein distance recurrence plot and select thecolumns with non-zero correlation. Sum all these columns to improve the signalto noise ratio. The resulting column is represented on figure 5, center.
8

50 100 150 200
50
100
150
200
position of the first 5 letter extract
posi
tion
of th
e se
cond
5 le
tter
extr
act
20 40 60 80 100 120 140
20
40
60
80
100
120
140
position of the first 5 letter extract
posi
tion
of th
e se
cond
5 le
tter
extr
act
0
0.2
0.4
0.6
0.8
1
Figure 6. Two songs automatically extracted. Left : Recording #1 from Abrolhos archipelago, 2000 : thirdsong automatically extracted from figure 4. In order to see clearly the song, the frame of the figure is chosen a
bit larger for representation. Right : Recording #2 from Abrolhos archipelago, 2000 : zoom on the third songoccurrence in the Levenshtein distance recurrence plot of figure 2. Different types of transition between themesappear.
(4) Find sudden increases or upward steps in the resulting column using convolutionwith a step filter (figure 5, right). Keep only the steps compatible with theaverage song size predicted by the 2D Fourier transform. Here, we defined themargin of acceptability at one third of the average size given by FFT analysis.
(5) Extract the units transcribed from the recording between two upward steps: thisis a song (figure 6).
5. Results : song extraction
5.1. Extraction of songs in series of units from Abrolhos Archipielago in2000/2001
We applied the algorithm presented in the previous section to the five recordings ofour study. Visually, the same features corresponding to our definition of songs andthemes appear in each Levenshtein distance recurrence plot. The recording #4 is tooshort and do not present a complete song and our routine consequently did not extractany song. In all the other recordings, the extraction of songs was achieved successfully.In recording #5, only one song is present.
We compared the extraction of songs carried out by our routine, based on the Lev-enshtein distance recurrence plot, and songs delimited by a human expert. Comparisonwas performed for the recording #3. The analyst followed the instructions describedin Cholewiak et al. (2013), the choice for the beginning point of the first song was thefirst complete theme (composed of the same type of letters). The extraction of thesongs (presented in supplementary material #2) is equivalent by both methods. Theonly difference sits in a few transitional units (less than 5 units per song).
It is interesting to note that recurrence plots can show transitional phrases, whichare combinations of units from the previous theme with ones from the next theme themale sings (Frumhoff (1983), Payne et al. (1983), Cholewiak et al. (2013)). Transitionalphrases appear in our recurrence plots as blurry areas around self-similar ”squares”
9

that represent the themes. It is particularly clear in figure 6 (right), where the threesquares corresponding to themes number 1,2 and 3 inter-penetrate each other. On thecontrary, the transition between themes in figure 6 (left) is quite abrupt : the squaresare well separated.
A B C D E F G H I J K L M O P0
10
20
30
40
Units
Per
cent
age
in e
ach
song
RECORDING 2
RECORDING 3
RECORDING 4
RECORDING 1
Figure 7. Percentage of each unit in the four song oc-currences of recording #1 from Abrolhos archipelago,
2000 (colors are red, blue, green and black for song oc-
currences 1,2,3,4 respectively). The first occurrence of
the song in the recording (see figure 4), in red in this
figure is quite different from the other occurrences in
term of its units, due to boat noise that prevented anaccurate identification of several units.
Once the songs are extracted, the au-tomatic measurement of the songs pa-rameters is easily done. As an exam-ple, we automatically computed songs’length, alphabet (set of different units -or letters - used in the song), and impor-tance of units (% of the number of occur-rence of a particular unit in a song oc-currence compared to the length of thissong). These results are presented in ta-ble 1 and figure 7.
Figure 7 gives the percentage of eachunit in the song occurrence of recording#1. The first occurrence of the song, inred (or circles), is quite different fromthe other songs. Indeed, during the firstsong occurrence a series of units aremasked by boat noise and were labeledwith a special letter (H) in place ofa whole theme containing the lettersJ,K,L,M,O,P. It can be seen in the Lev-enshtein distance recurrence plot wherethe first theme of the first rendition of the song does not correlate with any of thethemes of other renditions (figure 4). However, the recurrence plot still enabled us toextract the song structure accurately.
The results of table 1, where the mean length of all the songs analyzed is 255,compares well with the results of Arraut and Vielliard (2004), working with the samedata but with manual analysis, where the mean song length is around 250-300 units.
Table 1 : Mean and standard deviation of the songs’ length for recordings #1,2,3 and 5
Recording year nb of songs mean length (in units) standard dev. (in units)#1 2000 4 238 22#2 2000 6 177 25#3 2000 8 301 72#5 2001 1 438 none
5.2. Robustness of the extraction method
In order to test the robustness of our method of songs’ extraction, we first checked thatthe extraction is not dependent on the order n of the Levenshtein distance recurrenceplot LDRPn. For each recording (#1 to #3) the number of songs extracted was thesame for n going from 4 to 10.
We then checked that the extraction is not heavily dependent on the unit tran-
10

0
200
400
600
800
1000
1200
1400
16000 200 400 600 800 1000 1200 1400 1600
po
sit
ion
of
the
se
co
nd
5 l
ett
er
ex
tra
ct
position of the first 5 letter extract
0
200
400
600
800
1000
1200
1400
1600
1800
0 200 400 600 800 1000 1200 1400 1600 1800
po
sit
ion
of
the
se
co
nd
5 l
ett
er
ex
tra
ct
position of the first 5 letter extract
0
0.2
0.4
0.6
0.8
1
Figure 8. Recurrence plots of part of the recording #3 from Abrolhos archipelago, 2000, with n = 5. Left :transcription into units by confirmed analysts, Right : transcription into units by an inexperienced analyst
scription. For recording #3, an inexperienced analyst transcribed part of it in a stringof units. Even though the confirmed analysts transcribed 1614 units and the inex-perienced one 1855, the recurrence plots have the same appearance (figure 8). Theautomatic extraction of the song was then performed on these two strings of units andgave similar results : four songs are extracted in each case. The ratio ru of the lengthof the song extracted from the series of units produced by the confirmed analysts andthe length of the song extracted from the series of units produced by the inexperiencedanalyst (measured in unit) is very stable for each song extracted (ru = 0.86± 0.006).We also checked that the determination of the start and end of an automatically ex-tracted song is consistent between the human transcriptions (with a ratio betweensongs durations (measured in seconds) of rt = 1.01 ± 0.04 between the two humananalysts). Thus, our method of song extraction is remarkably robust to differences inunit labeling due to the subjectivity or lack of training of the analyst.
In addition, we checked the robustness of our method to accidental errors in unitstranscription, not considering whether this was done automatically or manually. Weapplied the extraction routine to the strings of units of recording #1 and #2, graduallyand randomly changing a percentage of these units (replacing it randomly by a unitfrom the same recording). For each percentage of error, the test was repeated 20 timesand the number of extracted songs was noted. The result is visible in figure 9 where,for each percentage of errors in unit identification, the average number of extractedsongs is plotted, along with the error bar corresponding to the variation across the 20draws. We see that for less than 5% of randomly changed units, the results are verycoherent with the original recording. Even as the rate of error grows, the number ofextracted songs stays close to the nominal one (1 song of difference for up to 20% oferrors).
Last, we applied the extraction routine to strings of units of recording #1 where wegradually and randomly removed a percentage of these units. In this case, until 40%of units were removed, the routine extracts the correct number of songs for more than90% of the tries. Therefore, our extraction method is robust to missing units duringthe transcription, for example when the signal to noise ratio of the vocalizations ofhumpback whale is low. However, this was done for randomly chosen units and do not
11

0 10 20 30 400
2
4
6
8
% of randomly changed units
Num
ber
of s
ongs
ext
ract
ed
0 10 20 30 400
2
4
6
8
10
% of randomly changed units
Num
ber
of s
ongs
ext
ract
ed
Figure 9. Number of song correctly found in function of the percentage of randomly changed units. The testis done on 20 random tries and the error bar quantifies the distribution of the results over the 20 tries. Left :
Recording 1 from Abrolhos archipelago, 2000, Right : Recording #2 from Abrolhos archipelago, 2000
account for systematic errors (such as would happen if one type of unit only would belost in the noise, which is not an improbable case).
6. Discussion
6.1. Use of recurrence plots
Recurrence plots are a very visual way of representing the sequence of units, allowingimmediate global identification of the structures of the highly organized vocalizationemitted by male humpback whales, presented in the precedent sections. It helps withgetting a qualitative view of their variability as well as the type of transition (abruptversus gradual change) between these structures. It could be used as a valuable toolfor every highly structured type of sound emission by animals and seems particularlywell fitted to study the ever changing structures of humpback whales songs.
Recurrence plots can also be used for automatic unsupervised selection of differentstructure levels in the recording translated as a series of units. The results of theprevious section indicate that our method of extraction is quite robust to errors duringmanual or automatic transcription of the sound units into a string of letters. Thequantification of errors detected for song unit classification systems in studies suchas Dunlop et al. (2007), Ou et al. (2013) or Rekdahl et al. (2018) is usually from10% to 20% which compares well with the percentage of errors that still enables us toautomatically extract songs.
The use of recurrence plot to extract songs is still a work in progress but theseresults are encouraging. Even in the situation of different criteria for unit labeling indifferent recordings, the song session structure will probably still be visible. This isan additional benefit of the proposed recurrence plot methodology, as it underminesdifferences in unit labeling among studies. The plot gives a representation of eachrecording, rather independent on the string it was calculated from. In this way, therecurrence plots provide standardized limits of patterns in the recordings that can befurther explored and compared.
12

This automated song extraction is the first step for many more studies regard-ing song analysis, and comparison between songs. The automated extraction of otherstructures (such as themes) could be performed based on this tool but is not as straight-forward as songs extraction. Some of the difficulties of theme extraction are : blurredor imprecise transition between themes, unclear definition of a theme, very short orevanescent themes. Thus any method of automated theme extraction would probablybe rather ad hoc, which is the reason why we didn’t perform it on our limited set ofdata.
Finally, a matrix comparing two series of units extracted from two different record-ings can be computed which shows the similarity between two recordings in term ofsong rendition. This type of analysis could enable people to compare quickly two songbouts distant in time or space.
6.2. Large scale automatic treatment of humpback whales’ recordings
This study is a step towards automatic treatment of large scale recordings. Automatictools to transcribe sounds into a string of letters such as the one developed in Dunlopet al. (2007), Glotin et al. (2008), Rickwood and Taylor (2008), Pace et al. (2012), Ouet al. (2013), Razik et al. (2015), Bartcus et al. (2015) or Rekdahl et al. (2018) could beused beforehand. Then our method could be applied to extract, classify and comparesongs and their features along with other approaches to visualize the structures ofhumpback whale’s songs.
Finally, analyzing humpback whale song structures with recurrence plots would bedifficult in the case of a recording where many singers are vocalizing together. In thiscase, the separation of these singers is a challenge that has to be addressed.
Acknowledgement(s)
Data collection for this work was possible thanks to the support from Fundacao OBoticario de Protecao a Natureza / MacArthur Foundation and the Society for Ma-rine Mammalogy (Small-Grants-in-Aid of Research to RSL). We thank the crew ofthe boat Tomara and Instituto Baleia Jubarte (PBJ) for logistic support. ProjetoBaleia Jubarte is sponsored by Petroleo Brasileiro S. A. (Petrobras). We would liketo thank Luana Pini for help in data processing and Leonardo Diniz Soares Eugeniowho computed the raven tables used to transcribe recordings into series of units .We thank the research program BRILAM STIC AmSud 17-STIC-01, EADM GDRSCNRS MADICS and ANR-18-CE40-0014 SMILES. The collaboration between the au-thors has been promoted by the Workshop Listening for Aquatic Mammals in LatinAmerica (LAMLA) sponsored by UFRN, CAPES (AUXPE 541/2016) and the U. S.Office of Naval Research (Award number N62909-16-1-2144).
References
J.A. Allen, A. Murray, M.J. Noad, R.A. Dunlop, and E.C. Garland. Using self-organizingmaps to classify humpback whale song units and quantify their similarity. J. Acoust. Soc.Am, 142(4):1943–1952, 2017.
A. Andriolo, C.C.A. Martins, M.H. Engel, J.L. Pizzorno, S. Mas Rosa, A.C. Freitas, M.E.Morete, and P.G. Kina. The first aerial survey of humpback whales (Megaptera novaean-
13

gliae) to estimate abundance in the breeding ground off brazil (breeding stock a). Journalof Cetacean Research and Management, 8:307–311, 2006.
E. M. Arraut and J.M.E. Vielliard. The song of the brazilian population of humpback whale,Megaptera novaeangliae, in the year 2000 : individual song variations and possible implica-tions. Anais da Academia Brasileira de Ciencias, 76(2), 2004.
M. Bartcus, C. Chamroukhi, and H. Glotin. Hierarchical dirichlet process hidden markovmodel for unsupervised bioacoustic analysis. In Proceedings of the IEEE International JointConference on Neural Networks (IJCNN), Killarney, Ireland, jul 2015.
D.M. Cholewiak, R.S. Sousa-Lima, and S. Cerchio. Humpback whale song hierarchical struc-ture: Historical context and discussion of current classification issues. Marine MammalScience, 29(3):312–332, 2013.
J.D. Darling. Migrations, abundance and behavior of Hawaiian humpback whales. PhD thesis,1983.
J.D. Darling and M. Brub. Interactions of singing humpback whales with other males. MarineMammal Science, (17):570–584, 2001.
J.D. Darling, J.M.V. Acebes, O. Frey, R.J. Urbn, and M. Yamaguchi. Convergence and diver-gence of songs suggests ongoing, but annually variable, mixing of humpback whale popula-tions throughout the north pacific. Scientific reports, 9, 2019.
R. A. Dunlop, M. J. Noad, D. H. Cato, and D. Stokes. The social vocalization repertoire ofeast australian migrating humpback whales (Megaptera novaeangliae). J. Acoust. Soc. Am,122(5):2893–2905, 2007.
J.W. Eaton, D. Bateman, and S. Hauberg. GNU Octave version 3.0.1 manual: a high-levelinteractive language for numerical computations. CreateSpace Independent Publishing Plat-form, 2009. ISBN 1441413006.
J.-P. Eckmann, S. Olifsson Kamphorst, and D. Ruelle. Recurrence plots of dynamical systems.Europhysics letters, 4(91):973–977, 1987.
J. Foote. Visualizing music and audio using self-similarity. MULTIMEDIA ’99 Proceedings ofthe seventh ACM international conference on Multimedia (Part 1), 1999.
J. Foote. Automatic audio segmentation using a measure of audio novelty. Conference: Mul-timedia and Expo, 2000. ICME 2000. 2000 IEEE International Conference onVolume: 1,2000.
P. Frumhoff. Aberrant songs of humpback whales (Megaptera novaeangliae): Clues to the struc-ture of humpback songs. in Communication and Behavior of Whales, 1983. Westview Press,Boulder.
E.C. Garland, M.J. Noad, A.W. Goldizen, M.S. Lilley, M.L. Rekdahl, C. Garrigue, R. Con-stantine, N. Daeschler Hauser, M. Poole, and Jooke Robbins. Quantifying humpback whalesong sequences to understand the dynamics of song exchange at the ocean basin scale. J.Acoust. Soc. Am, 133(1):560–569, 2013.
D.A. Glockner. Determining the sex of humpback whales (Megaptera novaeangliae) in theirnatural environment. in R. Payne, ed. Communication and behavior of whales, 1983. AAASSelected Symposium 76. Westview Press, Boulder, CO. pages 447-464.
H. Glotin, L. Gauthier, F. Pace, F. Benard, and O. Adam. New automatic classification forhumpback whale songs, page 93. In P. university, ONR (Eds.), 2008.
S.R. Green, E. Mercado III, A.A. Pack, and L.M. Herman. Recurring patterns in the songs ofhumpback whales (Megaptera novaeangliae). Behavioural Processes, 86:284–294, 2011.
T. Hee-Wai, J.S. Allen, J. Gebbie, and M. Siderius. Nonlinear time series analysis of snappingshrimp sounds. J. Acoust. Soc. Am., 134:41–47, 2013.
V. M. Janik. Pitfalls in the categorization of behaviour: a comparison of dolphin whistleclassification methods. Anim. Behav, 57:133–143, 1999.
A. Kershenbaum, A.E. Bowles, T.M. Freeberg, D.Z. Jin, A.R. Lameira, and K. Bohn. Animalvocal sequences: not the markov chains we thought they were. Proc. R. Soc. B, 281, 2014.
V. I. Levenshtein. Binary codes capable of correcting deletions, insertions, and reversals.Doklady Akademii Nauk SSSR, 163(4):845–848, 1965.
C.C.A Martins, M.E. Morete, M.H. Engel, A.C. Freitas, E.R Secchi, and P.G.Kinas. Aspects
14

of habitat use patterns of humpback whales in the abrolhos bank, brazil, breeding ground.Memoirs of the Queensland Museum, 47:563–570, 2001.
N. Marwan, M. Carmenromano, M. Thiels, and J. Kurths. Recurrence plots for the analysisof complex systems. Physics Reports, 438(5-6):237–329, 2007.
E. Mercado-III, L.M. Herman, and A.A. Pack. Stereotypical sound patterns in humpbackwhale songs : Usage and function. Aquatic Mammals, 29(1):37–52, 2003.
R. Miralles, A. Carrin, D. Looney, G.Lara, and D.Mandic. Characterization of the complexityin short oscillating time series: An application to seismic airgun detonations. The Journalof the Acoustical Society of America, 138(3):1595–1603, 2015.
H. Ou, W. W. L. Au, L. M. Zurk, and M. O. Lammers. Automated extraction and classificationof time-frequency contours in humpback vocalizations. J. Acoust. Soc. Am., 133(1), 2013.
F. Pace, F. Benard, H. Glotin, O. Adam, and P. White. Subunit definition and analysis forhumpback whale classification. Journal of Applied Acoustics, 7.1, 2010.
F. Pace, P.R. White, and O. Adam. Hidden markov modeling for humpback whale (Megapteranovaeangliae) call classification. In Societe Francaise d’Acoustique, Proceedings of the Acous-tics 2012 Nantes Conference, pages 2439–2444, 23-27 april 2012.
J. Paulus, M. Muller, and A. Klapuri. Audio-based music structure analysis. 11th InternationalSociety for Music Information Retrieval Conference (ISMIR 2010), 2010.
K. Payne, Tyack P., and Payne R. Progressive changes in the songs of humpback whales(Megaptera novaeangliae): A detailed analysis of two seasons in Hawaii, pages 9–58. inCommunication and Behavior of Whales, 1983.
R. S. Payne and S. McVay. Songs of humpback whales. Science, 173:585–597, 1971.H. Pines. Mapping the phonetic structure of humpback whale song units: extraction, classifi-
cation, and shannon-zipf confirmation of sixty sub-units. Proc. Mtgs. Acoust., 35, 2018.Bioacoustics Research Program. Raven pro: Interactive sound analysis software (ver-
sion 1.5). Ithaca, NY: The Cornell Lab of Ornithology, 2014. Available fromhttp://www.birds.cornell.edu/raven.
A. Ravignani and P. Norton. Measuring rhythmic complexity: A primer to quantify andcompare temporal structure in speech, movement, and animal vocalizations. Journal ofLanguage Evolution, pages 4–19, 2017.
J. Razik, H. Glotin, M. Hoeberechts, Y. Doh, and S. Paris. Sparse coding for efficient bioacous-tic data mining: Preliminary application to analysis of whale songs. In IEEE InternationalConference on Data Mining (IEEE ICDM) workshop Env. Acoustic Data Mining Forum,page 7, Atlantic City, NJ, USA, nov 2015.
M.L. Rekdahl, E.C. Garland, G.A Carvajal, C.D. King, T. Collins, and Y. Razafindrakoto.Culturally transmitted song exchange between humpback whales (Megaptera novaeangliae)in the southeast atlantic and southwest indian ocean basins. R. Soc. open sci, 5, 2018.
P. Rickwood and A. Taylor. Methods for automatically analyzing humpback song units. J.Acoust. Soc. Am., 123(3), 2008.
W. E. Schevill and W. A. Watkins. Whale and porpoises voices: A phonograph record. 1962.Contribution Number 1320, Woods Hole Oceanographic Institution.
J.N. Schneider and E. Mercado-III. Characterizing the rhythm and tempo of sound productionby singing whales. Bioacoustics, 2018.
O. W. Schreiber. Some sounds from marine life in the hawaiian area. J. Acoust. Soc. Am., 24(116), 1952.
R.A. Wagner and M.J. Fischer. The string-to-string correction problem. Journal of the Aso-ciation for Computing Machinery, 21(I):168–173, January 1974.
J.P. Zbilut, M. Koebbe, H. Loeband, and G. Mayer-Kress. Use of recurrence plots in theanalysis of heart beat intervals. Proceedings Computers in Cardiology, 1990.
15