Embed Size (px)
Citation preview

Use of Past Typhoon Data for Landslide Modeling and Mapping
Karl ChangAdjunct Professor of Geography
National Taiwan University

Landslides occur when unstable rock and soil masses on slopes are disturbed by intense storms, earthquakes, human activities (e.g., road construction), or a combination of these factors.
Many shallow landslides (within a depth of 2 or 3 m) in Taiwan are triggered by typhoons during the summer months. Each typhoon produces a different rainfall distribution, depending on its track and position and atmospheric conditions, and makes it difficult to predict the location and size of landslides it triggers.
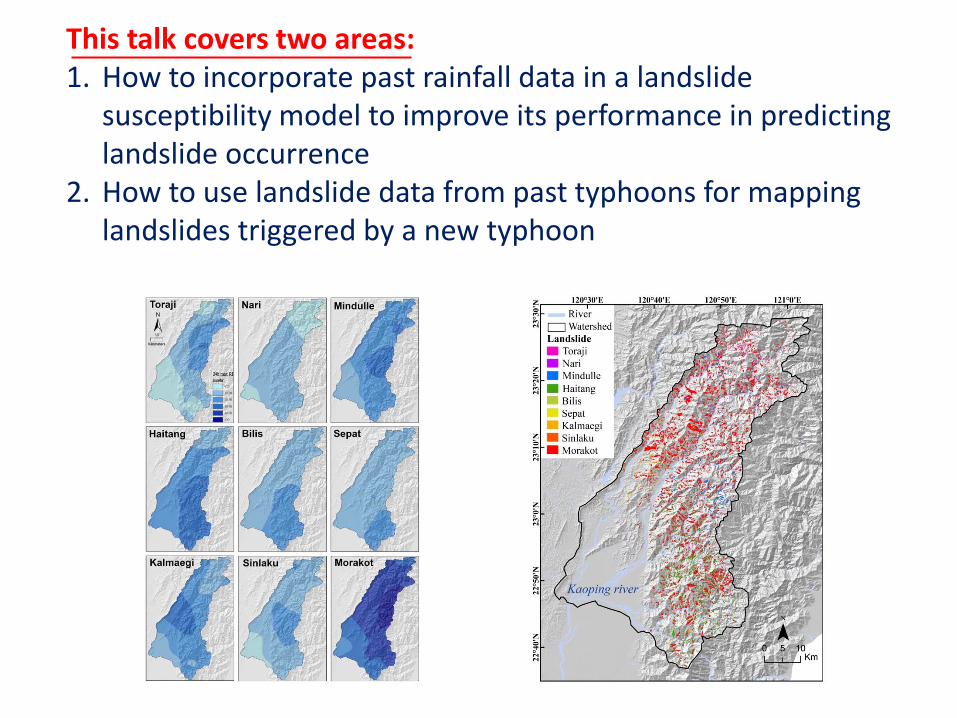
This talk covers two areas:1. How to incorporate past rainfall data in a landslide
susceptibility model to improve its performance in predicting landslide occurrence
2. How to use landslide data from past typhoons for mapping landslides triggered by a new typhoon

Landslide Modeling
Can the addition of typhoon rainfall data improve the performance of a landslide susceptibility model in its prediction?
Can we combine the information on past typhoon events for predicting landslides triggered by a new typhoon?
K. Chang, S. Chiang, Y. Chen, and A.C. Mondini. 2014. Modeling the spatial occurrence of shallow landslides triggered by typhoons. Geomorphology 208: 137-148.
K.W.: KaopingWatershed

The integrated model:
where y is the dependent variable representing the presence or absence of a landslide; a is a constant; bi is the i-th regression coefficient; x1 is the difference between the estimated maximum 24-h rainfall intensity and the critical rainfall* value (RID) at a location; and x2 is the estimated rainfall duration at the location.
)exp(1
)exp(
2211
2211
xbxba
xbxbap
xb xb a (y) logit 2211
K. Chang and S. Chiang. 2009. An integrated model for predicting rainfall-induced landslides. Geomorphology 105: 366-373.

Typhoon event
DateCWB Typhoon track category
Min.cumul. rainfall
Max.cumul. rainfall
Ave.cumul. rainfall
Toraji 2001(7/28 – 7/31) 3 15 749 304
Nari 2001(9/13 – 9/19) unclassifed 9 516 309
Mindulle 2004(6/28 – 7/03) 6 399 2115 1004
Haitang 2005(7/16 – 7/20) 3 542 2184 1221
Bilis 2006(7/12 – 7/15) 2 319 963 607
Sepat 2007(8/16 – 8/19) 3 198 1133 691
Kalmaegi 2008(7/16 – 7/18) 2 343 900 568
Sinlaku 2008(9/11 – 9/16) 2 138 1006 513
Morakot 2009(8/05 – 8/10) 3 770 2959 1803
Minimum, maximum, and average cumulative rainfall at 24 gauging stations by typhoon in the Kaoping watershed

The integrated models for the nine typhoon events are all significant at the 0.05 level. The area under the curve (AUC) values range from 0.68 to 0.85, with an average of 0.77. These AUC values represent good to excellent predictive capabilities of the models.

To test the possibility of using the past typhoon data for prediction, we experimented with “catch-all” and “group” models. A catch-all model uses information on all available typhoons, and a group model uses information on a group of typhoons with similar rainfall characteristics. We applied the cross-validation technique to test the predictability of the models.

Validated Typhoon AUC Overallaccuracy
MSR Proportion of landslide areas (numbers) correctly
predicted, in %Catch-all model
Toraji 0.73 0.81 0.60 28 (40)Nari 0.73 ~1.0 0.50 ~0 (~0)Mindulle 0.73 0.97 0.61 10 (25)Haitang 0.69 0.84 0.80 63 (75)Bilis 0.73 0.97 0.53 3 (8)Sepat 0.73 0.99 0.59 10 (18)Kalmaegi 0.73 0.55 0.70 77 (85)Sinlaku 0.73 ~1.0 0.50 ~0 (~0)Morakot 0.77 0.52 0.72 79 (94)
Group 1 ModelMindulle 0.74 0.99 0.55 2 (10)Haitang 0.71 0.98 0.58 11 (17)Morakot 0.84 0.45 0.70 85 (96)
Group 2 Model
Bilis 0.80 0.86 0.64 23 (42)
Sepat 0.76 0.60 0.77 79 (94)
Kalmaegi 0.71 0.59 0.71 76 (82)
Sinlaku 0.76 0.73 0.73 22 (74)
Cross-validation results of the catch-all model and group models

Landslide Modeling: Summary
The integrated method provides a mechanism by which a catch-all or group model can be developed from information on past typhoon events to predict landslides triggered by a new typhoon.
For future applications of the integrated method, we need to have good-quality rainfall and geoenvironmental data; and a large, representative landslide inventory.

Landslide Mapping
Landslide can be treated as a land cover type, and landslides can be mapped by using semi-automatic or automatic image analysis. One of the mainstays of quantitative image analysis since the 1970s is the pixel-based, single image, supervised Maximum Likelihood (ML) classification.
ML requires training samples, and their preparation is highly demanding on both resources and time and can also introduce subjectivity.

A New Landslide Mapping Method
Our study proposes to use an independent set of training samples in image analysis, which is pre-prepared from images on previous landslide events.
If this approach turns out to be reliable, the training samples can be saved in a digital library and used routinely to obtain a new landslide map once a new image is available on the landslide affected area.
To demonstrate its feasibility, we have applied the method to mapping shallow landslides triggered by typhoons in southern Taiwan.
To test its performance, we compare the classified landslide maps with landslide maps prepared through manual interpretation of the same test images.
Mondini, A. C. 2016. Monte Carlo approach to simulate spectral fingerprints for automatic event landslides mapping. Submitted

Our method includes three major steps:
1. Create the spectral fingerprints from one or more past images with the presence of fresh landslides that have been pre-processed (i.e., geometric and radiometric corrections).

2. Calculate the class membership probability P(LP)*, as well as its uncertainty (% relative error)*, of the landslide class using the spectral fingerprints and random numbers (a Monte Carlo method).
𝑝 𝒙 𝑤𝑖 = (2𝜋)−𝑁/2|Σ𝑖|
−1/2𝑒𝑥𝑝 −1
2(𝒙 − 𝝁𝑖)
𝑡Σ𝑖−1 𝒙 − 𝝁𝑖
𝛿𝑝 𝑤𝑖 𝒙 =1
1𝑀 𝑝 𝒙 𝑤𝑖
−𝑝 𝒙 𝑤𝑖 1𝑀 𝑝 𝒙 𝑤𝑖
2𝛿𝑝 𝒙 𝑤𝑖
2
+ 𝑘
𝑝 𝒙 𝑤𝑖 1𝑀 𝑝 𝒙 𝑤𝑖
2𝛿𝑝 𝒙 𝑤𝑛
2

3. Introduce external geo-environmental variables through a landslide susceptibility model as a filter, P(LO), to obtain the final landslide probability map P(L). P(L)= P(LP) x P(LO).


Acquisition
time
Incidence angle Coordinate
system
Formosat 2-1 2005/08/01
01:52:49
6.77 TWD97
Formosat 2-2 2009/08/24
01:42:55
3.885 UTM-WGS84
Formosat 2-3 2009/08/19
01:42:34
6.57 UTM-WGS84
Formosat 2-4 2009/08/17
01:42:36
5.68 UTM-WGS84
Image 1 is pre-Morakot (August 2009), whereas images 2, 3, and 4 are post-Morakot. Spectral fingerprints are prepared from images 3 and 4. Images 1 and 2 are used for comparison between classified and manually prepared landslide maps.

Image 1
Classified landslide map
Manually prepared landslide map

Image 2
Classified landslide map
Manually prepared landslide map

PI1 Vs SA1 PI2 Vs SA2
%
Commission
%
Omission
Kappa
Coeff.
%
Commission
%
Omission
Kappa
Coeff.
Non-
landslide
0.154 0.341 0.78 3.72 3.57 0.615
Landslide 38.0 21.6 0.62 33.81 34.76 0.625
Landslide Mapping: Summary
The results from the case studies show that the new landslide mapping method performed well in mapping landslides triggered by two different typhoons in the same area using FORMOSAT 2 images, and it is possible to apply the method to other areas with similar characteristics and using other sensors.
Conclusion
Past typhoon data, including rainfall and landslides, are useful for landslide susceptibility modeling and landslide mapping. It is therefore important to create and maintain a database on past typhoon data.