Embed Size (px)
Citation preview

Use of Multi-Criterial Involvement Processes (MIP) Oct 2010
1
Use of Multi-Criterial Involvement Processes (MIP) to Enhance Transparency and 1 Stakeholder Participation at Bergen Harbour, Norway 2 † ‡ Magnus Sparrevik, § David N. Barton, †Amy Oen, ║Nagothu Udaya Sehkar and #Igor 3
Linkov 4
†*Norwegian Geotechnical Institute, PO Box 3930 Ullevål Stadion, NO-0806 Oslo, Norway, 5
‡ Department of Industrial Economics and Technology Management. Norwegian University 7
of Technology, 7491 Trondheim, Norway 8
§ Norwegian Institute for Nature Research, Gaustadalléen 21, NO-0349 Oslo, Norway 9
# Bioforsk Norwegian Institute for Agricultural and Environmental Research Fr. A. Dahlsvei 10
20, N-1432 Ås Norway 11
║ U.S. Army Engineer Research and Development Center, 696 Virginia Rd, Concord, MA 12
01742, United States. 13
14
15
Use of Multi-Criterial Involvement Processes (MIP) Oct 2010
2
ABSTRACT 1
Use of participatory stakeholder engagement processes could be important to reduce the risk 2
of potential conflicts in managing contaminated sites. Most stakeholder engagement tech-3
niques are qualitative in nature and require experienced facilitators. This study proposes a 4
multi-criterial involvement process (MIP) to enhance transparency and stakeholder participa-5
tion and applies it to a contaminated sediment management case study for Bergen Harbor, 6
Norway. The suggested MIP builds on the quantitative principles of MCDA, and also incor-7
porates group interaction and learning through qualitative participatory methods. Three dif-8
ferent advisory groups consisting of local residents, local stakeholders and non-resident sedi-9
ment experts were invited to participate in a stakeholder engagement process to provide con-10
sensual comparative advice on sediment remediation alternatives. For stakeholders or resi-11
dents to be able to embrace a complex decision such as selection of remediation alternatives, 12
the involvement process with lateral learning, combined with MCDA giving structure, ro-13
bustness and transparent documentation was preferable. Additionally, MIP results in consis-14
tent ranking of remediation alternatives across residents, stakeholder and experts, relative to 15
individual intuitive ranking without MIP. 16
17
KEYWORDS: Stakeholder involvement, contaminated sediment management, multi-criteria 18
decision analysis, citizens’ jury 19
20
21
Use of Multi-Criterial Involvement Processes (MIP) Oct 2010
3
INTRODUCTION 1
Emerging environmental challenges coupled with increased stakeholder awareness 2
and concerns call for more effective stakeholder involvement processes for environmental 3
management. A structured stakeholder involvement process could help in overcoming disa-4
greements and result in better management alternatives (Slob et al., 2008). Examples of qua-5
litative involvement processes include focus groups with facilitated communication between 6
parties to reach consensus (Kitzinger, 1995). Co-operative discourse methods are also de-7
scribed by Renn (1999) involving establishment of development criteria and alternatives us-8
ing value trees elicited by stakeholders and experts in round table meetings. Group Delphi is 9
another systematic, interactive forecasting method which relies on a panel reaching consensus 10
through sequential use of questionnaire and intermittent discussions. 11
Multi-criteria decision analysis (MCDA) has been proposed as a method to enhance 12
stakeholder involvement in sediment management and to facilitate decision making of com-13
plex problems (Kim et al., 2010; Linkov et al., 2005; Yatsalo et al., 2007). The purpose of 14
MCDA in these studies has been to support evaluation and selection among management al-15
ternatives in an interactive process involving, decision makers, stakeholders, scientists. Me-16
thodologically, MCDA requires developing hierarchy of criteria and metrics to compare man-17
agement alternatives and subsequent elicitation of weights to quantify relative importance of 18
criteria as well as scoring of alternative performance based on these criteria. The MCDA ap-19
proach overcomes the limitations of unstructured individual and group decision-making by 20
providing decision transparency and focusing discussion on assessing the weights and scores. 21
Thus MCDA may be valuable in quantitative decision making; however, focus on participato-22
ry aspects in the involvement processes for sediment management is also warranted 23
(Sparrevik et al., 2010). 24
Use of Multi-Criterial Involvement Processes (MIP) Oct 2010
4
In order to enhance the value of participatory stakeholder involvement in environmen-1
tal management we propose a multi-criterial involvement process (MIP) which builds on the 2
quantitative principles of MCDA, and also incorporates group interaction and learning 3
through qualitative participatory methods. The process bears resemblance to earlier proposed 4
MCDA processes for sediment management (Alvarez-Guerra et al., 2010; Oen et al., 2010; 5
Kiker et al., 2005; Hong et al., 2010). However, this process also addresses recruitment and 6
includes an involvement and learning step inspired by deliberative decision making using 7
citizens juries (Soma, 2010; Smith & Wales, 2000). The application of the MIP is illustrated 8
using sediment remediation alternatives for Bergen harbour in Norway as well as conducting 9
the MCDA for three different advisory groups including local residents, local stakeholder and 10
non-resident sediment experts. A comparison of individual versus group consensus-based 11
ranking of alternatives is also presented. 12
THE MULTI-CRITERIAL INVOLVMENT PROCESS (MIP) 13
Stakeholder Involvement in Contaminated Site Management 14
A project execution process for managing contaminated sediments typically proceeds 15
through specific project phases involving different actors in the process, Figure 1. Problem 16
owners are usually active in the problem formulation and the approval phase where the se-17
lected concept is being approved by regulatory authorities (Oen et al., 2010). Consultants are 18
normally active in the concept evaluation phase collecting lines of evidence and evaluating 19
different concepts of remedial solution based on these data (Sparrevik & Breedveld, 2010). 20
This often also includes preparing permit applications or environmental impact assessments 21
(EIA). A simplified linear process is illustrated in Figure 1; however, in reality the process 22
may be highly iterative with several decision processes conducted in parallel. 23

Use of Multi-Criterial Involvement Processes (MIP) Oct 2010
5
Stakeholders, here defined as people, organisations or groups who are affected by the 1
issue and who have the power to make, support or oppose the decision (Susskind et al., 1999) 2
tend normally to be involved late in the process, often prior to the decision making as a part of 3
formal hearings. Individuals in their capacity as concerned residents are often not at all in-4
volved in the formal decision process insofar as they are not directly affected by project im-5
pacts and therefore not active in the formal hearings. The proposed remedial solution circu-6
lated for hearing is often designed based on technical feasibility, budget, time and political 7
perspective. The manoeuvring space for changes at this stage of a project is often limited, 8
which may cause problem owners to defend the solution instead of allowing a constructive 9
stakeholder dialogue (Kasperson & Kasperson, 2005). This unfortunate situation may lead to 10
significant opposition that could lead to increased costs and delays in the execution phase of 11
contaminated site remediation projects (Sparrevik et al., 2010). 12
Description of the MIP Methodology 13
The MIP methodology as shown in Figure 2 uses multi-criteria decision analysis and consen-14
sus-based deliberation to structure the involvement process; 15
Objectives and alternatives 16
The 1st step of the process includes formulation of the project objectives, selection of alterna-17
tives and study recruitment methods. The problem owner responsible for the decision is pre-18
sumed to be highly active in this phase. The 2nd step consists of recruitment of the advisory 19
group. Depending on the project objectives defined in previous step, inhabitants representing 20
public interests or stakeholders representing specific business interests may be recruited. The 21
method used to recruit participants is important with regards to representation of different 22
standing/values in relation to the project impacts. The project team (including researchers or 23
consultants) is recommended to be responsible for this step. 24

Use of Multi-Criterial Involvement Processes (MIP) Oct 2010
6
Criteria metrics 1
The 3rd step consists of identification of criteria. The project team is assumed to be heavily 2
involved in this step, possibly in cooperation with the problem owner. In the 4th step, im-3
pacts/scores for each criterion are assessed (based on available technical information and ex-4
pert judgment). We recommend that the project team carry out this task, since it requires de-5
tailed technical knowledge about the alternative performances for selected criteria. 6
Measuring performance 7
The intention of the 5th step is to allow the advisory group to discuss the analysis with the 8
project team and invite experts with specialized expertise to clarify questions. The advisory 9
group should also evaluate and alter the criteria earlier proposed if necessary. The 6th step 10
includes criteria weighting. 11
Information synthesis 12
In the 7th step data are processed by the project team and results are presented to the advisory 13
group. In the 8th and last step, the advice from the project is presented to the problem owner. 14
MIP APPLICATION TO THE BERGEN HARBOUR SEDIMENT REMEDIATION 15
STUDY 16
Objectives, Alternatives and Methods 17
Bergen harbour study objectives 18
The harbor area of Bergen is contaminated due to previous industrial activities such as 19
naval shipyards and manufacturing industries, earlier releases of municipal sewerage and ur-20
ban run-off from diffuse sources. One of the major contributors to harbor contamination is 21
polychlorinated biphenyls (PCBs), originating from paint on house facades (Jartun et al., 22
2008). The area is 1 of 17 fjords in Norway prioritized for remedial actions by the Norwegian 23

Use of Multi-Criterial Involvement Processes (MIP) Oct 2010
7
Government (MD, 2006; MD, 2002). The area also has a dietary advisory for fish consump-1
tion based on PCB and mercury concentrations in fish. The work with contaminated sediment 2
management has been progressing for several years focusing on site investigations, risk as-3
sessments and preparations of management plans. At present, complementary archeological 4
investigations, as well as plans for field trial experiments to assess remediation methods are 5
being executed. The objectives with the MIP in this case was to provide valuable advice to the 6
problem owner on how advisory groups perceive hypothetical remediation alternatives distill-7
ed from the recommendations laid out in the management plans. 8
Remediation alternatives 9
Five alternatives for remediation of the contaminated sediments in Bergen harbor were 10
suggested on as an outcome from the discussions with the problem owner. Alternative 1 con-11
stitutes natural recovery. The sources of contamination in Bergen have significantly decreased 12
due to reduced industrial activity, better emission control and waste water treatment. It is es-13
timated that background values for contaminant fluxes to the water from the sediments will be 14
reached within a time span of 50 years due to natural deposition of clean sediments on top of 15
the contaminated sediments (FM, 2005). Alternative 2 consists of an active reduction of the 16
contaminant flux by capping a 1.5 km2 area in the inner fjord basin with a 30 cm layer of 17
clean material, as indicated in Figure 3. Capping has proven to be efficient to reduce contami-18
nant transport from contaminated sites (Eek et al., 2008) but since it reduces sailing depth, it 19
may have practical limitations (Palermo, 1998). A combined alternative was therefore formu-20
lated consisting of capping the majority of the area, combining with dredging areas with the 21
highest concentration of PCB (hot-spot areas) and areas where sailing depth could be an issue, 22
Figure 3. This alternative was then divided into 3 sub-alternatives based on the handling of 23
the dredged material. In alternative 3, near shore disposal facilities were assumed to be con-24
structed with the possibility to reclaim land for property development, whereas alternative 4 25
Use of Multi-Criterial Involvement Processes (MIP) Oct 2010
8
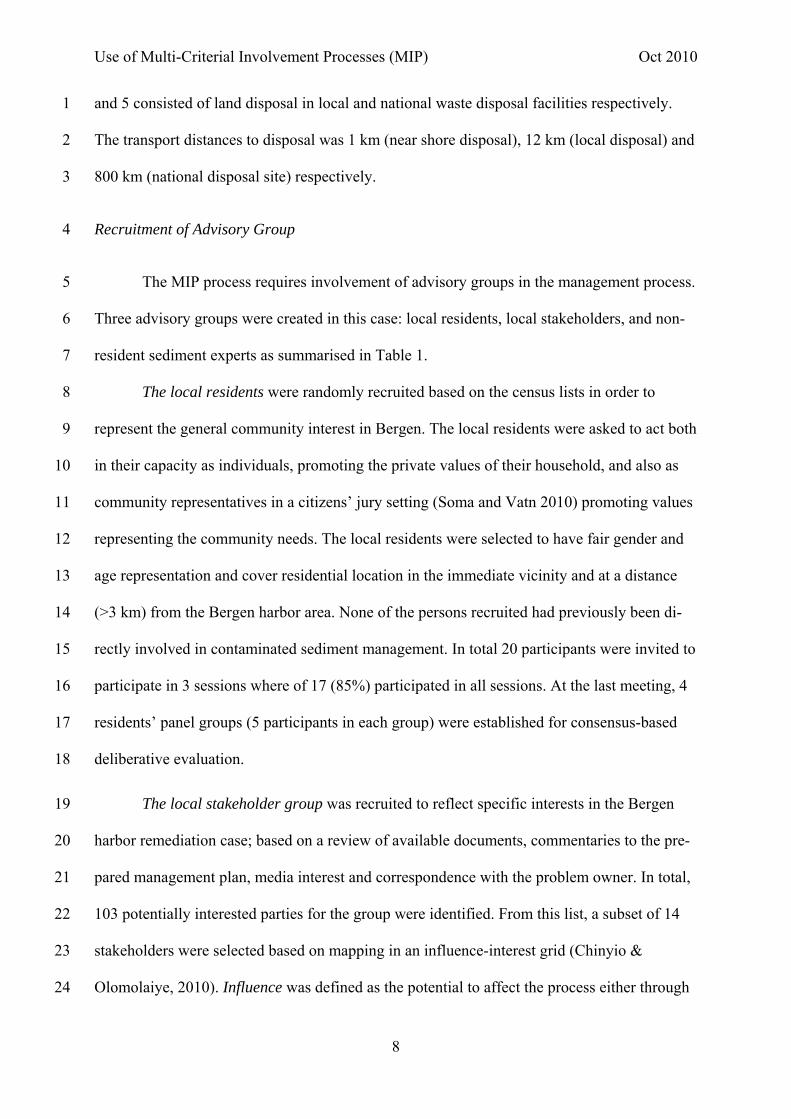
and 5 consisted of land disposal in local and national waste disposal facilities respectively. 1
The transport distances to disposal was 1 km (near shore disposal), 12 km (local disposal) and 2
800 km (national disposal site) respectively. 3
Recruitment of Advisory Group 4
The MIP process requires involvement of advisory groups in the management process. 5
Three advisory groups were created in this case: local residents, local stakeholders, and non-6
resident sediment experts as summarised in Table 1. 7
The local residents were randomly recruited based on the census lists in order to 8
represent the general community interest in Bergen. The local residents were asked to act both 9
in their capacity as individuals, promoting the private values of their household, and also as 10
community representatives in a citizens’ jury setting (Soma and Vatn 2010) promoting values 11
representing the community needs. The local residents were selected to have fair gender and 12
age representation and cover residential location in the immediate vicinity and at a distance 13
(>3 km) from the Bergen harbor area. None of the persons recruited had previously been di-14
rectly involved in contaminated sediment management. In total 20 participants were invited to 15
participate in 3 sessions where of 17 (85%) participated in all sessions. At the last meeting, 4 16
residents’ panel groups (5 participants in each group) were established for consensus-based 17
deliberative evaluation. 18
The local stakeholder group was recruited to reflect specific interests in the Bergen 19
harbor remediation case; based on a review of available documents, commentaries to the pre-20
pared management plan, media interest and correspondence with the problem owner. In total, 21
103 potentially interested parties for the group were identified. From this list, a subset of 14 22
stakeholders were selected based on mapping in an influence-interest grid (Chinyio & 23
Olomolaiye, 2010). Influence was defined as the potential to affect the process either through 24

Use of Multi-Criterial Involvement Processes (MIP) Oct 2010
9
formal legislative rights or by informal mobilisation through media and financial instruments. 1
Interest was defined as the potential level of benefits or losses the stakeholder could experi-2
ence from the process. Like influence, interest was categorized into formal interests such as 3
regulatory issues and informal interests such as gain or loss of image and popularity. Discus-4
sions with 2 of the selected stakeholders and the problem owner were conducted, and as a 5
result from these discussions the list was expanded from 14 to 23. These individuals were 6
invited to participate in advisory meetings, but also to potentially function as an advisory 7
group in forthcoming project stages in Bergen harbour. 16 people out of the 23 agreed to par-8
ticipate in a stakeholder group and 11 people (48%) participated in the advisory meetings. 9
The non-resident sediment experts were scientists / consultants and regulators working 10
with contaminated sediments on a daily basis. The experts were recruited from the Oslo area 11
without particular connections to Bergen. One session with 4 participants was organised with 12
non-project researchers from one of the participating institutes in the study; a separate session 13
with 8 participants (19 invited) was conducted using web based recruitment specifically tar-14
geting consultants, researchers and regulators working with contaminated sediments in the 15
Oslo region. 16
Selecting Weighing Method and Identification of Criteria 17
Evaluation of different MCDA weighing methods for use in sediment management 18
has been investigated earlier and all methods have strengths and weaknesses. The selection of 19
appropriate methods will then be a choice between the accuracy of the utility or value based 20
methods, the user friendliness of the AHP method or the simplicity of the outranking methods 21
(Linkov et al., 2007). The use of MCDA with an advisory group early in the project process 22
places the onus on finding methods that are simple and user friendly. Later stages of using 23
MCDA for decision making should emphasis consistency and robustness as well. The AHP 24
method (Saaty, 1987), was selected for this study based on its advantages in scoring and user 25

Use of Multi-Criterial Involvement Processes (MIP) Oct 2010
10
friendliness. AHP completely aggregates the decision problem into a single objective function 1
and uses a compensatory optimization approach. AHP uses a quantitative comparison method 2
that is based on pair-wise comparisons of decision criteria, rather than utility and weighting 3
functions. 4
The pair-wise comparison may be performed on different levels in a decision tree al-5
lowing people to compare criteria in pairs avoiding cognitively more challenging multiple 6
simultaneous comparisons. In this study a hierarchical decision tree was used, organizing cri-7
teria in 3 levels reflecting the different pillars of sustainable development; environmental, 8
societal and economical aspects (UN, 1987). Under each criterion, sub-criteria were added. 9
The advisory groups were able to discuss and comment on the criteria, but only a limited 10
number of alterations were performed in order to assure consistency between the groups. 11
Assessing Criteria Weights 12
Criteria weights to each criterion were set based on the EIA as presented in the man-13
agement plan for the harbor (FM, 2005) and consultations with sediment experts. The criteria 14
and the criteria weights are provided in Table 2 and are briefly described below; 15
Environmental criteria 16
The environmental risk was expressed as reduction in flux of PCB from the contami-17
nated sediments, compared to today’s baseline scenario. It was assumed that both capping and 18
dredging will be very efficient in reducing the flux of contaminants from the sediments. The 19
effect of dredging is slightly lower due to re-sedimentation of dredged material on top of the 20
dredged seabed after the operation (FM, 2005). 21
The reduction in human health was assessed based on 10% exceedance of the maxi-22
mum tolerable risk (MTR) (Baars, 2001), compared to the percent exceedance calculated for 23
the current situation. The calculation of MTR is mainly based on consumption of fish which is 24

Use of Multi-Criterial Involvement Processes (MIP) Oct 2010
11
exposed to contaminated sediments and to some degree from direct exposure to water and 1
sediment during bathing. The calculation is based on a fish consumption of 15 meals pr month 2
from the contaminated area, which is conservative, since no participants indicated that they 3
had consumed fish from the harbor area during the past year. 4
Greenhouse gas house emissions were calculated based on the vessel transport dis-5
tances from shore to capping area for alternatives 2-5, also including the distances from the 6
dredging area to shore and lorry transport to disposal sites for alternatives 3-5. Emission data 7
from Statistics Norway (www.ssb.no) was used for the calculations. In order to illustrate the 8
magnitude of emission values to the advisory group participants, the figures were normalized 9
against emissions from the estimated yearly emission from a private car (1530 kg CO2-eq, 10
www.naturvern.no). 11
Societal criteria 12
The construction impact was assessed as an ordinal number proportional to the surface 13
area impacted during remediation. It was also assumed that capping would be both faster and 14
cause less need to reorganize maritime activities in the area than dredging. 15
The disposal location was also addressed as an ordinal number where a local solution 16
was considered more favorable than using a national disposal site. This is based on an as-17
sumption that sediment storage is best handled by local solutions (Breedveld, 2007). The cri-18
teria was also used to investigate whether disposal solutions close to residential areas were 19
disfavoured (NIMBY-effects) (Dyer & Sarin, 1982). 20
The wharf area, Bryggen, is defined as a world heritage site on the UNESCO list 21
(whc.unesco.org) and thus was an important aspect to be addressed in the MCDA. It was as-22
sumed that all marine operations will negatively affect the preservation of marine cultural 23
heritage for the future, with dredging resulting in more negative impact than capping. 24

Use of Multi-Criterial Involvement Processes (MIP) Oct 2010
12
The possibility of land reclamation is only relevant for the dredging and near seashore 1
alternative where it was assumed that construction of a confined disposal will establish land 2
for property development. The area of reclaimed land was used as the criteria weight. 3
Economic criteria 4
Economic criteria were developed to observe how the distribution of cost, local (mu-5
nicipal financing) and national (governmental financing) were evaluated by the advisory 6
groups. It was assumed that government would finance 25% of the cost for all alternatives and 7
the remaining costs would be shared by local enterprises and the municipality. It was further 8
assumed that enterprises would partially finance the dredging operation, since they would 9
benefit from port development. Initially, private household financing through municipal taxa-10
tion was addressed in the MCDA. However this criterion turned out to be problematic for the 11
non-resident expert group and was not used for data evaluation. 12
Involvement and Learning 13
Three meetings were conducted with the residents and the stakeholders, whereas non-14
resident experts were invited to 1 session only. The involvement and learning step began in 15
the 1st meeting and included familiarization, general discussions about the study and contami-16
nated sediments and distribution of written material including description of the MCDA me-17
thod, remediation alternatives and how the consequence criteria weights were estimated. The 18
non-resident expert group received this information by e-mail. The content of the documents 19
was explained in the 2nd meeting (1st meeting for experts) and sufficient time was allowed for 20
questions and comments. Based on the presented material and their interest, the residents and 21
stakeholder groups themselves requested expert witnesses to clarify and address specific top-22
ics related to the issue. The intention was to introduce a deliberative discussion valuable to 23
Use of Multi-Criterial Involvement Processes (MIP) Oct 2010
13
both the advisory groups and the expert witnesses (Renn, 2006) using an approach base on 1
citizens’ jury methodology (Soma and Vatn 2010). 2
Weighing of criteria 3
Participants were asked to score the consequence criteria weights using questionnaires 4
and were asked to weigh the criteria and adjacent sub criteria in pairs. The scoring was per-5
formed in the meeting for the resident and stakeholder groups, whereas the experts were 6
asked to perform a preliminary scoring via e-mail before the meeting. Based on earlier expe-7
rience (Soma, 2010), the original 9 value scale (Saaty, 1987) was replaced with a less com-8
prehensive scale. We used in total 3 values guided by the text “strong weight” to emphasize 9
high relative importance of the criteria and “neutral weight” to emphasize equal weighing. For 10
participants not answering the question or marking all alternatives, the neutral score was used 11
in the data presentation step. In this study participants were also asked to perform an intuitive 12
ranking of the alternatives directly. 13
Data Presentation and Discussion 14
The software DEFINITE (Janssen R & Herwijnen MV., 2007) was used to process the 15
data. For the residents, the results of the MCDA based on individual weighting of criteria 16
were presented and discussed in the group as a whole, before they were divided into residents’ 17
panels. Results of individual versus residents’ panel based weighting were then compared and 18
discussed. The stakeholders performed their scoring in the last meeting and thus were not pre-19
sented to the group in the meeting, due to lack of time. The experts where presented prelimi-20
nary results from the scoring performed before the meeting, but they were allowed to change 21
the scoring based on information given in the meeting. In all cases, the final weighting results 22
were used for ranking the results presented in this study. 23
24

Use of Multi-Criterial Involvement Processes (MIP) Oct 2010
14
Evaluation of advice 1
Representatives from the residents’ panels were invited to present their recommenda-2
tions to the problem owner in a separate meeting. During the stakeholder meetings, the prob-3
lem owner was actually present. This local stakeholder group is continuing to follow the 4
process in Bergen with regular meetings, allowing them to contribute to on-going discussions 5
about sediment remediation in the harbor. 6
RESULTS AND DISCUSSION 7
Results from the MCDA 8
The descriptive statistics for the groups show only significant variance between the 9
groups with respect to years of residence in Bergen, Table 1. This was intentional since this 10
group was recruited from persons not living in the Bergen area. The stakeholder group had 11
mostly male participants, whereas the households/residents group was recruited to achieve a 12
balanced male/female representation. It is especially interesting to observe that the differences 13
in initial risk perceptive values relating to contaminated sediments are not significantly differ-14
ent between the groups. Since experiential beliefs also may influence the analytical outcome 15
of a decision (Slovic et al., 2004) sharing the same initial beliefs about the subject may facili-16
tate unbiased advice. 17
Table 3 shows the results from the scoring of sediment remediation alternatives. The 18
results have first been calculated individually for each participant and subsequently integrated 19
to mean values for each advisory group as illustrated in the table. A grand mean has also been 20
calculated summarizing results from all groups. In addition, the results from a hypothetical 21
scenario with equal score on all weights are presented to illustrate the influence of weighing 22
on the results. Table 3 illustrates that the MCDA results center on alternatives 2 and 3. A t-23
test shows that the difference between alternative 1 (t=-17.3; df=3; p<0.05), 4 (t=-5.5; df=3; 24

Use of Multi-Criterial Involvement Processes (MIP) Oct 2010
15
p<0.05) and 5 (t=-5.5; df=3; p<0.05) against the grand mean of alternative 3 is significant. 1
The difference between alternative 2 and 3 is non-significant (t=-0.5; df=3; p=0.63). It is also 2
clear that the advisory group weighing has significantly affected the results compared to a 3
hypothetical scenario with equal scores which results in a preference of natural recovery. 4
Additional information may be extracted from the MCDA by analyzing how partici-5
pants score the criteria using centered weight analysis (Tervonen et al., 2009). This method 6
normalizes each criteria against a scenario where all criteria score equal. In this case a posi-7
tive value indicates that participants weigh this criterion higher than average and a negative 8
value indicates that the criterion is weighted less than average. As seen in Figure 4, the aver-9
aged criteria weights are higher than normal for the reduction in human and environmental 10
risk. This observation could explain the low score on a natural recovery scenario, since this 11
alternative has lower weights for the reduction in human and environmental risk than the oth-12
er remediation alternatives. 13
In addition to mean values, standard deviation is also presented in the figure 4. An 14
analysis of variance (ANOVA) concludes that there exists a significant difference between 15
advisory groups for 2 of the scored criteria, construction impacts and marine archaeological 16
preservation. This indicates that for these criteria the differences between groups are signifi-17
cantly larger, than the variance within the group. Stakeholders are significantly more con-18
cerned by construction impacts (F=6.0; df=3; p<0.05), than the other groups. This is natural 19
since this group includes representatives from organisations with close ties to Bergen harbour 20
such as harbour authorities, boat owner associations, etc. For marine archaeological preserva-21
tion (F=3.9; df=3; p<=0.05), stakeholders are again significantly more occupied with the sub-22
ject than the non-resident sediment experts. It is also interesting to observe that when the resi-23
dents respond as individuals they are less occupied with marine archaeological preservation, 24
than when they act on behalf of the community in a residents’ panel. This finding is consistent 25

Use of Multi-Criterial Involvement Processes (MIP) Oct 2010
16
with social science theory and the beliefs in differences between individual normative and 1
social normative values. Soma & Vatn (2010) also observed this phenomena where a delib-2
erative citizen jury panel setting favoured mobilisation of social values in decision-making, 3
rather than individual values. 4
A histogram of the inconsistency scores for the weighing of criteria is presented in 5
Figure 5. Normally a value below 0.1 is considered to be a consistent scoring (Saaty & 6
Vargas, 1984). The figure shows that 43 out of 120 frequencies of inconsistency scores are 7
below 0.1 with a mean value of 0.22. However, higher values and outliers are observed, indi-8
cating inconsistent scoring for some participants. 9
In general, statistical analysis of MCA weighting is expected to show high variances 10
as the method is designed for decision-makers representing broader interests. Large standard 11
deviation in some cases may also be explained by participants giving inconsistent weights, as 12
documented by some of the high inconsistency scores. 13
Comparing MCDA to intuitive ranking 14
Table 4 summarizes the number of participants that indicate a specific remediation al-15
ternative as their preferred alternative either through MCDA or via intuitive ranking. The re-16
sults given in Table 4 indicate that both methods suggest that alternative 2 and 3 are the most 17
preferred. It is also clear that while the intuitive ranking shows that some of the participants 18
also select other alternatives as their preferential choice, the MCDA clearly deselects these 19
other alternatives as preferential. 20
Figure 6 illustrates the standard deviation between intuitive ranking and MCDA. This 21
comparison provides valuable information regarding the robustness of the process. The results 22
show that in most cases, the standard deviation using MCDA is lower compared to intuitive 23
ranking. 24
Use of Multi-Criterial Involvement Processes (MIP) Oct 2010
17
Use of Results for Management Advice 1
Although the MCDA and the intuitive ranking result in the same most preferred re-2
mediation alternatives for all groups with alternative 2 (capping) and alternative 3 (capping 3
combined with near shore disposal) being the overall most preferred, the MCDA is more 4
equipped to sort out the “worst alternatives” than intuitive ranking. This potential use of 5
MCDA has also been documented in earlier studies (Linkov et al., 2007). In addition, the use 6
of MCDA in this study also results in lower standard deviation compared to intuitive ranking, 7
which also is in line with findings in earlier studies (Linkov et al., 2009). For the residents 8
group, the lower variance may also be a result of the deliberative consensus based weighting 9
in the residents’ panels, relative to individual based non-deliberative weighting. 10
The centered weight analysis of the scoring responses indicates a strong focus on hu-11
man and environmental risk reduction. The standard deviation presented in figure 4 is in some 12
cases relatively high, which usually is problematic for interpretation of results. In this case it 13
may however be a valuable piece of information, since it may indicate potential disagreement 14
and therefore should be specifically addressed in the management process. 15
MIP Methodology Evaluations 16
The role of MCDA in the process 17
One may argue that some of the data obtained through the structured involvement process 18
with MCDA may be obtained by other less resource intensive survey based methods. Wil-19
lingness to pay studies have previously been used to map preferences and to map household 20
and recreational users willingness to pay for sediment remediation in Norway (Barton et al., 21
2010). The advantage of such a large sample survey based approach is representation of pub-22
lic opinion about a project – a typically neglected interest in impact evaluation. Stated prefe-23
rence survey based valuation methods are also the only valuation methods that address so-24

Use of Multi-Criterial Involvement Processes (MIP) Oct 2010
18
called non-use and existence values. However, the contingent valuation method has been 1
questioned regarding inflated willingness-to-pay for contingent on hypothetical project alter-2
natives, versus actual willingness to pay once real alternatives are on the table. In Norway, 3
low sample response rates have also been shown to affect representativeness of the affected 4
population (Barton et al., 2010). Choice experiment surveys (CE), another stated preference 5
survey-based method, have been proposed as an alternative with cost-saving, small-sample 6
and preference elicitation advantages over contingent valuation (Bateman et al., 2002). CE 7
can be used as a formal approach to ‘map’ stakeholder's individual preferences for remedia-8
tion alternatives. However, a condition for using survey-based valuation methods is that the 9
choice of sediment remediation alternatives can be described in terms of their component 10
attributes in a survey setting. The experiences from our study question this possibility, since a 11
highly interactive process seemed to be necessary for participants to be able to understand the 12
relationship between alternatives and their impact criteria, and then to weight alternatives. 13
However, survey-based studies may have a role to play in confirming preferences for a small 14
set of specific project design criteria, once e.g. MCDA has narrowed alternatives and identi-15
fied contentious criteria; for example willingness to accept reduced accessibility to certain 16
beach locations during a remediation period. For stakeholders or residents to be able to em-17
brace a complex decision such as selection of remediation alternatives, an involvement 18
process with lateral learning, combined with MCDA giving structure, robustness and transpa-19
rent documentation is preferable and certainly a necessary step before conducting stated pre-20
ference survey’s to evaluate the representativeness of stakeholder preferences in the popula-21
tion. 22
Use of AHP as weighing method 23
One of the main advantages using a compensatory weighing approach as AHP is the pair-wise 24
weighing. This builds on the assumption that decision makers are more relaxed with making 25

Use of Multi-Criterial Involvement Processes (MIP) Oct 2010
19
relative comparisons between the objectives than to score in absolute values (Baron, 1997). 1
This assumption is to a large degree supported by this study. Even though, especially local 2
stakeholders and non-resident experts criticized the choice of criteria and related weights, the 3
majority of the participants were able to perform the weighing with logical results. This indi-4
cates that AHP is a suitable method for performing MCDA in advisory settings. It is however 5
important to note that use of compensatory methods also has disadvantages to outranking me-6
thods. The standardization of the utility function is one obvious challenge. In this study, as in 7
many studies, the standardization of the criteria weights was assumed to be linear for all crite-8
ria. According to prospect theory, this is not correct (Kahneman & Tversky, 1979). This 9
theory argues that the value curve is asymmetrical to the reference point, i.e. people generally 10
put more emphasis on “losses” than on “gains”. Thus the asymmetrical value curve is steepest 11
at the reference point subsequently over-emphasizing small losses compared to larger losses. 12
In our case this means that criteria involving negative aspects, such as human and environ-13
mental risk, should be standardized differently to gains, such as land reclamation, Figure 4. 14
This standardization requires a reweighting of impact scores. In our methodology, the impact 15
assessment scoring document was explained to the groups, and despite substantial simplifica-16
tion, 2 rounds of expert witnesses were required to clarify its complexities for the residents’ 17
panel. In our opinion, further reweighting of impacts based on assumptions about individual’s 18
aversion to risk would probably have confused rather than clarified understanding of the EIA 19
information used in the MCA. We therefore elected to disregard more advanced impact scor-20
ing methods. Another challenge with the AHP weighing approach is the hierarchical structure, 21
since uneven distribution of sub-criteria between the main criteria will “dilute” the importance 22
of the sub-criteria in groups having a greater number of criteria. In outranking methods these 23
issues are not present. Therefore outranking methods may be the preferable choice for deci-24
sion making where simplicity and robustness is favored to user friendliness in criteria weigh-25

Use of Multi-Criterial Involvement Processes (MIP) Oct 2010
20
ing. Use of outranking also allows application of stochastic multi-criteria acceptability analy-1
sis (SMAA) to the results. In this method, criteria weights may be entered as distributions and 2
a probabilistic approach is used to arrive at the most preferred alternative (Alvarez-Guerra et 3
al., 2010). In this study the focus was to initiate a structured involvement process facilitated 4
with MCDA. Criteria were selected to reflect the interest of residents, stakeholders and ex-5
perts, rather than to be a comprehensive baseline for a decision since the project is in an early 6
exploratory phase. The aspect of uncertainty evaluation was therefore not highly prioritized in 7
this study. It is evident that as the project process advances, the selection of MCDA metho-8
dology should evolve, possibly focusing more on uncertainties in the criteria thus requiring 9
selection of other weighing methods. 10
Evaluating Advisory Group Perception of the MIP 11
Within each session of the advisory group meetings the participants were asked with 12
the aid of questionnaires, how they perceived the session and the involvement process. The 13
general impression from both discussions and the results of the questionnaire were that people 14
were in agreement that the involvement and learning process was positive in terms of infor-15
mation exchange between both expert witnesses and the advisory groups. These results are 16
encouraging for the future application of MIP as it indicates a successful exchange of infor-17
mation and that both residents and stakeholders can produce valuable advice for the manage-18
ment process, with results well in line with what experts suggest. 19
There are however differences between the dynamics in the groups. The residents par-20
ticipated using the information and methods available well within the available time of 3 21
meetings. The non-residential experts performed the MIP within 1 meeting reflecting their 22
familiarization with the subject; however, they were occupied with the assumptions made 23
when assessing criteria and criteria weights. The work flow with the stakeholder group was 24
different. Although the meetings were constructive, more time was spent on familiarization, 25
Use of Multi-Criterial Involvement Processes (MIP) Oct 2010
21
clarification of the mandate for the group and questions relating to the MCDA process. The 1
stakeholders also to some degree questioned the objectives of the study and focused on their 2
role in the forthcoming project process. These discussions about roles and expectations are 3
common in stakeholder involvement processes (Gerrits & Edelenbos, 2004) and emphasize 4
the need to invest time in familiarization and formulation of objectives when addressing 5
stakeholders in the involvement processes (Sjöberg L & Drottz-Sjöberg B.M, 2008). It is also 6
important to consider these differences when deciding what kind of advisory groups to engage 7
in the MIP. 8
CONCLUSION 9
In this paper we propose a multi-criterial involvement processes (MIP) to enhance par-10
ticipatory involvement processes. The evaluation of the Bergen harbor case study supports the 11
feasibility of this method for these processes. This statement is mainly supported by 2 find-12
ings in the study. The results show that using MCDA as an integral step in the MIP adds 13
structure and robustness to the involvement process and provides good documentation of cri-14
teria to be further addressed by the problem owner. Secondly, we perceive involvement and 15
learning as important for the participants to be able to perform the MCDA in selection of re-16
mediation alternatives. 17
There also challenges to use MCDA in an advisory process. Firstly there are consider-18
ations to make regarding use of MCDA method. In this case the analytical hierarchy process 19
(AHP) was selected due to user friendliness, but other settings may require use of other me-20
thods which have been shown in the literature to produce more robust results. Secondly this 21
study showed that the quantitative scoring was perceived as problematic and was questioned 22
especially by stakeholders and experts. The interactions and the qualitative information from 23
the different advisory group discussions as suggested in the MIP, are therefore important in 24
order to reduce misunderstandings and misinterpretations. 25

Use of Multi-Criterial Involvement Processes (MIP) Oct 2010
22
Finally, it is important to remember that the emphasis on method and process should 1
be balanced using both quantitative and qualitative methods as proposed in the MIP. By in-2
cluding MCDA in the MIP, the structure and documentation of the process is ensured thus 3
providing quantifiable results that can be replicated by third parties. By engaging group inte-4
raction and learning through participatory methods, the quality of the involvement process 5
from recruitment to final discussions is preserved thus setting the stage for successful sedi-6
ment remediation projects for both stakeholders and problem owners. 7
ACKNOWLEDGMENTS 8
The participation from people in the advisory group is this work is greatly appreciated. 9
The authors are also grateful for the cooperation from Bergen Municipality and the sediment 10
remediation project in Bergen. The authors would also like to thank the Norwegian Research 11
Council for financing the work. Anonymous reviewers have performed excellent reviews of 12
the paper. 13
REFERENCES 14 15
Alvarez-Guerra, M., Canis, L., Voulvoulis, N., Viguri, J. R., and Linkov, I. 2010. 16
Prioritization of sediment management alternatives using stochastic multicriteria 17
acceptability analysis. Science of the Total Environment 408:4354-4367. 18
Baars, A. J. R. M. C. Theeelen P. J. C. M. Janssen J. M. Hesse M. E. van Apeldoorn M. C. M. 19
Meijerink L. Verdam and M. J. Zeilmaker. Re-evaluation of human-toxicological 20
maximum permissible risk levels. 711701025 . 2001. Bilthoven, National Institute of 21
Public Health and the Environment . 22
Baron, J. 1997. Confusion of Relative and Absolute Risk in Valuation. Journal of Risk and 23
Uncertainty 14:301-309. 24

Use of Multi-Criterial Involvement Processes (MIP) Oct 2010
23
Barton, D., Navrud, S., Bjørkeslett, H., and Lilleby, I. 2010. Economic benefits of large-scale 1
remediation of contaminated marine sedimentsΓÇöa literature review and an 2
application to the Grenland fjords in Norway. Journal of Soils and Sediments 10:186-3
201. 4
Bateman, I., Great, B., and Dept.for Transport (2002). Economic valuation with stated 5
preference techniques 6
a manual. Cheltenham, UK: Edward Elgar. 7
Breedveld, G. D. (2007). Forurensning krever lokal løsning (contamination 8
requires local solutions). http://www.forskning.no/Artikler/2007/oktober/1192712348.85: 9
Norwegian Research Council Newsletter. 10
Chinyio, E. and Olomolaiye, P. O. (2010). Construction stakeholder management. Chichester, 11
U.K: Wiley-Blackwell. 12
Dyer, J. S. and Sarin, R. K. 1982. Relative Risk-Aversion. Management Science 28:875-886. 13
Eek, E., Cornelissen, G., Kibsgaard, A., and Breedveld, G. D. 2008. Diffusion of PAH and 14
PCB from contaminated sediments with and without mineral capping; measurement 15
and modelling. Chemosphere 71:1629-1638. 16
FM. Bergen harbour management plan phase II (In Norwegian). 2005. Regional 17
environmental body Hordaland. 18
Gerrits, L. and Edelenbos, J. 2004. Management of sediments through stakeholder 19
involvement. Journal of Soils and Sediments 4:239-246. 20

Use of Multi-Criterial Involvement Processes (MIP) Oct 2010
24
Hong, G. H., Kim, S. H., Suedel, B. C., Clarke, J. U., and Kim, J. 2010. A decision-analysis 1
approach for contaminated dredged material management in South Korea. Integr 2
Environ Assess Manag 6:72-82. 3
Janssen R and Herwijnen MV. DEFINITE 3.1. A System to Support Decisions on a Finite Set 4
of Alternatives (software package and user manual). 2007. Institute for 5
Environmental Studies (IVM), Vrije Universiteit: Amsterdam. 6
Jartun, M., Ottesen, R. T., Steinnes, E., and Volden, T. 2008. Runoff of particle bound 7
pollutants from urban impervious surfaces studied by analysis of sediments from 8
stormwater traps. Science of the Total Environment 396:147-163. 9
Kahneman, D. and Tversky, A. 1979. Prospect Theory: An Analysis of Decision under Risk. 10
Econometrica 47:263-291. 11
Kasperson, J. X. and Kasperson, R. E. (2005). The social contours of risk. London: Earthscan. 12
Kiker, G. A., Bridges, T. S., Varghese, A., Seager, T. P., and Linkov, I. 2005. Application of 13
Multicriteria Decision Analysis in Environmental Decision Making. Integr Environ 14
Assess Manag 1:95-108. 15
Kim, J., Kim, S. H., Hong, G. H., Suedel, B. C., and Clarke, J. 2010. Multicriteria decision 16
analysis to assess options for managing contaminated sediments: Application to 17
Southern Busan Harbor, South Korea. Integr Environ Assess Manag 6:61-71. 18
Kitzinger, J. 1995. Qualitative Research - Introducing Focus Groups. British Medical Journal 19
311:299-302. 20

Use of Multi-Criterial Involvement Processes (MIP) Oct 2010
25
Linkov, I., Satterstrom, F. K., and Fenton, G. P. 2009. Prioritization of capability gaps for 1
joint small arms program using multi-criteria decision analysis. J Multi-Crit Decis 2
Anal 16:179-185. 3
Linkov, I., Satterstrom, F. K., Yatsalo, B. I., Tkachuka, A., Kiker, G., Kim, J., Bridges, T., 4
Seager, T., and Gardner, K. H. 2007. Comparative assessment of several 5
multi+criteria desicion analysis tools for management of contaminated sediments. In 6
I. Linkov, G. Kiker, and R. Wenning (Eds.), Environmental Security in Harbors and 7
Coastal Areas (pp. 233-249). Springer Netherlands. 8
Linkov, I., Varghese, A., Jamil, S., Seager, T., Kiker, G., and Bridges, T. 2005. Multi-Criteria 9
Decision Analysis: A Framework for Structuring Remedial Decisions at Contaminated 10
Sites. In I. Linkov and A. Ramadan (Eds.), Comparative Risk Assessment and 11
Environmental Decision Making (pp. 15-54). Springer Netherlands. 12
MD. White paper 12 "Rent og rikt hav" (In Norwegian). 2002. Norwegian Ministry of 13
Environment. 14
MD. White paper 14 "Sammen for et giftfritt miljø - forutsetninger for en tryggere fremtid" 15
(In Norwegian). 2006. Norwegian Ministry of Environmwent. 16
Oen, A. M. P., Sparrevik, M., Barton, D. N., Nagothu, U. S., Ellen, G. J., Breedveld, G. D., 17
Skei, J., and Slob, A. 2010. Sediment and society: an approach for assessing 18
management of contaminated sediments and stakeholder involvement in Norway. 19
Journal of Soils and Sediments 10:202-208. 20
Palermo, M. R. 1998. Design considerations for in-situ capping of contaminated sediments. 21
Water Science and Technology 37:315-321. 22
Use of Multi-Criterial Involvement Processes (MIP) Oct 2010
26
Renn, O. 1999. A Model for an Analytical Deliberative Process in Risk Management. 1
Environmental Science & Technology 33:3049-3055. 2
Renn, O. 2006. Participatory processes for designing environmental policies. Land Use Policy 3
23:34-43. 4
Saaty, R. W. 1987. The analytic hierarchy process--what it is and how it is used. 5
Mathematical Modelling 9:161-176. 6
Saaty, T. L. and Vargas, L. G. 1984. Comparison of eigenvalue, logarithmic least squares and 7
least squares methods in estimating ratios. Mathematical Modelling 5:309-324. 8
Sjöberg L and Drottz-Sjöberg B.M 2008. Attitudes towards nuclear waste and siting policy: 9
experts and the public. In Arnold P.Lattefer (Ed.), Nuclear Waste Research: Siting, 10
Technology and Treatment (pp. 44-47). Nova Science Publishers, Inc. 11
Slob, A. F. L., Ellen, G. J., and Gerrits, L. 2008. Sediment management and stakeholder 12
involvement. In N. O. Philip (Ed.), Sustainable Management of Sediment Resources 13
Sediment Management at the River Basin Scale (pp. 199-216). Elsevier. 14
Slovic, P., Finucane, M. L., Peters, E., and MacGregor, D. G. 2004. Risk as analysis and risk 15
as feelings: Some thoughts about affect, reason, risk, and rationality. Risk Analysis 16
24:311-322. 17
Smith, G. and Wales, C. 2000. Citizens' Juries and Deliberative Democracy. Political Studies 18
48:51-65. 19
Soma, K. 2010. Framing participation with multicriterion evaluations to support the 20
management of complex environmental issues. Env Pol Gov 20:89-106. 21

Use of Multi-Criterial Involvement Processes (MIP) Oct 2010
27
Soma, K. and Vatn, A. 2010. Is there anything like a citizen? A descriptive analysis of 1
instituting a citizen's role to represent social values at the municipal level. Env Pol 2
Gov 20:30-43. 3
Sparrevik, M. and Breedveld, G. D. 2010. From Ecological Risk Assessments to Risk 4
Governance. Evaluation of the Norwegian Management System for Contaminated 5
Sediments. Integr Environ Assess Manag 6:240-248. 6
Sparrevik, M., Ellen, G. J., and Duijn, M. 2010. Evaluation of Factors Affecting Stakeholder 7
Risk Perception of Contaminated Sediment Disposal in Oslo Harbor. Environmental 8
Science & Technologynull. 9
Susskind, L., McKearnan, S., and Thomas-Larmer, J. (1999). The consensus building 10
handbook 11
a comprehensive guide to reaching agreement. Thousand Oaks, Calif: Sage Publications. 12
Tervonen, T., Figueira, J. R., Lahdelma, R., Dias, J. A., and Salminen, P. 2009. A stochastic 13
method for robustness analysis in sorting problems. European Journal of Operational 14
Research 192:236-242. 15
UN. Report of the World Commission on Environment and Development. 12-11-1987. 16
United nations. 17
Yatsalo, B. I., Kiker, G. A., Kim, J., Bridges, T. S., Seager, T. P., Gardner, K., Satterstrom, F. 18
K., and Linkov, I. 2007. Application of Multicriteria Decision Analysis Tools to Two 19
Contaminated Sediment Case Studies. Integr Environ Assess Manag 3:223-233. 20
21
22
23
Use of Multi-Criterial Involvement Processes (MIP) Oct 2010
28
LIST OF TABLES 1
Table 1 Descriptive statistics with mean values and standard deviation in bracket for 2
the participants and analysis of variance (F-test) between the groups 3
Table 2 Formulation of consequences and assessment of criteria weights for the 4
alternatives in the MCDA 5
Table 3 Scoring of alternatives based on mean values of quantitative scores for the dif-6
ferent groups and a grand mean for all groups. In addition a simulated case 7
with “equal score” for all the sub-criteria weights is provided. Bold values in-8
dicate most preferred alternative for each advisory group. Standard deviation in 9
brackets 10
Table 4 Most preferred alternative based on intuitive ranking and results derived from 11
the MCDA. Bold values indicate alternative preferred by most numbers partic-12
ipants in the group 13
LIST OF FIGURES 14
Figure 1 The project execution process of contaminated sediment management and the 15
degree of involvement for different actors. The Bergen case is evaluated to be 16
early in the concept selection phase and the multi-criteria involvement process 17
(MIP) is proposed to enhance early involvement. 18
Figure 2 Schematic overview of the proposed multi-criteria involvement process (MIP). 19
Figure 3 Overview of Bergen harbor. Areas for capping, dredging and near shore dis-20
posal are indicated in the map. Modified from www.klif.no 21
Figure 4 Centered weight analysis for the different advisory groups. A positive value 22
indicates that the criterion is scored higher than average; a negative value indi-23
Use of Multi-Criterial Involvement Processes (MIP) Oct 2010
29
cates that the criterion is scored lower than average. The error bars represent 1
one standard deviation. 2
Figure 5 Histogram of inconsistency scores for the different advisory groups. Scores for 3
choice between, environmental, societal and economical criteria as well as 4
scores within the environmental and societal criteria are given in the figure. 5
The economical criterion is only 1 pair and has therefore no inconsistency 6
Figure 6 Analysis of the standard deviation within the groups for the different alterna-7
tives for both intuitive ranking and MCDA 8
9
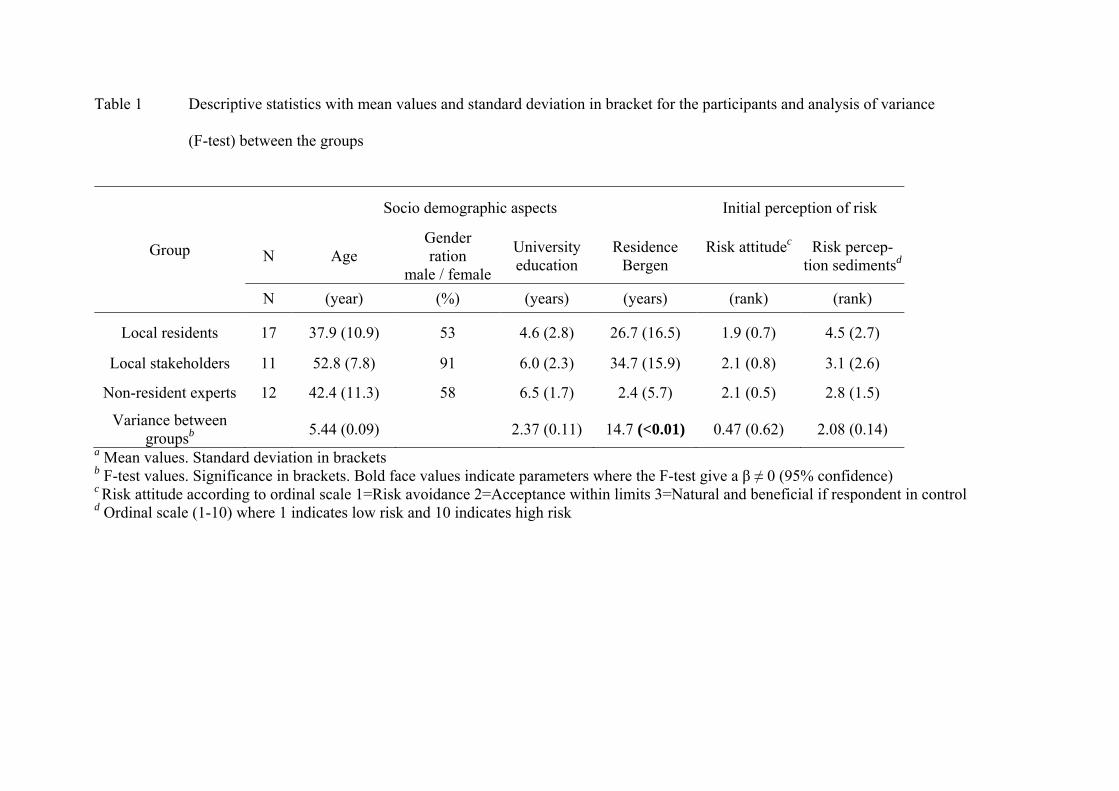
Table 1 Descriptive statistics with mean values and standard deviation in bracket for the participants and analysis of variance
(F-test) between the groups
Group
Socio demographic aspects Initial perception of risk
N Age Gender ration
male / female
University education
Residence Bergen
Risk attitudec
Risk percep-tion sedimentsd
N (year) (%) (years) (years) (rank) (rank)
Local residents 17 37.9 (10.9) 53 4.6 (2.8) 26.7 (16.5) 1.9 (0.7) 4.5 (2.7)
Local stakeholders 11 52.8 (7.8) 91 6.0 (2.3) 34.7 (15.9) 2.1 (0.8) 3.1 (2.6)
Non-resident experts 12 42.4 (11.3) 58 6.5 (1.7) 2.4 (5.7) 2.1 (0.5) 2.8 (1.5)
Variance between groupsb 5.44 (0.09) 2.37 (0.11) 14.7 (<0.01) 0.47 (0.62) 2.08 (0.14)
a Mean values. Standard deviation in brackets b F-test values. Significance in brackets. Bold face values indicate parameters where the F-test give a β ≠ 0 (95% confidence) c Risk attitude according to ordinal scale 1=Risk avoidance 2=Acceptance within limits 3=Natural and beneficial if respondent in control d Ordinal scale (1-10) where 1 indicates low risk and 10 indicates high risk

Table 2 Formulation of consequences and assessment of criteria weights for the alternatives in the MCDA
Criteria Sub criteria Unit 1 2 3 4 5
NRa Capb Cap+NSc Cap+LDd Cap+NDe
Environmental
Reduction of environmental risk (PCB flux from sediments) % 0 99 98 98 98
Reduction of human health risk Times MTR exceedance 50 2 4 4 4
Green house gas emissions Pers car f eq/ pr y 0 461 354 648 2961
Societal
Construction impact (spatial influence) Score 0 1 2 2 2
Disposal site location Score 0 0 1 2 3
Marine archaeological preser-vation % 100 90 70 70 70
Area for property development (land reclaimed) m2 0 0 10980 0 0
Economicali
Maximise governmental / Minimise municipal financing NOK × 106 g 0 102 91 108 115
Maximise municipal / minimise governmental financing NOK × 106 h 0 52 55 62 64
a Natural recovery of area (NR) b Capping with 30 cm layer (Cap) c Capping and dredging with near shore disposal (NS) d Capping and dredging with local land disposal (LD) e Capping and dredging with national land disposal (ND) f Normalised against the amount CO2 released from car during 1 year g Values represent total municipal cost. Values in Norwegian crowns (NOK) h Values represent total governmental cost. Values in Norwegian crowns (NOK) i The phrasing of question were changed during the MCDA. In the original setting “total cost” was weighed against “municipal cost”. A conversion was made as follows; strong weighting of “total cost” =strong weighting on “minimised municipal financing”. Neutral or strong weighting of “municipal cost” = neutral weighting of “minimise municipal financing”

Table 3 Scoring of alternatives based on mean values of quantitative scores for the different
groups and a grand mean for all groups. In addition a simulated case with “equal score” for all the
sub-criteria weights is provided. Bold values indicate most preferred alternative for each advisory
group. Standard deviation in brackets.
Group 1 2 3 4 5
NR Cap Cap+NS Cap+LD Cap+ND
Individual residents 0.44 (0.19) 0.69 (0.19) 0.71 (0.15) 0.60 (0.18) 0.50 (0.17)
Residents panel 0.38 (0.11) 0.79 (0.04) 0.80 (0.03) 0.70 (0.05) 0.65 (0.06)
Local Stakeholders 0.44 (0.17) 0.78 (0.07) 0.77 (0.06) 0.65 (0.11) 0.57 (0.12)
Non-resident Experts 0.47 (0.14) 0.73 (0.11) 0.76 (0.09) 0.63 (0.13) 0.48 (0.14)
Grand Mean 0.43 0.75 0.76 0.64 0.55
Equal scoring 0.67 0.61 0.61 0.42 0.29
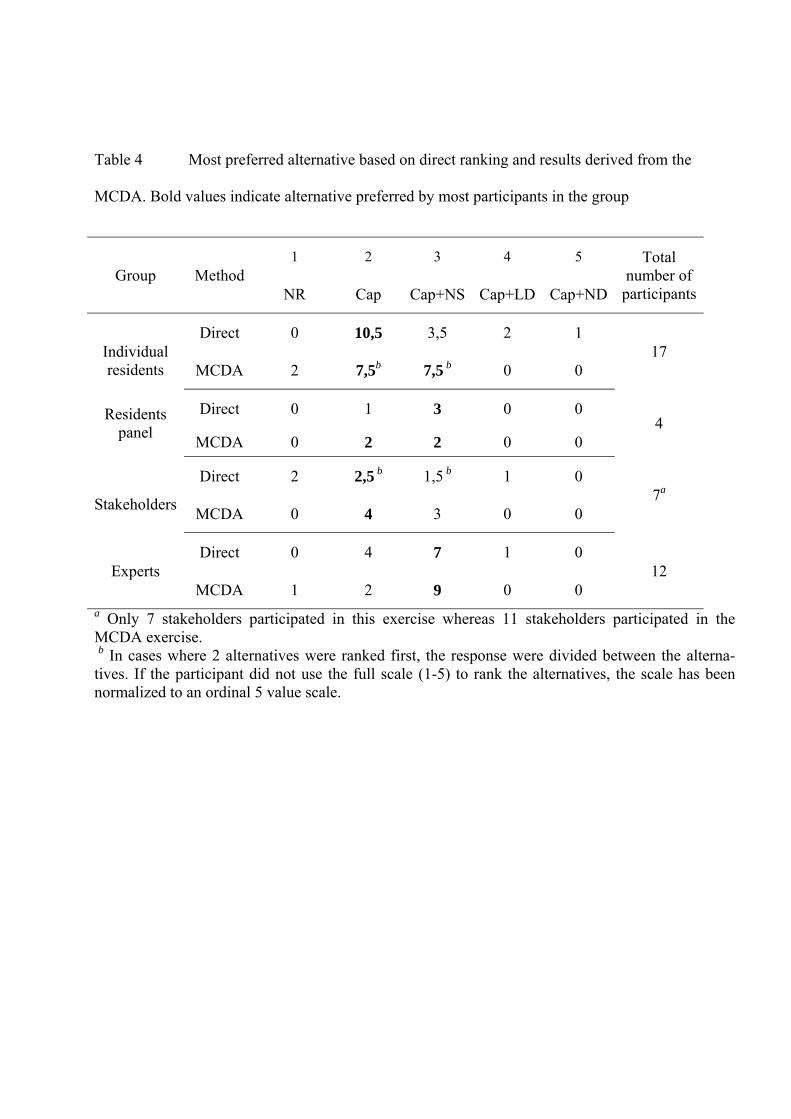
Table 4 Most preferred alternative based on direct ranking and results derived from the
MCDA. Bold values indicate alternative preferred by most participants in the group
Group Method 1 2 3 4 5 Total
number of participantsNR Cap Cap+NS Cap+LD Cap+ND
Individual residents
Direct 0 10,5 3,5 2 1 17
MCDA 2 7,5b 7,5 b 0 0
Residents panel
Direct 0 1 3 0 0 4
MCDA 0 2 2 0 0
Stakeholders
Direct 2 2,5 b 1,5 b 1 0 7a
MCDA 0 4 3 0 0
Experts Direct 0 4 7 1 0
12 MCDA 1 2 9 0 0
a Only 7 stakeholders participated in this exercise whereas 11 stakeholders participated in the MCDA exercise. b In cases where 2 alternatives were ranked first, the response were divided between the alterna-tives. If the participant did not use the full scale (1-5) to rank the alternatives, the scale has been normalized to an ordinal 5 value scale.

Figure 1 The project execution process of contaminated sediment management
and the degree of involvement for different actors. The Bergen harbour case is
evaluated to be early in the concept evaluation phase and the multi-criterial
involvement process (MIP) is proposed to enhance early involvement.
Problemformulation
Concept evaluation
Approval Execution
Problem owner
Consultant
StakeholderDecision
Early involvement
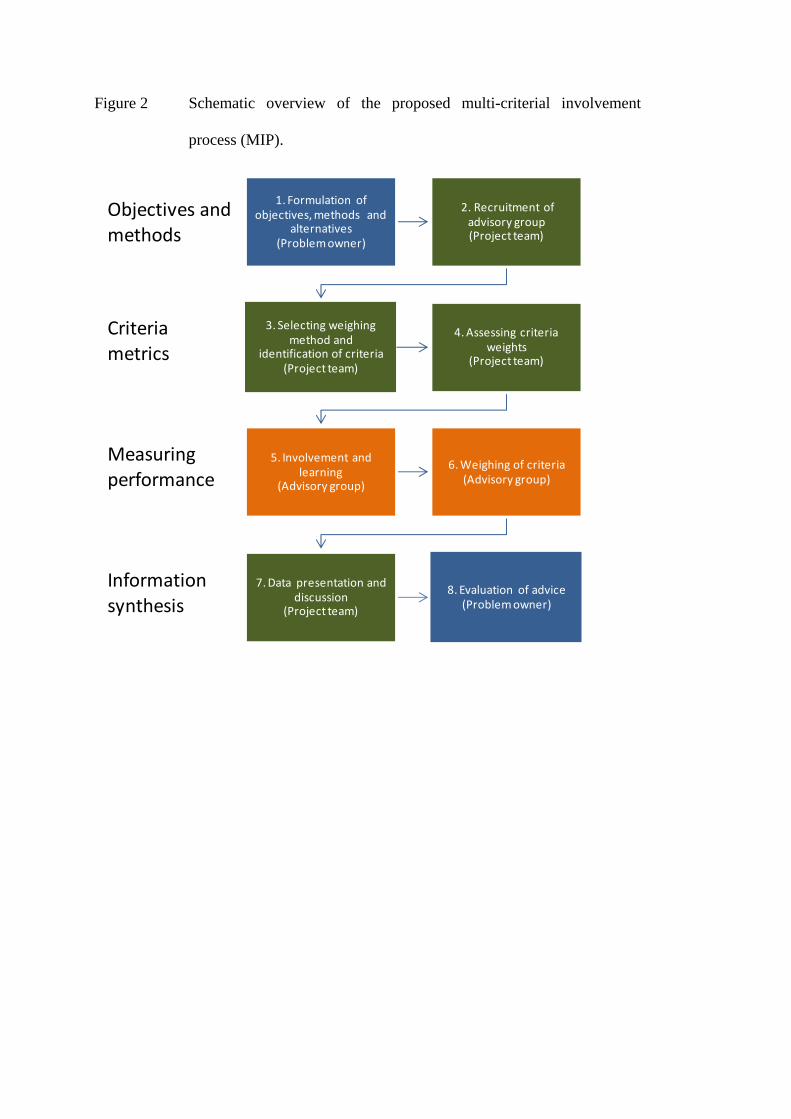
Figure 2 Schematic overview of the proposed multi-criterial involvement
process (MIP).
1. Formulation of objectives, methods and
alternatives(Problem owner)
2. Recruitment of advisory group(Project team)
3. Selecting weighing method and
identification of criteria (Project team)
4. Assessing criteria weights
(Project team)
5. Involvement and learning
(Advisory group)
6. Weighing of criteria(Advisory group)
7. Data presentation and discussion
(Project team)
8. Evaluation of advice(Problem owner)
Objectives and methods
Criteriametrics
Measuringperformance
Informationsynthesis

Figure 3 Overview of Bergen harbour. Areas for capping, dredging and near
shore disposal are indicated in the map. Modified from www.klif.no
Hypothetical near shore disposal sites
Dredging area
Capping area
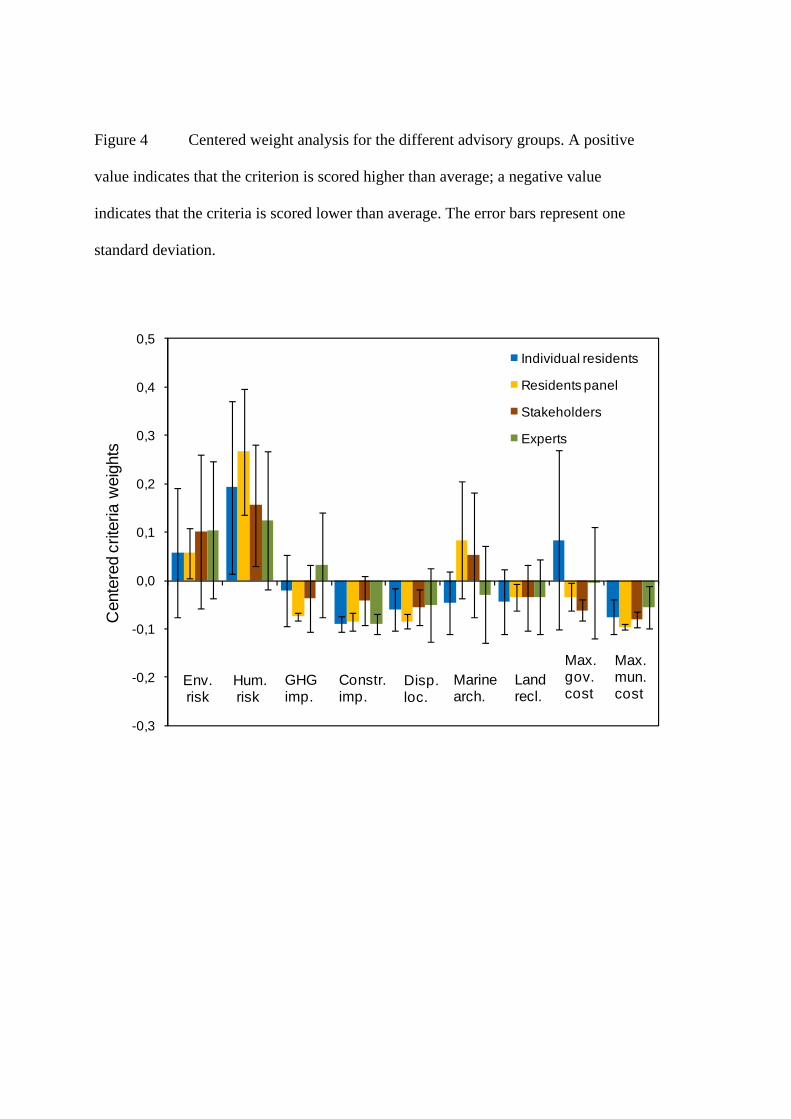
Figure 4 Centered weight analysis for the different advisory groups. A positive
value indicates that the criterion is scored higher than average; a negative value
indicates that the criteria is scored lower than average. The error bars represent one
standard deviation.
-0,3
-0,2
-0,1
0,0
0,1
0,2
0,3
0,4
0,5
Cen
tere
d cr
iteria
wei
ghts
Individual residents
Residents panel
Stakeholders
Experts
Env.risk
Hum. risk
GHGimp.
Constr.imp.
Disp.loc.
Marinearch.
Landrecl.
Max.gov.cost
Max. mun.cost

Figure 5 Histogram of inconsistency scores for the different advisory groups.
Scores for choice between, environmental, societal and economical
criteria as well as scores within the environmental and societal criteria
are given in the figure. The economical criterion is only 1 pair and has
therefore no inconsistency
0.20 0.4 0.6 0.8 1.0 1.2 1.4 1.6 1.8 2.0
Individual residents
Residents panel
Stakeholders
Experts

Figure 6 Analysis of the standard deviation within the groups for the different
alternatives for both intuitive ranking and MCDA.
0.0
0.5
1.0
1.5
2.0
0.0 0.5 1.0 1.5 2.0
Std
dev
MC
DA
rank
ing
Std dev intuitive ranking
Individual residents
Residents panel
Stakeholders
Experts