Embed Size (px)
Citation preview

USE OF MERIS DATA FOR LAND COVER AND SEA PHENOMENON MAPPING IN THE NORTH OF ALGERIA: FIRST RESULTS
Youcef Smara, Nadia Ouarab & Samy Bouchaib
Faculty of Electronics and Computer Sciences / U.S.T.H.B Image Processing and Radiation Laboratory
B.P 32 El-Alia Bab-Ezzouar 16111 Algiers, Algeria Email: [email protected] ; [email protected]; [email protected]
Abstract: MERIS has a high spectral and radiometric resolution and a dual spatial resolution, within a global mission covering open ocean and coastal zone waters. The global mission of MERIS has a major contribution to scientific projects which seek to understand the role of the oceans and ocean productivity in the climate system. In addition to its main objectives MERIS data already now show a large potential for applications in the area of vegetation monitoring, land use and so on. In that context, MERIS data are being used owing to their accuracy, spectral and spatial performance. This paper is intended to give our contribution in the use of MERIS data products. This paper describes the preliminary results of a study, always in carrying out, in the context of the ERS-ENVISAT AOE 703 project, towards the use of MERIS for land cover and sea phenomenon mapping in the North of Algeria. Full resolution level L2 data of June 13th, 2003, were used in this study. First, quality and information content of the used MERIS images were explored. The availability of MERIS reflectances in the visible and near-infrared parts of the spectrum gives now the useful opportunity of regular observation the water quality in coastal waters. We present, for our part, some results concerning the state of the sea and the Algerian coastal waters. For our preliminary work, the Basic ERS & Envisat (A)ATSR and Meris Toolbox (BEAM) software is used. The software is a collection of executable tools for utilisation, viewing and processing of MERIS, (A)ATSR and ASAR data. Keywords: MERIS images, land cover, classification, Vegetation index, sea and coastal waters. INTRODUCTION Remote sensing is the appropriate tool for monitoring large areas such as Algeria. Previous approaches were based on the visual interpretation of Landsat-TM and SPOT-XS data at a landscape level producing an ecological legend. However, both approaches use images of high spatial resolution, making this approach expensive and very time-consuming for application at the Northern Algerian scale. Other approaches are based on the use of coarse spatial resolution data of, for instance, the NOAA-AVHRR sensor. Various case studies showed that medium resolution images (like those from MERIS and MODIS) can bridge the gap between Landsat/SPOT and NOAA. Because the area of a Full Resolution MERIS pixel is more than ten times smaller than an AVHRR pixel, it is expected that a significantly larger number of details can be identified than by using AVHRR like data. In addition, the high spectral resolution of MERIS is another important feature, which may be exploited to identify more thematic classes. MERIS (Medium Resolution Imaging Spectrometer) is one of the payload components of ESA’s Envisat-1, which was launched in March 2002. MERIS is a 15-band, programmable imaging spectrometer, which allows for changes in band position and bandwidths throughout its lifetime. It is designed to acquire data at variable

bandwidth of 1.25 to 30 nm over the spectral range of 390-1,040 nm. Data will be acquired at 300 m or 1,200 m spatial resolution over land, thus vegetation can be monitored at regional to global scales. MERIS will mostly be operated with a standard band setting. However, it has the capability of in-flight selection of bands for specific applications or experiments. Operational constraints, however, will limit the number and frequency of band changes. The MERIS spatial resolution of 300 m should be sufficient to monitor heterogeneous terrestrial surfaces at scales required for continental and global studies. The objective of this paper was to perform a preliminary study towards the feasibility of using MERIS for land cover and sea phenomenon mapping at the national scale. Level L1 data products are resampled considering the acquisition geometry and with an absolute registration accuracy of 2 km. Images are in radiance units measured by the sensor. Level L2 data products provide 20 layers containing 13 bands in reflectance and 17 geophysical products (algal pigment, suspended matter and yellow substance concentrations, atmospheric parameters and vegetation index) [1]. 1. DATA USED
The study of this area has been carried out by using a full resolution MERIS level L2 data set recorded on June 13th, 2003, at about 10:10 UTC (figure 1). The choice of the level L2 product is justified by the quality of the data provided by the Level 2 processor of the MERIS sensor which includes several modules to generate more than 20 geophysical parameters, scientific flags and quality flags which are included in the Level 2 products, e.g. such as surface reflectances, algal pigment index etc, or the surface classification flags or the confidence flags. The studied area (see figure 1) corresponds essentially to a three different regions concerning i) a part of Mediterranean sea ii) a vegetative region in the Northern Algeria and iii) a semi arid region covered partially by clouds.
Fig. 1: Localisation of studied area and the used scene. The processing of the image is made with the ENVI software and the BEAM software which is The Basic ERS & Envisat (A)ATSR and Meris Toolbox (BEAM) is a collection of executable tools and an application programming interface (API) which has been developed to facilitate the utilisation, viewing and processing of MERIS, (A)ATSR and ASAR data [2]. 2. METHODOLOGY
The adopted methodology consists of techniques including image analysis, image identification and classified images well as image fusion with the TM images of Landsat satellite. In fact, the first objective of this study is to evaluate the performances of the Medium Resolution Imaging Spectrometer (MERIS) over land and water areas.

2.1. Image analysis In order to study the information content of the MERIS image of Figure 2, correlation coefficients between the 13 MERIS bands were mutually calculated. In addition, a principal component analysis was performed on the image. Thereafter the spectral signatures were studied and a minimum distance-to-means supervised classification was performed including clouds as a separate class in the training stage. Finally, a MERIS and TM data fusion was elaborated for the coastal areas application.
1 2 3 4 5 6 7 8 9 10 11 12 13 1 1.00 2 0.99 1.00 3 0.98 0.99 1.00 4 0.97 0.98 0.99 1.00 5 0.92 0.95 0.97 0.98 1.00 6 0.85 0.88 0.92 0.94 0.98 1.00 7 0.84 0.87 0.90 0.93 0.97 0.99 1.00 8 0.83 0.86 0.90 0.92 0.97 0.99 0.99 1.00 9 0.81 0.84 0.88 0.91 0.96 0.99 0.99 0.99 1.00 10 0.77 0.81 0.85 0.88 0.94 0.96 0.96 0.97 0.98 1.00 11 0.73 0.76 0.81 0.84 0.91 0.95 0.95 0.95 0.97 0.99 1.00 12 0.73 0.77 0.81 0.84 0.91 0.95 0.95 0.95 0.97 0.99 0.99 1.00 13 0.21 0.22 0.25 0.26 0.30 0.33 0.34 0.34 0.35 0.35 0.35 0.35 1.00
Table 1: Correlation matrix for a subset of the MERIS image of June 16th, 2003.
Table 1 shows the correlation coefficients between the individual spectral bands of MERIS image. First of all, it can be observed that band 1 and 5 (in the blue) were strongly correlated. Also bands 6 till 8 (all in the visible) were strongly correlated. The latter were also strongly correlated with the former. Subsequently, Table 1 shows that bands 10 till 13 (in the NIR) were strongly correlated. Band 13 (at about 865 nm) showed a deviating behaviour, as it was moderately correlated with the visible bands as well as with the NIR bands. The principal component analysis showed that more than 99% of all information was captured in the first three components (Table 2). The figure 2 shows an RGB color image combining the 4, 5 and 6 principal component channels.
Principal component
1
2 3 4 5 6 7 8 9 10 11 12 13
Explained variance (%)
86.03
12.64 0.59 0.38 0.18 0.09 0.04 0.02 0.02 0.01 0.00 0.00 0.00
Table 2: Results of a principal component analysis on a subset of the MERIS image of June 13th, 2003.
Fig. 2: RGB image combining the 4, 5 and 6 principal component channels.

2.2. Pixel Identification 2.2.1. Land Identification In figure 3, which represents our study area, four areas with the following characteristics are marked [3]: (1): soil with vegetation (2): vegetated area with mature green land, (3): bare soil, (4): clouds areas Figure 3 shows the spectra for the land pixels that are located in these significantly different areas: area 1 shows the soil with vegetation areas including urban areas with the presence of some vegetation. Area 2 shows a typical vegetation spectrum. Area 3 shows a typical spectrum of the bare soil situated in the semi arid region of Algeria. Finally, area 4 shows the clouds which cover a large area and characterised by a high level of reflectance. In the other part, the green line shows the separation between water areas and land areas. The shape of the coastline is very precise. The final verification of this identification has to be completed with other types of satellite data .
Fig. 3: spectra for the land pixels that are located in the image. 2.2.2. Water identification The detection of turbid water and others types of water is a very important step in the Level 2 processing scheme (see figures and 5) [4].

Fig. 4: Coastal area with eleven locations for spectra in different water types.
Fig. 5: spectra for the water pixels that are located in the figure 4.
Fig. 6: spectra for the land, water and clouds pixels that are located in the image.
(1) - (3) : different types of clear water (4) – (6) : different types of light turbid water (7) – (11) : different types of high to very high turbid water

The figure 6 gives us comparative spectra between land, water and the clouds areas. We can note that some areas have no values as indicated in the figure 4 and some missing data on the coastal zones of Algeria as indicated in the figure 7.
Fig. 7: missing data on the coastal areas. We can note also that we are only few weeks after the seism of Algiers-Boumerdes of the 21 of may 2003 (magnitude 6.8) and we can remark that in the week of 8 until 13 of June 2005, we have had five replica of the seism with the magnitude between 3 and 3.5. This situation can explain the marine phenomenon. Verification has to be completed in this context. 2.3. Classification Finally, a minimum distance-to-means supervised classification was performed including clouds as a separate class in the training stage. Effectively, training samples for the main land cover classes were collected (see figure 8). Thereafter the spectral signatures were studied. Figure 9 shows the results of a minimum-distance-to-means (MDM) classification for the image, including also a class “clouds” in the training set.
Fig. 8: training samples for the main classes. Fig. 9: classification for the image in 8 classes. Figure 10 shows the spectral signatures of the main land cover classes as derived from the MERIS image of June 16th, 2003. The general pattern of the TOA reflectance was as expected.

Fig. 10: spectral signatures of the main classes.
2.4. MERIS and TM images fusion for coastal applications The scope of this study is the exploitation of MERIS data to provide repetitive information on natural resources in coastal zones. This approach takes advantage of spatial and spectral resolution of the MERIS sensor. Special emphasis is put on advanced data processing methods such as fusion of MERIS and TM, to provide a product with the best resolution and taking advantage of the repeat cycles of the two sensors. These applications on small study areas require a resolution better than 300 m. The resolution of MERIS can be improved by merging MERIS and TM/Landsat data. Because some missing data on the coastal zones of Algeria and problems of registration between TM and MeRIS images we used for our study images from Camargue (France) [5]. The method is based on the classification of the TM image and the estimation of spectral profiles of each TM class in the mixed MERIS pixels ( see figure 11) . The best characteristics of the two images (spatial, spectral, temporal) are then preserved in the resulting image ( see Figure 11).
Fig. 11: MERIS and TM images fusion methodology [5].
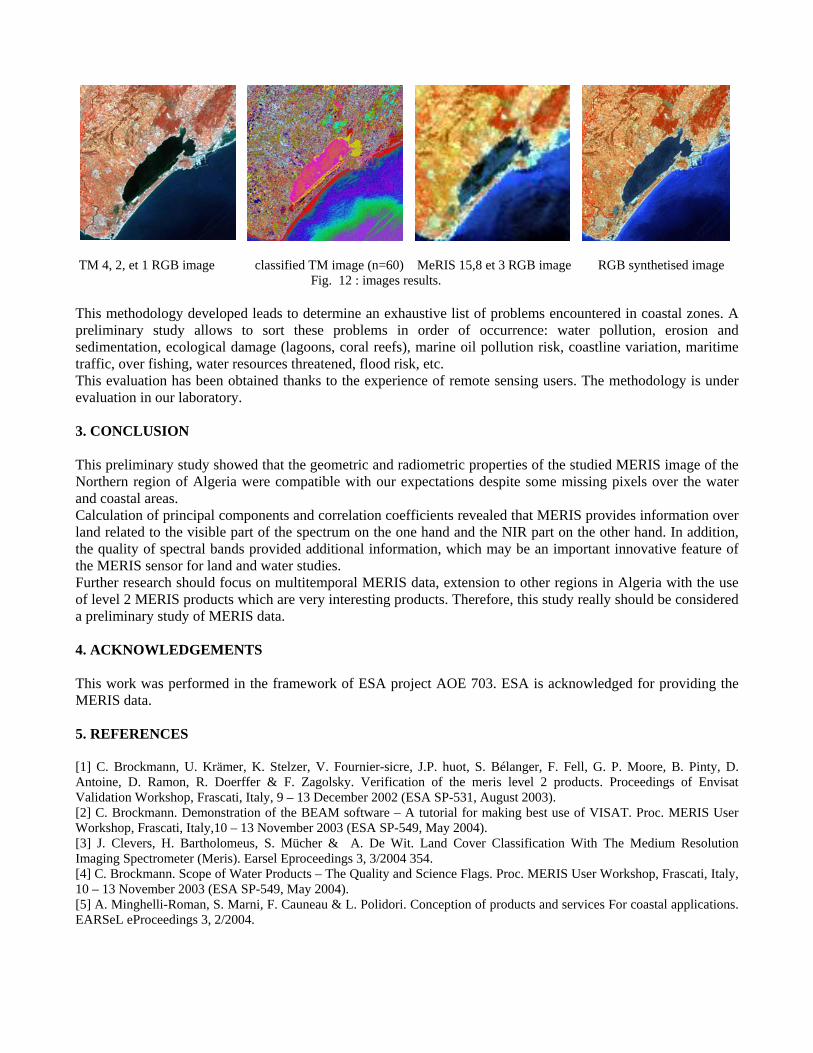
TM 4, 2, et 1 RGB image classified TM image (n=60) MeRIS 15,8 et 3 RGB image RGB synthetised image Fig. 12 : images results. This methodology developed leads to determine an exhaustive list of problems encountered in coastal zones. A preliminary study allows to sort these problems in order of occurrence: water pollution, erosion and sedimentation, ecological damage (lagoons, coral reefs), marine oil pollution risk, coastline variation, maritime traffic, over fishing, water resources threatened, flood risk, etc. This evaluation has been obtained thanks to the experience of remote sensing users. The methodology is under evaluation in our laboratory. 3. CONCLUSION This preliminary study showed that the geometric and radiometric properties of the studied MERIS image of the Northern region of Algeria were compatible with our expectations despite some missing pixels over the water and coastal areas. Calculation of principal components and correlation coefficients revealed that MERIS provides information over land related to the visible part of the spectrum on the one hand and the NIR part on the other hand. In addition, the quality of spectral bands provided additional information, which may be an important innovative feature of the MERIS sensor for land and water studies. Further research should focus on multitemporal MERIS data, extension to other regions in Algeria with the use of level 2 MERIS products which are very interesting products. Therefore, this study really should be considered a preliminary study of MERIS data. 4. ACKNOWLEDGEMENTS This work was performed in the framework of ESA project AOE 703. ESA is acknowledged for providing the MERIS data. 5. REFERENCES [1] C. Brockmann, U. Krämer, K. Stelzer, V. Fournier-sicre, J.P. huot, S. Bélanger, F. Fell, G. P. Moore, B. Pinty, D. Antoine, D. Ramon, R. Doerffer & F. Zagolsky. Verification of the meris level 2 products. Proceedings of Envisat Validation Workshop, Frascati, Italy, 9 – 13 December 2002 (ESA SP-531, August 2003). [2] C. Brockmann. Demonstration of the BEAM software – A tutorial for making best use of VISAT. Proc. MERIS User Workshop, Frascati, Italy,10 – 13 November 2003 (ESA SP-549, May 2004). [3] J. Clevers, H. Bartholomeus, S. Mücher & A. De Wit. Land Cover Classification With The Medium Resolution Imaging Spectrometer (Meris). Earsel Eproceedings 3, 3/2004 354. [4] C. Brockmann. Scope of Water Products – The Quality and Science Flags. Proc. MERIS User Workshop, Frascati, Italy, 10 – 13 November 2003 (ESA SP-549, May 2004). [5] A. Minghelli-Roman, S. Marni, F. Cauneau & L. Polidori. Conception of products and services For coastal applications. EARSeL eProceedings 3, 2/2004.


![SUSPENDED PARTICULATE MATTER ON A REGIONAL SCALE …earth.esa.int/workshops/meris_aatsr2005/... · Fig.3. - Chlorophyll-“a” concentration [mg m-3] on the sea obtained from MERIS](https://img.dokumen.tips/doc/110x75/5f0cc6ec7e708231d4371445/suspended-particulate-matter-on-a-regional-scale-earthesaintworkshopsmerisaatsr2005.jpg)


