Embed Size (px)
Citation preview

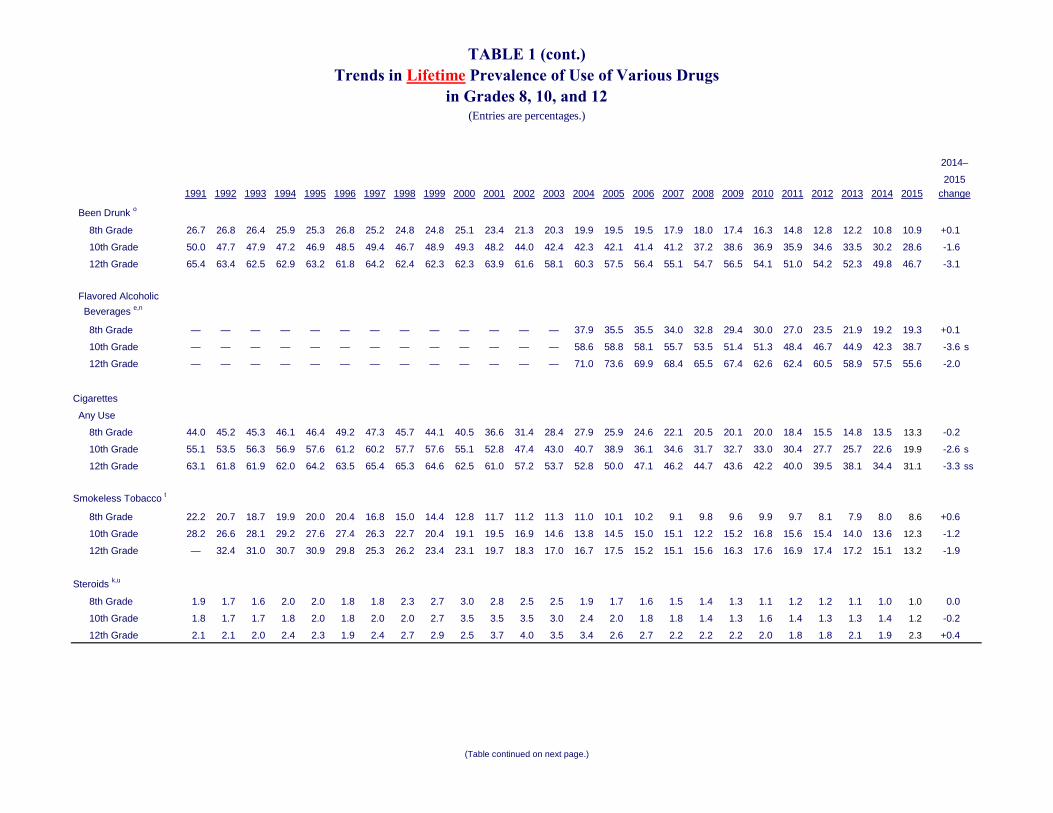
Dec. 16, 2015 Contacts: Jared Wadley, 7349367819, [email protected] Janice Lee, 7346471083, [email protected] UM has a satellite uplink TV studio and an ISDN radio line for interviews. EMBARGOED FOR RELEASE AT 12:01 A.M. ET WEDNESDAY, DEC. 16, 2015 Use of ecstasy, heroin, synthetic marijuana, alcohol, cigarettes declined among US teens in 2015 ANN ARBOR—The results from the latest national survey in the Monitoring the Future series on use of licit and illicit drugs by American teenagers show that some important improvements are taking place. The use of both alcohol and cigarettes reached their lowest points since the study began in 1975. Use of several particularly dangerous illicit drugs—including MDMA (ecstasy, Molly), heroin, amphetamines and synthetic marijuana—also showed a decline this year. Marijuana use, however, remained level. Monitoring the Future tracks trends in substance use by surveying over 40,000 8th, 10th and 12thgrade students each year located in about 400 public and private secondary schools across the contiguous 48 states. Now in its 41st year, MTF is conducted by a team of research professors at the University of Michigan and is sponsored by the National Institute on Drug Abuse. ALCOHOL Alcohol use by the nation's teens continued its longterm decline in 2015. The three grades combined (8, 10 and 12) showed a further decline in the proportion of students reporting any alcohol use in the 12 months preceding the survey (annual prevalence) and also in the 30 days preceding the survey (30day prevalence). In 2015, these rates are at 40 percent and 22 percent, respectively—the lowest levels seen since the study began. Although the oneyear decline in these two measures did not reach statistical significance, their longerterm declines were highly significant. Further, binge drinking (having five or more drinks in a row on one or more occasions in the prior two weeks) did decline significantly in 2015. Binge drinking is now reported by 5 percent of 8thgraders, 11 percent of 10thgraders and 17 percent of 12thgraders.

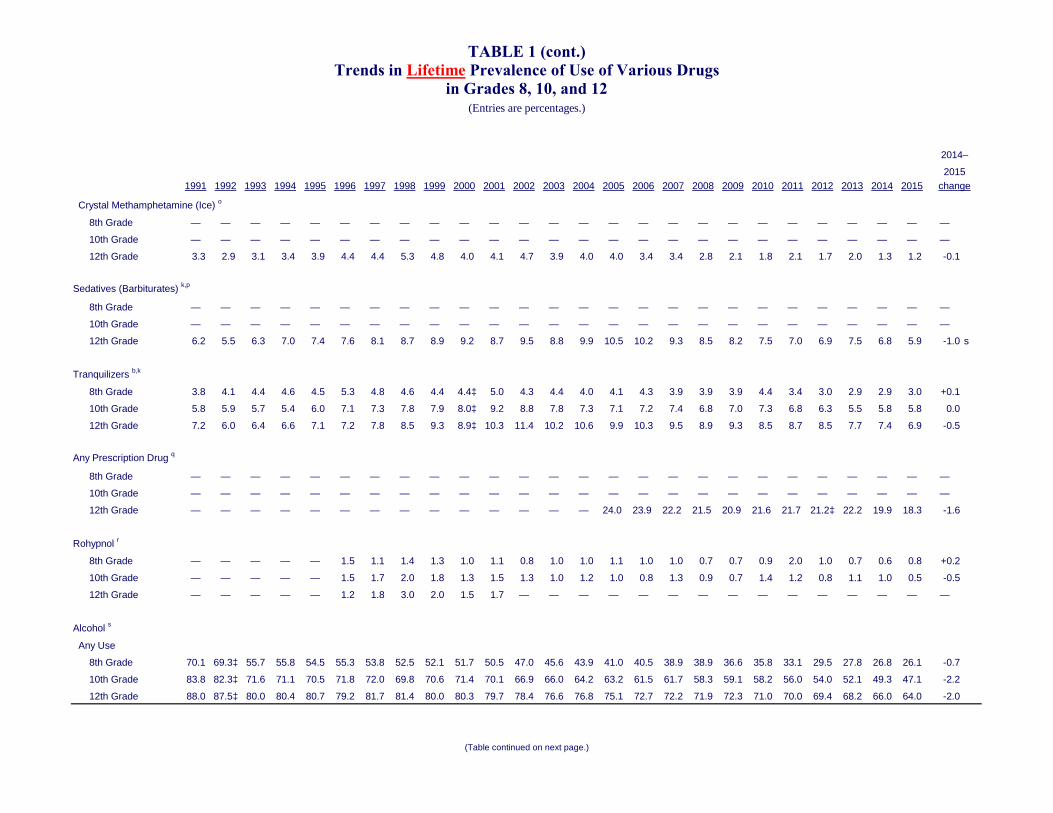
"The recent peak rate in annual prevalence of alcohol use was in 1997, at 61 percent for the three grades combined. Since then, there has been a fairly steady downward march in alcohol use among adolescents," said Professor Lloyd Johnston, the study's principal investigator. "The rate has fallen by about a third, to 40 percent. More importantly, the percentage who report binge drinking has fallen by half, from 22 percent to 11 percent." Some 12thgraders drink even more heavily than five or more drinks in a row, reporting 10 or more, or 15 or more, drinks in a row on at least one occasion in the prior two weeks—dangerously high levels of consumption that the investigators have labeled "extreme binge drinking." Since 2005 (the first year that they were measured), these rates have declined, from 10.6 percent in 2005 to 6.1 percent in 2015 reporting having had 10 or more drinks in a row in the prior two weeks, and from 5.7 percent to 3.5 percent for having had 15 or more drinks in a row. Peer disapproval of binge drinking had been rising since 2000 among teens, though it did not rise further in 2015. Declines in availability may be another contributing factor to the declines in teen drinking. "In recent years, there has been a fair decline in all three grades in the proportion saying that alcohol is easy for them to get, with the steepest decline among the youngest teens," Johnston said. "This suggests that state, community and parental efforts have been successful in reducing underage access to alcohol." Johnston points out, however, that the majority of students in all three grades still report that they can get alcohol if they want some. CIGARETTES Cigarette use by teens also reached an alltime low for the study in 2015. For more information on that finding, see http://bit.ly/1TXvK3E. ILLICIT DRUGS Several illicit drugs showed declines in use this year. There were declines in students' use of MDMA (ecstasy, Molly), heroin, synthetic marijuana ("K2," "Spice") and amphetamines. The investigators say there were no statistically significant increases for any of the more than 50 classes and subclasses of drugs that MTF tracks among 8th, 10th and 12thgrade students. MDMA (known as ecstasy and, more recently, as Molly) has been falling in use since about 2010. The advent of the term "Molly," referring to a strong form of ecstasy, led to its inclusion as an example in the question on ecstasy (MDMA) use in the 2014 and 2015 surveys. This resulted in a somewhat higher reported prevalence (in 2014, for example, 5.0 percent of 12thgraders reported MDMA use in the prior 12 months when

Molly was included as an example vs. 3.6 percent who indicated use when Molly was not included). Nevertheless, the use of MDMA as measured by the new question continued to show significant declines in 2015 among 10th and 12thgraders, even with Molly included. Inclusion of Molly in the question about perceived risk to the user produced a considerable jump in the proportions of 8th and 10thgraders saying MDMA use is dangerous to the user. Reported availability of ecstasy (MDMA), specifically, has been declining since the peak year of use in 2001, but there was little further decline in 2015. Heroin, one of the most dangerous illicit drugs, is of particular importance. The proportion of secondary school students using heroin has been falling gradually in the past few years, and it continued to fall some in all three grades in 2015. Among 8thgraders, the proportion reporting any heroin use in the prior 12 months fell significantly from 0.5 percent to 0.3 percent; and their annual prevalence is down by twothirds since 2008, when it was 0.9 percent. In both 10th and 12th grades, annual prevalence fell in 2015 by onetenth of one percent to 0.5 percent (not a statistically significant change, but the decline for the three grades combined was significant). Both of these upper grades did have an annual prevalence above 1.0 percent at the beginning of the 2000s, so their rates of heroin use have now fallen by more than half. The improvements this year were almost entirely in taking heroin using a needle—the most dangerous form of use. There was little change in the prevalence of taking heroin without using a needle. This decline in heroin use was not accompanied by an increase in the use of other narcotic drugs. Past year use of narcotic drugs other than heroin (reported only for grade 12) did not show any increase as heroin declined. In fact, annual prevalence fell from 6.1 percent to 5.4 percent in 2015 (not a statistically significant change). Use of this class of drugs actually has been in decline since 2009, when annual prevalence reached 9.2 percent. "So, among secondary school students, at least, it appears that the use of heroin and of other narcotics both have been declining in parallel for the past five or six years, with no evidence of any overall displacement from use of one to use of the other," Johnston said. "That is not to say that individual users do not show displacement, as has been widely reported in the media." In addition, evidence of a spike in heroin use in recent years, covered in many recent media reports, seems to be driven mainly by people of older ages and not adolescents.[1] Synthetic marijuana ("K2," "Spice") has synthetic chemical components of marijuana, or cannabinoids, sprayed onto shredded plant material, which is then smoked. It has

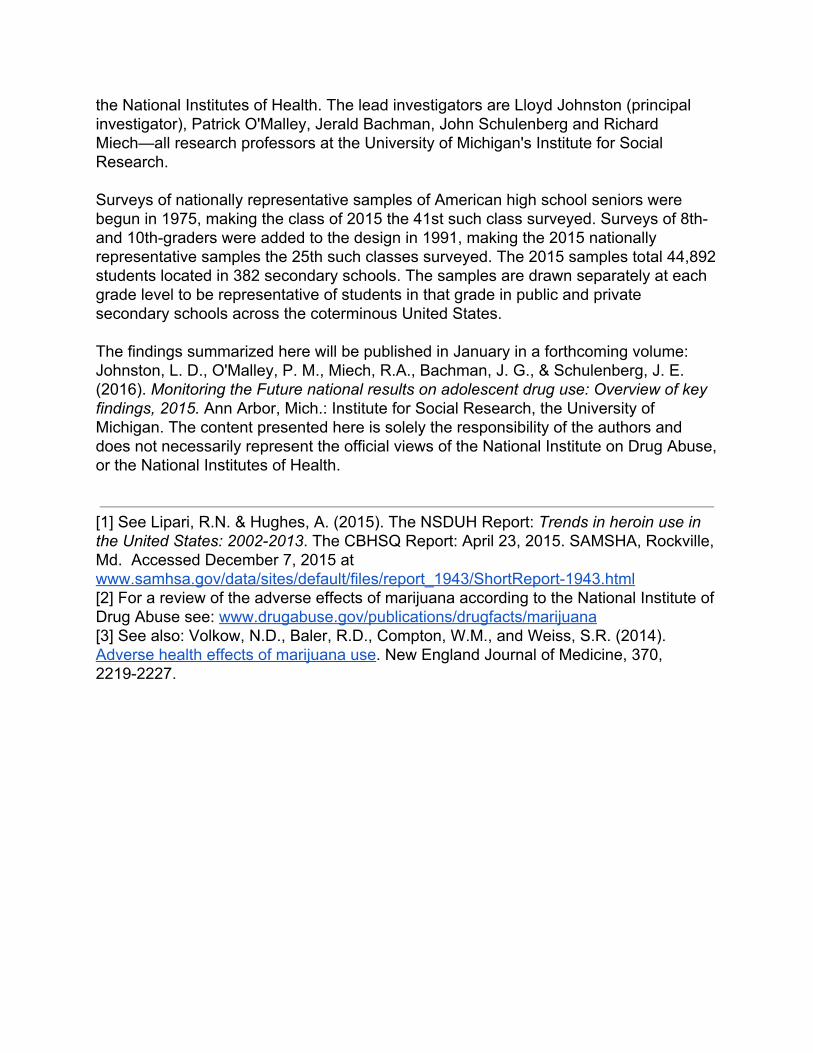
been sold over the counter in many states—particularly in gas stations, convenience stores and head shops. It is often imported from overseas and can be very potent and unpredictable both in its chemical content and in its effects, resulting in a number of emergency room admissions. "Efforts at the federal and state levels to close down the sale of these substances appear to be having an effect," Johnston said. Use fell by a statistically significant amount in 2015 for the three grades combined. The proportions saying they used any synthetic marijuana in the past 12 months now stand at 3 percent, 4 percent and 5 percent in grades 8, 10 and 12, respectively—down considerably from the 4 percent, 9 percent and 11 percent observed in those same grades in 2012. "While there has been some increase in the proportion of students seeing use of this drug as dangerous, it hardly seems enough to account for the considerable declines in use, which leads us to conclude that efforts to reduce availability have been successful to some degree," Johnston said. Amphetamine use showed some decline in 2015. The decrease in annual prevalence for the three grades combined from 6.6 percent to 6.2 percent did not reach statistical significance. But the decline in past 30day prevalence from 3.2 percent to 2.7 percent did, suggesting that the decline is fairly recent. Reported availability of amphetamines has been in decline in all three grades for some years. Prescription drug misuse is measured with an index that includes use of narcotics, sedatives, tranquilizers and/or amphetamines without medical supervision (only 12thgraders report on their use of all of these drugs). Prescription drug misuse has been of considerable public health concern in recent years because most of these drugs showed a substantial increase in use in the 1990s, which then continued into the first decade of the 2000s when many of the illegal drugs had already started to decline. But misuse of any prescription drug among 12thgraders has shown a gradual decline since 2005, when annual prevalence was 17 percent, including a nonsignificant further decline in 2015 from 14 percent to 13 percent. Other Drugs. Among the many other drugs covered in the study, none showed significant increases or decreases in use this year. A number already have shown appreciable declines in use in the past, such as "bath salts," LSD, other hallucinogens, salvia, crack, methamphetamine and inhalants. Also relatively unchanged were the proportions of students saying that they used any illicit drug in the past 12 months (15 percent, 28 percent and 39 percent in grades 8, 10 and 12 in 2015), or any illicit drug other than marijuana (6 percent, 11 percent and 15 percent in 2015).

Marijuana, the most widely used of the illicit drugs, did not show any significant change in annual prevalence this year in any of the three grades, nor in the three grades combined. After rising for several years, the annual prevalence of marijuana has more or less leveled out since about 2010. This year, 12 percent of 8thgraders, 25 percent of 10thgraders and 35 percent of 12thgraders reported using marijuana at least once in the prior 12 months. Of more importance, perhaps, is their daily or neardaily marijuana use (defined as smoking marijuana on 20 or more occasions in the past 30 days). These rates stand at 1.1 percent, 3.0 percent and 6.0 percent in 8th, 10th and 12th grades, respectively. In other words, one in every 16 or 17 high school seniors is smoking marijuana daily or near daily. These rates have changed rather little since 2010, but are from threetosix times higher than they were at their low point in 1991. "The proportion of our young people smoking marijuana this frequently remains a matter of concern," Johnston said.[2],[3] He notes that the percent of students who see regular marijuana use as carrying a great risk of harm has declined substantially since about 2005, and is still declining. Over the past 10 years, the percent seeing a great risk in regular marijuana use has fallen among 8thgraders from 74 percent to 58 percent, among 10thgraders from 66 percent to 43 percent and among 12thgraders from 58 percent to 32 percent. "Perceived risk is usually a deterrent to use and it is clear that this deterrent has weakened considerably," Johnston said. "In sum, there is a lot of good news in this year's results, but the problems of teen substance use and abuse are still far from going away. "We see a cyclical pattern in the more than 40 years of observations we have made with this study. When things are much improved is when the country is most likely to take its eye off the issue of drug abuse, as happened in the early 1990s, and fail to deter the incoming generation of young people from using drugs, including the many new drugs that inevitably come along." Tables and figures Monitoring the Future Related story on teens and cigarette use Related story on teens and cigarillo use Related story on teens and ecigarette use
# # # # # Monitoring the Future has been funded under a series of competing, investigatorinitiated research grants from the National Institute on Drug Abuse, one of
the National Institutes of Health. The lead investigators are Lloyd Johnston (principal investigator), Patrick O'Malley, Jerald Bachman, John Schulenberg and Richard Miech—all research professors at the University of Michigan's Institute for Social Research. Surveys of nationally representative samples of American high school seniors were begun in 1975, making the class of 2015 the 41st such class surveyed. Surveys of 8th and 10thgraders were added to the design in 1991, making the 2015 nationally representative samples the 25th such classes surveyed. The 2015 samples total 44,892 students located in 382 secondary schools. The samples are drawn separately at each grade level to be representative of students in that grade in public and private secondary schools across the coterminous United States. The findings summarized here will be published in January in a forthcoming volume: Johnston, L. D., O'Malley, P. M., Miech, R.A., Bachman, J. G., & Schulenberg, J. E. (2016). Monitoring the Future national results on adolescent drug use: Overview of key findings, 2015. Ann Arbor, Mich.: Institute for Social Research, the University of Michigan. The content presented here is solely the responsibility of the authors and does not necessarily represent the official views of the National Institute on Drug Abuse, or the National Institutes of Health.
[1] See Lipari, R.N. & Hughes, A. (2015). The NSDUH Report: Trends in heroin use in the United States: 20022013. The CBHSQ Report: April 23, 2015. SAMSHA, Rockville, Md. Accessed December 7, 2015 at www.samhsa.gov/data/sites/default/files/report_1943/ShortReport1943.html [2] For a review of the adverse effects of marijuana according to the National Institute of Drug Abuse see: www.drugabuse.gov/publications/drugfacts/marijuana [3] See also: Volkow, N.D., Baler, R.D., Compton, W.M., and Weiss, S.R. (2014). Adverse health effects of marijuana use. New England Journal of Medicine, 370, 22192227.

1991 1992 1993 1994 1995 1996 1997 1998 1999 2000 2001 2002 2003 2004 2005 2006 2007 2008 2009 2010 2011 2012 2013 2014 2015
8th Grade 18.7 20.6 22.5 25.7 28.5 31.2 29.4 29.0 28.3 26.8 26.8 24.5 22.8 21.5 21.4 20.9 19.0 19.6 19.9 21.4 20.1 18.5‡ 21.1 20.3 20.5 +0.2
10th Grade 30.6 29.8 32.8 37.4 40.9 45.4 47.3 44.9 46.2 45.6 45.6 44.6 41.4 39.8 38.2 36.1 35.6 34.1 36.0 37.0 37.7 36.8‡ 39.1 37.4 34.7 -2.7 s
12th Grade 44.1 40.7 42.9 45.6 48.4 50.8 54.3 54.1 54.7 54.0 53.9 53.0 51.1 51.1 50.4 48.2 46.8 47.4 46.7 48.2 49.9 49.1‡ 49.8 49.1 48.9 -0.1
Any Illicit Drug other
8th Grade 14.3 15.6 16.8 17.5 18.8 19.2 17.7 16.9 16.3 15.8‡ 17.0 13.7 13.6 12.2 12.1 12.2 11.1 11.2 10.4 10.6 9.8 8.7‡ 10.4 10.0 10.3 +0.3
10th Grade 19.1 19.2 20.9 21.7 24.3 25.5 25.0 23.6 24.0 23.1‡ 23.6 22.1 19.7 18.8 18.0 17.5 18.2 15.9 16.7 16.8 15.6 14.9‡ 16.4 15.9 14.6 -1.3
12th Grade 26.9 25.1 26.7 27.6 28.1 28.5 30.0 29.4 29.4 29.0‡ 30.7 29.5 27.7 28.7 27.4 26.9 25.5 24.9 24.0 24.7 24.9 24.1‡ 24.8 22.6 21.1 -1.5
including Inhalants a,c
8th Grade 28.5 29.6 32.3 35.1 38.1 39.4 38.1 37.8 37.2 35.1 34.5 31.6 30.3 30.2 30.0 29.2 27.7 28.3 27.9 28.6 26.4 25.1‡ 25.9 25.2 24.9 -0.4
10th Grade 36.1 36.2 38.7 42.7 45.9 49.8 50.9 49.3 49.9 49.3 48.8 47.7 44.9 43.1 42.1 40.1 39.8 38.7 40.0 40.6 40.8 40.0‡ 41.6 40.4 37.2 -3.2 s
12th Grade 47.6 44.4 46.6 49.1 51.5 53.5 56.3 56.1 56.3 57.0 56.0 54.6 52.8 53.0 53.5 51.2 49.1 49.3 48.4 49.9 51.8 50.3‡ 52.3 49.9 51.4 +1.5
8th Grade 10.2 11.2 12.6 16.7 19.9 23.1 22.6 22.2 22.0 20.3 20.4 19.2 17.5 16.3 16.5 15.7 14.2 14.6 15.7 17.3 16.4 15.2 16.5 15.6 15.5 -0.1
10th Grade 23.4 21.4 24.4 30.4 34.1 39.8 42.3 39.6 40.9 40.3 40.1 38.7 36.4 35.1 34.1 31.8 31.0 29.9 32.3 33.4 34.5 33.8 35.8 33.7 31.1 -2.6 s
12th Grade 36.7 32.6 35.3 38.2 41.7 44.9 49.6 49.1 49.7 48.8 49.0 47.8 46.1 45.7 44.8 42.3 41.8 42.6 42.0 43.8 45.5 45.2 45.5 44.4 44.7 +0.3
8th Grade 17.6 17.4 19.4 19.9 21.6 21.2 21.0 20.5 19.7 17.9 17.1 15.2 15.8 17.3 17.1 16.1 15.6 15.7 14.9 14.5 13.1 11.8 10.8 10.8 9.4 -1.4 s
10th Grade 15.7 16.6 17.5 18.0 19.0 19.3 18.3 18.3 17.0 16.6 15.2 13.5 12.7 12.4 13.1 13.3 13.6 12.8 12.3 12.0 10.1 9.9 8.7 8.7 7.2 -1.5 ss
12th Grade 17.6 16.6 17.4 17.7 17.4 16.6 16.1 15.2 15.4 14.2 13.0 11.7 11.2 10.9 11.4 11.1 10.5 9.9 9.5 9.0 8.1 7.9 6.9 6.5 5.7 -0.8
8th Grade 3.2 3.8 3.9 4.3 5.2 5.9 5.4 4.9 4.8 4.6‡ 5.2 4.1 4.0 3.5 3.8 3.4 3.1 3.3 3.0 3.4 3.3 2.8 2.5 2.0 2.0 0.0
10th Grade 6.1 6.4 6.8 8.1 9.3 10.5 10.5 9.8 9.7 8.9‡ 8.9 7.8 6.9 6.4 5.8 6.1 6.4 5.5 6.1 6.1 6.0 5.2 5.4 5.0 4.6 -0.4
12th Grade 9.6 9.2 10.9 11.4 12.7 14.0 15.1 14.1 13.7 13.0‡ 14.7 12.0 10.6 9.7 8.8 8.3 8.4 8.7 7.4 8.6 8.3 7.5 7.6 6.3 6.4 0.0
Inhalants c,d
Hallucinogens b,f
(Table continued on next page.)
2015
TABLE 1Trends in Lifetime Prevalence of Use of Various Drugs
in Grades 8, 10, and 12
2014–
(Entries are percentages.)
change
Any Illicit Drug a
than Marijuana a,b
Any Illicit Drug
Marijuana/Hashish

1991 1992 1993 1994 1995 1996 1997 1998 1999 2000 2001 2002 2003 2004 2005 2006 2007 2008 2009 2010 2011 2012 2013 2014 2015
8th Grade 2.7 3.2 3.5 3.7 4.4 5.1 4.7 4.1 4.1 3.9 3.4 2.5 2.1 1.8 1.9 1.6 1.6 1.9 1.7 1.8 1.7 1.3 1.4 1.1 1.3 +0.2
10th Grade 5.6 5.8 6.2 7.2 8.4 9.4 9.5 8.5 8.5 7.6 6.3 5.0 3.5 2.8 2.5 2.7 3.0 2.6 3.0 3.0 2.8 2.6 2.7 2.6 3.0 +0.4
12th Grade 8.8 8.6 10.3 10.5 11.7 12.6 13.6 12.6 12.2 11.1 10.9 8.4 5.9 4.6 3.5 3.3 3.4 4.0 3.1 4.0 4.0 3.8 3.9 3.7 4.3 +0.6
8th Grade 1.4 1.7 1.7 2.2 2.5 3.0 2.6 2.5 2.4 2.3‡ 3.9 3.3 3.2 3.0 3.3 2.8 2.6 2.5 2.4 2.7 2.8 2.3 1.9 1.5 1.2 -0.3
10th Grade 2.2 2.5 2.8 3.8 3.9 4.7 4.8 5.0 4.7 4.8‡ 6.6 6.3 5.9 5.8 5.2 5.5 5.7 4.8 5.4 5.3 5.2 4.5 4.4 4.1 3.3 -0.7 s
12th Grade 3.7 3.3 3.9 4.9 5.4 6.8 7.5 7.1 6.7 6.9‡ 10.4 9.2 9.0 8.7 8.1 7.8 7.7 7.8 6.8 7.7 7.3 6.6 6.4 5.1 4.8 -0.3
8th Grade, original — — — — — 3.4 3.2 2.7 2.7 4.3 5.2 4.3 3.2 2.8 2.8 2.5 2.3 2.4 2.2 3.3 2.6 2.0 1.8 1.4 — —
— — — — — — — — — — — — — — — — — — — — — — — 2.4 2.3 -0.1
10th Grade,original — — — — — 5.6 5.7 5.1 6.0 7.3 8.0 6.6 5.4 4.3 4.0 4.5 5.2 4.3 5.5 6.4 6.6 5.0 5.7 3.7 — —
— — — — — — — — — — — — — — — — — — — — — — — 5.2 3.8 -1.4 s
12th Grade, original — — — — — 6.1 6.9 5.8 8.0 11.0 11.7 10.5 8.3 7.5 5.4 6.5 6.5 6.2 6.5 7.3 8.0 7.2 7.1 5.6 — —
— — — — — — — — — — — — — — — — — — — — — — — 7.9 5.9 -2.0 s
8th Grade 2.3 2.9 2.9 3.6 4.2 4.5 4.4 4.6 4.7 4.5 4.3 3.6 3.6 3.4 3.7 3.4 3.1 3.0 2.6 2.6 2.2 1.9 1.7 1.8 1.6 -0.2
10th Grade 4.1 3.3 3.6 4.3 5.0 6.5 7.1 7.2 7.7 6.9 5.7 6.1 5.1 5.4 5.2 4.8 5.3 4.5 4.6 3.7 3.3 3.3 3.3 2.6 2.7 +0.1
12th Grade 7.8 6.1 6.1 5.9 6.0 7.1 8.7 9.3 9.8 8.6 8.2 7.8 7.7 8.1 8.0 8.5 7.8 7.2 6.0 5.5 5.2 4.9 4.5 4.6 4.0 -0.5
8th Grade 1.3 1.6 1.7 2.4 2.7 2.9 2.7 3.2 3.1 3.1 3.0 2.5 2.5 2.4 2.4 2.3 2.1 2.0 1.7 1.5 1.5 1.0 1.2 1.2 1.0 -0.3
10th Grade 1.7 1.5 1.8 2.1 2.8 3.3 3.6 3.9 4.0 3.7 3.1 3.6 2.7 2.6 2.5 2.2 2.3 2.0 2.1 1.8 1.6 1.4 1.5 1.0 1.1 +0.1
12th Grade 3.1 2.6 2.6 3.0 3.0 3.3 3.9 4.4 4.6 3.9 3.7 3.8 3.6 3.9 3.5 3.5 3.2 2.8 2.4 2.4 1.9 2.1 1.8 1.8 1.7 0.0
8th Grade 2.0 2.4 2.4 3.0 3.4 3.8 3.5 3.7 3.8 3.5 3.3 2.8 2.7 2.6 2.9 2.7 2.6 2.4 2.1 2.1 1.8 1.6 1.4 1.4 1.3 -0.1
10th Grade 3.8 3.0 3.3 3.8 4.4 5.5 6.1 6.4 6.8 6.0 5.0 5.2 4.5 4.8 4.6 4.3 4.8 4.0 4.1 3.4 3.0 3.0 2.9 2.2 2.3 +0.1
12th Grade 7.0 5.3 5.4 5.2 5.1 6.4 8.2 8.4 8.8 7.7 7.4 7.0 6.7 7.3 7.1 7.9 6.8 6.5 5.3 5.1 4.9 4.4 4.2 4.1 3.4 -0.7
LSD b
Hallucinogens other than LSD b
Revised
Revised
Revised
Ecstasy (MDMA) g
Other Cocaine h
Cocaine
Crack
(Table continued on next page.)
TABLE 1 (cont.)Trends in Lifetime Prevalence of Use of Various Drugs
in Grades 8, 10, and 12(Entries are percentages.)
2014–
2015change

1991 1992 1993 1994 1995 1996 1997 1998 1999 2000 2001 2002 2003 2004 2005 2006 2007 2008 2009 2010 2011 2012 2013 2014 2015
8th Grade 1.2 1.4 1.4 2.0 2.3 2.4 2.1 2.3 2.3 1.9 1.7 1.6 1.6 1.6 1.5 1.4 1.3 1.4 1.3 1.3 1.2 0.8 1.0 0.9 0.5 -0.5 sss
10th Grade 1.2 1.2 1.3 1.5 1.7 2.1 2.1 2.3 2.3 2.2 1.7 1.8 1.5 1.5 1.5 1.4 1.5 1.2 1.5 1.3 1.2 1.1 1.0 0.9 0.7 -0.2
12th Grade 0.9 1.2 1.1 1.2 1.6 1.8 2.1 2.0 2.0 2.4 1.8 1.7 1.5 1.5 1.5 1.4 1.5 1.3 1.2 1.6 1.4 1.1 1.0 1.0 0.8 -0.2
8th Grade — — — — 1.5 1.6 1.3 1.4 1.6 1.1 1.2 1.0 1.0 1.1 1.0 1.0 0.9 0.9 0.9 0.9 0.8 0.6 0.6 0.8 0.3 -0.5 sss
10th Grade — — — — 1.0 1.1 1.1 1.2 1.3 1.0 0.8 1.0 0.9 0.8 0.8 0.9 0.9 0.7 0.9 0.8 0.8 0.7 0.7 0.6 0.5 -0.1
12th Grade — — — — 0.7 0.8 0.9 0.8 0.9 0.8 0.7 0.8 0.7 0.7 0.9 0.8 0.7 0.7 0.6 1.1 0.9 0.7 0.7 0.8 0.6 -0.2
8th Grade — — — — 1.5 1.6 1.4 1.5 1.4 1.3 1.1 1.0 1.1 1.0 0.9 0.9 0.7 0.9 0.8 0.7 0.7 0.5 0.5 0.4 0.3 -0.1
10th Grade — — — — 1.1 1.7 1.7 1.7 1.6 1.7 1.3 1.3 1.0 1.1 1.1 1.0 1.1 0.8 1.0 0.9 0.8 0.8 0.7 0.5 0.4 -0.1
12th Grade — — — — 1.4 1.7 2.1 1.6 1.8 2.4 1.5 1.6 1.8 1.4 1.3 1.1 1.4 1.1 0.9 1.4 1.3 0.8 0.9 0.7 0.7 0.0
8th Grade — — — — — — — — — — — — — — — — — — — — — — — — — —
10th Grade — — — — — — — — — — — — — — — — — — — — — — — — — —
12th Grade 6.6 6.1 6.4 6.6 7.2 8.2 9.7 9.8 10.2 10.6 9.9‡ 13.5 13.2 13.5 12.8 13.4 13.1 13.2 13.2 13.0 13.0 12.2 11.1 9.5 8.4 -1.0 s
8th Grade 10.5 10.8 11.8 12.3 13.1 13.5 12.3 11.3 10.7 9.9 10.2 8.7 8.4 7.5 7.4 7.3 6.5 6.8 6.0 5.7 5.2 4.5‡ 6.9 6.7 6.8 +0.1
10th Grade 13.2 13.1 14.9 15.1 17.4 17.7 17.0 16.0 15.7 15.7 16.0 14.9 13.1 11.9 11.1 11.2 11.1 9.0 10.3 10.6 9.0 8.9‡ 11.2 10.6 9.7 -0.9
12th Grade 15.4 13.9 15.1 15.7 15.3 15.3 16.5 16.4 16.3 15.6 16.2 16.8 14.4 15.0 13.1 12.4 11.4 10.5 9.9 11.1 12.2 12.0‡ 13.8 12.1 10.8 -1.2
Methamphetamine n,o
8th Grade — — — — — — — — 4.5 4.2 4.4 3.5 3.9 2.5 3.1 2.7 1.8 2.3 1.6 1.8 1.3 1.3 1.4 1.0 0.8 -0.2
10th Grade — — — — — — — — 7.3 6.9 6.4 6.1 5.2 5.3 4.1 3.2 2.8 2.4 2.8 2.5 2.1 1.8 1.6 1.4 1.3 -0.1
12th Grade — — — — — — — — 8.2 7.9 6.9 6.7 6.2 6.2 4.5 4.4 3.0 2.8 2.4 2.3 2.1 1.7 1.5 1.9 1.0 -0.9 ss
change
Heroin i
Narcotics other than Heroin k,l
TABLE 1 (cont.)Trends in Lifetime Prevalence of Use of Various Drugs
in Grades 8, 10, and 12
Without a Needle j
(Entries are percentages.)
2014–
With a Needle j
2015
Amphetamines k,m
(Table continued on next page.)
1991 1992 1993 1994 1995 1996 1997 1998 1999 2000 2001 2002 2003 2004 2005 2006 2007 2008 2009 2010 2011 2012 2013 2014 2015
8th Grade — — — — — — — — — — — — — — — — — — — — — — — — — —
10th Grade — — — — — — — — — — — — — — — — — — — — — — — — — —
12th Grade 3.3 2.9 3.1 3.4 3.9 4.4 4.4 5.3 4.8 4.0 4.1 4.7 3.9 4.0 4.0 3.4 3.4 2.8 2.1 1.8 2.1 1.7 2.0 1.3 1.2 -0.1
Sedatives (Barbiturates) k,p
8th Grade — — — — — — — — — — — — — — — — — — — — — — — — — —
10th Grade — — — — — — — — — — — — — — — — — — — — — — — — — —
12th Grade 6.2 5.5 6.3 7.0 7.4 7.6 8.1 8.7 8.9 9.2 8.7 9.5 8.8 9.9 10.5 10.2 9.3 8.5 8.2 7.5 7.0 6.9 7.5 6.8 5.9 -1.0 s
8th Grade 3.8 4.1 4.4 4.6 4.5 5.3 4.8 4.6 4.4 4.4‡ 5.0 4.3 4.4 4.0 4.1 4.3 3.9 3.9 3.9 4.4 3.4 3.0 2.9 2.9 3.0 +0.1
10th Grade 5.8 5.9 5.7 5.4 6.0 7.1 7.3 7.8 7.9 8.0‡ 9.2 8.8 7.8 7.3 7.1 7.2 7.4 6.8 7.0 7.3 6.8 6.3 5.5 5.8 5.8 0.0
12th Grade 7.2 6.0 6.4 6.6 7.1 7.2 7.8 8.5 9.3 8.9‡ 10.3 11.4 10.2 10.6 9.9 10.3 9.5 8.9 9.3 8.5 8.7 8.5 7.7 7.4 6.9 -0.5
Any Prescription Drug q
8th Grade — — — — — — — — — — — — — — — — — — — — — — — — — —
10th Grade — — — — — — — — — — — — — — — — — — — — — — — — — —
12th Grade — — — — — — — — — — — — — — 24.0 23.9 22.2 21.5 20.9 21.6 21.7 21.2‡ 22.2 19.9 18.3 -1.6
8th Grade — — — — — 1.5 1.1 1.4 1.3 1.0 1.1 0.8 1.0 1.0 1.1 1.0 1.0 0.7 0.7 0.9 2.0 1.0 0.7 0.6 0.8 +0.2
10th Grade — — — — — 1.5 1.7 2.0 1.8 1.3 1.5 1.3 1.0 1.2 1.0 0.8 1.3 0.9 0.7 1.4 1.2 0.8 1.1 1.0 0.5 -0.5
12th Grade — — — — — 1.2 1.8 3.0 2.0 1.5 1.7 — — — — — — — — — — — — — — —
8th Grade 70.1 69.3‡ 55.7 55.8 54.5 55.3 53.8 52.5 52.1 51.7 50.5 47.0 45.6 43.9 41.0 40.5 38.9 38.9 36.6 35.8 33.1 29.5 27.8 26.8 26.1 -0.7
10th Grade 83.8 82.3‡ 71.6 71.1 70.5 71.8 72.0 69.8 70.6 71.4 70.1 66.9 66.0 64.2 63.2 61.5 61.7 58.3 59.1 58.2 56.0 54.0 52.1 49.3 47.1 -2.2
12th Grade 88.0 87.5‡ 80.0 80.4 80.7 79.2 81.7 81.4 80.0 80.3 79.7 78.4 76.6 76.8 75.1 72.7 72.2 71.9 72.3 71.0 70.0 69.4 68.2 66.0 64.0 -2.0
Rohypnol r
Alcohol s
Any Use
Crystal Methamphetamine (Ice) o
(Table continued on next page.)
Tranquilizers b,k
TABLE 1 (cont.)Trends in Lifetime Prevalence of Use of Various Drugs
in Grades 8, 10, and 12(Entries are percentages.)
2015change
2014–
1991 1992 1993 1994 1995 1996 1997 1998 1999 2000 2001 2002 2003 2004 2005 2006 2007 2008 2009 2010 2011 2012 2013 2014 2015
8th Grade 26.7 26.8 26.4 25.9 25.3 26.8 25.2 24.8 24.8 25.1 23.4 21.3 20.3 19.9 19.5 19.5 17.9 18.0 17.4 16.3 14.8 12.8 12.2 10.8 10.9 +0.1
10th Grade 50.0 47.7 47.9 47.2 46.9 48.5 49.4 46.7 48.9 49.3 48.2 44.0 42.4 42.3 42.1 41.4 41.2 37.2 38.6 36.9 35.9 34.6 33.5 30.2 28.6 -1.6
12th Grade 65.4 63.4 62.5 62.9 63.2 61.8 64.2 62.4 62.3 62.3 63.9 61.6 58.1 60.3 57.5 56.4 55.1 54.7 56.5 54.1 51.0 54.2 52.3 49.8 46.7 -3.1
Beverages e,n
8th Grade — — — — — — — — — — — — — 37.9 35.5 35.5 34.0 32.8 29.4 30.0 27.0 23.5 21.9 19.2 19.3 +0.1
10th Grade — — — — — — — — — — — — — 58.6 58.8 58.1 55.7 53.5 51.4 51.3 48.4 46.7 44.9 42.3 38.7 -3.6 s
12th Grade — — — — — — — — — — — — — 71.0 73.6 69.9 68.4 65.5 67.4 62.6 62.4 60.5 58.9 57.5 55.6 -2.0
8th Grade 44.0 45.2 45.3 46.1 46.4 49.2 47.3 45.7 44.1 40.5 36.6 31.4 28.4 27.9 25.9 24.6 22.1 20.5 20.1 20.0 18.4 15.5 14.8 13.5 13.3 -0.2
10th Grade 55.1 53.5 56.3 56.9 57.6 61.2 60.2 57.7 57.6 55.1 52.8 47.4 43.0 40.7 38.9 36.1 34.6 31.7 32.7 33.0 30.4 27.7 25.7 22.6 19.9 -2.6 s
12th Grade 63.1 61.8 61.9 62.0 64.2 63.5 65.4 65.3 64.6 62.5 61.0 57.2 53.7 52.8 50.0 47.1 46.2 44.7 43.6 42.2 40.0 39.5 38.1 34.4 31.1 -3.3 ss
Smokeless Tobacco t
8th Grade 22.2 20.7 18.7 19.9 20.0 20.4 16.8 15.0 14.4 12.8 11.7 11.2 11.3 11.0 10.1 10.2 9.1 9.8 9.6 9.9 9.7 8.1 7.9 8.0 8.6 +0.6
10th Grade 28.2 26.6 28.1 29.2 27.6 27.4 26.3 22.7 20.4 19.1 19.5 16.9 14.6 13.8 14.5 15.0 15.1 12.2 15.2 16.8 15.6 15.4 14.0 13.6 12.3 -1.2
12th Grade — 32.4 31.0 30.7 30.9 29.8 25.3 26.2 23.4 23.1 19.7 18.3 17.0 16.7 17.5 15.2 15.1 15.6 16.3 17.6 16.9 17.4 17.2 15.1 13.2 -1.9
8th Grade 1.9 1.7 1.6 2.0 2.0 1.8 1.8 2.3 2.7 3.0 2.8 2.5 2.5 1.9 1.7 1.6 1.5 1.4 1.3 1.1 1.2 1.2 1.1 1.0 1.0 0.0
10th Grade 1.8 1.7 1.7 1.8 2.0 1.8 2.0 2.0 2.7 3.5 3.5 3.5 3.0 2.4 2.0 1.8 1.8 1.4 1.3 1.6 1.4 1.3 1.3 1.4 1.2 -0.2
12th Grade 2.1 2.1 2.0 2.4 2.3 1.9 2.4 2.7 2.9 2.5 3.7 4.0 3.5 3.4 2.6 2.7 2.2 2.2 2.2 2.0 1.8 1.8 2.1 1.9 2.3 +0.4
Cigarettes
Any Use
Been Drunk o
2014–
2015
Steroids k,u
Flavored Alcoholic
(Table continued on next page.)
change
in Grades 8, 10, and 12(Entries are percentages.)
TABLE 1 (cont.)Trends in Lifetime Prevalence of Use of Various Drugs

1991 1992 1993 1994 1995 1996 1997 1998 1999 2000 2001 2002 2003 2004 2005 2006 2007 2008 2009 2010 2011 2012 2013 2014 2015
Previously suveyed drugs that have been dropped.
8th Grade — — — — — — — — — — — — — — — — — — — — — — — — — —
10th Grade — — — — — — — — — — — — — — — — — — — — — — — — — —
12th Grade 1.6 1.5 1.4 1.7 1.5 1.8 2.0 2.7 1.7 0.8 1.9 1.5 1.6 1.3 1.1 1.2 1.2 0.6 1.1 — — — — — — —
8th Grade — — — — — — — — — — — — — — — — — — — — — — — — — —
10th Grade — — — — — — — — — — — — — — — — — — — — — — — — — —
12th Grade 2.9 2.4 2.9 2.8 2.7 4.0 3.9 3.9 3.4 3.4 3.5 3.1 2.5 1.6 2.4 2.2 2.1 1.8 1.7 1.8 2.3 1.6 1.3 — — —
8th Grade — — — — — — — — — — — — — — — — — — — — — — — — — —
10th Grade — — — — — — — — — — — — — — — — — — — — — — — — — —
12th Grade 1.3 1.6 0.8 1.4 1.2 2.0 1.7 1.6 1.8 0.8 1.1 1.5 1.0 1.3 1.3 1.2 1.0 0.8 0.7 0.4 0.6 0.8 — — — —
Source. The Monitoring the Future study, the University of Michigan.
Note: See footnotes following Table 4.
Nitrites e
change
Methaqualone e,k
2015
TABLE 1 (cont.)Trends in Lifetime Prevalence of Use of Various Drugs
in Grades 8, 10, and 12
2014–
(Entries are percentages.)
PCP e

1991 1992 1993 1994 1995 1996 1997 1998 1999 2000 2001 2002 2003 2004 2005 2006 2007 2008 2009 2010 2011 2012 2013 2014 2015
8th Grade 11.3 12.9 15.1 18.5 21.4 23.6 22.1 21.0 20.5 19.5 19.5 17.7 16.1 15.2 15.5 14.8 13.2 14.1 14.5 16.0 14.7 13.4‡ 15.2 14.6 14.8 +0.2
10th Grade 21.4 20.4 24.7 30.0 33.3 37.5 38.5 35.0 35.9 36.4 37.2 34.8 32.0 31.1 29.8 28.7 28.1 26.9 29.4 30.2 31.1 30.1‡ 32.1 29.9 27.9 -2.1
12th Grade 29.4 27.1 31.0 35.8 39.0 40.2 42.4 41.4 42.1 40.9 41.4 41.0 39.3 38.8 38.4 36.5 35.9 36.6 36.5 38.3 40.0 39.7‡ 40.1 38.7 38.6 -0.1
8th Grade 8.4 9.3 10.4 11.3 12.6 13.1 11.8 11.0 10.5 10.2‡ 10.8 8.8 8.8 7.9 8.1 7.7 7.0 7.4 7.0 7.1 6.4 5.5‡ 6.3 6.4 6.3 -0.1
10th Grade 12.2 12.3 13.9 15.2 17.5 18.4 18.2 16.6 16.7 16.7‡ 17.9 15.7 13.8 13.5 12.9 12.7 13.1 11.3 12.2 12.1 11.2 10.8‡ 11.2 11.2 10.5 -0.7
12th Grade 16.2 14.9 17.1 18.0 19.4 19.8 20.7 20.2 20.7 20.4‡ 21.6 20.9 19.8 20.5 19.7 19.2 18.5 18.3 17.0 17.3 17.6 17.0‡ 17.8 15.9 15.2 -0.7
including Inhalants a,c
8th Grade 16.7 18.2 21.1 24.2 27.1 28.7 27.2 26.2 25.3 24.0 23.9 21.4 20.4 20.2 20.4 19.7 18.0 19.0 18.8 20.3 18.2 17.0‡ 17.6 16.8 17.0 +0.2
10th Grade 23.9 23.5 27.4 32.5 35.6 39.6 40.3 37.1 37.7 38.0 38.7 36.1 33.5 32.9 31.7 30.7 30.2 28.8 31.2 31.8 32.5 31.5‡ 33.2 31.0 28.9 -2.1
12th Grade 31.2 28.8 32.5 37.6 40.2 41.9 43.3 42.4 42.8 42.5 42.6 42.1 40.5 39.1 40.3 38.0 37.0 37.3 37.6 39.2 41.5 40.2‡ 42.3 39.2 40.2 +1.0
8th Grade 6.2 7.2 9.2 13.0 15.8 18.3 17.7 16.9 16.5 15.6 15.4 14.6 12.8 11.8 12.2 11.7 10.3 10.9 11.8 13.7 12.5 11.4 12.7 11.7 11.8 +0.1
10th Grade 16.5 15.2 19.2 25.2 28.7 33.6 34.8 31.1 32.1 32.2 32.7 30.3 28.2 27.5 26.6 25.2 24.6 23.9 26.7 27.5 28.8 28.0 29.8 27.3 25.4 -1.9
12th Grade 23.9 21.9 26.0 30.7 34.7 35.8 38.5 37.5 37.8 36.5 37.0 36.2 34.9 34.3 33.6 31.5 31.7 32.4 32.8 34.8 36.4 36.4 36.4 35.1 34.9 -0.2
Synthetic Marijuana n,o
8th Grade — — — — — — — — — — — — — — — — — — — — — 4.4 4.0 3.3 3.1 -0.2
10th Grade — — — — — — — — — — — — — — — — — — — — — 8.8 7.4 5.4 4.3 -1.1
12th Grade — — — — — — — — — — — — — — — — — — — — 11.4 11.3 7.9 5.8 5.2 -0.7
8th Grade 9.0 9.5 11.0 11.7 12.8 12.2 11.8 11.1 10.3 9.4 9.1 7.7 8.7 9.6 9.5 9.1 8.3 8.9 8.1 8.1 7.0 6.2 5.2 5.3 4.6 -0.7
10th Grade 7.1 7.5 8.4 9.1 9.6 9.5 8.7 8.0 7.2 7.3 6.6 5.8 5.4 5.9 6.0 6.5 6.6 5.9 6.1 5.7 4.5 4.1 3.5 3.3 2.9 -0.5
12th Grade 6.6 6.2 7.0 7.7 8.0 7.6 6.7 6.2 5.6 5.9 4.5 4.5 3.9 4.2 5.0 4.5 3.7 3.8 3.4 3.6 3.2 2.9 2.5 1.9 1.9 0.0
Any Illicit Drug
Marijuana/Hashish
Inhalants c,d
(Table continued on next page.)
2015change
Any Illicit Drug a
Any Illicit Drug other than Marijuana a,b
TABLE 2Trends in Annual Prevalence of Use of Various Drugs
in Grades 8, 10, and 12
2014–
(Entries are percentages.)

1991 1992 1993 1994 1995 1996 1997 1998 1999 2000 2001 2002 2003 2004 2005 2006 2007 2008 2009 2010 2011 2012 2013 2014 2015
8th Grade 1.9 2.5 2.6 2.7 3.6 4.1 3.7 3.4 2.9 2.8‡ 3.4 2.6 2.6 2.2 2.4 2.1 1.9 2.1 1.9 2.2 2.2 1.6 1.6 1.3 1.3 0.0
10th Grade 4.0 4.3 4.7 5.8 7.2 7.8 7.6 6.9 6.9 6.1‡ 6.2 4.7 4.1 4.1 4.0 4.1 4.4 3.9 4.1 4.2 4.1 3.5 3.4 3.3 3.1 -0.2
12th Grade 5.8 5.9 7.4 7.6 9.3 10.1 9.8 9.0 9.4 8.1‡ 9.1 6.6 5.9 6.2 5.5 4.9 5.4 5.9 4.7 5.5 5.2 4.8 4.5 4.0 4.2 +0.2
8th Grade 1.7 2.1 2.3 2.4 3.2 3.5 3.2 2.8 2.4 2.4 2.2 1.5 1.3 1.1 1.2 0.9 1.1 1.3 1.1 1.2 1.1 0.8 1.0 0.7 0.9 +0.2
10th Grade 3.7 4.0 4.2 5.2 6.5 6.9 6.7 5.9 6.0 5.1 4.1 2.6 1.7 1.6 1.5 1.7 1.9 1.8 1.9 1.9 1.8 1.7 1.7 1.9 2.0 +0.1
12th Grade 5.2 5.6 6.8 6.9 8.4 8.8 8.4 7.6 8.1 6.6 6.6 3.5 1.9 2.2 1.8 1.7 2.1 2.7 1.9 2.6 2.7 2.4 2.2 2.5 2.9 +0.4
8th Grade 0.7 1.1 1.0 1.3 1.7 2.0 1.8 1.6 1.5 1.4‡ 2.4 2.1 2.1 1.9 2.0 1.8 1.6 1.6 1.5 1.8 1.8 1.3 1.2 1.0 0.8 -0.1
10th Grade 1.3 1.4 1.9 2.4 2.8 3.3 3.3 3.4 3.2 3.1‡ 4.3 4.0 3.6 3.7 3.5 3.7 3.8 3.3 3.5 3.5 3.5 3.0 2.7 2.6 1.9 -0.6 s
12th Grade 2.0 1.7 2.2 3.1 3.8 4.4 4.6 4.6 4.3 4.4‡ 5.9 5.4 5.4 5.6 5.0 4.6 4.8 5.0 4.2 4.8 4.3 4.0 3.7 3.0 2.9 -0.1
8th Grade — — — — — — — — — — — — — — — — — — — — — — — — — —
10th Grade — — — — — — — — — — — — — — — — — — — — — — — — — —
12th Grade 1.4 1.4 1.4 1.6 1.8 2.6 2.3 2.1 1.8 2.3 1.8 1.1 1.3 0.7 1.3 0.7 0.9 1.1 1.0 1.0 1.3 0.9 0.7 0.8 1.4 +0.6
8th Grade, original — — — — 2.3 2.3 1.8 1.7 3.1 3.5 2.9 2.1 1.7 1.7 1.4 1.5 1.7 1.3 2.4 1.7 1.1 1.1 0.9 — —
Revised — — — — — — — — — — — — — — — — — — — — — — 1.5 1.4 -0.1
10th Grade,original — — — — 4.6 3.9 3.3 4.4 5.4 6.2 4.9 3.0 2.4 2.6 2.8 3.5 2.9 3.7 4.7 4.5 3.0 3.6 2.3 — —
Revised — — — — — — — — — — — — — — — — — — — — — — 3.8 2.4 -1.4 ss
12th Grade, original — — — — 4.6 4.0 3.6 5.6 8.2 9.2 7.4 4.5 4.0 3.0 4.1 4.5 4.3 4.3 4.5 5.3 3.8 4.0 3.6 — —
Revised — — — — — — — — — — — — — — — — — — — — — — 5.0 3.6 -1.5 s
8th Grade — — — — — — — — — — — — — — — — — — — 1.7 1.6 1.4 1.2 0.6 0.7 +0.1
10th Grade — — — — — — — — — — — — — — — — — — — 3.7 3.9 2.5 2.3 1.8 1.2 -0.7
12th Grade — — — — — — — — — — — — — — — — — — 5.7 5.5 5.9 4.4 3.4 1.8 1.9 0.0
2015change
(Table continued on next page.)
LSD b
Hallucinogens b,f
TABLE 2 (cont.)Trends in Annual Prevalence of Use of Various Drugs
in Grades 8, 10, and 12(Entries are percentages.)
2014–
Hallucinogens other than LSD b
PCP e
Salvia n,o
Ecstasy (MDMA) g

1991 1992 1993 1994 1995 1996 1997 1998 1999 2000 2001 2002 2003 2004 2005 2006 2007 2008 2009 2010 2011 2012 2013 2014 2015
8th Grade 1.1 1.5 1.7 2.1 2.6 3.0 2.8 3.1 2.7 2.6 2.5 2.3 2.2 2.0 2.2 2.0 2.0 1.8 1.6 1.6 1.4 1.2 1.0 1.0 0.9 -0.1
10th Grade 2.2 1.9 2.1 2.8 3.5 4.2 4.7 4.7 4.9 4.4 3.6 4.0 3.3 3.7 3.5 3.2 3.4 3.0 2.7 2.2 1.9 2.0 1.9 1.5 1.8 +0.3
12th Grade 3.5 3.1 3.3 3.6 4.0 4.9 5.5 5.7 6.2 5.0 4.8 5.0 4.8 5.3 5.1 5.7 5.2 4.4 3.4 2.9 2.9 2.7 2.6 2.6 2.5 0.0
8th Grade 0.7 0.9 1.0 1.3 1.6 1.8 1.7 2.1 1.8 1.8 1.7 1.6 1.6 1.3 1.4 1.3 1.3 1.1 1.1 1.0 0.9 0.6 0.6 0.7 0.5 -0.2
10th Grade 0.9 0.9 1.1 1.4 1.8 2.1 2.2 2.5 2.4 2.2 1.8 2.3 1.6 1.7 1.7 1.3 1.3 1.3 1.2 1.0 0.9 0.8 0.8 0.5 0.7 +0.2
12th Grade 1.5 1.5 1.5 1.9 2.1 2.1 2.4 2.5 2.7 2.2 2.1 2.3 2.2 2.3 1.9 2.1 1.9 1.6 1.3 1.4 1.0 1.2 1.1 1.1 1.1 0.0
8th Grade 1.0 1.2 1.3 1.7 2.1 2.5 2.2 2.4 2.3 1.9 1.9 1.8 1.6 1.6 1.7 1.6 1.5 1.4 1.3 1.3 1.1 1.0 0.8 0.8 0.8 0.0
10th Grade 2.1 1.7 1.8 2.4 3.0 3.5 4.1 4.0 4.4 3.8 3.0 3.4 2.8 3.3 3.0 2.9 3.1 2.6 2.3 1.9 1.7 1.8 1.6 1.3 1.5 +0.2
12th Grade 3.2 2.6 2.9 3.0 3.4 4.2 5.0 4.9 5.8 4.5 4.4 4.4 4.2 4.7 4.5 5.2 4.5 4.0 3.0 2.6 2.6 2.4 2.4 2.4 2.1 -0.3
8th Grade 0.7 0.7 0.7 1.2 1.4 1.6 1.3 1.3 1.4 1.1 1.0 0.9 0.9 1.0 0.8 0.8 0.8 0.9 0.7 0.8 0.7 0.5 0.5 0.5 0.3 -0.2 ss
10th Grade 0.5 0.6 0.7 0.9 1.1 1.2 1.4 1.4 1.4 1.4 0.9 1.1 0.7 0.9 0.9 0.9 0.8 0.8 0.9 0.8 0.8 0.6 0.6 0.5 0.5 -0.1
12th Grade 0.4 0.6 0.5 0.6 1.1 1.0 1.2 1.0 1.1 1.5 0.9 1.0 0.8 0.9 0.8 0.8 0.9 0.7 0.7 0.9 0.8 0.6 0.6 0.6 0.5 -0.1
8th Grade — — — — 0.9 1.0 0.8 0.8 0.9 0.6 0.7 0.6 0.6 0.7 0.6 0.5 0.6 0.5 0.5 0.6 0.5 0.4 0.3 0.4 0.2 -0.2 ss
10th Grade — — — — 0.6 0.7 0.7 0.8 0.6 0.5 0.4 0.6 0.5 0.5 0.5 0.5 0.5 0.5 0.6 0.5 0.5 0.4 0.5 0.4 0.2 -0.2 s
12th Grade — — — — 0.5 0.5 0.5 0.4 0.4 0.4 0.3 0.4 0.4 0.4 0.5 0.5 0.4 0.4 0.3 0.7 0.6 0.4 0.4 0.5 0.3 -0.2
8th Grade — — — — 0.8 1.0 0.8 0.8 0.9 0.7 0.6 0.6 0.6 0.6 0.5 0.5 0.5 0.6 0.4 0.5 0.4 0.3 0.3 0.2 0.2 0.0
10th Grade — — — — 0.8 0.9 1.1 1.0 1.1 1.1 0.7 0.8 0.5 0.7 0.7 0.6 0.6 0.6 0.6 0.6 0.5 0.4 0.4 0.3 0.3 0.0
12th Grade — — — — 1.0 1.0 1.2 0.8 1.0 1.6 0.8 0.8 0.8 0.7 0.8 0.6 1.0 0.5 0.6 0.8 0.7 0.4 0.4 0.5 0.4 -0.1
(Entries are percentages.)
Cocaine
TABLE 2 (cont.)
Crack
Trends in Annual Prevalence of Use of Various Drugs in Grades 8, 10, and 12
2014–
2015change
Other Cocaine h
Heroin i
With a Needle j
Without a Needle j
(Table continued on next page.)

1991 1992 1993 1994 1995 1996 1997 1998 1999 2000 2001 2002 2003 2004 2005 2006 2007 2008 2009 2010 2011 2012 2013 2014 2015
8th Grade — — — — — — — — — — — — — — — — — — — — — — — — — —
10th Grade — — — — — — — — — — — — — — — — — — — — — — — — — —
12th Grade 3.5 3.3 3.6 3.8 4.7 5.4 6.2 6.3 6.7 7.0 6.7‡ 9.4 9.3 9.5 9.0 9.0 9.2 9.1 9.2 8.7 8.7 7.9 7.1 6.1 5.4 -0.7
8th Grade — — — — — — — — — — — 1.3 1.7 1.7 1.8 2.6 1.8 2.1 2.0 2.1 1.8 1.6 2.0 1.0 0.8 -0.2
10th Grade — — — — — — — — — — — 3.0 3.6 3.5 3.2 3.8 3.9 3.6 5.1 4.6 3.9 3.0 3.4 3.0 2.6 -0.3
12th Grade — — — — — — — — — — — 4.0 4.5 5.0 5.5 4.3 5.2 4.7 4.9 5.1 4.9 4.3 3.6 3.3 3.7 +0.3
8th Grade — — — — — — — — — — — 2.5 2.8 2.5 2.6 3.0 2.7 2.9 2.5 2.7 2.1 1.3 1.4 1.0 0.9 -0.2
10th Grade — — — — — — — — — — — 6.9 7.2 6.2 5.9 7.0 7.2 6.7 8.1 7.7 5.9 4.4 4.6 3.4 2.5 -0.9
12th Grade — — — — — — — — — — — 9.6 10.5 9.3 9.5 9.7 9.6 9.7 9.7 8.0 8.1 7.5 5.3 4.8 4.4 -0.4
8th Grade 6.2 6.5 7.2 7.9 8.7 9.1 8.1 7.2 6.9 6.5 6.7 5.5 5.5 4.9 4.9 4.7 4.2 4.5 4.1 3.9 3.5 2.9‡ 4.2 4.3 4.1 -0.1
10th Grade 8.2 8.2 9.6 10.2 11.9 12.4 12.1 10.7 10.4 11.1 11.7 10.7 9.0 8.5 7.8 7.9 8.0 6.4 7.1 7.6 6.6 6.5‡ 7.9 7.6 6.8 -0.8
12th Grade 8.2 7.1 8.4 9.4 9.3 9.5 10.2 10.1 10.2 10.5 10.9 11.1 9.9 10.0 8.6 8.1 7.5 6.8 6.6 7.4 8.2 7.9‡ 9.2 8.1 7.7 -0.4
Ritalin k,n,o
8th Grade — — — — — — — — — — 2.9 2.8 2.6 2.5 2.4 2.6 2.1 1.6 1.8 1.5 1.3 0.7 1.1 0.9 0.6 -0.3
10th Grade — — — — — — — — — — 4.8 4.8 4.1 3.4 3.4 3.6 2.8 2.9 3.6 2.7 2.6 1.9 1.8 1.8 1.6 -0.2
12th Grade — — — — — — — — — — 5.1 4.0 4.0 5.1 4.4 4.4 3.8 3.4 2.1 2.7 2.6 2.6 2.3 1.8 2.0 +0.2
Adderall k,n,o
8th Grade — — — — — — — — — — — — — — — — — — 2.0 2.3 1.7 1.7 1.8 1.3 1.0 -0.2
10th Grade — — — — — — — — — — — — — — — — — — 5.7 5.3 4.6 4.5 4.4 4.6 5.2 +0.6
12th Grade — — — — — — — — — — — — — — — — — — 5.4 6.5 6.5 7.6 7.4 6.8 7.5 +0.7
(Table continued on next page.)
(Entries are percentages.)
Narcotics other than Heroin k,l
Vicodin k,n,v
Amphetamines k,m
TABLE 2 (cont.)Trends in Annual Prevalence of Use of Various Drugs
in Grades 8, 10, and 12
2014–
2015change
OxyContin k,n,v

1991 1992 1993 1994 1995 1996 1997 1998 1999 2000 2001 2002 2003 2004 2005 2006 2007 2008 2009 2010 2011 2012 2013 2014 2015
Methamphetamine n,o
8th Grade — — — — — — — — 3.2 2.5 2.8 2.2 2.5 1.5 1.8 1.8 1.1 1.2 1.0 1.2 0.8 1.0 1.0 0.6 0.5 -0.1
10th Grade — — — — — — — — 4.6 4.0 3.7 3.9 3.3 3.0 2.9 1.8 1.6 1.5 1.6 1.6 1.4 1.0 1.0 0.8 0.8 0.0
12th Grade — — — — — — — — 4.7 4.3 3.9 3.6 3.2 3.4 2.5 2.5 1.7 1.2 1.2 1.0 1.4 1.1 0.9 1.0 0.6 -0.4
8th Grade — — — — — — — — — — — — — — — — — — — — — — — — — —
10th Grade — — — — — — — — — — — — — — — — — — — — — — — — — —
12th Grade 1.4 1.3 1.7 1.8 2.4 2.8 2.3 3.0 1.9 2.2 2.5 3.0 2.0 2.1 2.3 1.9 1.6 1.1 0.9 0.9 1.2 0.8 1.1 0.8 0.5 -0.2
Bath salts (synthetic stimulants) n,o
8th Grade — — — — — — — — — — — — — — — — — — — — — 0.8 1.0 0.5 0.4 -0.1
10th Grade — — — — — — — — — — — — — — — — — — — — — 0.6 0.9 0.9 0.7 -0.2
12th Grade — — — — — — — — — — — — — — — — — — — — — 1.3 0.9 0.9 1.0 +0.1
Sedatives (Barbiturates) k,p
8th Grade — — — — — — — — — — — — — — — — — — — — — — — — — —
10th Grade — — — — — — — — — — — — — — — — — — — — — — — — — —
12th Grade 3.4 2.8 3.4 4.1 4.7 4.9 5.1 5.5 5.8 6.2 5.7 6.7 6.0 6.5 7.2 6.6 6.2 5.8 5.2 4.8 4.3 4.5 4.8 4.3 3.6 -0.6 s
8th Grade 1.8 2.0 2.1 2.4 2.7 3.3 2.9 2.6 2.5 2.6‡ 2.8 2.6 2.7 2.5 2.8 2.6 2.4 2.4 2.6 2.8 2.0 1.8 1.8 1.7 1.7 0.0
10th Grade 3.2 3.5 3.3 3.3 4.0 4.6 4.9 5.1 5.4 5.6‡ 7.3 6.3 5.3 5.1 4.8 5.2 5.3 4.6 5.0 5.1 4.5 4.3 3.7 3.9 3.9 0.0
12th Grade 3.6 2.8 3.5 3.7 4.4 4.6 4.7 5.5 5.8 5.7‡ 6.9 7.7 6.7 7.3 6.8 6.6 6.2 6.2 6.3 5.6 5.6 5.3 4.6 4.7 4.7 0.0
8th Grade — — — — — — — — — — — — — — — — — — — — — — — — — —
10th Grade — — — — — — — — — — — — — — — — — — — — — — — — — —
12th Grade — — — — — — — — — — — — — — 17.1 16.8 15.8 15.4 14.4 15.0 15.2 14.8‡ 15.9 13.9 12.9 -1.0
TABLE 2 (cont.)Trends in Annual Prevalence of Use of Various Drugs
Tranquilizers b,k
Crystal Methamphetamine (Ice) o
(Table continued on next page.)
in Grades 8, 10, and 12(Entries are percentages.)
2014–
2015change
Any Prescription Drug q

1991 1992 1993 1994 1995 1996 1997 1998 1999 2000 2001 2002 2003 2004 2005 2006 2007 2008 2009 2010 2011 2012 2013 2014 2015
8th Grade — — — — — — — — — — — — — — — 4.2 4.0 3.6 3.8 3.2 2.7 3.0 2.9 2.0 1.6 -0.4
10th Grade — — — — — — — — — — — — — — — 5.3 5.4 5.3 6.0 5.1 5.5 4.7 4.3 3.7 3.3 -0.4
12th Grade — — — — — — — — — — — — — — — 6.9 5.8 5.5 5.9 6.6 5.3 5.6 5.0 4.1 4.6 +0.4
8th Grade — — — — — 1.0 0.8 0.8 0.5 0.5 0.7 0.3 0.5 0.6 0.7 0.5 0.7 0.5 0.4 0.5 0.8 0.4 0.4 0.3 0.3 0.0
10th Grade — — — — — 1.1 1.3 1.2 1.0 0.8 1.0 0.7 0.6 0.7 0.5 0.5 0.7 0.4 0.4 0.6 0.6 0.5 0.6 0.5 0.2 -0.3
12th Grade — — — — — 1.1 1.2 1.4 1.0 0.8 0.9‡ 1.6 1.3 1.6 1.2 1.1 1.0 1.3 1.0 1.5 1.3 1.5 0.9 0.7 1.0 +0.3
GHB n,w
8th Grade — — — — — — — — — 1.2 1.1 0.8 0.9 0.7 0.5 0.8 0.7 1.1 0.7 0.6 0.6 — — — — —
10th Grade — — — — — — — — — 1.1 1.0 1.4 1.4 0.8 0.8 0.7 0.6 0.5 1.0 0.6 0.5 — — — — —
12th Grade — — — — — — — — — 1.9 1.6 1.5 1.4 2.0 1.1 1.1 0.9 1.2 1.1 1.4 1.4 1.4 1.0 1.0 0.7 -0.2
8th Grade — — — — — — — — — 1.6 1.3 1.3 1.1 0.9 0.6 0.9 1.0 1.2 1.0 1.0 0.8 — — — — —
10th Grade — — — — — — — — — 2.1 2.1 2.2 1.9 1.3 1.0 1.0 0.8 1.0 1.3 1.1 1.2 — — — — —
12th Grade — — — — — — — — — 2.5 2.5 2.6 2.1 1.9 1.6 1.4 1.3 1.5 1.7 1.6 1.7 1.5 1.4 1.5 1.4 -0.1
8th Grade 54.0 53.7‡ 45.4 46.8 45.3 46.5 45.5 43.7 43.5 43.1 41.9 38.7 37.2 36.7 33.9 33.6 31.8 32.1 30.3 29.3 26.9 23.6 22.1 20.8 21.0 +0.2
10th Grade 72.3 70.2‡ 63.4 63.9 63.5 65.0 65.2 62.7 63.7 65.3 63.5 60.0 59.3 58.2 56.7 55.8 56.3 52.5 52.8 52.1 49.8 48.5 47.1 44.0 41.9 -2.1
12th Grade 77.7 76.8‡ 72.7 73.0 73.7 72.5 74.8 74.3 73.8 73.2 73.3 71.5 70.1 70.6 68.6 66.5 66.4 65.5 66.2 65.2 63.5 63.5 62.0 60.2 58.2 -2.0
8th Grade 17.5 18.3 18.2 18.2 18.4 19.8 18.4 17.9 18.5 18.5 16.6 15.0 14.5 14.5 14.1 13.9 12.6 12.7 12.2 11.5 10.5 8.6 8.4 7.3 7.7 +0.4
10th Grade 40.1 37.0 37.8 38.0 38.5 40.1 40.7 38.3 40.9 41.6 39.9 35.4 34.7 35.1 34.2 34.5 34.4 30.0 31.2 29.9 28.8 28.2 27.1 24.6 23.4 -1.2
12th Grade 52.7 50.3 49.6 51.7 52.5 51.9 53.2 52.0 53.2 51.8 53.2 50.4 48.0 51.8 47.7 47.9 46.1 45.6 47.0 44.0 42.2 45.0 43.5 41.4 37.7 -3.8 s
OTC Cough/Cold
Alcohol s
TABLE 2 (cont.)Trends in Annual Prevalence of Use of Various Drugs
2015change
in Grades 8, 10, and 12
2014–
(Entries are percentages.)
(Table continued on next page.)
Medicines n,o
Rohypnol r
Ketamine n,x
Any Use
Been Drunk o

1991 1992 1993 1994 1995 1996 1997 1998 1999 2000 2001 2002 2003 2004 2005 2006 2007 2008 2009 2010 2011 2012 2013 2014 2015
Flavored Alcoholic
8th Grade — — — — — — — — — — — — — 30.4 27.9 26.8 26.0 25.0 22.2 21.9 19.2 17.0 15.7 13.4 13.4 -0.1
10th Grade — — — — — — — — — — — — — 49.7 48.5 48.8 45.9 43.4 41.5 41.0 38.3 37.8 35.6 33.2 31.4 -1.9
12th Grade — — — — — — — — — — — — 55.2 55.8 58.4 54.7 53.6 51.8 53.4 47.9 47.0 44.4 44.2 43.6 42.8 -0.8
Alcoholic Beverages containing Caffeine n,o,z
8th Grade — — — — — — — — — — — — — — — — — — — — 11.8 10.9 10.2 9.5 8.4 -1.1
10th Grade — — — — — — — — — — — — — — — — — — — — 22.5 19.7 16.9 14.3 12.8 -1.5
12th Grade — — — — — — — — — — — — — — — — — — — — 26.4 26.4 23.5 20.0 18.3 -1.7
Tobacco using a Hookah e
8th Grade — — — — — — — — — — — — — — — — — — — — — — — — — —
10th Grade — — — — — — — — — — — — — — — — — — — — — — — — — —
12th Grade — — — — — — — — — — — — — — — — — — — 17.1 18.5 18.3 21.4 22.9 19.8 -3.1
Small cigars e,n
8th Grade — — — — — — — — — — — — — — — — — — — — — — — — — —
10th Grade — — — — — — — — — — — — — — — — — — — — — — — — — —
12th Grade — — — — — — — — — — — — — — — — — — — 23.1 19.5 19.9 20.4 18.9 15.9 -3.0
Dissolvable Tobacco Products e,n
8th Grade — — — — — — — — — — — — — — — — — — — — — 1.0 1.1 1.1 0.9 -0.2
10th Grade — — — — — — — — — — — — — — — — — — — — — 1.6 1.2 1.3 1.1 -0.3
12th Grade — — — — — — — — — — — — — — — — — — — — 1.5 1.6 1.9 1.1 1.4 +0.3
Snus e,n
8th Grade — — — — — — — — — — — — — — — — — — — — — 2.4 2.0 2.2 1.9 -0.3
10th Grade — — — — — — — — — — — — — — — — — — — — — 6.9 5.2 4.5 4.0 -0.5
12th Grade — — — — — — — — — — — — — — — — — — — — 7.9 7.9 7.7 5.8 5.8 0.0
Trends in Annual Prevalence of Use of Various Drugs in Grades 8, 10, and 12
(Entries are percentages.)
2014–
TABLE 2 (cont.)
2015change
(Table continued on next page.)
Beverages e,n,y

1991 1992 1993 1994 1995 1996 1997 1998 1999 2000 2001 2002 2003 2004 2005 2006 2007 2008 2009 2010 2011 2012 2013 2014 2015
8th Grade 1.0 1.1 0.9 1.2 1.0 0.9 1.0 1.2 1.7 1.7 1.6 1.5 1.4 1.1 1.1 0.9 0.8 0.9 0.8 0.5 0.7 0.6 0.6 0.6 0.5 0.0
10th Grade 1.1 1.1 1.0 1.1 1.2 1.2 1.2 1.2 1.7 2.2 2.1 2.2 1.7 1.5 1.3 1.2 1.1 0.9 0.8 1.0 0.9 0.8 0.8 0.8 0.7 0.0
12th Grade 1.4 1.1 1.2 1.3 1.5 1.4 1.4 1.7 1.8 1.7 2.4 2.5 2.1 2.5 1.5 1.8 1.4 1.5 1.5 1.5 1.2 1.3 1.5 1.5 1.7 +0.3
Previously suveyed drugs that have been dropped.
8th Grade — — — — — — — — — — — — — — — — — — — — — — — — — —
10th Grade — — — — — — — — — — — — — — — — — — — — — — — — — —
12th Grade 0.9 0.5 0.9 1.1 1.1 1.6 1.2 1.4 0.9 0.6 0.6 1.1 0.9 0.8 0.6 0.5 0.8 0.6 0.9 — — — — — — —
Provigil k,o
8th Grade — — — — — — — — — — — — — — — — — — — — — — — — — —
10th Grade — — — — — — — — — — — — — — — — — — — — — — — — — —
12th Grade — — — — — — — — — — — — — — — — — — 1.8 1.3 1.5 — — — — —
8th Grade — — — — — — — — — — — — — — — — — — — — — — — — — —
10th Grade — — — — — — — — — — — — — — — — — — — — — — — — — —
12th Grade 0.5 0.6 0.2 0.8 0.7 1.1 1.0 1.1 1.1 0.3 0.8 0.9 0.6 0.8 0.9 0.8 0.5 0.5 0.6 0.3 0.3 0.4 — — — —
Bidis n,o
8th Grade — — — — — — — — — 3.9 2.7 2.7 2.0 1.7 1.6 — — — — — — — — — — —
10th Grade — — — — — — — — — 6.4 4.9 3.1 2.8 2.1 1.6 — — — — — — — — — — —
12th Grade — — — — — — — — — 9.2 7.0 5.9 4.0 3.6 3.3 2.3 1.7 1.9 1.5 1.4 — — — — — —
Kreteks n,o
8th Grade — — — — — — — — — — 2.6 2.6 2.0 1.9 1.4 — — — — — — — — — — —
10th Grade — — — — — — — — — — 6.0 4.9 3.8 3.7 2.8 — — — — — — — — — — —
12th Grade — — — — — — — — — — 10.1 8.4 6.7 6.5 7.1 6.2 6.8 6.8 5.5 4.6 2.9 3.0 1.6 1.6 — —
Source. The Monitoring the Future study, the University of Michigan.
Note: See footnotes following Table 4.
Nitrites e
Steroids k,u
Methaqualone e,k
in Grades 8, 10, and 12
2014–
2015change
TABLE 2 (cont.)Trends in Annual Prevalence of Use of Various Drugs
(Entries are percentages.)

1991 1992 1993 1994 1995 1996 1997 1998 1999 2000 2001 2002 2003 2004 2005 2006 2007 2008 2009 2010 2011 2012 2013 2014 2015
8th Grade 5.7 6.8 8.4 10.9 12.4 14.6 12.9 12.1 12.2 11.9 11.7 10.4 9.7 8.4 8.5 8.1 7.4 7.6 8.1 9.5 8.5 7.7‡ 8.7 8.3 8.1 -0.2
10th Grade 11.6 11.0 14.0 18.5 20.2 23.2 23.0 21.5 22.1 22.5 22.7 20.8 19.5 18.3 17.3 16.8 16.9 15.8 17.8 18.5 19.2 18.6‡ 19.2 18.5 16.5 -2.1 s
12th Grade 16.4 14.4 18.3 21.9 23.8 24.6 26.2 25.6 25.9 24.9 25.7 25.4 24.1 23.4 23.1 21.5 21.9 22.3 23.3 23.8 25.2 25.2‡ 25.2 23.7 23.6 -0.1
Any Illicit Drug other
8th Grade 3.8 4.7 5.3 5.6 6.5 6.9 6.0 5.5 5.5 5.6‡ 5.5 4.7 4.7 4.1 4.1 3.8 3.6 3.8 3.5 3.5 3.4 2.6‡ 3.6 3.3 3.1 -0.2
10th Grade 5.5 5.7 6.5 7.1 8.9 8.9 8.8 8.6 8.6 8.5‡ 8.7 8.1 6.9 6.9 6.4 6.3 6.9 5.3 5.7 5.8 5.4 5.0‡ 4.9 5.6 4.9 -0.7 s
12th Grade 7.1 6.3 7.9 8.8 10.0 9.5 10.7 10.7 10.4 10.4‡ 11.0 11.3 10.4 10.8 10.3 9.8 9.5 9.3 8.6 8.6 8.9 8.4‡ 8.2 7.7 7.6 -0.1
including Inhalants a,c
8th Grade 8.8 10.0 12.0 14.3 16.1 17.5 16.0 14.9 15.1 14.4 14.0 12.6 12.1 11.2 11.2 10.9 10.1 10.4 10.6 11.7 10.5 9.5‡ 10.0 9.5 9.3 -0.3
10th Grade 13.1 12.6 15.5 20.0 21.6 24.5 24.1 22.5 23.1 23.6 23.6 21.7 20.5 19.3 18.4 17.7 18.1 16.8 18.8 19.4 20.1 19.3‡ 20.0 19.1 17.1 -2.0 s
12th Grade 17.8 15.5 19.3 23.0 24.8 25.5 26.9 26.6 26.4 26.4 26.5 25.9 24.6 23.3 24.2 22.1 22.8 22.8 24.1 24.5 26.2 25.2‡ 26.5 24.3 24.7 +0.4
8th Grade 3.2 3.7 5.1 7.8 9.1 11.3 10.2 9.7 9.7 9.1 9.2 8.3 7.5 6.4 6.6 6.5 5.7 5.8 6.5 8.0 7.2 6.5 7.0 6.5 6.5 0.0
10th Grade 8.7 8.1 10.9 15.8 17.2 20.4 20.5 18.7 19.4 19.7 19.8 17.8 17.0 15.9 15.2 14.2 14.2 13.8 15.9 16.7 17.6 17.0 18.0 16.6 14.8 -1.8
12th Grade 13.8 11.9 15.5 19.0 21.2 21.9 23.7 22.8 23.1 21.6 22.4 21.5 21.2 19.9 19.8 18.3 18.8 19.4 20.6 21.4 22.6 22.9 22.7 21.2 21.3 +0.1
8th Grade 4.4 4.7 5.4 5.6 6.1 5.8 5.6 4.8 5.0 4.5 4.0 3.8 4.1 4.5 4.2 4.1 3.9 4.1 3.8 3.6 3.2 2.7 2.3 2.2 2.0 -0.2
10th Grade 2.7 2.7 3.3 3.6 3.5 3.3 3.0 2.9 2.6 2.6 2.4 2.4 2.2 2.4 2.2 2.3 2.5 2.1 2.2 2.0 1.7 1.4 1.3 1.1 1.2 +0.1
12th Grade 2.4 2.3 2.5 2.7 3.2 2.5 2.5 2.3 2.0 2.2 1.7 1.5 1.5 1.5 2.0 1.5 1.2 1.4 1.2 1.4 1.0 0.9 1.0 0.7 0.7 0.0
8th Grade 0.8 1.1 1.2 1.3 1.7 1.9 1.8 1.4 1.3 1.2‡ 1.6 1.2 1.2 1.0 1.1 0.9 1.0 0.9 0.9 1.0 1.0 0.6 0.8 0.5 0.6 +0.1
10th Grade 1.6 1.8 1.9 2.4 3.3 2.8 3.3 3.2 2.9 2.3‡ 2.1 1.6 1.5 1.6 1.5 1.5 1.7 1.3 1.4 1.6 1.4 1.2 1.1 1.2 0.9 -0.2
12th Grade 2.2 2.1 2.7 3.1 4.4 3.5 3.9 3.8 3.5 2.6‡ 3.3 2.3 1.8 1.9 1.9 1.5 1.7 2.2 1.6 1.9 1.6 1.6 1.4 1.5 1.6 0.0
TABLE 3Trends in 30-Day Prevalence of Use of Various Drugs
in Grades 8, 10, and 12
Percentage who used in last 30 days 2014–
2015change
Any Illicit Drug a
than Marijuana a,b
Any Illicit Drug
Marijuana/Hashish
Inhalants c,d
(Table continued on next page.)
Hallucinogens b,f

1991 1992 1993 1994 1995 1996 1997 1998 1999 2000 2001 2002 2003 2004 2005 2006 2007 2008 2009 2010 2011 2012 2013 2014 2015
LSD b
8th Grade 0.6 0.9 1.0 1.1 1.4 1.5 1.5 1.1 1.1 1.0 1.0 0.7 0.6 0.5 0.5 0.4 0.5 0.5 0.5 0.6 0.5 0.3 0.5 0.3 0.4 +0.1
10th Grade 1.5 1.6 1.6 2.0 3.0 2.4 2.8 2.7 2.3 1.6 1.5 0.7 0.6 0.6 0.6 0.7 0.7 0.7 0.5 0.7 0.7 0.5 0.6 0.6 0.6 0.0
12th Grade 1.9 2.0 2.4 2.6 4.0 2.5 3.1 3.2 2.7 1.6 2.3 0.7 0.6 0.7 0.7 0.6 0.6 1.1 0.5 0.8 0.8 0.8 0.8 1.0 1.1 0.0
Hallucinogens other than LSD b
8th Grade 0.3 0.4 0.5 0.7 0.8 0.9 0.7 0.7 0.6 0.6‡ 1.1 1.0 1.0 0.8 0.9 0.7 0.7 0.7 0.7 0.8 0.7 0.5 0.5 0.4 0.3 0.0
10th Grade 0.4 0.5 0.7 1.0 1.0 1.0 1.2 1.4 1.2 1.2‡ 1.4 1.4 1.2 1.4 1.3 1.3 1.4 1.0 1.1 1.2 1.1 0.9 0.8 0.8 0.6 -0.3 s
12th Grade 0.7 0.5 0.8 1.2 1.3 1.6 1.7 1.6 1.6 1.7‡ 1.9 2.0 1.5 1.7 1.6 1.3 1.4 1.6 1.4 1.5 1.2 1.3 1.0 1.0 0.9 -0.1
8th Grade, original — — — — 1.0 1.0 0.9 0.8 1.4 1.8 1.4 0.7 0.8 0.6 0.7 0.6 0.8 0.6 1.1 0.6 0.5 0.5 0.4 — —
Revised — — — — — — — — — — — — — — — — — — — — — — 0.7 0.5 -0.2
10th Grade,original — — — — 1.8 1.3 1.3 1.8 2.6 2.6 1.8 1.1 0.8 1.0 1.2 1.2 1.1 1.3 1.9 1.6 1.0 1.2 0.8 — —
Revised — — — — — — — — — — — — — — — — — — — — — — 1.1 0.9 -0.2
12th Grade, original — — — — 2.0 1.6 1.5 2.5 3.6 2.8 2.4 1.3 1.2 1.0 1.3 1.6 1.8 1.8 1.4 2.3 0.9 1.5 1.4 — —
Revised — — — — — — — — — — — — — — — — — — — — — — 1.5 1.1 -0.4
8th Grade 0.5 0.7 0.7 1.0 1.2 1.3 1.1 1.4 1.3 1.2 1.2 1.1 0.9 0.9 1.0 1.0 0.9 0.8 0.8 0.6 0.8 0.5 0.5 0.5 0.5 0.0
10th Grade 0.7 0.7 0.9 1.2 1.7 1.7 2.0 2.1 1.8 1.8 1.3 1.6 1.3 1.7 1.5 1.5 1.3 1.2 0.9 0.9 0.7 0.8 0.8 0.6 0.8 +0.1
12th Grade 1.4 1.3 1.3 1.5 1.8 2.0 2.3 2.4 2.6 2.1 2.1 2.3 2.1 2.3 2.3 2.5 2.0 1.9 1.3 1.3 1.1 1.1 1.1 1.0 1.1 +0.1
8th Grade 0.3 0.5 0.4 0.7 0.7 0.8 0.7 0.9 0.8 0.8 0.8 0.8 0.7 0.6 0.6 0.6 0.6 0.5 0.5 0.4 0.5 0.3 0.3 0.3 0.3 0.0
10th Grade 0.3 0.4 0.5 0.6 0.9 0.8 0.9 1.1 0.8 0.9 0.7 1.0 0.7 0.8 0.7 0.7 0.5 0.5 0.4 0.5 0.4 0.4 0.4 0.3 0.3 0.0
12th Grade 0.7 0.6 0.7 0.8 1.0 1.0 0.9 1.0 1.1 1.0 1.1 1.2 0.9 1.0 1.0 0.9 0.9 0.8 0.6 0.7 0.5 0.6 0.6 0.7 0.6 -0.1
8th Grade 0.5 0.5 0.6 0.9 1.0 1.0 0.8 1.0 1.1 0.9 0.9 0.8 0.7 0.7 0.7 0.7 0.6 0.6 0.7 0.5 0.6 0.3 0.3 0.4 0.4 0.0
10th Grade 0.6 0.6 0.7 1.0 1.4 1.3 1.6 1.8 1.6 1.6 1.2 1.3 1.1 1.5 1.3 1.3 1.1 1.0 0.8 0.7 0.6 0.7 0.7 0.5 0.7 +0.2
12th Grade 1.2 1.0 1.2 1.3 1.3 1.6 2.0 2.0 2.5 1.7 1.8 1.9 1.8 2.2 2.0 2.4 1.7 1.7 1.1 1.1 1.0 1.0 0.9 0.9 1.1 +0.2
(Table continued on next page.)
Cocaine
TABLE 3 (cont.)Trends in 30-Day Prevalence of Use of Various Drugs
in Grades 8, 10, and 12
Percentage who used in last 30 days 2014–
2015change
Ecstasy (MDMA) g
Crack
Other Cocaine h

1991 1992 1993 1994 1995 1996 1997 1998 1999 2000 2001 2002 2003 2004 2005 2006 2007 2008 2009 2010 2011 2012 2013 2014 2015
8th Grade 0.3 0.4 0.4 0.6 0.6 0.7 0.6 0.6 0.6 0.5 0.6 0.5 0.4 0.5 0.5 0.3 0.4 0.4 0.4 0.4 0.4 0.2 0.3 0.3 0.1 -0.1
10th Grade 0.2 0.2 0.3 0.4 0.6 0.5 0.6 0.7 0.7 0.5 0.3 0.5 0.3 0.5 0.5 0.5 0.4 0.4 0.4 0.4 0.4 0.4 0.3 0.4 0.2 -0.2
12th Grade 0.2 0.3 0.2 0.3 0.6 0.5 0.5 0.5 0.5 0.7 0.4 0.5 0.4 0.5 0.5 0.4 0.4 0.4 0.4 0.4 0.4 0.3 0.3 0.4 0.3 -0.1
8th Grade — — — — 0.4 0.5 0.4 0.5 0.4 0.3 0.4 0.3 0.3 0.3 0.3 0.2 0.3 0.3 0.3 0.3 0.2 0.2 0.2 0.2 0.1 -0.1
10th Grade — — — — 0.3 0.3 0.3 0.4 0.3 0.3 0.2 0.3 0.2 0.3 0.3 0.3 0.3 0.2 0.3 0.2 0.2 0.2 0.2 0.3 0.1 -0.2 sss
12th Grade — — — — 0.3 0.4 0.3 0.2 0.2 0.2 0.2 0.3 0.3 0.2 0.3 0.3 0.2 0.2 0.1 0.4 0.4 0.3 0.2 0.3 0.2 -0.1
8th Grade — — — — 0.3 0.4 0.4 0.3 0.4 0.3 0.4 0.3 0.3 0.3 0.2 0.2 0.2 0.2 0.2 0.2 0.2 0.1 0.2 0.1 0.1 0.0
10th Grade — — — — 0.3 0.3 0.4 0.5 0.5 0.4 0.2 0.4 0.2 0.3 0.3 0.3 0.2 0.3 0.2 0.3 0.2 0.2 0.2 0.2 0.2 0.0
12th Grade — — — — 0.6 0.4 0.6 0.4 0.4 0.7 0.3 0.5 0.4 0.3 0.5 0.3 0.4 0.2 0.3 0.4 0.4 0.2 0.2 0.4 0.3 -0.1
8th Grade — — — — — — — — — — — — — — — — — — — — — — — — — —
10th Grade — — — — — — — — — — — — — — — — — — — — — — — — — —
12th Grade 1.1 1.2 1.3 1.5 1.8 2.0 2.3 2.4 2.6 2.9 3.0‡ 4.0 4.1 4.3 3.9 3.8 3.8 3.8 4.1 3.6 3.6 3.0 2.8 2.2 2.1 0.0
8th Grade 2.6 3.3 3.6 3.6 4.2 4.6 3.8 3.3 3.4 3.4 3.2 2.8 2.7 2.3 2.3 2.1 2.0 2.2 1.9 1.8 1.8 1.3‡ 2.3 2.1 1.9 -0.2
10th Grade 3.3 3.6 4.3 4.5 5.3 5.5 5.1 5.1 5.0 5.4 5.6 5.2 4.3 4.0 3.7 3.5 4.0 2.8 3.3 3.3 3.1 2.8‡ 3.3 3.7 3.1 -0.6 s 12th Grade 3.2 2.8 3.7 4.0 4.0 4.1 4.8 4.6 4.5 5.0 5.6 5.5 5.0 4.6 3.9 3.7 3.7 2.9 3.0 3.3 3.7 3.3‡ 4.2 3.8 3.2 -0.6
Methamphetamine n,o
8th Grade — — — — — — — — 1.1 0.8 1.3 1.1 1.2 0.6 0.7 0.6 0.6 0.7 0.5 0.7 0.4 0.5 0.4 0.2 0.3 +0.1
10th Grade — — — — — — — — 1.8 2.0 1.5 1.8 1.4 1.3 1.1 0.7 0.4 0.7 0.6 0.7 0.5 0.6 0.4 0.3 0.3 0.0
12th Grade — — — — — — — — 1.7 1.9 1.5 1.7 1.7 1.4 0.9 0.9 0.6 0.6 0.5 0.5 0.6 0.5 0.4 0.5 0.4 -0.1
TABLE 3 (cont.)Trends in 30-Day Prevalence of Use of Various Drugs
in Grades 8, 10, and 12
Narcotics other than Heroin k,l
Percentage who used in last 30 days
Amphetamines k,m
2014–
2015change
Heroin i
With a Needle j
Without a Needle j
(Table continued on next page.)
1991 1992 1993 1994 1995 1996 1997 1998 1999 2000 2001 2002 2003 2004 2005 2006 2007 2008 2009 2010 2011 2012 2013 2014 2015
8th Grade — — — — — — — — — — — — — — — — — — — — — — — — — —
10th Grade — — — — — — — — — — — — — — — — — — — — — — — — — —
12th Grade 0.6 0.5 0.6 0.7 1.1 1.1 0.8 1.2 0.8 1.0 1.1 1.2 0.8 0.8 0.9 0.7 0.6 0.6 0.5 0.6 0.6 0.4 0.8 0.4 0.3 -0.1
Sedatives (Barbiturates) k,p
8th Grade — — — — — — — — — — — — — — — — — — — — — — — — — —
10th Grade — — — — — — — — — — — — — — — — — — — — — — — — — —
12th Grade 1.4 1.1 1.3 1.7 2.2 2.1 2.1 2.6 2.6 3.0 2.8 3.2 2.9‡ 2.9 3.3 3.0 2.7 2.8 2.5 2.2 1.8 2.0 2.2 2.0 1.7 -0.3
8th Grade 0.8 0.8 0.9 1.1 1.2 1.5 1.2 1.2 1.1 1.4‡ 1.2 1.2 1.4 1.2 1.3 1.3 1.1 1.2 1.2 1.2 1.0 0.8 0.9 0.8 0.8 -0.1
10th Grade 1.2 1.5 1.1 1.5 1.7 1.7 2.2 2.2 2.2 2.5‡ 2.9 2.9 2.4 2.3 2.3 2.4 2.6 1.9 2.0 2.2 1.9 1.7 1.6 1.6 1.7 +0.2
12th Grade 1.4 1.0 1.2 1.4 1.8 2.0 1.8 2.4 2.5 2.6‡ 2.9 3.3 2.8 3.1 2.9 2.7 2.6 2.6 2.7 2.5 2.3 2.1 2.0 2.1 2.0 -0.1
Any Prescription Drug q
8th Grade — — — — — — — — — — — — — — — — — — — — — — — — — —
10th Grade — — — — — — — — — — — — — — — — — — — — — — — — — —
12th Grade — — — — — — — — — — — — — — 8.6 8.1 7.8 7.2 7.3 6.9 7.2 7.0‡ 7.1 6.4 5.9 -0.5
8th Grade — — — — — 0.5 0.3 0.4 0.3 0.3 0.4 0.2 0.1 0.2 0.2 0.4 0.3 0.1 0.2 0.2 0.6 0.1 0.1 0.2 0.1 -0.1
10th Grade — — — — — 0.5 0.5 0.4 0.5 0.4 0.2 0.4 0.2 0.3 0.2 0.2 0.2 0.2 0.3 0.3 0.3 0.2 0.1 0.4 0.1 -0.3
12th Grade — — — — — 0.5 0.3 0.3 0.3 0.4 0.3 — — — — — — — — — — — — — — —
8th Grade 25.1 26.1‡ 24.3 25.5 24.6 26.2 24.5 23.0 24.0 22.4 21.5 19.6 19.7 18.6 17.1 17.2 15.9 15.9 14.9 13.8 12.7 11.0 10.2 9.0 9.7 +0.7
10th Grade 42.8 39.9‡ 38.2 39.2 38.8 40.4 40.1 38.8 40.0 41.0 39.0 35.4 35.4 35.2 33.2 33.8 33.4 28.8 30.4 28.9 27.2 27.6 25.7 23.5 21.5 -2.0
12th Grade 54.0 51.3‡ 48.6 50.1 51.3 50.8 52.7 52.0 51.0 50.0 49.8 48.6 47.5 48.0 47.0 45.3 44.4 43.1 43.5 41.2 40.0 41.5 39.2 37.4 35.3 -2.1
in Grades 8, 10, and 12
2015change
Crystal Methamphetamine (Ice) o
Percentage who used in last 30 days 2014–
Tranquilizers b,k
Rohypnol r
Alcohol s
Any Use
(Table continued on next page.)
Trends in 30-Day Prevalence of Use of Various DrugsTABLE 3 (cont.)

1991 1992 1993 1994 1995 1996 1997 1998 1999 2000 2001 2002 2003 2004 2005 2006 2007 2008 2009 2010 2011 2012 2013 2014 2015
8th Grade 7.6 7.5 7.8 8.7 8.3 9.6 8.2 8.4 9.4 8.3 7.7 6.7 6.7 6.2 6.0 6.2 5.5 5.4 5.4 5.0 4.4 3.6 3.5 2.7 3.1 +0.3
10th Grade 20.5 18.1 19.8 20.3 20.8 21.3 22.4 21.1 22.5 23.5 21.9 18.3 18.2 18.5 17.6 18.8 18.1 14.4 15.5 14.7 13.7 14.5 12.8 11.2 10.3 -1.0
12th Grade 31.6 29.9 28.9 30.8 33.2 31.3 34.2 32.9 32.9 32.3 32.7 30.3 30.9 32.5 30.2 30.0 28.7 27.6 27.4 26.8 25.0 28.1 26.0 23.5 20.6 -2.9 s
Flavored Alcoholic Beverages e,n
8th Grade — — — — — — — — — — — — — 14.6 12.9 13.1 12.2 10.2 9.5 9.4 8.6 7.6 6.3 5.7 5.5 -0.2
10th Grade — — — — — — — — — — — — — 25.1 23.1 24.7 21.8 20.2 19.0 19.4 15.8 16.3 15.5 14.0 12.8 -1.2
12th Grade — — — — — — — — — — — — — 31.1 30.5 29.3 29.1 27.4 27.4 24.1 23.1 21.8 21.0 19.9 20.8 +0.9
8th Grade 14.3 15.5 16.7 18.6 19.1 21.0 19.4 19.1 17.5 14.6 12.2 10.7 10.2 9.2 9.3 8.7 7.1 6.8 6.5 7.1 6.1 4.9 4.5 4.0 3.6 -0.4
10th Grade 20.8 21.5 24.7 25.4 27.9 30.4 29.8 27.6 25.7 23.9 21.3 17.7 16.7 16.0 14.9 14.5 14.0 12.3 13.1 13.6 11.8 10.8 9.1 7.2 6.3 -0.8
12th Grade 28.3 27.8 29.9 31.2 33.5 34.0 36.5 35.1 34.6 31.4 29.5 26.7 24.4 25.0 23.2 21.6 21.6 20.4 20.1 19.2 18.7 17.1 16.3 13.6 11.4 -2.2 ss
8th Grade 6.9 7.0 6.6 7.7 7.1 7.1 5.5 4.8 4.5 4.2 4.0 3.3 4.1 4.1 3.3 3.7 3.2 3.5 3.7 4.1 3.5 2.8 2.8 3.0 3.2 +0.2
10th Grade 10.0 9.6 10.4 10.5 9.7 8.6 8.9 7.5 6.5 6.1 6.9 6.1 5.3 4.9 5.6 5.7 6.1 5.0 6.5 7.5 6.6 6.4 6.4 5.3 4.9 -0.4
12th Grade — 11.4 10.7 11.1 12.2 9.8 9.7 8.8 8.4 7.6 7.8 6.5 6.7 6.7 7.6 6.1 6.6 6.5 8.4 8.5 8.3 7.9 8.1 8.4 6.1 -2.3 s
E-cigarettes bb
8th Grade — — — — — — — — — — — — — — — — — — — — — — — 8.7 9.5 +0.8
10th Grade — — — — — — — — — — — — — — — — — — — — — — — 16.2 14.0 -2.2
12th Grade — — — — — — — — — — — — — — — — — — — — — — — 17.1 16.2 -0.9
Large Cigars cc
8th Grade — — — — — — — — — — — — — — — — — — — — — — — 1.9 2.4 +0.5
10th Grade — — — — — — — — — — — — — — — — — — — — — — — 3.9 3.4 -0.6
12th Grade — — — — — — — — — — — — — — — — — — — — — — — 6.4 7.0 +0.6
Cigarettes
2015change
(Table continued on next page.)
Any Use
Smokeless Tobacco t
Been Drunk o
TABLE 3 (cont.)Trends in 30-Day Prevalence of Use of Various Drugs
in Grades 8, 10, and 12
Percentage who used in last 30 days 2014–

1991 1992 1993 1994 1995 1996 1997 1998 1999 2000 2001 2002 2003 2004 2005 2006 2007 2008 2009 2010 2011 2012 2013 2014 2015
Flavored Little Cigars cc
8th Grade — — — — — — — — — — — — — — — — — — — — — — — 4.1 4.1 0.0
10th Grade — — — — — — — — — — — — — — — — — — — — — — — 6.9 6.1 -0.8
12th Grade — — — — — — — — — — — — — — — — — — — — — — — 11.9 11.4 -0.5
Regular Little Cigars cc
8th Grade — — — — — — — — — — — — — — — — — — — — — — — 2.5 3.3 +0.8
10th Grade — — — — — — — — — — — — — — — — — — — — — — — 4.4 3.8 -0.6
12th Grade — — — — — — — — — — — — — — — — — — — — — — — 7.0 7.8 +0.9
8th Grade 0.4 0.5 0.5 0.5 0.6 0.4 0.5 0.5 0.7 0.8 0.7 0.8 0.7 0.5 0.5 0.5 0.4 0.5 0.4 0.3 0.4 0.3 0.3 0.2 0.3 0.0
10th Grade 0.6 0.6 0.5 0.6 0.6 0.5 0.7 0.6 0.9 1.0 0.9 1.0 0.8 0.8 0.6 0.6 0.5 0.5 0.5 0.5 0.5 0.4 0.4 0.4 0.4 -0.1
12th Grade 0.8 0.6 0.7 0.9 0.7 0.7 1.0 1.1 0.9 0.8 1.3 1.4 1.3 1.6 0.9 1.1 1.0 1.0 1.0 1.1 0.7 0.9 1.0 0.9 1.0 +0.1
Previously suveyed drugs that have been dropped.
8th Grade — — — — — — — — — — — — — — — — — — — — — — — — — —
10th Grade — — — — — — — — — — — — — — — — — — — — — — — — — —
12th Grade 0.4 0.3 0.6 0.4 0.4 0.7 0.7 1.0 0.4 0.3 0.5 0.6 0.7 0.7 0.5 0.3 0.5 0.3 0.6 — — — — — — —
PCP e
8th Grade — — — — — — — — — — — — — — — — — — — — — — — — — —
10th Grade — — — — — — — — — — — — — — — — — — — — — — — — — —
12th Grade 0.5 0.6 1.0 0.7 0.6 1.3 0.7 1.0 0.8 0.9 0.5 0.4 0.6 0.4 0.7 0.4 0.5 0.6 0.5 0.8 0.8 0.5 0.4 — — —
8th Grade — — — — — — — — — — — — — — — — — — — — — — — — — —
10th Grade — — — — — — — — — — — — — — — — — — — — — — — — — —
12th Grade 0.2 0.4 0.1 0.4 0.4 0.6 0.3 0.6 0.4 0.2 0.5 0.3 0.4 0.5 0.5 0.4 0.4 0.2 0.3 0.2 0.2 0.3 — — — —
Source. The Monitoring the Future study, the University of Michigan.
See footnotes following Table 4.
Nitrites e
Steroids k,u
in Grades 8, 10, and 12
Percentage who used in last 30 days 2014–
2015change
Trends in 30-Day Prevalence of Use of Various DrugsTABLE 3 (cont.)
Methaqualone e,k

1991 1992 1993 1994 1995 1996 1997 1998 1999 2000 2001 2002 2003 2004 2005 2006 2007 2008 2009 2010 2011 2012 2013 2014 2015
Daily aa
8th Grade 0.2 0.2 0.4 0.7 0.8 1.5 1.1 1.1 1.4 1.3 1.3 1.2 1.0 0.8 1.0 1.0 0.8 0.9 1.0 1.2 1.3 1.1 1.1 1.0 1.1 +0.1
10th Grade 0.8 0.8 1.0 2.2 2.8 3.5 3.7 3.6 3.8 3.8 4.5 3.9 3.6 3.2 3.1 2.8 2.8 2.7 2.8 3.3 3.6 3.5 4.0 3.4 3.0 -0.4
12th Grade 2.0 1.9 2.4 3.6 4.6 4.9 5.8 5.6 6.0 6.0 5.8 6.0 6.0 5.6 5.0 5.0 5.1 5.4 5.2 6.1 6.6 6.5 6.5 5.8 6.0 +0.2
Any Daily Use
8th Grade 0.5 0.6‡ 1.0 1.0 0.7 1.0 0.8 0.9 1.0 0.8 0.9 0.7 0.8 0.6 0.5 0.5 0.6 0.7 0.5 0.5 0.4 0.3 0.3 0.3 0.2 -0.1
10th Grade 1.3 1.2‡ 1.8 1.7 1.7 1.6 1.7 1.9 1.9 1.8 1.9 1.8 1.5 1.3 1.3 1.4 1.4 1.0 1.1 1.1 0.8 1.0 0.9 0.8 0.5 -0.3 ss
12th Grade 3.6 3.4‡ 3.4 2.9 3.5 3.7 3.9 3.9 3.4 2.9 3.6 3.5 3.2 2.8 3.1 3.0 3.1 2.8 2.5 2.7 2.1 2.5 2.2 1.9 1.9 0.0
8th Grade 0.1 0.1 0.2 0.3 0.2 0.2 0.2 0.3 0.4 0.3 0.2 0.3 0.2 0.2 0.2 0.2 0.2 0.2 0.2 0.2 0.1 0.1 0.1 0.1 0.1 -0.1
10th Grade 0.2 0.3 0.4 0.4 0.6 0.4 0.6 0.6 0.7 0.5 0.6 0.5 0.5 0.4 0.4 0.5 0.5 0.3 0.4 0.3 0.2 0.4 0.3 0.3 0.1 -0.1 s
12th Grade 0.9 0.8 0.9 1.2 1.3 1.6 2.0 1.5 1.9 1.7 1.4 1.2 1.6 1.8 1.5 1.6 1.3 1.4 1.1 1.6 1.3 1.5 1.3 1.1 0.8 -0.4
5+ Drinks in a Row
8th Grade 10.9 11.3 11.3 12.1 12.3 13.3 12.3 11.5 13.1 11.7 11.0 10.3 9.8 9.4 8.4 8.7 8.3 8.1 7.8 7.2 6.4 5.1 5.1 4.1 4.6 +0.5
10th Grade 21.0 19.1 21.0 21.9 22.0 22.8 23.1 22.4 23.5 24.1 22.8 20.3 20.0 19.9 19.0 19.9 19.6 16.0 17.5 16.3 14.7 15.6 13.7 12.6 10.9 -1.7 s
12th Grade 29.8 27.9 27.5 28.2 29.8 30.2 31.3 31.5 30.8 30.0 29.7 28.6 27.9 29.2 27.1 25.4 25.9 24.6 25.2 23.2 21.6 23.7 22.1 19.4 17.2 -2.2 s
Cigarettes
Any Daily Use
8th Grade 7.2 7.0 8.3 8.8 9.3 10.4 9.0 8.8 8.1 7.4 5.5 5.1 4.5 4.4 4.0 4.0 3.0 3.1 2.7 2.9 2.4 1.9 1.8 1.4 1.3 -0.1
10th Grade 12.6 12.3 14.2 14.6 16.3 18.3 18.0 15.8 15.9 14.0 12.2 10.1 8.9 8.3 7.5 7.6 7.2 5.9 6.3 6.6 5.5 5.0 4.4 3.2 3.0 -0.2
12th Grade 18.5 17.2 19.0 19.4 21.6 22.2 24.6 22.4 23.1 20.6 19.0 16.9 15.8 15.6 13.6 12.2 12.3 11.4 11.2 10.7 10.3 9.3 8.5 6.7 5.5 -1.2 s
TABLE 4Trends in 30-Day Prevalence of Daily Use of Various Drugs
in Grades 8, 10, and 12
2014–
2015change
Marijuana/Hashish
Been Drunk
in Last 2 Weeks
Alcohol s,aa
Daily o,aa
(Entries are percentages.)
(Table continued on next page.)

1991 1992 1993 1994 1995 1996 1997 1998 1999 2000 2001 2002 2003 2004 2005 2006 2007 2008 2009 2010 2011 2012 2013 2014 2015
1/2 Pack+/Day
8th Grade 3.1 2.9 3.5 3.6 3.4 4.3 3.5 3.6 3.3 2.8 2.3 2.1 1.8 1.7 1.7 1.5 1.1 1.2 1.0 0.9 0.7 0.6 0.7 0.5 0.4 -0.1
10th Grade 6.5 6.0 7.0 7.6 8.3 9.4 8.6 7.9 7.6 6.2 5.5 4.4 4.1 3.3 3.1 3.3 2.7 2.0 2.4 2.4 1.9 1.5 1.5 1.2 1.0 -0.2
12th Grade 10.7 10.0 10.9 11.2 12.4 13.0 14.3 12.6 13.2 11.3 10.3 9.1 8.4 8.0 6.9 5.9 5.7 5.4 5.0 4.7 4.3 4.0 3.4 2.6 2.1 -0.5
8th Grade 1.6 1.8 1.5 1.9 1.2 1.5 1.0 1.0 0.9 0.9 1.2 0.8 0.8 1.0 0.7 0.7 0.8 0.8 0.8 0.9 0.8 0.5 0.5 0.5 0.8 +0.2
10th Grade 3.3 3.0 3.3 3.0 2.7 2.2 2.2 2.2 1.5 1.9 2.2 1.7 1.8 1.6 1.9 1.7 1.6 1.4 1.9 2.5 1.7 2.0 1.9 1.8 1.6 -0.2
12th Grade — 4.3 3.3 3.9 3.6 3.3 4.4 3.2 2.9 3.2 2.8 2.0 2.2 2.8 2.5 2.2 2.8 2.7 2.9 3.1 3.1 3.2 3.0 3.4 2.9 -0.4Source. The Monitoring the Future study, the University of Michigan.
Note. See footnotes on the following Table 4.
Smokeless Tobacco Daily t
2015change
TABLE 4 (cont.)Trends in 30-Day Prevalence of Daily Use of Various Drugs
in Grades 8, 10, and 12(Entries are percentages.)
2014–

ApproximateWeighted N s 1991 1992 1993 1994 1995 1996 1997 1998 1999 2000 2001 2002 20038th Graders 17,500 18,600 18,300 17,300 17,500 17,800 18,600 18,100 16,700 16,700 16,200 15,100 16,50010th Graders 14,800 14,800 15,300 15,800 17,000 15,600 15,500 15,000 13,600 14,300 14,000 14,300 15,80012th Graders 15,000 15,800 16,300 15,400 15,400 14,300 15,400 15,200 13,600 12,800 12,800 12,900 14,600
ApproximateWeighted N s 2004 2005 2006 2007 2008 2009 2010 2011 2012 2013 2014 20158th Graders 17,000 16,800 16,500 16,100 15,700 15,000 15,300 16,000 15,100 14,600 14,600 14,40010th Graders 16,400 16,200 16,200 16,100 15,100 15,900 15,200 14,900 15,000 12,900 13,000 15,60012th Graders 14,600 14,700 14,200 14,500 14,000 13,700 14,400 14,100 13,700 12,600 12,400 12,900
Notes. Level of significance of difference between the two most recent classes: s = .05, ss = .01, sss = .001. ' — ' indicates data not available. ' ‡ ' indicates some change in the question. See relevant footnote for that drug. Any apparent inconsistency between the change estimate and the prevalence estimates for the two most recent years is due to rounding.
aFor 12th graders only: Use of any illicit drug includes any use of marijuana, LSD, other hallucinogens, crack, other cocaine, or heroin; or any use of narcotics other than heroin, amphetamines, sedatives (barbiturates), or tranquilizers not under a doctor’s orders. For 8th and 10th graders only: The use of narcotics other than heroin and sedatives (barbiturates) has been excluded because these younger respondents appear to overreport use (perhaps because they include the use of nonprescription drugs in their answers). Due to changesin the amphetamines questions 2013 data for all grades for any illicit drug use, any illicit drug use other than marijuana and 8th and 10th grade any illicit drug use including inhalants are based on one half of the N indicated. 12th grade any illicit drug use including inhalants data are based on one form; N is one sixth of N indicated. 2014 data are based on all forms. See the amphetamine note for details.bIn 2001 the question text was changed on half of the questionnaire forms for each age group. Other psychedelics was changed to other hallucinogens and shrooms was added to the list of examples. For the tranquilizer list of examples, Miltown was replaced with Xanax. For 8th, 10th, and 12th graders: The 2001 data presented here are based on the changed forms only; N is one half of N indicated. In 2002 the remaining forms were changed to the new wording. The data are based on all forms beginning in 2002. Data for any illicit drug other than marijuana and data for hallucinogens are also affected by these changes and have been handled in a parallel manner. Hallucinogens,LSD, and hallucinogens other than LSD are based on five of six forms beginning in 2014; N is five sixths of N indicated.cFor 12th graders only: Data based on five of six forms in 1991–1998; N is five sixths of N indicated. Data based on three of six forms beginning in 1999; N is three sixths of N indicated. For 8th and 10th graders only, beginning in 2014 data based on two thirds of N indicated.dInhalants are unadjusted for underreporting of amyl and butyl nitrites.eFor 12th graders only: Data based on one of six forms; N is one sixth of N indicated. In 2011 for flavored alcoholic beverages Skyy Blue and Zima were dropped from the list of examples. An examination of the data did not show any effect from the wording change.In 2014 the PCP use questions were dropped; annual PCP use was moved to another form.fHallucinogens are unadjusted for underreporting of PCP.gFor 8th and 10th graders only: Data based on one of two forms in 1996; N is one half of N indicated. Data based on one third of N indicated in 1997–2001 due to changes in the questionnaire forms. Data based on two of four forms beginning in 2002; N is one half of N indicated. In 2014 a revised question on use of ecstasy (MDMA) including "Molly" was added to one form. The 2013 and 2014 "Original wording"data reported here are for only the questionnaires using the original question wording; N is one half of N indicated. The 2014 and 2015 data
Footnotes for Tables 1 through 4
(Footnote continued on next page.)
reported here are for only the questionnaires the "Revised wording" which includes "Molly;" N is two sixths of N indicated in 2014 andfive sixths of the N indicated in 2015. For 12th graders only: Data based on one of six forms in 1996–2001; N is one sixth of N indicatedData based on two of six forms beginning in 2002; N is two sixths of N indicated. In 2014 a revised question on use of ecxtasy (MDMA) including"Molly" was added to one form. The 2013 and 2014 "Original wording" data reported here are for only the questionnaires using the originalquestion wording; N is two sixths of N indicated. The 2014 and 2015 data reported here for the "Revised wording" which includes "Molly" arefor only the questionnaires using the revised wording; N is one sixth of the N indicated in 2014 and three sixths of the N indicated in 2015.hFor 12th graders only: Data based on four of six forms; N is four sixths of N indicated.iIn 1995 the heroin question was changed in one of two forms for 8th and 10th graders and in three of six forms for 12th graders. Separate questions were asked for use with and without injection. In 1996, the heroin question was changed in the remaining 8th- and 10th-grade forms. Data presented here represent the combined data from all forms.jFor 8th and 10th graders only: Data based on one of two forms in 1995; N is one half of N indicated. Data based on all forms in 1996 through 2014. In 2015 the question was dropped from 1 form; N is four sixths of N indicated. For 12th graders only: Data based on three of six forms; N is three sixths of N indicated. kOnly drug use not under a doctor’s orders is included here.lIn 2002 the question text was changed in half of the questionnaire forms. The list of examples of narcotics other than heroin was updated: Talwin, laudanum, and paregoric—all of which had negligible rates of use by 2001—were replaced with Vicodin, OxyContin, and Percocet. The 2002 data presented here are based on the changed forms only; N is one half of N indicated. In 2003, the remaining forms were changed to the new wording. The data are based on all forms beginning in 2003. In 2013 the list of examples was changed on one form: MS Contin, Roxycodone, Hydrocodone (Lortab, Lorcet, Norco), Suboxone, Tylox, and Tramadol were addedto the list. An examination of the data did not show any effect from the wording change. mFor 8th, 10th, and 12th graders: In 2009, the question text was changed slightly in half of the forms. An examination of the data did not show any effect from the wording change. In 2010 the remaining forms were changed in a like manner. In 2011 the question text was changed slightly in one form; bennies, Benzedrine and Methadrine were dropped from the list of examples. An examination of the data did not show any effect from the wording change. In 2013 the question wording was changed slightly in two of the 8th and 10th grade questionnaires and in three of the 12th grade questionnaires. The new wording in 2013 asked "On how many occasions (if any) havetaken amphetamines or other prescription stimulant drugs…" In contrast, the old wording did not include the text highlighted in red.Results in 2013 indicated higher prevalence in questionnaires with the new wording as compared to the old wording; it was proportionally61% higher in 8th grade, 34% higher in 10th grade, and 21% higher in 12th grade. 2013 data are based on the changed forms only; for8th, 10th, and 12th graders N is one half of N indicated. Beginning in 2014 all questionnaires included the new, updated wording.nFor 8th and 10th graders only: Data based on one of four forms; N is one third of N indicated. See text for detailed explanation. In 2011 for flavored alcoholic beverages: Skyy Blue and Zima were dropped from the list of examples. An examination of the data did not show any effect from the wording change. Annual synthetic marijuana use questions asked of one third of N indicated.oFor 12th graders only: Data based on two of six forms; N is two sixths of N indicated. Bidis and kreteks based on one of six forms beginning in 2009; N is one sixth N indicated.pFor 12th graders only: In 2004 the barbiturate question text was changed on half of the questionnaire forms. Barbiturates was changed to sedatives including barbiturates, and “have you taken barbiturates . . . ” was changed to “have you taken sedatives . . . ” In the list of examples downs, downers, goofballs, yellow, reds, blues, rainbows were changed to downs, or downers, and include Phenobarbital, Tuinal, Nembutal, and Seconal. An examination of the data did not show any effect from the wording change. In 2005 the remaining forms were changed in a like manner. In 2013 the question text was changed in all forms: Tuinal, Nembutal, and Seconal were replacedwith Ambien, Lunesta, and Sonata. In one form the list of examples was also changed: Tuinal was dropped from the list and Dalmane,Restoril, Halcion, Intermezzo, and Zolpimist were added. An examination of the data did not show any effect from the wording change.
Footnotes for Tables 1 through 4 (cont.)
(Footnote continued on next page.)

qThe use of any prescription drug includes use of any of the following: amphetamines, sedatives (barbiturates), narcotics other than heroin, or tranquilizers “…without a doctor telling you to use them.”rFor 8th and 10th graders only: Data based on one of two forms in 1996; N is one half of N indicated. Data based on three of four forms in 1997–1998; N is two thirds of N indicated. Data based on two of four forms in 1999–2001; N is one third of N indicated. Data based on one of four forms beginning in 2002; N is one sixth of N indicated. See text for detailed explanation. For 12th graders only: Data based on one of six forms in 1996–2001; N is one sixth of N indicated. Data based on two of six forms in 2002–2009; N is two sixths of N indicated. Data for 2001 and 2002 are not comparable due to changes in the questionnaire forms. Data based on one of six forms beginning in 2010; N is one sixth of N indicated. sFor 8th, 10th, and 12th graders: In 1993, the question text was changed slightly in half of the forms to indicate that a drink meant more than just a few sips. The 1993 data are based on the changed forms only; N is one half of N indicated for these groups. In 1994 the remaining forms were changed to the new wording. The data are based on all forms beginning in 1994. In 2004, the question text was changed slightly in half of the forms. An examination of the data did not show any effect from the wording change. The remaining forms were changed in 2005.tFor 8th and 10th graders only: Data based on one of two forms for 1991–1996 and on two of four forms beginning in 1997; N is one half of N indicated. For 12th graders only: Data based on one of six forms; N is one sixth of N indicated. For all grades in 2011: snus and dissolvable tobacco were added to the list of examples. An examination of the data did not show any effect from the wording change. uFor 8th and 10th graders only: In 2006, the question text was changed slightly in half of the questionnaire forms. An examination of the data did not show any effect from the wording change. In 2007 the remaining forms were changed in a like manner. In 2008 the question text was changed slightly in half of the questionnaire forms. An examination of the data did not show any effect from the wording change. In 2009 the remaining forms were changed in a like manner. For 12th graders only: Data based on two of six forms in 1991–2005; N is two sixths of N indicated. Data based on three of six forms beginning in 2006; N is three sixths of N indicated. In 2006 a slightly altered version of the question was added to a third form. An examination of the data did not show any effect from the wording change. In 2007 the remaining forms were changed in a like manner. In 2008 the question text was changed slightly in two of the questionnaire forms. An examination of the data did not show any effect from the wording change. In 2009 the remaining form was changed in a like manner.vFor 12th graders only: Data based on two of six forms in 2002–2005; N is two sixths of N indicated. Data based on three of six forms beginning in 2006; N is three sixths of N indicated. wFor 12th graders only: Data based on two of six forms in 2000; N is two sixths of N indicated. Data based on three of six forms in 2001; N is three sixths of N indicated. Data based on one of six forms beginning in 2002; N is one sixth of N indicated. xFor 12th graders only: Data based on two of six forms in 2000; N is two sixths of N indicated. Data based on three of six forms in 2001–2009; N is three sixths of N indicated. Data based on two of six forms beginning in 2010; N is two sixths of N indicated. yThe 2003 flavored alcoholic beverage data were created by adjusting the 2004 data to reflect the change in the 2003 and 2004 alcopops data.zFor 8th and 10th graders only: Data based on one of four forms; N is one third of N indicated. See text for detailed explanation. For 12th graders only: Data based on two of six forms; N is two sixths of N indicated. For all grades: In 2011 the question text was “…had an alcoholic beverage containing caffeine (like Four Loko or Joose).” In 2012 the question text was changed to “…had an alcoholic beverage mixed with an energy drink (like Red Bull).” An examination of the data did not show any effect from the wording changes.aaDaily use is defined as use on 20 or more occasions in the past 30 days except for cigarettes and smokeless tobacco, for which actual daily use is measured, and for 5+ drinks, for which the prevalence of having five or more drinks in a row in the last two weeks is measured.bb8th and 10th grade data based on one thrid of N indicated. 12th grade data based on four of six forms; N is two thirds of N indicated.cc8th and 10th grade data based on one thrid of N indicated. 12th grade data based on two of six forms; N is one third of N indicated.
Footnotes for Tables 1 through 4 (cont.)

1991 1992 1993 1994 1995 1996 1997 1998 1999 2000 2001 2002 2003 2004 2005 2006 2007 2008 2009 2010 2011 2012 2013 2014 2015
Try marijuana once or twice b 40.4 39.1 36.2 31.6 28.9 27.9 25.3 28.1 28.0 29.0 27.7 28.2 30.2 31.9 31.4 32.2 32.8 31.1 29.5 29.5 28.2 26.0 24.1 23.0 23.0 0.0Smoke marijuana occasionally b 57.9 56.3 53.8 48.6 45.9 44.3 43.1 45.0 45.7 47.4 46.3 46.0 48.6 50.5 48.9 48.9 50.2 48.1 44.8 44.1 43.4 41.7 37.2 36.7 36.8 +0.1Smoke marijuana regularly b 83.8 82.0 79.6 74.3 73.0 70.9 72.7 73.0 73.3 74.8 72.2 71.7 74.2 76.2 73.9 73.2 74.3 72.0 69.8 68.0 68.3 66.9 61.0 58.9 58.0 -1.0Try synthetic marijuana once or twice c — — — — — — — — — — — — — — — — — — — — — 24.4 24.2 23.9 26.0 +2.0Take synthetic marijuana occasionally c — — — — — — — — — — — — — — — — — — — — — 36.8 36.2 32.4 33.5 +1.1Try inhalants once or twice d 35.9 37.0 36.5 37.9 36.4 40.8 40.1 38.9 40.8 41.2 45.6 42.8 40.3 38.7 37.5 35.8 35.9 33.9 34.1 35.5 34.7 34.2 33.7 34.5 33.7 -0.8Take inhalants regularly d 65.6 64.4 64.6 65.5 64.8 68.2 68.7 67.2 68.8 69.9 71.6 69.9 67.4 66.4 64.1 62.1 61.9 59.2 58.1 60.6 59.0 59.0 56.7 55.3 54.1 -1.2Take LSD once or twice e — — 42.1 38.3 36.7 36.5 37.0 34.9 34.1 34.0 31.6 29.6 27.9 26.8 25.8 23.8 22.8 21.9 21.4 23.6 21.7 19.9 19.6 20.0 22.2 +2.2Take LSD regularly e — — 68.3 65.8 64.4 63.6 64.1 59.6 58.8 57.5 52.9 49.3 48.2 45.2 44.0 40.0 38.5 36.9 37.0 38.6 37.8 35.0 34.5 33.7 37.0 +3.3Try ecstasy (MDMA) once or twice f — — — — — — — — — — 35.8 38.9 41.9 42.5 40.0 32.8 30.4 28.6 26.0 27.0 25.4 23.6 24.1‡ 46.1 45.5 -0.6Take ecstasy (MDMA) occasionally f — — — — — — — — — — 55.5 61.8 65.8 65.1 60.8 52.0 48.6 46.8 43.9 45.0 43.7 41.0 42.1‡ 59.7 58.5 -1.2Try salvia once or twice c — — — — — — — — — — — — — — — — — — — — — 9.5 8.5 — — —Take salvia occasionally c — — — — — — — — — — — — — — — — — — — — — 16.1 14.6 — — —Try crack once or twice d 62.8 61.2 57.2 54.4 50.8 51.0 49.9 49.3 48.7 48.5 48.6 47.4 48.7 49.0 49.6 47.6 47.3 47.1 46.6 49.6 48.1 47.0 47.1 48.3 49.6 +1.3Take crack occasionally d 82.2 79.6 76.8 74.4 72.1 71.6 71.2 70.6 70.6 70.1 70.0 69.7 70.3 70.4 69.4 68.7 68.3 67.9 66.6 68.4 67.7 67.8 66.5 65.5 65.7 +0.2Try cocaine powder once or twice d 55.5 54.1 50.7 48.4 44.9 45.2 45.0 44.0 43.3 43.3 43.9 43.2 43.7 44.4 44.2 43.5 43.5 42.7 42.3 45.7 43.3 42.8 43.5 43.9 44.3 +0.4Take cocaine powder occasionally d 77.0 74.3 71.8 69.1 66.4 65.7 65.8 65.2 65.4 65.5 65.8 64.9 65.8 66.0 65.3 64.0 64.2 62.7 62.3 64.2 63.5 63.3 62.7 61.8 61.6 -0.2
Try heroin once or twice without using a needle e — — — — 60.1 61.3 63.0 62.8 63.0 62.0 61.1 62.6 62.7 61.6 61.4 60.4 60.3 60.8 60.0 62.3 61.7 59.1 59.8 60.9 61.4 +0.5
Take heroin occasionally without using a needle e — — — — 76.8 76.6 79.2 79.0 78.9 78.6 78.5 78.5 77.8 77.5 76.8 75.3 76.4 75.5 74.0 76.7 75.9 75.1 73.4 73.2 72.7 -0.5Try OxyContin once or twice c — — — — — — — — — — — — — — — — — — — — — 21.9 19.9 22.1 20.2 -1.8Take OxyContin occasionally c — — — — — — — — — — — — — — — — — — — — — 35.3 32.6 34.4 32.5 -1.9Try Vicodin once or twice c — — — — — — — — — — — — — — — — — — — — — 17.5 15.0 18.4 16.9 -1.5Take Vicodin occasionally c — — — — — — — — — — — — — — — — — — — — — 29.4 26.2 28.2 26.7 -1.5Try Adderall once or twice c — — — — — — — — — — — — — — — — — — — — — 17.6 16.5 20.7 19.2 -1.5Take Adderall occasionally c — — — — — — — — — — — — — — — — — — — — — 29.9 28.3 32.5 32.0 -0.4
Try bath salts (synthetic stimulants) once or twice c — — — — — — — — — — — — — — — — — — — — — 24.9 39.3 36.8 33.9 -2.8
Take bath salts (synthetic stimulants) occasionally c — — — — — — — — — — — — — — — — — — — — — 38.8 51.9 49.1 45.5 -3.6 sTry cough/cold medicine once or twice c — — — — — — — — — — — — — — — — — — — — — 21.2 20.1 22.9 20.9 -2.0Take cough/cold medicine occasionally c — — — — — — — — — — — — — — — — — — — — — 38.8 37.3 37.9 37.3 -0.6
Try one or two drinks of an alcoholic beverage (beer, wine, liquor) b 11.0 12.1 12.4 11.6 11.6 11.8 10.4 12.1 11.6 11.9 12.2 12.5 12.6 13.7 13.9 14.2 14.9 13.5 14.4 14.9 14.5 13.9 13.7 14.8 15.3 +0.6Take one or two drinks nearly every day b 31.8 32.4 32.6 29.9 30.5 28.6 29.1 30.3 29.7 30.4 30.0 29.6 29.9 31.0 31.4 31.3 32.6 31.5 31.5 32.3 31.8 31.4 30.6 31.0 30.9 -0.1
Have five or more drinks once or twice each weekend b 59.1 58.0 57.7 54.7 54.1 51.8 55.6 56.0 55.3 55.9 56.1 56.4 56.5 56.9 57.2 56.4 57.9 57.0 55.8 57.2 58.4 58.2 55.7 54.3 53.9 -0.4Smoke one to five cigarettes per day c — — — — — — — — 26.9 28.9 30.5 32.8 33.4 37.0 37.5 37.0 38.6 38.6 38.6 38.2 37.4 40.4 42.8 41.9 41.7 -0.2
Smoke one or more packs of cigarettes per day g 51.6 50.8 52.7 50.8 49.8 50.4 52.6 54.3 54.8 58.8 57.1 57.5 57.7 62.4 61.5 59.4 61.1 59.8 59.1 60.9 62.5 62.6 62.4 62.1 63.0 +0.9
Use electronic cigarettes (e-cigarettes) regularly h — — — — — — — — — — — — — — — — — — — — — — — 14.5 18.5 +4.0 sssSmoke little cigars or cigarillos regularly c — — — — — — — — — — — — — — — — — — — — — — — 28.8 31.0 +2.2
Use smokeless tobacco regularly 35.1 35.1 36.9 35.5 33.5 34.0 35.2 36.5 37.1 39.0 38.2 39.4 39.7 41.3 40.8 39.5 41.8 41.0 40.8 41.8 40.8 37.8 36.2 34.5 36.6 +2.1Take dissolvable tobacco regularly c — — — — — — — — — — — — — — — — — — — — — 34.8 32.2 33.5 33.0 -0.5Take snus regularly c — — — — — — — — — — — — — — — — — — — — — 42.2 38.9 38.3 37.7 -0.6Take steroids i 64.2 69.5 70.2 67.6 — — — — — — — — — — — — — — — — — — — — — —
Approximate weighted N = 17,400 18,700 18,400 17,400 17,500 17,900 18,800 18,100 16,700 16,700 16,200 15,100 16,500 17,000 16,800 16,500 16,100 15,700 15,000 15,300 16,000 15,100 14,600 14,600 14,400
(Table continued on next page.)
TABLE 5Trends in Harmfulness of Drugs as Perceived by 8th Graders
How much do you think people risk harming themselves (physically or in other ways), if they . . .
Percentage saying great risk a 2014–
2015change

Source. The Monitoring the Future study, the University of Michigan.
Notes. Level of significance of difference between the two most recent classes: s = .05, ss = .01, sss = .001. ' — ' indicates data not available. Any apparent inconsistency between the change estimate and the prevalence estimates for the two most recent years is due to rounding.aAnswer alternatives were: (1) No risk, (2) Slight risk, (3) Moderate risk, (4) Great risk, and (5) Can’t say, drug unfamiliar.bBeginning in 2012 data based on two thirds of N indicated.cData based on one third of N indicated.dBeginning in 1997, data based on two thirds of N indicated due to changes in questionnaire forms.eData based on one of two forms in 1993–1996; N is one half of N indicated. Beginning in 1997, data based on one third of N indicated due to changes in questionnaire forms.f Beginning in 2014 data are based on the revised question which included "Molly," N is one third of N indicated in 2014 and two thirds of N indicated in 2015. 2014 and 2015 data are not comparable to earlier years due to the revision of the question text.gBeginning in 1999, data based on two thirds of N indicated due to changes in questionnaire forms.hE-cigarette data based on two thirds of N indicated. Little cigars or cigarillos data based on one third N indicated.I Data based on two forms in 1991 and 1992. Data based on one of two forms in 1993 and 1994; N is one half of N indicated.
TABLE 5 (cont.)Trends in Harmfulness of Drugs as Perceived by 8th Graders

1991 1992 1993 1994 1995 1996 1997 1998 1999 2000 2001 2002 2003 2004 2005 2006 2007 2008 2009 2010 2011 2012 2013 2014 2015
Try marijuana once or twice b 30.0 31.9 29.7 24.4 21.5 20.0 18.8 19.6 19.2 18.5 17.9 19.9 21.1 22.0 22.3 22.2 22.2 23.1 20.5 19.9 19.3 17.2 15.7 15.2 15.8 +0.6Smoke marijuana occasionally b 48.6 48.9 46.1 38.9 35.4 32.8 31.9 32.5 33.5 32.4 31.2 32.0 34.9 36.2 36.6 35.6 36.0 37.0 32.9 30.9 30.1 26.8 25.1 23.9 24.7 +0.7Smoke marijuana regularly b 82.1 81.1 78.5 71.3 67.9 65.9 65.9 65.8 65.9 64.7 62.8 60.8 63.9 65.6 65.5 64.9 64.5 64.8 59.5 57.2 55.2 50.9 46.5 45.4 43.2 -2.1Try synthetic marijuana once or twice c — — — — — — — — — — — — — — — — — — — — — 24.6 24.1 25.0 26.3 +1.2Take synthetic marijuana occasionally c — — — — — — — — — — — — — — — — — — — — — 34.9 32.8 30.7 31.7 +1.0Try inhalants once or twice d 37.8 38.7 40.9 42.7 41.6 47.2 47.5 45.8 48.2 46.6 49.9 48.7 47.7 46.7 45.7 43.9 43.0 41.2 42.0 42.5 42.4 42.4 43.0 43.1 43.1 0.0Take inhalants regularly d 69.8 67.9 69.6 71.5 71.8 75.8 74.5 73.3 76.3 75.0 76.4 73.4 72.2 73.0 71.2 70.2 68.6 66.8 66.8 67.1 66.2 66.1 65.9 64.7 63.1 -1.6Take LSD once or twice e — — 48.7 46.5 44.7 45.1 44.5 43.5 45.0 43.0 41.3 40.1 40.8 40.6 40.3 38.8 35.4 34.6 34.9 33.9 34.2 34.7 34.7 34.5 36.4 +2.0Take LSD regularly e — — 78.9 75.9 75.5 75.3 73.8 72.3 73.9 72.0 68.8 64.9 63.0 63.1 60.8 60.7 56.8 55.7 56.7 56.1 54.9 56.4 55.9 54.8 58.3 +3.5Try ecstasy (MDMA) once or twice f — — — — — — — — — — 39.4 43.5 49.7 52.0 51.4 48.4 45.3 43.2 38.9 36.3 37.2 36.2 36.0‡ 53.2 54.8 +1.5Take ecstasy (MDMA) occasionally f — — — — — — — — — — 64.8 67.3 71.7 74.6 72.8 71.3 68.2 66.4 62.1 59.2 60.8 59.8 58.6‡ 69.0 70.1 +1.1Try salvia once or twice c — — — — — — — — — — — — — — — — — — — — — 12.2 10.7 — — —Take salvia occasionally c — — — — — — — — — — — — — — — — — — — — — 20.3 17.1 — — —Try crack once or twice d 70.4 69.6 66.6 64.7 60.9 60.9 59.2 58.0 57.8 56.1 57.1 57.4 57.6 56.7 57.0 56.6 56.4 56.5 57.7 58.1 59.5 59.0 60.2 61.4 62.5 +1.2Take crack occasionally d 87.4 86.4 84.4 83.1 81.2 80.3 78.7 77.5 79.1 76.9 77.3 75.7 76.4 76.7 76.9 76.2 76.0 76.5 75.9 76.2 76.5 76.7 77.8 76.4 77.5 +1.1Try cocaine powder once or twice d 59.1 59.2 57.5 56.4 53.5 53.6 52.2 50.9 51.6 48.8 50.6 51.3 51.8 50.7 51.3 50.2 49.5 49.8 50.8 52.9 53.0 53.4 54.5 54.1 54.8 +0.7Take cocaine powder occasionally d 82.2 80.1 79.1 77.8 75.6 75.0 73.9 71.8 73.6 70.9 72.3 71.0 71.4 72.2 72.4 71.3 70.9 71.1 71.0 72.2 72.0 72.6 72.8 71.7 72.6 +0.9
Try heroin once or twice without using a needle e — — — — 70.7 72.1 73.1 71.7 73.7 71.7 72.0 72.2 70.6 72.0 72.4 70.0 70.5 70.8 72.2 73.0 72.9 72.6 73.2 72.6 74.1 +1.5
Take heroin occasionally without using a needle e — — — — 85.1 85.8 86.5 84.9 86.5 85.2 85.4 83.4 83.5 85.4 85.2 83.6 84.2 83.1 83.3 84.8 83.4 84.4 84.0 82.5 83.3 +0.8Try OxyContin once or twice c — — — — — — — — — — — — — — — — — — — — — 30.9 29.4 29.7 29.9 +0.2Take OxyContin occasionally c — — — — — — — — — — — — — — — — — — — — — 48.3 44.7 44.4 43.7 -0.7Try Vicodin once or twice c — — — — — — — — — — — — — — — — — — — — — 23.2 21.0 22.5 24.1 +1.6Take Vicodin occasionally c — — — — — — — — — — — — — — — — — — — — — 40.3 36.0 36.4 35.4 -0.9Try Adderall once or twice c — — — — — — — — — — — — — — — — — — — — — 19.7 17.6 22.2 22.9 +0.6Take Adderall occasionally c — — — — — — — — — — — — — — — — — — — — — 34.3 30.5 37.0 37.0 0.0
Try bath salts (synthetic stimulants) once or twice c — — — — — — — — — — — — — — — — — — — — — 32.3 50.1 49.6 49.1 -0.5
Take bath salts (synthetic stimulants) occasionally c — — — — — — — — — — — — — — — — — — — — — 44.9 61.8 61.1 60.4 -0.8Try cough/cold medicine once or twice c — — — — — — — — — — — — — — — — — — — — — 23.6 21.6 22.9 24.0 +1.1Take cough/cold medicine occasionally c — — — — — — — — — — — — — — — — — — — — — 40.4 37.3 38.3 38.2 -0.1
Try one or two drinks of an alcoholic beverage (beer, wine, liquor) b 9.0 10.1 10.9 9.4 9.3 8.9 9.0 10.1 10.5 9.6 9.8 11.5 11.5 10.8 11.5 11.1 11.6 12.6 11.9 11.9 12.3 11.3 11.3 11.6 12.4 +0.8Take one or two drinks nearly every day b 36.1 36.8 35.9 32.5 31.7 31.2 31.8 31.9 32.9 32.3 31.5 31.0 30.9 31.3 32.6 31.7 33.3 35.0 33.8 33.1 32.9 31.8 30.6 31.3 31.2 0.0
Have five or more drinks once or twice each weekend b 54.7 55.9 54.9 52.9 52.0 50.9 51.8 52.5 51.9 51.0 50.7 51.7 51.6 51.7 53.3 52.4 54.1 56.6 54.2 54.6 55.5 52.8 52.3 54.0 54.5 +0.5Smoke one to five cigarettes per day c — — — — — — — — 28.4 30.2 32.4 35.1 38.1 39.7 41.0 41.3 41.7 43.5 42.8 41.4 44.8 49.1 47.7 52.0 52.9 +0.8
Smoke one or more packs of cigarettes per day g 60.3 59.3 60.7 59.0 57.0 57.9 59.9 61.9 62.7 65.9 64.7 64.3 65.7 68.4 68.1 67.7 68.2 69.1 67.3 67.2 69.8 71.6 70.8 72.0 72.9 +0.9
Use electronic cigarettes (e-cigarettes) regularly h — — — — — — — — — — — — — — — — — — — — — — — 14.1 17.0 +2.9 sssSmoke little cigars or cigarillos regularly c — — — — — — — — — — — — — — — — — — — — — — — 31.0 34.9 +4.0 ss
Use smokeless tobacco regularly 40.3 39.6 44.2 42.2 38.2 41.0 42.2 42.8 44.2 46.7 46.2 46.9 48.0 47.8 46.1 45.9 46.7 48.0 44.7 43.7 45.7 42.9 40.0 39.9 42.5 +2.6 sTake dissolvable tobacco regularly c — — — — — — — — — — — — — — — — — — — — — 33.3 31.3 32.0 35.6 +3.6 ssTake snus regularly c — — — — — — — — — — — — — — — — — — — — — 41.0 38.9 38.8 41.8 +3.0 sTake steroids i 67.1 72.7 73.4 72.5 — — — — — — — — — — — — — — — — — — — — — —
Approximate weighted N = 14,700 14,800 15,300 15,900 17,000 15,700 15,600 15,000 13,600 14,300 14,000 14,300 15,800 16,400 16,200 16,200 16,100 15,100 15,900 15,200 14,900 15,000 12,900 13,000 15,600(Table continued on next page.)
TABLE 6Trends in Harmfulness of Drugs as Perceived by 10th Graders
How much do you think people risk harming themselves (physically or in other ways), if they . . .
Percentage saying great risk a 2014–
2015change

Source. The Monitoring the Future study, the University of Michigan.
Notes. Level of significance of difference between the two most recent classes: s = .05, ss = .01, sss = .001. ' — ' indicates data not available. Any apparent inconsistency between the change estimate and the prevalence estimates for the two most recent years is due to rounding.
aAnswer alternatives were: (1) No risk, (2) Slight risk, (3) Moderate risk, (4) Great risk, and (5) Can’t say, drug unfamiliar.
bBeginning in 2012 data based on two thirds of N indicated.cData based on one third of N indicated.dBeginning in 1997, data based on two thirds of N indicated due to changes in questionnaire forms.eData based on one of two forms in 1993–1996; N is one half of N indicated. Beginning in 1997, data based on one third of N indicated due to changes in questionnaire forms.f Beginning in 2014 data are based on the revised question which included "Molly," N is one third of N indicated in 2014 and two thirds of N indicated in 2015. 2014 and 2015 data are not comparable to earlier years due to the revision of the question text.gBeginning in 1999, data based on two thirds of N indicated due to changes in questionnaire forms.hE-cigarette data based on two thirds of N indicated. Little cigars or cigarillos data based on one third N indicated.iData based on two forms in 1991 and 1992. Data based on one of two forms in 1993 and 1994; N is one half of N indicated.
TABLE 6 (cont.)Trends in Harmfulness of Drugs as Perceived by 10th Graders

1975 1976 1977 1978 1979 1980 1981 1982 1983 1984 1985 1986 1987 1988 1989 1990 1991 1992 1993 1994 1995Try marijuana once or twice 15.1 11.4 9.5 8.1 9.4 10.0 13.0 11.5 12.7 14.7 14.8 15.1 18.4 19.0 23.6 23.1 27.1 24.5 21.9 19.5 16.3Smoke marijuana occasionally 18.1 15.0 13.4 12.4 13.5 14.7 19.1 18.3 20.6 22.6 24.5 25.0 30.4 31.7 36.5 36.9 40.6 39.6 35.6 30.1 25.6Smoke marijuana regularly 43.3 38.6 36.4 34.9 42.0 50.4 57.6 60.4 62.8 66.9 70.4 71.3 73.5 77.0 77.5 77.8 78.6 76.5 72.5 65.0 60.8Try synthetic marijuana once or twice — — — — — — — — — — — — — — — — — — — — —Take synthetic marijuana occasionally — — — — — — — — — — — — — — — — — — — — —Try LSD once or twice 49.4 45.7 43.2 42.7 41.6 43.9 45.5 44.9 44.7 45.4 43.5 42.0 44.9 45.7 46.0 44.7 46.6 42.3 39.5 38.8 36.4Take LSD regularly 81.4 80.8 79.1 81.1 82.4 83.0 83.5 83.5 83.2 83.8 82.9 82.6 83.8 84.2 84.3 84.5 84.3 81.8 79.4 79.1 78.1Try PCP once or twice — — — — — — — — — — — — 55.6 58.8 56.6 55.2 51.7 54.8 50.8 51.5 49.1Try ecstasy (MDMA) once or twice b — — — — — — — — — — — — — — — — — — — — —Try salvia once or twice c — — — — — — — — — — — — — — — — — — — — —Take salvia occasionally — — — — — — — — — — — — — — — — — — — — —Try cocaine once or twice 42.6 39.1 35.6 33.2 31.5 31.3 32.1 32.8 33.0 35.7 34.0 33.5 47.9 51.2 54.9 59.4 59.4 56.8 57.6 57.2 53.7Take cocaine occasionally — — — — — — — — — — — 54.2 66.8 69.2 71.8 73.9 75.5 75.1 73.3 73.7 70.8Take cocaine regularly 73.1 72.3 68.2 68.2 69.5 69.2 71.2 73.0 74.3 78.8 79.0 82.2 88.5 89.2 90.2 91.1 90.4 90.2 90.1 89.3 87.9Try crack once or twice — — — — — — — — — — — — 57.0 62.1 62.9 64.3 60.6 62.4 57.6 58.4 54.6Take crack occasionally — — — — — — — — — — — — 70.4 73.2 75.3 80.4 76.5 76.3 73.9 73.8 72.8Take crack regularly — — — — — — — — — — — — 84.6 84.8 85.6 91.6 90.1 89.3 87.5 89.6 88.6Try cocaine powder once or twice — — — — — — — — — — — — 45.3 51.7 53.8 53.9 53.6 57.1 53.2 55.4 52.0Take cocaine powder occasionally — — — — — — — — — — — — 56.8 61.9 65.8 71.1 69.8 70.8 68.6 70.6 69.1Take cocaine powder regularly — — — — — — — — — — — — 81.4 82.9 83.9 90.2 88.9 88.4 87.0 88.6 87.8Try heroin once or twice 60.1 58.9 55.8 52.9 50.4 52.1 52.9 51.1 50.8 49.8 47.3 45.8 53.6 54.0 53.8 55.4 55.2 50.9 50.7 52.8 50.9Take heroin occasionally 75.6 75.6 71.9 71.4 70.9 70.9 72.2 69.8 71.8 70.7 69.8 68.2 74.6 73.8 75.5 76.6 74.9 74.2 72.0 72.1 71.0Take heroin regularly 87.2 88.6 86.1 86.6 87.5 86.2 87.5 86.0 86.1 87.2 86.0 87.1 88.7 88.8 89.5 90.2 89.6 89.2 88.3 88.0 87.2Try heroin once or twice without using a needle — — — — — — — — — — — — — — — — — — — — 55.6Take heroin occasionally without using a needle — — — — — — — — — — — — — — — — — — — — 71.2Try any narcotic other than heroin (codeine, Vicodin, OxyContin, Percocet, etc.) once or twice — — — — — — — — — — — — — — — — — — — — —Take any narcotic other than heroin occasionally — — — — — — — — — — — — — — — — — — — — —Take any narcotic other than heroin regularly — — — — — — — — — — — — — — — — — — — — —Try amphetamines once or twice d 35.4 33.4 30.8 29.9 29.7 29.7 26.4 25.3 24.7 25.4 25.2 25.1 29.1 29.6 32.8 32.2 36.3 32.6 31.3 31.4 28.8Take amphetamines regularly d 69.0 67.3 66.6 67.1 69.9 69.1 66.1 64.7 64.8 67.1 67.2 67.3 69.4 69.8 71.2 71.2 74.1 72.4 69.9 67.0 65.9Try Adderall once or twice e — — — — — — — — — — — — — — — — — — — — —Try Adderall occasionally e — — — — — — — — — — — — — — — — — — — — —Try crystal methamphetamine (ice) once or twice — — — — — — — — — — — — — — — — 61.6 61.9 57.5 58.3 54.4Try bath salts (synthetic stimulants) once or twice — — — — — — — — — — — — — — — — — — — — —Take bath salts (synthetic stimulants) occasionally — — — — — — — — — — — — — — — — — — — — —Try sedatives (barbiturates) once or twice f 34.8 32.5 31.2 31.3 30.7 30.9 28.4 27.5 27.0 27.4 26.1 25.4 30.9 29.7 32.2 32.4 35.1 32.2 29.2 29.9 26.3Take sedatives (barbiturates) regularly f 69.1 67.7 68.6 68.4 71.6 72.2 69.9 67.6 67.7 68.5 68.3 67.2 69.4 69.6 70.5 70.2 70.5 70.2 66.1 63.3 61.6Try one or two drinks of an alcoholic beverage (beer, wine, liquor) 5.3 4.8 4.1 3.4 4.1 3.8 4.6 3.5 4.2 4.6 5.0 4.6 6.2 6.0 6.0 8.3 9.1 8.6 8.2 7.6 5.9Take one or two drinks nearly every day 21.5 21.2 18.5 19.6 22.6 20.3 21.6 21.6 21.6 23.0 24.4 25.1 26.2 27.3 28.5 31.3 32.7 30.6 28.2 27.0 24.8Take four or five drinks nearly every day 63.5 61.0 62.9 63.1 66.2 65.7 64.5 65.5 66.8 68.4 69.8 66.5 69.7 68.5 69.8 70.9 69.5 70.5 67.8 66.2 62.8Have five or more drinks once or twice each weekend 37.8 37.0 34.7 34.5 34.9 35.9 36.3 36.0 38.6 41.7 43.0 39.1 41.9 42.6 44.0 47.1 48.6 49.0 48.3 46.5 45.2Smoke one or more packs of cigarettes per day 51.3 56.4 58.4 59.0 63.0 63.7 63.3 60.5 61.2 63.8 66.5 66.0 68.6 68.0 67.2 68.2 69.4 69.2 69.5 67.6 65.6Use electronic cigarettes (e-cigarettes) regularly g — — — — — — — — — — — — — — — — — — — — —Smoke little cigars or cigarillos regularly — — — — — — — — — — — — — — — — — — — — —
— — — — — — — — — — — 25.8 30.0 33.2 32.9 34.2 37.4 35.5 38.9 36.6 33.2Take steroids — — — — — — — — — — — — — — 63.8 69.9 65.6 70.7 69.1 66.1 66.4
Approximate weighted N = 2,804 2,918 3,052 3,770 3,250 3,234 3,604 3,557 3,305 3,262 3,250 3,020 3,315 3,276 2,796 2,553 2,549 2,684 2,759 2,591 2,603
(Table continued on next page.)
TABLE 7Trends in Harmfulness of Drugs as Perceived by 12th Graders
How much do you think people risk harming themselves (physically or in other ways), if they . . .
Use smokeless tobacco regularly
(Years cont.)
Percentage saying great risk a

1996 1997 1998 1999 2000 2001 2002 2003 2004 2005 2006 2007 2008 2009 2010 2011 2012 2013 2014 2015Try marijuana once or twice 15.6 14.9 16.7 15.7 13.7 15.3 16.1 16.1 15.9 16.1 17.8 18.6 17.4 18.5 17.1 15.6 14.8 14.5 12.5 12.3 -0.2Smoke marijuana occasionally 25.9 24.7 24.4 23.9 23.4 23.5 23.2 26.6 25.4 25.8 25.9 27.1 25.8 27.4 24.5 22.7 20.6 19.5 16.4 15.8 -0.6Smoke marijuana regularly 59.9 58.1 58.5 57.4 58.3 57.4 53.0 54.9 54.6 58.0 57.9 54.8 51.7 52.4 46.8 45.7 44.1 39.5 36.1 31.9 -4.2 sTry synthetic marijuana once or twice — — — — — — — — — — — — — — — — 23.5 25.9 32.5 33.0 +0.5Take synthetic marijuana occasionally — — — — — — — — — — — — — — — — 32.7 36.2 39.4 40.9 +1.5Try LSD once or twice 36.2 34.7 37.4 34.9 34.3 33.2 36.7 36.2 36.2 36.5 36.1 37.0 33.9 37.1 35.6 34.7 33.1 34.9 35.5 33.2 -2.3Take LSD regularly 77.8 76.6 76.5 76.1 75.9 74.1 73.9 72.3 70.2 69.9 69.3 67.3 63.6 67.8 65.3 65.5 66.8 66.8 62.7 60.7 -1.9Try PCP once or twice 51.0 48.8 46.8 44.8 45.0 46.2 48.3 45.2 47.1 46.6 47.0 48.0 47.4 49.7 52.4 53.9 51.6 53.9 53.8 54.4 +0.5Try ecstasy (MDMA) once or twice b — 33.8 34.5 35.0 37.9 45.7 52.2 56.3 57.7 60.1 59.3 58.1 57.0 53.3 50.6 49.0 49.4 47.5‡ 47.8 49.5 +1.7Try salvia once or twice c — — — — — — — — — — — — — — 39.8 36.7‡ 13.8 12.9 14.1 13.1 -1.0Take salvia occasionally — — — — — — — — — — — — — — — — 23.1 21.3 20.0 17.6 -2.4Try cocaine once or twice 54.2 53.6 54.6 52.1 51.1 50.7 51.2 51.0 50.7 50.5 52.5 51.3 50.3 53.1 52.8 54.0 51.6 54.4 53.7 51.1 -2.5Take cocaine occasionally 72.1 72.4 70.1 70.1 69.5 69.9 68.3 69.1 67.2 66.7 69.8 68.8 67.1 71.4 67.8 69.7 69.0 70.2 68.1 66.3 -1.9Take cocaine regularly 88.3 87.1 86.3 85.8 86.2 84.1 84.5 83.0 82.2 82.8 84.6 83.3 80.7 84.4 81.7 83.8 82.6 83.3 80.6 79.1 -1.6Try crack once or twice 56.0 54.0 52.2 48.2 48.4 49.4 50.8 47.3 47.8 48.4 47.8 47.3 47.5 48.4 50.2 51.7 52.0 55.6 54.5 53.6 -1.0Take crack occasionally 71.4 70.3 68.7 67.3 65.8 65.4 65.6 64.0 64.5 63.8 64.8 63.6 65.2 64.7 64.3 66.2 66.5 69.5 68.5 67.8 -0.7Take crack regularly 88.0 86.2 85.3 85.4 85.3 85.8 84.1 83.2 83.5 83.3 82.8 82.6 83.4 84.0 83.8 83.9 84.0 85.4 82.0 81.2 -0.8Try cocaine powder once or twice 53.2 51.4 48.5 46.1 47.0 49.0 49.5 46.2 45.4 46.2 45.8 45.1 45.1 46.5 48.2 48.0 48.1 49.9 49.9 49.0 -0.9Take cocaine powder occasionally 68.8 67.7 65.4 64.2 64.7 63.2 64.4 61.4 61.6 60.8 61.9 59.9 61.6 62.6 62.6 64.2 62.6 65.4 64.8 62.8 -2.0Take cocaine powder regularly 86.8 86.0 84.1 84.6 85.5 84.4 84.2 82.3 81.7 82.7 82.1 81.5 82.5 83.4 81.8 83.3 83.3 83.9 81.5 80.1 -1.4Try heroin once or twice 52.5 56.7 57.8 56.0 54.2 55.6 56.0 58.0 56.6 55.2 59.1 58.4 55.5 59.3 58.3 59.1 59.4 61.7 62.8 64.0 +1.2Take heroin occasionally 74.8 76.3 76.9 77.3 74.6 75.9 76.6 78.5 75.7 76.0 79.1 76.2 75.3 79.7 74.8 77.2 78.0 78.2 77.9 78.0 +0.1Take heroin regularly 89.5 88.9 89.1 89.9 89.2 88.3 88.5 89.3 86.8 87.5 89.7 87.8 86.4 89.9 85.5 87.9 88.6 87.6 85.7 84.8 -0.9Try heroin once or twice without using a needle 58.6 60.5 59.6 58.5 61.6 60.7 60.6 58.9 61.2 60.5 62.6 60.2 60.8 61.5 63.8 61.1 63.3 64.5 65.3 62.5 -2.7Take heroin occasionally without using a needle 71.0 74.3 73.4 73.6 74.7 74.4 74.7 73.0 76.1 73.3 76.2 73.9 73.2 74.8 76.2 74.7 76.1 76.4 73.6 71.1 -2.5Try any narcotic other than heroin (codeine, Vicodin, OxyContin, Percocet, etc.) once or twice — — — — — — — — — — — — — — 40.4 39.9 38.4 43.1 42.7 44.1 +1.4Take any narcotic other than heroin occasionally — — — — — — — — — — — — — — 54.3 54.8 53.8 57.3 59.0 58.5 -0.5Take any narcotic other than heroin regularly — — — — — — — — — — — — — — 74.9 75.5 73.9 75.8 72.7 73.9 +1.2Try amphetamines once or twice d 30.8 31.0 35.3 32.2 32.6 34.7 34.4 36.8 35.7 37.7 39.5 41.3 39.2 41.9 40.6‡ 34.8 34.3 36.3 34.1 34.0 -0.1Take amphetamines regularly d 66.8 66.0 67.7 66.4 66.3 67.1 64.8 65.6 63.9 67.1 68.1 68.1 65.4 69.0 63.6‡ 58.7 60.0 59.5 55.1 54.3 -0.8Try Adderall once or twice e — — — — — — — — — — — — — — 33.3 31.2 27.2 31.8 33.6 34.3 +0.7Try Adderall occasionally e — — — — — — — — — — — — — — 41.6 40.8 35.3 38.8 41.5 41.6 +0.2Try crystal methamphetamine (ice) once or twice 55.3 54.4 52.7 51.2 51.3 52.7 53.8 51.2 52.4 54.6 59.1 60.2 62.2 63.4 64.9 66.5 67.8 72.2 70.2 70.0 -0.2Try bath salts (synthetic stimulants) once or twice — — — — — — — — — — — — — — — — 33.2 59.5 59.2 57.5 -1.6Take bath salts (synthetic stimulants) occasionally — — — — — — — — — — — — — — — — 45.0 69.9 68.8 67.4 -1.4Try sedatives (barbiturates) once or twice f 29.1 26.9 29.0 26.1 25.0 25.7 26.2 27.9‡ 24.9 24.7 28.0 27.9 25.9 29.6 28.0 27.8 27.8 29.4 29.6 28.9 -0.7Take sedatives (barbiturates) regularly f 60.4 56.8 56.3 54.1 52.3 50.3 49.3 49.6‡ 54.0 54.1 56.8 55.1 50.2 54.7 52.1 52.4 53.9 53.3 50.5 50.6 +0.1Try one or two drinks of an alcoholic beverage (beer, wine, liquor) 7.3 6.7 8.0 8.3 6.4 8.7 7.6 8.4 8.6 8.5 9.3 10.5 10.0 9.4 10.8 9.4 8.7 9.9 8.6 10.3 +1.7Take one or two drinks nearly every day 25.1 24.8 24.3 21.8 21.7 23.4 21.0 20.1 23.0 23.7 25.3 25.1 24.2 23.7 25.4 24.6 23.7 23.1 21.1 21.5 +0.4Take four or five drinks nearly every day 65.6 63.0 62.1 61.1 59.9 60.7 58.8 57.8 59.2 61.8 63.4 61.8 60.8 62.4 61.1 62.3 63.6 62.4 61.2 59.1 -2.0Have five or more drinks once or twice each weekend 49.5 43.0 42.8 43.1 42.7 43.6 42.2 43.5 43.6 45.0 47.6 45.8 46.3 48.0 46.3 47.6 48.8 45.8 45.4 46.9 +1.5Smoke one or more packs of cigarettes per day 68.2 68.7 70.8 70.8 73.1 73.3 74.2 72.1 74.0 76.5 77.6 77.3 74.0 74.9 75.0 77.7 78.2 78.2 78.0 75.9 -2.1Use electronic cigarettes (e-cigarettes) regularly g — — — — — — — — — — — — — — — — — — 14.2 16.2 +1.9Smoke little cigars or cigarillos regularly — — — — — — — — — — — — — — — — — — 38.3 39.7 +1.4
37.4 38.6 40.9 41.1 42.2 45.4 42.6 43.3 45.0 43.6 45.9 44.0 42.9 40.8 41.2 42.6 44.3 41.6 40.7 38.5 -2.1Take steroids 67.6 67.2 68.1 62.1 57.9 58.9 57.1 55.0 55.7 56.8 60.2 57.4 60.8 60.2 59.2 61.1 58.6 54.2 54.6 54.4 -0.2
Approximate weighted N = 2,449 2,579 2,564 2,306 2,130 2,173 2,198 2,466 2,491 2,512 2,407 2,450 2,389 2,290 2,440 2,408 2,331 2,098 2,067 2,174
Use smokeless tobacco regularly
(Table continued on next page.)
TABLE 7 (cont.) Trends in Harmfulness of Drugs as Perceived by 12th Graders
How much do you think people risk harming themselves (physically or in other ways), if they . . .
Percentage saying great risk a
2014– 2015
change
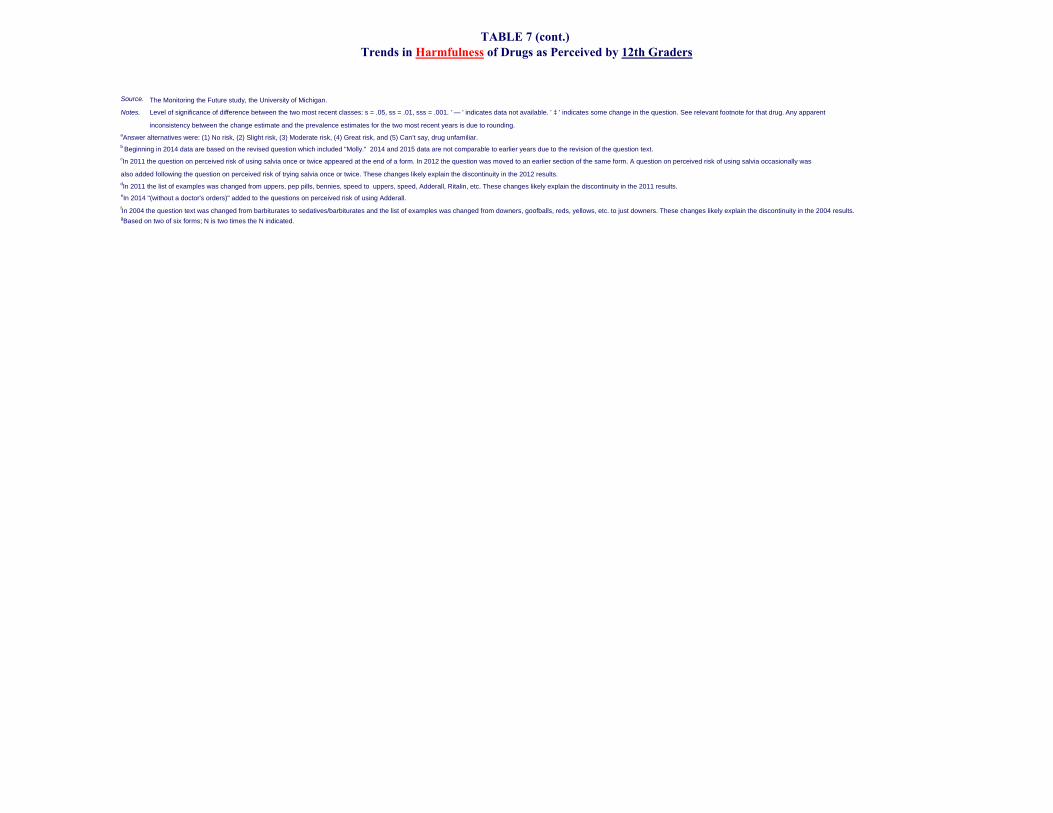
Source. The Monitoring the Future study, the University of Michigan.
Notes. Level of significance of difference between the two most recent classes: s = .05, ss = .01, sss = .001. ' — ' indicates data not available. ' ‡ ' indicates some change in the question. See relevant footnote for that drug. Any apparent
inconsistency between the change estimate and the prevalence estimates for the two most recent years is due to rounding.
b Beginning in 2014 data are based on the revised question which included "Molly." 2014 and 2015 data are not comparable to earlier years due to the revision of the question text.cIn 2011 the question on perceived risk of using salvia once or twice appeared at the end of a form. In 2012 the question was moved to an earlier section of the same form. A question on perceived risk of using salvia occasionally was
also added following the question on perceived risk of trying salvia once or twice. These changes likely explain the discontinuity in the 2012 results.
eIn 2014 "(without a doctor's orders)" added to the questions on perceived risk of using Adderall.
gBased on two of six forms; N is two times the N indicated.
fIn 2004 the question text was changed from barbiturates to sedatives/barbiturates and the list of examples was changed from downers, goofballs, reds, yellows, etc. to just downers. These changes likely explain the discontinuity in the 2004 results.
TABLE 7 (cont.) Trends in Harmfulness of Drugs as Perceived by 12th Graders
aAnswer alternatives were: (1) No risk, (2) Slight risk, (3) Moderate risk, (4) Great risk, and (5) Can’t say, drug unfamiliar.
dIn 2011 the list of examples was changed from uppers, pep pills, bennies, speed to uppers, speed, Adderall, Ritalin, etc. These changes likely explain the discontinuity in the 2011 results.

Do you disapprove of people who . . .1991 1992 1993 1994 1995 1996 1997 1998 1999 2000 2001 2002 2003 2004 2005 2006 2007 2008 2009 2010 2011 2012 2013 2014 2015
Try marijuana once or twice b 84.6 82.1 79.2 72.9 70.7 67.5 67.6 69.0 70.7 72.5 72.4 73.3 73.8 75.9 75.3 76.0 78.7 76.6 75.3 73.5 74.4 75.1 72.0 70.5 70.3 -0.2Smoke marijuana occasionally b 89.5 88.1 85.7 80.9 79.7 76.5 78.1 78.4 79.3 80.6 80.6 80.9 81.5 83.1 82.4 82.2 84.5 82.6 81.9 79.9 81.1 81.6 78.8 77.7 77.5 -0.2Smoke marijuana regularly b 92.1 90.8 88.9 85.3 85.1 82.8 84.6 84.5 84.5 85.3 84.5 85.3 85.7 86.8 86.3 86.1 87.7 86.8 85.9 84.3 85.7 85.6 83.8 82.2 82.2 0.0Try inhalants once or twice c 84.9 84.0 82.5 81.6 81.8 82.9 84.1 83.0 85.2 85.4 86.6 86.1 85.1 85.1 84.6 83.4 84.1 82.3 83.1 83.1 82.9 83.1 81.6 80.7 80.6 -0.1Take inhalants regularly
c 90.6 90.0 88.9 88.1 88.8 89.3 90.3 89.5 90.3 90.2 90.5 90.4 89.8 90.1 89.8 89.0 89.5 88.5 88.4 88.9 88.5 88.6 86.8 85.5 85.4 -0.1Take LSD once or twice d — — 77.1 75.2 71.6 70.9 72.1 69.1 69.4 66.7 64.6 62.6 61.0 58.1 58.5 53.9 53.5 52.6 53.2 53.7 55.4 51.8 52.0 52.8 56.0 +3.2 sTake LSD regularly
d — — 79.8 78.4 75.8 75.3 76.3 72.5 72.5 69.3 67.0 65.5 63.5 60.5 60.7 55.8 55.6 54.7 55.7 55.8 57.6 54.1 53.6 54.8 58.1 +3.3 sTry ecstasy (MDMA) once or twice e — — — — — — — — — — 69.0 74.3 77.7 76.3 75.0 66.7 65.7 63.5 62.3 62.4 64.2 60.2 60.9 61.0‡ 68.2 —Take ecstasy (MDMA) occasionally
e — — — — — — — — — — 73.6 78.6 81.3 79.4 77.9 69.8 68.3 66.5 65.7 65.9 67.5 63.2 63.4 64.1‡ 71.7 —Try crack once or twice c 91.7 90.7 89.1 86.9 85.9 85.0 85.7 85.4 86.0 85.4 86.0 86.2 86.4 87.4 87.6 87.2 88.6 87.2 88.4 89.1 88.5 89.0 88.1 88.0 87.5 -0.5Take crack occasionally c 93.3 92.5 91.7 89.9 89.8 89.3 90.3 89.5 89.9 88.8 89.8 89.6 89.8 90.3 90.5 90.0 91.2 90.3 91.0 91.5 91.0 91.2 90.3 89.8 89.8 -0.1Try cocaine powder once or twice c 91.2 89.6 88.5 86.1 85.3 83.9 85.1 84.5 85.2 84.8 85.6 85.8 85.6 86.8 87.0 86.5 88.2 86.8 88.1 88.4 88.3 88.6 88.0 87.7 87.5 -0.2Take cocaine powder occasionally c 93.1 92.4 91.6 89.7 89.7 88.7 90.1 89.3 89.9 88.8 89.6 89.9 89.8 90.3 90.7 90.2 91.0 90.1 90.7 91.4 91.3 91.5 90.6 90.1 90.1 0.0
Try heroin once or twice without using a needle d — — — — 85.8 85.0 87.7 87.3 88.0 87.2 87.2 87.8 86.9 86.6 86.9 87.2 88.4 86.9 88.6 89.5 87.5 86.8 87.2 87.1 87.1 0.0
Take heroin occasionally without using a needle d — — — — 88.5 87.7 90.1 89.7 90.2 88.9 88.9 89.6 89.0 88.6 88.5 88.5 89.7 88.2 90.1 90.6 89.0 87.7 88.2 88.1 88.0 -0.1
Try one or two drinks of an alcoholic beverage (beer, wine, liquor) b 51.7 52.2 50.9 47.8 48.0 45.5 45.7 47.5 48.3 48.7 49.8 51.1 49.7 51.1 51.2 51.3 54.0 52.5 52.7 54.2 54.0 54.1 53.3 53.3 53.7 +0.4Take one or two drinks nearly every day b 82.2 81.0 79.6 76.7 75.9 74.1 76.6 76.9 77.0 77.8 77.4 78.3 77.1 78.6 78.7 78.7 80.4 79.2 78.5 79.5 80.7 81.3 80.2 79.6 79.7 +0.1
Have five or more drinks once or twice each weekend b 85.2 83.9 83.3 80.7 80.7 79.1 81.3 81.0 80.3 81.2 81.6 81.9 81.9 82.3 82.9 82.0 83.8 83.2 83.2 83.6 84.8 86.0 85.0 84.9 85.4 +0.5Smoke one to five cigarettes per day
e — — — — — — — — 75.1 79.1 80.4 81.1 81.4 83.1 82.9 83.5 85.3 85.0 83.6 84.7 86.8 — — — —
Smoke one or more packs of cigarettes per day
f 82.8 82.3 80.6 78.4 78.6 77.3 80.3 80.0 81.4 81.9 83.5 84.6 84.6 85.7 85.3 85.6 87.0 86.7 87.1 87.0 88.0 88.8 88.0 87.5 88.8 +1.3
Use electronic cigarettes (e-cigarettes) regularly e — — — — — — — — — — — — — — — — — — — — — — — 58.4 65.0 +6.6 sssUse smokeless tobacco regularly b 79.1 77.2 77.1 75.1 74.0 74.1 76.5 76.3 78.0 79.2 79.4 80.6 80.7 81.0 82.0 81.0 82.3 82.1 81.5 81.2 82.6 82.7 81.5 80.2 82.5 +2.3 sTake steroids g 89.8 90.3 89.9 87.9 — — — — — — — — — — — — — — — — — — — — — —
Approximate weighted N = 17,400 18,500 18,400 17,400 17,600 18,000 18,800 18,100 16,700 16,700 16,200 15,100 16,500 17,000 16,800 16,500 16,100 15,700 15,000 15,300 16,000 15,100 14,600 14,600 14,400Source. The Monitoring the Future study, the University of Michigan.
Notes. Level of significance of difference between the two most recent classes: s = .05, ss = .01, sss = .001. ' — ' indicates data not available. Any apparent inconsistency between the change estimate and the prevalence estimates for the two most recent years is due to rounding.aAnswer alternatives were: (1) Don’t disapprove, (2) Disapprove, (3) Strongly disapprove, and (4) Can’t say, drug unfamiliar. Percentages are shown for categories (2) and (3) combined.bBeginning in 2012, data based on two thirds of N indicated. cBeginning in 1997, data based on two thirds of N indicated due to changes in questionnaire forms.dData based on one of two forms in 1993–1996; N is one half of N indicated. Beginning in 1997, data based on one third of N indicated due to changes in questionnaire forms.eData based on one third of N indicated. For MDMA "Molly" was added to the question text in 2015; 2014 and 2015 data are not comparable due to this change.fBeginning in 1999, data based on two thirds of N indicated due to changes in questionnaire forms.gData based on two forms in 1991 and 1992. Data based on one of two forms in 1993 and 1994; N is one half of N indicated.
change
TABLE 8Trends in Disapproval of Drug Use in Grade 8
Percentage who disapprove or strongly disapprove a 2014–
2015

Do you disapprove of people who . . .1991 1992 1993 1994 1995 1996 1997 1998 1999 2000 2001 2002 2003 2004 2005 2006 2007 2008 2009 2010 2011 2012 2013 2014 2015
Try marijuana once or twice b 74.6 74.8 70.3 62.4 59.8 55.5 54.1 56.0 56.2 54.9 54.8 57.8 58.1 60.4 61.3 62.5 63.9 64.5 60.1 59.2 58.5 56.2 53.2 53.8 52.7 -1.2Smoke marijuana occasionally b 83.7 83.6 79.4 72.3 70.0 66.9 66.2 67.3 68.2 67.2 66.2 68.3 68.4 70.8 71.9 72.6 73.3 73.6 69.2 68.0 67.9 65.7 62.1 62.9 62.6 -0.3Smoke marijuana regularly b 90.4 90.0 87.4 82.2 81.1 79.7 79.7 80.1 79.8 79.1 78.0 78.6 78.8 81.3 82.0 82.5 82.4 83.0 79.9 78.7 78.8 77.3 73.8 74.6 74.3 -0.4Try inhalants once or twice c 85.2 85.6 84.8 84.9 84.5 86.0 86.9 85.6 88.4 87.5 87.8 88.6 87.7 88.5 88.1 88.1 87.6 87.1 87.0 86.5 86.9 85.7 86.1 85.9 84.1 -1.8 sTake inhalants regularly
c 91.0 91.5 90.9 91.0 90.9 91.7 91.7 91.1 92.4 91.8 91.3 91.8 91.0 92.3 91.9 92.2 91.8 91.6 91.1 90.8 90.9 90.0 89.7 89.7 88.3 -1.3Take LSD once or twice d — — 82.1 79.3 77.9 76.8 76.6 76.7 77.8 77.0 75.4 74.6 74.4 72.4 71.8 71.2 67.7 66.3 67.8 68.2 68.5 68.3 69.1 67.8 70.3 +2.5Take LSD regularly
d — — 86.8 85.6 84.8 84.5 83.4 82.9 84.3 82.1 80.8 79.4 77.6 75.9 75.0 74.9 71.5 69.8 72.2 72.9 72.5 73.0 74.2 73.3 76.5 +3.2 sTry ecstasy (MDMA) once or twice e — — — — — — — — — — 72.6 77.4 81.0 83.7 83.1 81.6 80.0 78.1 76.5 75.5 76.1 75.3 75.4 74.4‡ 78.0 —Take ecstasy (MDMA) occasionally
e — — — — — — — — — — 81.0 84.6 86.3 88.0 87.4 86.0 84.3 83.0 81.3 81.3 82.2 81.2 81.3 80.4‡ 84.0 —Try crack once or twice c 92.5 92.5 91.4 89.9 88.7 88.2 87.4 87.1 87.8 87.1 86.9 88.0 87.6 88.6 88.8 89.5 89.5 90.8 90.4 90.3 90.9 91.0 90.6 90.6 90.1 -0.5Take crack occasionally
c 94.3 94.4 93.6 92.5 91.7 91.9 91.0 90.6 91.5 90.9 90.6 91.0 91.0 91.8 91.8 92.0 92.7 92.9 92.8 92.4 93.0 93.0 92.4 92.4 92.1 -0.3Try cocaine powder once or twice c 90.8 91.1 90.0 88.1 86.8 86.1 85.1 84.9 86.0 84.8 85.3 86.4 85.9 86.8 86.9 87.3 87.7 88.6 88.4 89.0 89.4 89.3 88.7 88.9 87.9 -1.0Take cocaine powder occasionally
c 94.0 94.0 93.2 92.1 91.4 91.1 90.4 89.7 90.7 89.9 90.2 89.9 90.4 91.2 91.2 91.4 92.0 92.1 92.1 92.2 92.5 92.4 91.8 91.9 91.8 -0.1
Try heroin once or twice without using a needle d — — — — 89.7 89.5 89.1 88.6 90.1 90.1 89.1 89.2 89.3 90.1 90.3 91.1 90.7 91.4 91.6 91.4 91.6 91.9 91.3 91.9 91.7 -0.2
Take heroin occasionally without using a needle d — — — — 91.6 91.7 91.4 90.5 91.8 92.3 90.8 90.7 90.6 91.8 92.0 92.5 92.5 92.5 93.0 92.4 92.4 92.9 92.3 92.7 92.7 0.0
Try one or two drinks of an alcoholic beverage (beer, wine, liquor) b 37.6 39.9 38.5 36.5 36.1 34.2 33.7 34.7 35.1 33.4 34.7 37.7 36.8 37.6 38.5 37.8 39.5 41.8 39.7 40.3 41.5 39.6 38.5 40.7 40.0 -0.7Take one or two drinks nearly every day b 81.7 81.7 78.6 75.2 75.4 73.8 75.4 74.6 75.4 73.8 73.8 74.9 74.2 75.1 76.9 76.4 77.1 79.1 77.6 77.6 80.0 78.0 77.1 77.9 78.2 +0.3
Have five or more drinks once or twice each weekend b 76.7 77.6 74.7 72.3 72.2 70.7 70.2 70.5 69.9 68.2 69.2 71.5 71.6 71.8 73.7 72.9 74.1 77.2 75.1 75.9 77.3 77.5 77.8 79.5 79.6 +0.1Smoke one to five cigarettes per day
e — — — — — — — — 67.8 69.1 71.2 74.3 76.2 77.5 79.3 80.2 79.7 82.5 80.0 80.6 82.1 — — — —
Smoke one or more packs of cigarettes per day
f 79.4 77.8 76.5 73.9 73.2 71.6 73.8 75.3 76.1 76.7 78.2 80.6 81.4 82.7 84.3 83.2 84.7 85.2 84.5 83.9 85.8 86.0 86.1 88.0 88.3 +0.3
Use electronic cigarettes (e-cigarettes) regularly e — — — — — — — — — — — — — — — — — — — — — — — 54.6 59.9 +5.3 ssUse smokeless tobacco regularly b 75.4 74.6 73.8 71.2 71.0 71.0 72.3 73.2 75.1 75.8 76.1 78.7 79.4 80.2 80.5 80.5 80.9 81.8 79.5 78.5 79.5 79.5 77.7 78.7 80.1 +1.4Take steroids g 90.0 91.0 91.2 90.8 — — — — — — — — — — — — — — — — — — — — — —
Approximate weighted N = 14,800 14,800 15,300 15,900 17,000 15,700 15,600 15,000 13,600 14,300 14,000 14,300 15,800 16,400 16,200 16,200 16,100 15,100 15,900 15,200 14,900 15,000 12,900 13,000 15,600Source. The Monitoring the Future study, the University of Michigan.
Notes. Level of significance of difference between the two most recent classes: s = .05, ss = .01, sss = .001. ' — ' indicates data not available. Any apparent inconsistency between the change estimate and the prevalence estimates for the two most recent years is due to rounding. aAnswer alternatives were: (1) Don’t disapprove, (2) Disapprove, (3) Strongly disapprove, and (4) Can’t say, drug unfamiliar. Percentages are shown for categories (2) and (3) combined.bBeginning in 2012, data based on two thirds of N indicated.cBeginning in 1997, data based on two thirds of N indicated due to changes in questionnaire forms.dData based on one of two forms in 1993–1996; N is one half of N indicated. Beginning in 1997, data based on one third of N indicated due to changes in questionnaire forms. eData based on one third of N indicated. For MDMA "Molly" was added to the question text in 2015; 2014 and 2015 data are not comparable due to this change.fBeginning in 1999, data based on two thirds of N indicated due to changes in questionnaire forms.gData based on two forms in 1991 and 1992. Data based on one of two forms in 1993 and 1994; N is one half of N indicated.
change
TABLE 9Trends in Disapproval of Drug Use in Grade 10
Percentage who disapprove or strongly disapprove a 2014–
2015

1975 1976 1977 1978 1979 1980 1981 1982 1983 1984 1985 1986 1987 1988 1989 1990 1991 1992 1993 1994 1995
Trying marijuana once or twice 47.0 38.4 33.4 33.4 34.2 39.0 40.0 45.5 46.3 49.3 51.4 54.6 56.6 60.8 64.6 67.8 68.7 69.9 63.3 57.6 56.7
Smoking marijuana occasionally 54.8 47.8 44.3 43.5 45.3 49.7 52.6 59.1 60.7 63.5 65.8 69.0 71.6 74.0 77.2 80.5 79.4 79.7 75.5 68.9 66.7
Smoking marijuana regularly 71.9 69.5 65.5 67.5 69.2 74.6 77.4 80.6 82.5 84.7 85.5 86.6 89.2 89.3 89.8 91.0 89.3 90.1 87.6 82.3 81.9
Trying LSD once or twice 82.8 84.6 83.9 85.4 86.6 87.3 86.4 88.8 89.1 88.9 89.5 89.2 91.6 89.8 89.7 89.8 90.1 88.1 85.9 82.5 81.1
Taking LSD regularly 94.1 95.3 95.8 96.4 96.9 96.7 96.8 96.7 97.0 96.8 97.0 96.6 97.8 96.4 96.4 96.3 96.4 95.5 95.8 94.3 92.5Trying ecstasy (MDMA) once or twice c — — — — — — — — — — — — — — — — — — — — —
Trying cocaine once or twice 81.3 82.4 79.1 77.0 74.7 76.3 74.6 76.6 77.0 79.7 79.3 80.2 87.3 89.1 90.5 91.5 93.6 93.0 92.7 91.6 90.3
Taking cocaine regularly 93.3 93.9 92.1 91.9 90.8 91.1 90.7 91.5 93.2 94.5 93.8 94.3 96.7 96.2 96.4 96.7 97.3 96.9 97.5 96.6 96.1
Trying crack once or twice — — — — — — — — — — — — — — — 92.3 92.1 93.1 89.9 89.5 91.4
Taking crack occasionally — — — — — — — — — — — — — — — 94.3 94.2 95.0 92.8 92.8 94.0
Taking crack regularly — — — — — — — — — — — — — — — 94.9 95.0 95.5 93.4 93.1 94.1
Trying cocaine powder once or twice — — — — — — — — — — — — — — — 87.9 88.0 89.4 86.6 87.1 88.3
Taking cocaine powder occasionally — — — — — — — — — — — — — — — 92.1 93.0 93.4 91.2 91.0 92.7
Taking cocaine powder regularly — — — — — — — — — — — — — — — 93.7 94.4 94.3 93.0 92.5 93.8
Trying heroin once or twice 91.5 92.6 92.5 92.0 93.4 93.5 93.5 94.6 94.3 94.0 94.0 93.3 96.2 95.0 95.4 95.1 96.0 94.9 94.4 93.2 92.8
Taking heroin occasionally 94.8 96.0 96.0 96.4 96.8 96.7 97.2 96.9 96.9 97.1 96.8 96.6 97.9 96.9 97.2 96.7 97.3 96.8 97.0 96.2 95.7
Taking heroin regularly 96.7 97.5 97.2 97.8 97.9 97.6 97.8 97.5 97.7 98.0 97.6 97.6 98.1 97.2 97.4 97.5 97.8 97.2 97.5 97.1 96.4
Trying heroin once or twice without using a needle — — — — — — — — — — — — — — — — — — — — 92.9
Taking heroin occasionally without using a needle — — — — — — — — — — — — — — — — — — — — 94.7Trying amphetamines once or twice d 74.8 75.1 74.2 74.8 75.1 75.4 71.1 72.6 72.3 72.8 74.9 76.5 80.7 82.5 83.3 85.3 86.5 86.9 84.2 81.3 82.2Taking amphetamines regularly d 92.1 92.8 92.5 93.5 94.4 93.0 91.7 92.0 92.6 93.6 93.3 93.5 95.4 94.2 94.2 95.5 96.0 95.6 96.0 94.1 94.3Trying sedatives (barbiturates) once or twice e 77.7 81.3 81.1 82.4 84.0 83.9 82.4 84.4 83.1 84.1 84.9 86.8 89.6 89.4 89.3 90.5 90.6 90.3 89.7 87.5 87.3Taking sedatives (barbiturates) regularly e 93.3 93.6 93.0 94.3 95.2 95.4 94.2 94.4 95.1 95.1 95.5 94.9 96.4 95.3 95.3 96.4 97.1 96.5 97.0 96.1 95.2
Trying one or two drinks of an alcoholic beverage
(beer, wine, liquor) 21.6 18.2 15.6 15.6 15.8 16.0 17.2 18.2 18.4 17.4 20.3 20.9 21.4 22.6 27.3 29.4 29.8 33.0 30.1 28.4 27.3
Taking one or two drinks nearly every day 67.6 68.9 66.8 67.7 68.3 69.0 69.1 69.9 68.9 72.9 70.9 72.8 74.2 75.0 76.5 77.9 76.5 75.9 77.8 73.1 73.3
Taking four or five drinks nearly every day 88.7 90.7 88.4 90.2 91.7 90.8 91.8 90.9 90.0 91.0 92.0 91.4 92.2 92.8 91.6 91.9 90.6 90.8 90.6 89.8 88.8
Having five or more drinks once or twice
each weekend 60.3 58.6 57.4 56.2 56.7 55.6 55.5 58.8 56.6 59.6 60.4 62.4 62.0 65.3 66.5 68.9 67.4 70.7 70.1 65.1 66.7
Smoking one or more packs of cigarettes per day 67.5 65.9 66.4 67.0 70.3 70.8 69.9 69.4 70.8 73.0 72.3 75.4 74.3 73.1 72.4 72.8 71.4 73.5 70.6 69.8 68.2
Taking steroids — — — — — — — — — — — — — — — 90.8 90.5 92.1 92.1 91.9 91.0
Approximate weighted N = 2,677 2,957 3,085 3,686 3,221 3,261 3,610 3,651 3,341 3,254 3,265 3,113 3,302 3,311 2,799 2,566 2,547 2,645 2,723 2,588 2,603
TABLE 10Trends in Disapproval of Drug Use in Grade 12
(Table continued on next page.)
(Years cont.)
Do you disapprove of people (who are 18 or older) doing each of the following? a
Percentage who disapprove or strongly disapprove b

1996 1997 1998 1999 2000 2001 2002 2003 2004 2005 2006 2007 2008 2009 2010 2011 2012 2013 2014 2015
Trying marijuana once or twice 52.5 51.0 51.6 48.8 52.5 49.1 51.6 53.4 52.7 55.0 55.6 58.6 55.5 54.8 51.6 51.3 48.8 49.1 48.0 45.5 -2.5
Smoking marijuana occasionally 62.9 63.2 64.4 62.5 65.8 63.2 63.4 64.2 65.4 67.8 69.3 70.2 67.3 65.6 62.0 60.9 59.1 58.9 56.7 52.9 -3.8
Smoking marijuana regularly 80.0 78.8 81.2 78.6 79.7 79.3 78.3 78.7 80.7 82.0 82.2 83.3 79.6 80.3 77.7 77.5 77.8 74.5 73.4 70.7 -2.7
Trying LSD once or twice 79.6 80.5 82.1 83.0 82.4 81.8 84.6 85.5 87.9 87.9 88.0 87.8 85.5 88.2 86.5 86.3 87.2 86.6 85.0 81.7 -3.3 s
Taking LSD regularly 93.2 92.9 93.5 94.3 94.2 94.0 94.0 94.4 94.6 95.6 95.9 94.9 93.5 95.3 94.3 94.9 95.2 95.3 94.7 92.5 -2.2 ssTrying ecstasy (MDMA) once or twice c — 82.2 82.5 82.1 81.0 79.5 83.6 84.7 87.7 88.4 89.0 87.8 88.2 88.2 86.3 83.9 87.1 84.9‡ 83.1 84.5 +1.4
Trying cocaine once or twice 90.0 88.0 89.5 89.1 88.2 88.1 89.0 89.3 88.6 88.9 89.1 89.6 89.2 90.8 90.5 91.1 91.0 92.3 90.0 89.0 -0.9
Taking cocaine regularly 95.6 96.0 95.6 94.9 95.5 94.9 95.0 95.8 95.4 96.0 96.1 96.2 94.8 96.5 96.0 96.0 96.8 96.7 96.3 95.2 -1.1
Trying crack once or twice 87.4 87.0 86.7 87.6 87.5 87.0 87.8 86.6 86.9 86.7 88.8 88.8 89.6 90.9 89.8 91.4 92.8 91.4 89.3 90.2 +0.8
Taking crack occasionally 91.2 91.3 90.9 92.3 91.9 91.6 91.5 90.8 92.1 91.9 92.9 92.4 93.3 94.0 92.6 93.9 95.0 93.6 91.9 92.5 +0.7
Taking crack regularly 93.0 92.3 91.9 93.2 92.8 92.2 92.4 91.2 93.1 92.1 93.8 93.6 93.5 94.3 93.1 94.4 95.4 94.1 92.4 92.8 +0.3
Trying cocaine powder once or twice 83.1 83.0 83.1 84.3 84.1 83.3 83.8 83.6 82.2 83.2 84.1 83.5 85.7 87.3 87.0 88.1 88.7 88.2 85.5 86.4 +0.8
Taking cocaine powder occasionally 89.7 89.3 88.7 90.0 90.3 89.8 90.2 88.9 90.0 89.4 90.4 90.6 91.7 92.3 91.0 92.2 93.0 91.7 90.4 91.3 +0.9
Taking cocaine powder regularly 92.9 91.5 91.1 92.3 92.6 92.5 92.2 90.7 92.6 92.0 93.2 92.6 92.8 93.9 92.6 93.8 95.0 94.1 91.7 92.4 +0.7
Trying heroin once or twice 92.1 92.3 93.7 93.5 93.0 93.1 94.1 94.1 94.2 94.3 93.8 94.8 93.3 94.7 93.9 94.3 95.8 95.6 94.7 94.2 -0.6
Taking heroin occasionally 95.0 95.4 96.1 95.7 96.0 95.4 95.6 95.9 96.4 96.3 96.2 96.8 95.3 96.9 96.2 96.3 97.0 96.9 96.6 95.3 -1.3 s
Taking heroin regularly 96.3 96.4 96.6 96.4 96.6 96.2 96.2 97.1 97.1 96.7 96.9 97.1 95.9 97.4 96.4 96.7 97.4 97.4 97.1 96.4 -0.7
Trying heroin once or twice without using a needle 90.8 92.3 93.0 92.6 94.0 91.7 93.1 92.2 93.1 93.2 93.7 93.6 94.2 94.7 93.2 92.6 95.2 93.7 92.5 92.6 +0.1
Taking heroin occasionally without using a needle 93.2 94.4 94.3 93.8 95.2 93.5 94.4 93.5 94.4 95.0 94.5 94.9 95.3 95.5 94.5 94.1 95.9 94.6 93.5 92.8 -0.7Trying amphetamines once or twice d 79.9 81.3 82.5 81.9 82.1 82.3 83.8 85.8 84.1 86.1 86.3 87.3 87.2 88.2 88.1‡ 84.1 83.9 84.9 83.1 81.4 -1.7Taking amphetamines regularly d 93.5 94.3 94.0 93.7 94.1 93.4 93.5 94.0 93.9 94.8 95.3 95.4 94.2 95.6 94.9‡ 92.9 93.9 93.2 93.0 92.2 -0.7
Trying sedatives (barbiturates) once or twice e 84.9 86.4 86.0 86.6 85.9 85.9 86.6 87.8‡ 83.7 85.4 85.3 86.5 86.1 87.7 87.6 87.3 88.2 88.9 88.5 87.4 -1.1Taking sedatives (barbiturates) regularly e 94.8 95.3 94.6 94.7 95.2 94.5 94.7 94.4‡ 94.2 95.2 95.1 94.6 94.3 95.8 94.7 95.1 96.1 95.8 95.0 94.7 -0.3
Trying one or two drinks of an alcoholic beverage
(beer, wine, liquor) 26.5 26.1 24.5 24.6 25.2 26.6 26.3 27.2 26.0 26.4 29.0 31.0 29.8 30.6 30.7 28.7 25.4 27.3 29.2 28.9 -0.2
Taking one or two drinks nearly every day 70.8 70.0 69.4 67.2 70.0 69.2 69.1 68.9 69.5 70.8 72.8 73.3 74.5 70.5 71.5 72.8 70.8 71.9 71.7 71.1 -0.6
Taking four or five drinks nearly every day 89.4 88.6 86.7 86.9 88.4 86.4 87.5 86.3 87.8 89.4 90.6 90.5 89.8 89.7 88.8 90.8 90.1 90.6 91.9 89.7 -2.2 s
Having five or more drinks once or twice
each weekend 64.7 65.0 63.8 62.7 65.2 62.9 64.7 64.2 65.7 66.5 68.5 68.8 68.9 67.6 68.8 70.0 70.1 71.6 72.6 71.9 -0.7
Smoking one or more packs of cigarettes per day 67.2 67.1 68.8 69.5 70.1 71.6 73.6 74.8 76.2 79.8 81.5 80.7 80.5 81.8 81.0 83.0 83.7 82.6 85.0 84.1 -1.0
Taking steroids 91.7 91.4 90.8 88.9 88.8 86.4 86.8 86.0 87.9 88.8 89.4 89.2 90.9 90.3 89.8 89.7 90.4 88.2 87.5 87.8 +0.3Approximate weighted N = 2,399 2,601 2,545 2,310 2,150 2,144 2,160 2,442 2,455 2,460 2,377 2,450 2,314 2,233 2,449 2,384 2,301 2,147 2,078 2,193
Source. The Monitoring the Future study, the University of Michigan.
Notes. Level of significance of difference between the two most recent classes: s = .05, ss = .01, sss = .001. ' —' indicates data not available. ' ‡ ' indicates some change in the question. See relevant footnote for that drug. Any apparent inconsistency between
the change estimate and the prevalence estimates for the two most recent years is due to rounding.
cBeginning in 2014 "molly" was added to the question on disapproval of using MDMA once or twice. 2014 and 2015 data are not comparable to earlier years due to this change.dIn 2011 the list of examples was changed from upper, pep pill, bennie, speed to upper, speed, Adderall, Ritalin, etc. These changes likely explain the discontinuity in the 2011 results.
aThe 1975 question asked about people who are 20 or older.bAnswer alternatives were: (1) Don’t disapprove, (2) Disapprove, and (3) Strongly disapprove. Percentages are shown for categories (2) and (3) combined.
eIn 2004 the question text was changed from barbiturates to sedatives/barbiturates and the list of examples was changed from downers, goofballs, reds, yellows, etc. to just downers. These changes likely explain the discontinuity in the 2004 results.
Do you disapprove of people (who are 18 or older) doing each of the following? a
Percentage who disapprove or strongly disapprove b
2014–2015
change
Trends in Disapproval of Drug Use in Grade 12TABLE 10 (cont.)

1991 1992 1993 1994 1995 1996 1997 1998 1999 2000 2001 2002 2003 2004 2005 2006 2007 2008 2009 2010 2011 2012 2013 2014 2015
Marijuana — 42.3 43.8 49.9 52.4 54.8 54.2 50.6 48.4 47.0 48.1 46.6 44.8 41.0 41.1 39.6 37.4 39.3 39.8 41.4 37.9 36.9 39.1 36.9 37.0 +0.1
LSD — 21.5 21.8 21.8 23.5 23.6 22.7 19.3 18.3 17.0 17.6 15.2 14.0 12.3 11.5 10.8 10.5 10.9 10.0 10.0 9.3 7.5 7.4 6.9 6.6 -0.3PCP b — 18.0 18.5 17.7 19.0 19.6 19.2 17.5 17.1 16.0 15.4 14.1 13.7 11.4 11.0 10.5 9.5 10.1 9.1 8.0 7.9 6.7 5.8 5.5 5.1 -0.4Ecstasy (MDMA) b — — — — — — — — — — 23.8 22.8 21.6 16.6 15.6 14.5 13.4 14.1 13.1 12.9 12.0 9.6 9.5 10.1 9.6 -0.5
Crack — 25.6 25.9 26.9 28.7 27.9 27.5 26.5 25.9 24.9 24.4 23.7 22.5 20.6 20.8 20.9 19.7 20.2 18.6 17.9 15.7 14.4 13.7 12.0 11.3 -0.7
Cocaine powder — 25.7 25.9 26.4 27.8 27.2 26.9 25.7 25.0 23.9 23.9 22.5 21.6 19.4 19.9 20.2 19.0 19.5 17.8 16.6 14.9 14.1 13.5 11.9 11.6 -0.3
Heroin — 19.7 19.8 19.4 21.1 20.6 19.8 18.0 17.5 16.5 16.9 16.0 15.6 14.1 13.2 13.0 12.6 13.3 12.0 11.6 9.9 9.4 10.0 8.6 7.8 -0.8Narcotics other than Heroin b,c — 19.8 19.0 18.3 20.3 20.0 20.6 17.1 16.2 15.6 15.0 14.7 15.0 12.4 12.9 13.0 11.7 12.1 11.8‡ 14.6 12.3 10.6 9.7 9.2 8.8 -0.4Amphetamines d — 32.2 31.4 31.0 33.4 32.6 30.6 27.3 25.9 25.5 26.2 24.4 24.4 21.9 21.0 20.7 19.9 21.3 20.2 19.6‡ 15.0 13.4 12.8 12.1 11.8 -0.3Crystal methamphetamine (ice) b — 16.0 15.1 14.1 16.0 16.3 15.7 16.0 14.7 14.9 13.9 13.3 14.1 11.9 13.5 14.5 12.1 12.8 11.9 10.9 9.6 8.8 8.5 7.7 6.9 -0.8
Sedatives (barbiturates) — 27.4 26.1 25.3 26.5 25.6 24.4 21.1 20.8 19.7 20.7 19.4 19.3 18.0 17.6 17.3 16.8 17.5 15.9 15.3 12.6 11.1 10.6 10.0 9.0 -1.0
Tranquilizers — 22.9 21.4 20.4 21.3 20.4 19.6 18.1 17.3 16.2 17.8 16.9 17.3 15.8 14.8 14.4 14.4 15.4 14.1 13.7 12.0 10.5 10.4 9.8 9.8 0.0
Alcohol — 76.2 73.9 74.5 74.9 75.3 74.9 73.1 72.3 70.6 70.6 67.9 67.0 64.9 64.2 63.0 62.0 64.1 61.8 61.1 59.0 57.5 56.1 54.4 53.6 -0.7
Cigarettes — 77.8 75.5 76.1 76.4 76.9 76.0 73.6 71.5 68.7 67.7 64.3 63.1 60.3 59.1 58.0 55.6 57.4 55.3 55.5 51.9 50.7 49.9 47.2 47.0 -0.2
Steroids — 24.0 22.7 23.1 23.8 24.1 23.6 22.3 22.6 22.3 23.1 22.0 21.7 19.7 18.1 17.1 17.0 16.8 15.2 14.2 13.3 12.5 12.9 11.8 11.6 -0.2
Approximate weighted N = 8,355 16,775 16,119 15,496 16,318 16,482 16,208 15,397 15,180 14,804 13,972 15,583 15,944 15,730 15,502 15,043 14,482 13,989 14,485 15,233 14,235 13,605 13,208 13,494
Source. The Monitoring the Future study, the University of Michigan.
Notes. Level of significance of difference between the two most recent classes: s = .05, ss = .01, sss = .001. ' — ' indicates data not available. ' ‡ ' indicates some change in the question. See relevant footnote for that drug. Any apparent inconsistency between the change estimate
and the prevalence estimates for the two most recent years is due to rounding. aAnswer alternatives were: (1) Probably impossible, (2) Very difficult, (3) Fairly difficult, (4) Fairly easy, (5) Very easy, and (6) Can't say, drug unfamiliar. bBeginning in 1993, data based on one of two of forms; N is one half of N indicated. Beginning in 2014 data based on one sixth of N indicated. For MDMA only: In 2014 the question text was changed in one form to include "Molly." In 2015 a second from was changed to including
"Molly;" data based on one sixth of N indicated in 2014 and on one half of N indicated in 2015. An examination of the data did not show any effect from this wording change.cIn 2010 the list of examples for narcotics other than heroin was changed from methadone, opium to Vicodin, OxyContin, Percocet, etc. This change likely explains the discontinuity in the 2010 results.dIn 2011 the list of examples for amphetamines was changed from uppers, pep pills, bennies, speed to uppers, speed, Adderall, Ritalin, etc. These changes likely explain the discontinuity in the 2012 results.
TABLE 11Trends in Availability of Drugs as Perceived by 8th Graders
How difficult do you think it would be for you to get each of the following types of drugs, if you wanted some?
Percentage saying fairly easy or very easy to get a 2014–
2015change
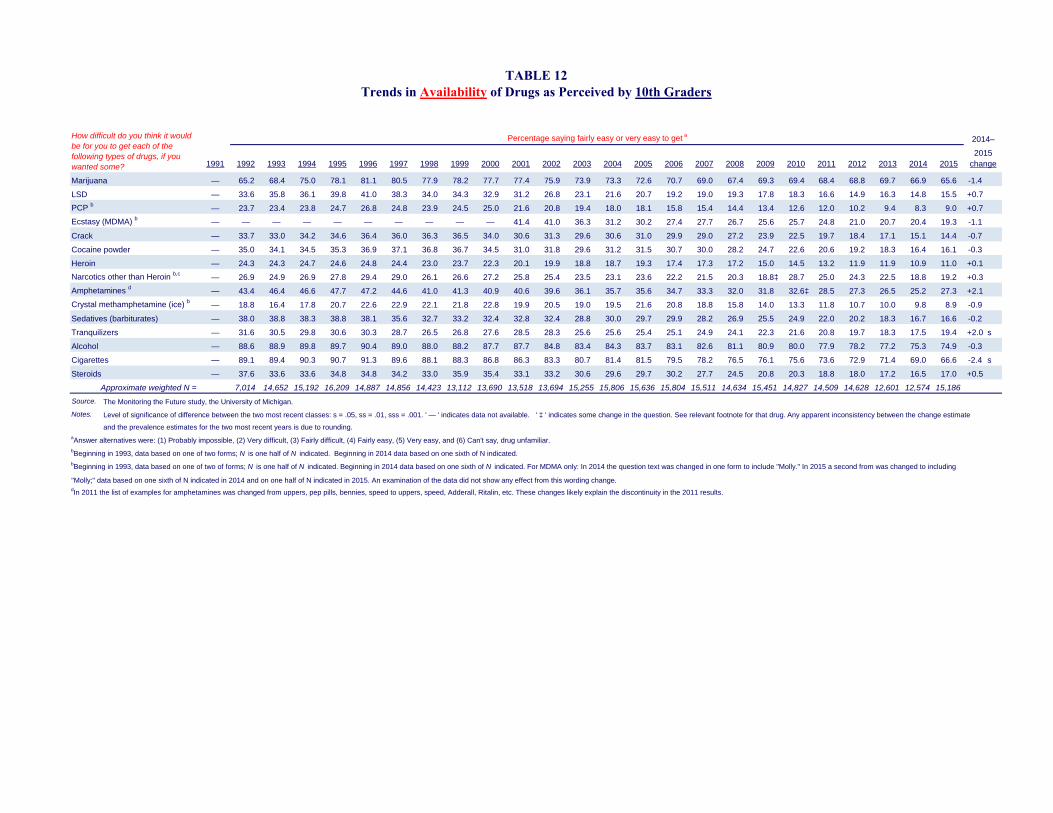
1991 1992 1993 1994 1995 1996 1997 1998 1999 2000 2001 2002 2003 2004 2005 2006 2007 2008 2009 2010 2011 2012 2013 2014 2015
Marijuana — 65.2 68.4 75.0 78.1 81.1 80.5 77.9 78.2 77.7 77.4 75.9 73.9 73.3 72.6 70.7 69.0 67.4 69.3 69.4 68.4 68.8 69.7 66.9 65.6 -1.4
LSD — 33.6 35.8 36.1 39.8 41.0 38.3 34.0 34.3 32.9 31.2 26.8 23.1 21.6 20.7 19.2 19.0 19.3 17.8 18.3 16.6 14.9 16.3 14.8 15.5 +0.7PCP b — 23.7 23.4 23.8 24.7 26.8 24.8 23.9 24.5 25.0 21.6 20.8 19.4 18.0 18.1 15.8 15.4 14.4 13.4 12.6 12.0 10.2 9.4 8.3 9.0 +0.7Ecstasy (MDMA) b — — — — — — — — — — 41.4 41.0 36.3 31.2 30.2 27.4 27.7 26.7 25.6 25.7 24.8 21.0 20.7 20.4 19.3 -1.1
Crack — 33.7 33.0 34.2 34.6 36.4 36.0 36.3 36.5 34.0 30.6 31.3 29.6 30.6 31.0 29.9 29.0 27.2 23.9 22.5 19.7 18.4 17.1 15.1 14.4 -0.7
Cocaine powder — 35.0 34.1 34.5 35.3 36.9 37.1 36.8 36.7 34.5 31.0 31.8 29.6 31.2 31.5 30.7 30.0 28.2 24.7 22.6 20.6 19.2 18.3 16.4 16.1 -0.3
Heroin — 24.3 24.3 24.7 24.6 24.8 24.4 23.0 23.7 22.3 20.1 19.9 18.8 18.7 19.3 17.4 17.3 17.2 15.0 14.5 13.2 11.9 11.9 10.9 11.0 +0.1Narcotics other than Heroin b,c — 26.9 24.9 26.9 27.8 29.4 29.0 26.1 26.6 27.2 25.8 25.4 23.5 23.1 23.6 22.2 21.5 20.3 18.8‡ 28.7 25.0 24.3 22.5 18.8 19.2 +0.3Amphetamines d — 43.4 46.4 46.6 47.7 47.2 44.6 41.0 41.3 40.9 40.6 39.6 36.1 35.7 35.6 34.7 33.3 32.0 31.8 32.6‡ 28.5 27.3 26.5 25.2 27.3 +2.1Crystal methamphetamine (ice) b — 18.8 16.4 17.8 20.7 22.6 22.9 22.1 21.8 22.8 19.9 20.5 19.0 19.5 21.6 20.8 18.8 15.8 14.0 13.3 11.8 10.7 10.0 9.8 8.9 -0.9
Sedatives (barbiturates) — 38.0 38.8 38.3 38.8 38.1 35.6 32.7 33.2 32.4 32.8 32.4 28.8 30.0 29.7 29.9 28.2 26.9 25.5 24.9 22.0 20.2 18.3 16.7 16.6 -0.2
Tranquilizers — 31.6 30.5 29.8 30.6 30.3 28.7 26.5 26.8 27.6 28.5 28.3 25.6 25.6 25.4 25.1 24.9 24.1 22.3 21.6 20.8 19.7 18.3 17.5 19.4 +2.0 s
Alcohol — 88.6 88.9 89.8 89.7 90.4 89.0 88.0 88.2 87.7 87.7 84.8 83.4 84.3 83.7 83.1 82.6 81.1 80.9 80.0 77.9 78.2 77.2 75.3 74.9 -0.3
Cigarettes — 89.1 89.4 90.3 90.7 91.3 89.6 88.1 88.3 86.8 86.3 83.3 80.7 81.4 81.5 79.5 78.2 76.5 76.1 75.6 73.6 72.9 71.4 69.0 66.6 -2.4 s
Steroids — 37.6 33.6 33.6 34.8 34.8 34.2 33.0 35.9 35.4 33.1 33.2 30.6 29.6 29.7 30.2 27.7 24.5 20.8 20.3 18.8 18.0 17.2 16.5 17.0 +0.5
Approximate weighted N = 7,014 14,652 15,192 16,209 14,887 14,856 14,423 13,112 13,690 13,518 13,694 15,255 15,806 15,636 15,804 15,511 14,634 15,451 14,827 14,509 14,628 12,601 12,574 15,186Source. The Monitoring the Future study, the University of Michigan.
Notes. Level of significance of difference between the two most recent classes: s = .05, ss = .01, sss = .001. ' — ' indicates data not available. ' ‡ ' indicates some change in the question. See relevant footnote for that drug. Any apparent inconsistency between the change estimate
and the prevalence estimates for the two most recent years is due to rounding.aAnswer alternatives were: (1) Probably impossible, (2) Very difficult, (3) Fairly difficult, (4) Fairly easy, (5) Very easy, and (6) Can't say, drug unfamiliar. bBeginning in 1993, data based on one of two forms; N is one half of N indicated. Beginning in 2014 data based on one sixth of N indicated.bBeginning in 1993, data based on one of two of forms; N is one half of N indicated. Beginning in 2014 data based on one sixth of N indicated. For MDMA only: In 2014 the question text was changed in one form to include "Molly." In 2015 a second from was changed to including
"Molly;" data based on one sixth of N indicated in 2014 and on one half of N indicated in 2015. An examination of the data did not show any effect from this wording change.dIn 2011 the list of examples for amphetamines was changed from uppers, pep pills, bennies, speed to uppers, speed, Adderall, Ritalin, etc. These changes likely explain the discontinuity in the 2011 results.
TABLE 12Trends in Availability of Drugs as Perceived by 10th Graders
How difficult do you think it would be for you to get each of the following types of drugs, if you wanted some?
Percentage saying fairly easy or very easy to get a 2014–
2015change

1975 1976 1977 1978 1979 1980 1981 1982 1983 1984 1985 1986 1987 1988 1989 1990 1991 1992 1993 1994 1995
Marijuana 87.8 87.4 87.9 87.8 90.1 89.0 89.2 88.5 86.2 84.6 85.5 85.2 84.8 85.0 84.3 84.4 83.3 82.7 83.0 85.5 88.5
Amyl/butyl nitrites — — — — — — — — — — — — 23.9 25.9 26.8 24.4 22.7 25.9 25.9 26.7 26.0
LSD 46.2 37.4 34.5 32.2 34.2 35.3 35.0 34.2 30.9 30.6 30.5 28.5 31.4 33.3 38.3 40.7 39.5 44.5 49.2 50.8 53.8Some other hallucinogen b 47.8 35.7 33.8 33.8 34.6 35.0 32.7 30.6 26.6 26.6 26.1 24.9 25.0 26.2 28.2 28.3 28.0 29.9 33.5 33.8 35.8
PCP — — — — — — — — — — — — 22.8 24.9 28.9 27.7 27.6 31.7 31.7 31.4 31.0Ecstasy (MDMA) c — — — — — — — — — — — — — — 21.7 22.0 22.1 24.2 28.1 31.2 34.2
Cocaine 37.0 34.0 33.0 37.8 45.5 47.9 47.5 47.4 43.1 45.0 48.9 51.5 54.2 55.0 58.7 54.5 51.0 52.7 48.5 46.6 47.7
Crack — — — — — — — — — — — — 41.1 42.1 47.0 42.4 39.9 43.5 43.6 40.5 41.9
Cocaine powder — — — — — — — — — — — — 52.9 50.3 53.7 49.0 46.0 48.0 45.4 43.7 43.8
Heroin 24.2 18.4 17.9 16.4 18.9 21.2 19.2 20.8 19.3 19.9 21.0 22.0 23.7 28.0 31.4 31.9 30.6 34.9 33.7 34.1 35.1Some other narcotic (including methadone) c 34.5 26.9 27.8 26.1 28.7 29.4 29.6 30.4 30.0 32.1 33.1 32.2 33.0 35.8 38.3 38.1 34.6 37.1 37.5 38.0 39.8Amphetamines d 67.8 61.8 58.1 58.5 59.9 61.3 69.5 70.8 68.5 68.2 66.4 64.3 64.5 63.9 64.3 59.7 57.3 58.8 61.5 62.0 62.8
Crystal methamphetamine (ice) — — — — — — — — — — — — — — — 24.1 24.3 26.0 26.6 25.6 27.0Sedatives (barbiturates) e 60.0 54.4 52.4 50.6 49.8 49.1 54.9 55.2 52.5 51.9 51.3 48.3 48.2 47.8 48.4 45.9 42.4 44.0 44.5 43.3 42.3
Tranquilizers 71.8 65.5 64.9 64.3 61.4 59.1 60.8 58.9 55.3 54.5 54.7 51.2 48.6 49.1 45.3 44.7 40.8 40.9 41.1 39.2 37.8
Alcohol — — — — — — — — — — — — — — — — — — — — —
Steroids — — — — — — — — — — — — — — — — 46.7 46.8 44.8 42.9 45.5
Approximate weighted N = 2,627 2,865 3,065 3,598 3,172 3,240 3,578 3,602 3,385 3,269 3,274 3,077 3,271 3,231 2,806 2,549 2,476 2,586 2,670 2,526 2,552
(Years cont.)
TABLE 13Trends in Availability of Drugs as Perceived by 12th Graders
How difficult do you think it would be for you to get each of the following types of drugs, if you wanted some?
Percentage saying fairly easy or very easy to get a
(Table continued on next page.)
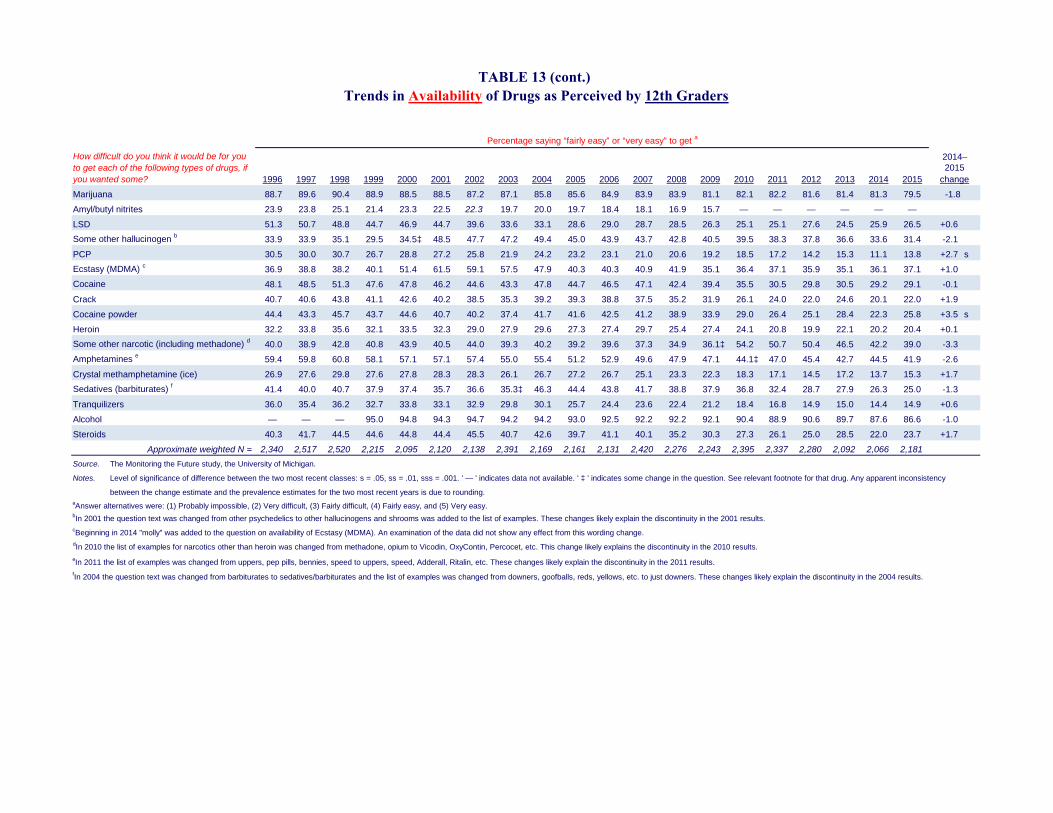
1996 1997 1998 1999 2000 2001 2002 2003 2004 2005 2006 2007 2008 2009 2010 2011 2012 2013 2014 2015
Marijuana 88.7 89.6 90.4 88.9 88.5 88.5 87.2 87.1 85.8 85.6 84.9 83.9 83.9 81.1 82.1 82.2 81.6 81.4 81.3 79.5 -1.8
Amyl/butyl nitrites 23.9 23.8 25.1 21.4 23.3 22.5 22.3 19.7 20.0 19.7 18.4 18.1 16.9 15.7 — — — — — —
LSD 51.3 50.7 48.8 44.7 46.9 44.7 39.6 33.6 33.1 28.6 29.0 28.7 28.5 26.3 25.1 25.1 27.6 24.5 25.9 26.5 +0.6Some other hallucinogen b 33.9 33.9 35.1 29.5 34.5‡ 48.5 47.7 47.2 49.4 45.0 43.9 43.7 42.8 40.5 39.5 38.3 37.8 36.6 33.6 31.4 -2.1
PCP 30.5 30.0 30.7 26.7 28.8 27.2 25.8 21.9 24.2 23.2 23.1 21.0 20.6 19.2 18.5 17.2 14.2 15.3 11.1 13.8 +2.7 sEcstasy (MDMA) c 36.9 38.8 38.2 40.1 51.4 61.5 59.1 57.5 47.9 40.3 40.3 40.9 41.9 35.1 36.4 37.1 35.9 35.1 36.1 37.1 +1.0Cocaine 48.1 48.5 51.3 47.6 47.8 46.2 44.6 43.3 47.8 44.7 46.5 47.1 42.4 39.4 35.5 30.5 29.8 30.5 29.2 29.1 -0.1
Crack 40.7 40.6 43.8 41.1 42.6 40.2 38.5 35.3 39.2 39.3 38.8 37.5 35.2 31.9 26.1 24.0 22.0 24.6 20.1 22.0 +1.9
Cocaine powder 44.4 43.3 45.7 43.7 44.6 40.7 40.2 37.4 41.7 41.6 42.5 41.2 38.9 33.9 29.0 26.4 25.1 28.4 22.3 25.8 +3.5 s
Heroin 32.2 33.8 35.6 32.1 33.5 32.3 29.0 27.9 29.6 27.3 27.4 29.7 25.4 27.4 24.1 20.8 19.9 22.1 20.2 20.4 +0.1Some other narcotic (including methadone) d 40.0 38.9 42.8 40.8 43.9 40.5 44.0 39.3 40.2 39.2 39.6 37.3 34.9 36.1‡ 54.2 50.7 50.4 46.5 42.2 39.0 -3.3Amphetamines e 59.4 59.8 60.8 58.1 57.1 57.1 57.4 55.0 55.4 51.2 52.9 49.6 47.9 47.1 44.1‡ 47.0 45.4 42.7 44.5 41.9 -2.6
Crystal methamphetamine (ice) 26.9 27.6 29.8 27.6 27.8 28.3 28.3 26.1 26.7 27.2 26.7 25.1 23.3 22.3 18.3 17.1 14.5 17.2 13.7 15.3 +1.7Sedatives (barbiturates) f 41.4 40.0 40.7 37.9 37.4 35.7 36.6 35.3‡ 46.3 44.4 43.8 41.7 38.8 37.9 36.8 32.4 28.7 27.9 26.3 25.0 -1.3
Tranquilizers 36.0 35.4 36.2 32.7 33.8 33.1 32.9 29.8 30.1 25.7 24.4 23.6 22.4 21.2 18.4 16.8 14.9 15.0 14.4 14.9 +0.6
Alcohol — — — 95.0 94.8 94.3 94.7 94.2 94.2 93.0 92.5 92.2 92.2 92.1 90.4 88.9 90.6 89.7 87.6 86.6 -1.0
Steroids 40.3 41.7 44.5 44.6 44.8 44.4 45.5 40.7 42.6 39.7 41.1 40.1 35.2 30.3 27.3 26.1 25.0 28.5 22.0 23.7 +1.7
Approximate weighted N = 2,340 2,517 2,520 2,215 2,095 2,120 2,138 2,391 2,169 2,161 2,131 2,420 2,276 2,243 2,395 2,337 2,280 2,092 2,066 2,181Source. The Monitoring the Future study, the University of Michigan.
Notes. Level of significance of difference between the two most recent classes: s = .05, ss = .01, sss = .001. ' — ' indicates data not available. ' ‡ ' indicates some change in the question. See relevant footnote for that drug. Any apparent inconsistency
between the change estimate and the prevalence estimates for the two most recent years is due to rounding.aAnswer alternatives were: (1) Probably impossible, (2) Very difficult, (3) Fairly difficult, (4) Fairly easy, and (5) Very easy.bIn 2001 the question text was changed from other psychedelics to other hallucinogens and shrooms was added to the list of examples. These changes likely explain the discontinuity in the 2001 results.cBeginning in 2014 "molly" was added to the question on availability of Ecstasy (MDMA). An examination of the data did not show any effect from this wording change.dIn 2010 the list of examples for narcotics other than heroin was changed from methadone, opium to Vicodin, OxyContin, Percocet, etc. This change likely explains the discontinuity in the 2010 results.
fIn 2004 the question text was changed from barbiturates to sedatives/barbiturates and the list of examples was changed from downers, goofballs, reds, yellows, etc. to just downers. These changes likely explain the discontinuity in the 2004 results.
eIn 2011 the list of examples was changed from uppers, pep pills, bennies, speed to uppers, speed, Adderall, Ritalin, etc. These changes likely explain the discontinuity in the 2011 results.
Trends in Availability of Drugs as Perceived by 12th Graders
How difficult do you think it would be for you to get each of the following types of drugs, if you wanted some?
Percentage saying “fairly easy” or “very easy” to get a
2015 change
2014–
TABLE 13 (cont.)

1991 1992 1993 1994 1995 1996 1997 1998 1999 2000 2001 2002 2003 2004 2005 2006 2007 2008 2009 2010 2011 2012 2013 2014 2015
Any Illicit Drugb 30.4 29.8 32.1 35.7 38.9 42.2 43.3 42.3 41.9 41.0 40.9 39.5 37.5 36.4 35.7 34.0 32.7 32.6 33.2 34.4 34.7 34.1 36.0‡ 34.9 34.3 -0.6 -0.6 -1.7 ― ―Any Illicit Drug other than Marijuanab 19.7 19.7 21.2 22.0 23.6 24.2 24.0 23.1 22.7 22.1‡ 23.2 21.1 19.8 19.3 18.6 18.2 17.7 16.8 16.5 16.8 16.1 15.5 16.8‡ 15.8 15.1 -0.7 -0.7 -4.3 ― ―Any Illicit Drug including Inhalantsb 36.8 36.3 38.8 41.9 44.9 47.4 48.2 47.4 46.9 46.2 45.5 43.7 41.9 41.3 41.0 39.3 38.0 37.9 37.9 38.8 38.7 37.9 39.3‡ 37.9 37.4 -0.5 -0.5 -1.4 ― ―Marijuana/Hashish 22.7 21.1 23.4 27.8 31.6 35.6 37.8 36.5 36.4 35.3 35.3 34.0 32.4 31.4 30.8 28.9 27.9 27.9 29.0 30.4 31.0 30.7 32.0 30.5 30.0 -0.6 -7.8 sss -20.6 +2.1 s +7.6Inhalants 17.0 16.9 18.2 18.6 19.4 19.1 18.6 18.1 17.5 16.4 15.3 13.6 13.4 13.7 14.1 13.7 13.5 13.1 12.5 12.1 10.6 10.0 8.9 8.8 7.5 -1.3 sss -11.9 sss -61.5 ― ―Hallucinogens 6.1 6.3 7.0 7.7 8.9 10.0 10.2 9.5 9.0 8.5‡ 9.2 7.6 6.9 6.3 5.9 5.7 5.8 5.6 5.3 5.8 5.7 5.0 5.0 4.3 4.3 -0.1 -4.9 sss -53.6 ― ― LSD 5.5 5.7 6.5 6.9 8.1 8.9 9.1 8.3 7.9 7.2 6.5 5.0 3.7 3.0 2.6 2.5 2.6 2.7 2.5 2.8 2.7 2.5 2.6 2.4 2.8 +0.4 -6.3 sss -69.0 +0.4 +16.5 Hallucinogens other than LSD 2.4 2.5 2.7 3.6 3.9 4.8 4.9 4.8 4.4 4.5‡ 6.7 6.0 5.8 5.6 5.4 5.2 5.1 4.8 4.7 5.0 4.9 4.3 4.1 3.5 3.1 -0.4 s -3.6 sss -53.8 ― ― Ecstasy (MDMA)c, original ― ― ― ― ― 4.9 5.2 4.5 5.3 7.2 8.0 6.9 5.4 4.7 4.0 4.3 4.5 4.1 4.6 5.5 5.5 4.6 4.7 3.5 ― ― ― ― ― ― Revised ― ― ― ― ― ― ― ― ― ― ― ― ― ― ― ― ― ― ― ― ― ― ― 5.0 4.0 -1.1 s -1.1 s -21.5 ― ―Cocaine 4.6 4.0 4.1 4.5 5.1 6.0 6.6 7.0 7.2 6.5 5.9 5.7 5.3 5.5 5.5 5.3 5.2 4.8 4.2 3.8 3.4 3.3 3.1 2.9 2.7 -0.2 -4.4 sss -61.9 ― ― Crack 2.0 1.9 2.0 2.5 2.8 3.2 3.4 3.8 3.8 3.5 3.2 3.2 2.9 2.9 2.8 2.6 2.5 2.2 2.0 1.9 1.6 1.5 1.5 1.3 1.3 -0.1 -2.6 sss -67.1 ― ― Other cocaine 4.1 3.5 3.6 3.9 4.2 5.2 5.9 6.1 6.3 5.6 5.1 4.8 4.5 4.7 4.7 4.7 4.6 4.1 3.7 3.4 3.1 2.9 2.7 2.5 2.3 -0.2 -3.9 sss -62.9 ― ―Heroin 1.1 1.3 1.3 1.6 1.9 2.1 2.1 2.2 2.2 2.1 1.7 1.7 1.5 1.5 1.5 1.4 1.4 1.3 1.4 1.4 1.2 1.0 1.0 0.9 0.7 -0.3 ss -1.6 sss -70.6 ― ― With a needle ― ― ― ― 1.1 1.2 1.1 1.1 1.3 1.0 0.9 0.9 0.9 0.9 0.9 0.9 0.8 0.8 0.8 0.9 0.8 0.6 0.7 0.7 0.5 -0.3 ss -0.8 sss -63.4 ― ― Without a needle ― ― ― ― 1.3 1.7 1.7 1.6 1.6 1.8 1.3 1.3 1.3 1.2 1.1 1.0 1.0 0.9 0.9 1.0 0.9 0.7 0.7 0.6 0.5 -0.1 -1.3 sss -73.1 ― ―Amphetaminesb 12.9 12.5 13.8 14.3 15.2 15.5 15.2 14.5 14.0 13.5 13.9 13.1 11.8 11.2 10.3 10.1 9.5 8.6 8.6 8.9 8.6 8.3 10.5‡ 9.7 9.1 -0.6 -0.6 -6.2 ― ― Methamphetamine ― ― ― ― ― ― ― ― 6.5 6.2 5.8 5.3 5.0 4.5 3.9 3.4 2.5 2.5 2.2 2.2 1.8 1.6 1.5 1.4 1.1 -0.3 -5.5 sss -83.6 ― ―Tranquilizers 5.5 5.3 5.4 5.5 5.8 6.5 6.6 6.9 7.0 6.9‡ 7.9 7.9 7.3 7.1 6.8 7.0 6.7 6.3 6.5 6.6 6.0 5.8 5.2 5.3 5.2 -0.1 -2.7 sss -34.0 ― ―Alcohol 80.1 79.2‡ 68.4 68.4 68.2 68.4 68.8 67.4 66.4 66.6 65.5 62.7 61.7 60.5 58.6 57.0 56.3 55.1 54.6 53.6 51.5 50.0 48.4 46.4 45.2 -1.2 -23.5 sss -34.2 ― ― Been drunk 46.3 44.9 44.6 44.3 44.5 45.1 45.7 44.0 43.7 44.0 43.4 40.5 38.9 39.4 38.4 37.6 36.6 35.1 35.9 34.2 32.5 32.8 31.7 29.2 28.2 -1.0 -18.1 sss -39.1 ― ― Flavored alcoholic beverages ― ― ― ― ― ― ― ― ― ― ― ― ― 54.7 54.7 53.1 51.3 49.3 47.9 46.7 44.5 42.7 41.1 38.8 37.4 -1.4 -17.3 sss -31.7 ― ―Cigarettes 53.5 53.0 54.0 54.6 55.8 57.8 57.4 56.0 54.5 51.8 49.1 44.2 40.8 39.6 37.4 35.0 33.3 31.3 31.2 30.9 28.7 27.0 25.6 22.9 21.1 -1.8 ss -36.6 sss -63.4 ― ―Smokeless Tobacco ― 26.2 25.6 26.3 26.0 25.7 22.7 21.1 19.4 17.9 16.6 15.2 14.1 13.6 13.8 13.3 12.9 12.3 13.5 14.5 13.8 13.5 12.8 12.1 11.3 -0.8 -15.0 sss -57.0 ― ―Steroids 1.9 1.8 1.8 2.1 2.1 1.8 2.1 2.3 2.8 3.0 3.3 3.3 3.0 2.5 2.1 2.0 1.8 1.6 1.5 1.5 1.5 1.4 1.5 1.4 1.5 +0.1 -1.8 sss -54.3 +0.1 +5.2Source. The Monitoring the Future study, the University of Michigan.
Notes. ' – ' indicates data not available. ' ‡ ' indicates a change in the question text. When a question change occurs, peak levels after that change are used to calculate the peak year to current year difference.
Values in bold equal peak levels since 1991. Values in italics equal peak level before wording change. Underlined values equal lowest level since recent peak level.
Level of significance of difference between classes: s = .05, ss = .01, sss = .001.
Any apparent inconsistency between the change estimate and the prevalence estimates for the two most recent years is due to rounding.aThe proportional change is the percent by which the most recent year deviates from the peak year [or the low year] for the drug in question. So, if a drug was at 20% prevalence in the peak year and declined to 10% prevalence in the
most recent year, that would reflect a proportional decline of 50%.bIn 2013, for the questions on the use of amphetamines, the text was changed on two of the questionnaire forms for 8th and 10th graders and four of the questionnaire forms for 12th graders. This change also impacted the any illicit drug indices. Data presented here include only the changed forms beginning in 2013.cIn 2014, the text was changed on one of the questionnaire forms for 8th, 10th, and 12th graders to include "molly" in the description. The remaining forms were changed in 2015. Data for both versions of the question are presented here.
Low year–2015 change
TABLE 14Trends in Lifetime Prevalence of Use of Various Drugs for Grades 8, 10, and 12 Combined
(Entries are percentages.)
ProportionalPeak year–2015 change
changeAbsolutechangechange change
2014–2015 Absolute Proportionalchange (%) a

1991 1992 1993 1994 1995 1996 1997 1998 1999 2000 2001 2002 2003 2004 2005 2006 2007 2008 2009 2010 2011 2012 2013 2014 2015
Any Illicit Drugc 20.2 19.7 23.2 27.6 31.0 33.6 34.1 32.2 31.9 31.4 31.8 30.2 28.4 27.6 27.1 25.8 24.8 24.9 25.9 27.3 27.6 27.1 28.6‡ 27.2 26.8 -0.4 -0.4 -1.6 ― ―Any Illicit Drug other than Marijuanac 12.0 12.0 13.6 14.6 16.4 17.0 16.8 15.8 15.6 15.3‡ 16.3 14.6 13.7 13.5 13.1 12.7 12.4 11.9 11.6 11.8 11.3 10.8 11.4‡ 10.9 10.5 -0.4 -0.4 -3.7 ― ―Any Illicit Drug including Inhalantsc 23.5 23.2 26.7 31.1 34.1 36.6 36.7 35.0 34.6 34.1 34.3 32.3 30.8 30.1 30.1 28.7 27.6 27.6 28.5 29.7 29.8 29.0 30.5‡ 28.5 28.4 -0.1 -0.1 -0.4 ― ―Marijuana/Hashish 15.0 14.3 17.7 22.5 26.1 29.0 30.1 28.2 27.9 27.2 27.5 26.1 24.6 23.8 23.4 22.0 21.4 21.5 22.9 24.5 25.0 24.7 25.8 24.2 23.7 -0.4 -6.3 sss -21.0 +2.4 sss +11.1 Synthetic marijuana ― ― ― ― ― ― ― ― ― ― ― ― ― ― ― ― ― ― ― ― ― 8.0 6.4 4.8 4.2 -0.6 sss -3.8 sss -47.7 ― ―Inhalants 7.6 7.8 8.9 9.6 10.2 9.9 9.1 8.5 7.9 7.7 6.9 6.1 6.2 6.7 7.0 6.9 6.4 6.4 6.1 6.0 5.0 4.5 3.8 3.6 3.2 -0.4 -7.0 sss -69.1 ― ―Hallucinogens 3.8 4.1 4.8 5.2 6.6 7.2 6.9 6.3 6.1 5.4‡ 6.0 4.5 4.1 4.0 3.9 3.6 3.8 3.8 3.5 3.8 3.7 3.2 3.1 2.8 2.8 0.0 -3.2 sss -53.0 ― ― LSD 3.4 3.8 4.3 4.7 5.9 6.3 6.0 5.3 5.3 4.5 4.1 2.4 1.6 1.6 1.5 1.4 1.7 1.9 1.6 1.8 1.8 1.6 1.6 1.7 1.9 +0.2 -4.4 sss -70.2 +0.5 s +34.0 Hallucinogens other than LSD 1.3 1.4 1.7 2.2 2.7 3.2 3.2 3.1 2.9 2.8‡ 4.0 3.7 3.6 3.6 3.4 3.3 3.3 3.2 3.0 3.3 3.1 2.7 2.5 2.1 1.9 -0.3 -2.2 sss -53.8 ― ― Ecstasy (MDMA)d, original ― ― ― ― ― 3.1 3.4 2.9 3.7 5.3 6.0 4.9 3.1 2.6 2.4 2.7 3.0 2.9 3.0 3.8 3.7 2.5 2.8 2.2 ― ― ― ― ― ― Revised ― ― ― ― ― ― ― ― ― ― ― ― ― ― ― ― ― ― ― ― ― ― ― 3.4 2.4 -0.9 sss -0.9 sss -28.0 ― ― Salvia ― ― ― ― ― ― ― ― ― ― ― ― ― ― ― ― ― ― ― 3.5 3.6 2.7 2.3 1.4 1.2 -0.2 -2.4 sss -66.6 ― ―Cocaine 2.2 2.1 2.3 2.8 3.3 4.0 4.3 4.5 4.5 3.9 3.5 3.7 3.3 3.5 3.5 3.5 3.4 2.9 2.5 2.2 2.0 1.9 1.8 1.6 1.7 +0.1 -2.7 sss -61.2 +0.1 +5.4 Crack 1.0 1.1 1.2 1.5 1.8 2.0 2.1 2.4 2.2 2.1 1.8 2.0 1.8 1.7 1.6 1.5 1.5 1.3 1.2 1.1 1.0 0.9 0.8 0.7 0.8 0.0 -1.6 sss -67.9 0.0 +2.4 Other cocaine 2.0 1.8 2.0 2.3 2.8 3.4 3.7 3.7 4.0 3.3 3.0 3.1 2.8 3.1 3.0 3.1 2.9 2.6 2.1 1.9 1.7 1.7 1.5 1.5 1.5 0.0 -2.5 sss -63.7 ― ―Heroin 0.5 0.6 0.6 0.9 1.2 1.3 1.3 1.2 1.3 1.3 0.9 1.0 0.8 0.9 0.8 0.8 0.8 0.8 0.8 0.8 0.7 0.6 0.6 0.5 0.4 -0.1 ss -0.9 sss -70.0 ― ― With a needle ― ― ― ― 0.7 0.7 0.7 0.7 0.7 0.5 0.5 0.5 0.5 0.5 0.5 0.5 0.5 0.5 0.5 0.6 0.5 0.4 0.4 0.4 0.3 -0.2 ss -0.4 sss -63.2 ― ― Without a needle ― ― ― ― 0.9 0.9 1.0 0.9 1.0 1.1 0.7 0.7 0.6 0.7 0.7 0.6 0.7 0.6 0.5 0.6 0.5 0.4 0.4 0.3 0.3 0.0 -0.8 sss -74.1 ― ― OxyContin ― ― ― ― ― ― ― ― ― ― ― 2.7 3.2 3.3 3.4 3.5 3.5 3.4 3.9 3.8 3.4 2.9 2.9 2.4 2.3 -0.1 -1.6 sss -39.8 ― ― Vicodin ― ― ― ― ― ― ― ― ― ― ― 6.0 6.6 5.8 5.7 6.3 6.2 6.1 6.5 5.9 5.1 4.3 3.7 3.0 2.5 -0.5 -4.0 sss -61.2 ― ―Amphetaminesc 7.5 7.3 8.4 9.1 10.0 10.4 10.1 9.3 9.0 9.2 9.6 8.9 8.0 7.6 7.0 6.8 6.5 5.8 5.9 6.2 5.9 5.6 7.0‡ 6.6 6.2 -0.4 -0.4 -6.3 ― ― Ritalin ― ― ― ― ― ― ― ― ― ― 4.2 3.8 3.5 3.6 3.3 3.5 2.8 2.6 2.5 2.2 2.1 1.7 1.7 1.5 1.4 -0.1 -2.8 sss -66.8 ― ― Adderall ― ― ― ― ― ― ― ― ― ― ― ― ― ― ― ― ― ― 4.3 4.5 4.1 4.4 4.4 4.1 4.5 +0.4 -0.5 s -10.3 +0.4 +10.2 Methamphetamine ― ― ― ― ― ― ― ― 4.1 3.5 3.4 3.2 3.0 2.6 2.4 2.0 1.4 1.3 1.3 1.3 1.2 1.0 1.0 0.8 0.6 -0.2 -3.5 sss -84.8 ― ― Bath salts (synthetic stimulants) ― ― ― ― ― ― ― ― ― ― ― ― ― ― ― ― ― ― ― ― ― 0.9 0.9 0.8 0.7 ‐0.1 -0.3 -27.1 ― ―Tranquilizers 2.8 2.8 2.9 3.1 3.7 4.1 4.1 4.4 4.4 4.5 ‡ 5.5 5.3 4.8 4.8 4.7 4.6 4.5 4.3 4.5 4.4 3.9 3.7 3.3 3.4 3.4 0.0 -2.1 sss -38.3 +0.1 +2.2OTC Cough/Cold Medicines ― ― ― ― ― ― ― ― ― ― ― ― ― ― ― 5.4 5.0 4.7 5.2 4.8 4.4 4.4 4.0 3.2 3.1 -0.1 -2.2 sss -41.8 ― ―Rohypnol ― ― ― ― ― 1.1 1.1 1.1 0.8 0.7 0.9‡ 0.8 0.8 0.9 0.8 0.7 0.8 0.7 0.6 0.8 0.9 0.7 0.6 0.5 0.5 0.0 -0.4 sss -47.8 ― ―GHBb ― ― ― ― ― ― ― ― ― 1.4 1.2 1.2 1.2 1.1 0.8 0.9 0.7 0.9 0.9 0.8 0.8 ― ― ― ― ― ― ― ― ―Ketamine b ― ― ― ― ― ― ― ― ― 2.0 1.9 2.0 1.7 1.3 1.0 1.1 1.0 1.2 1.3 1.2 1.2 ― ― ― ― ― ― ― ― ―Alcohol 67.4 66.3‡ 59.7 60.5 60.4 60.9 61.4 59.7 59.0 59.3 58.2 55.3 54.4 54.0 51.9 50.7 50.2 48.7 48.4 47.4 45.3 44.3 42.8 40.7 39.9 -0.8 -21.5 sss -35.0 ― ― Been drunk 35.8 34.3 34.3 35.0 35.9 36.7 36.9 35.5 36.0 35.9 35.0 32.1 31.2 32.5 30.8 30.7 29.7 28.1 28.7 27.1 25.9 26.4 25.4 23.6 22.5 -1.1 -14.4 sss -39.0 ― ― Flavored alcoholic beverages ― ― ― ― ― ― ― ― ― ― ― ― ― 44.5 43.9 42.4 40.8 39.0 37.8 35.9 33.7 32.5 31.3 29.4 28.8 -0.6 -15.7 sss -35.2 ― ― Alcoholic beverages containing caffeine ― ― ― ― ― ― ― ― ― ― ― ― ― ― ― ― ― ― ― ― 19.7 18.6 16.6 14.3 13.0 -1.3 -6.6 sss -33.8 ― ―Dissolvable tobacco products ― ― ― ― ― ― ― ― ― ― ― ― ― ― ― ― ― ― ― ― ― 1.4 1.4 1.2 1.1 -0.1 -0.3 -18.4 ― ―Snus ― ― ― ― ― ― ― ― ― ― ― ― ― ― ― ― ― ― ― ― ― 5.6 4.8 4.1 3.8 -0.2 -1.8 sss -31.6 ― ―Steroids 1.2 1.1 1.0 1.2 1.3 1.1 1.2 1.3 1.7 1.9 2.0 2.0 1.7 1.6 1.3 1.3 1.1 1.1 1.0 0.9 0.9 0.9 0.9 0.9 1.0 +0.1 -1.1 sss -52.2 +0.1 +7.1Source. The Monitoring the Future study, the University of Michigan.Notes. ' – ' indicates data not available. ' ‡ ' indicates a change in the question text. When a question change occurs, peak levels after that change are used to calculate the peak year to current year difference.
Values in bold equal peak levels since 1991. Values in italics equal peak level before wording change. Underlined values equal lowest level since recent peak level.
Level of significance of difference between classes: s = .05, ss = .01, sss = .001.
Any apparent inconsistency between the change estimate and the prevalence estimates for the two most recent years is due to rounding.aThe proportional change is the percent by which the most recent year deviates from the peak year [or the low year] for the drug in question. So, if a drug was at 20% prevalence in the peak year and declined to 10% prevalence in the
most recent year, that would reflect a proportional decline of 50%.bQuestion was discontinued among 8th and 10th graders in 2012.cIn 2013, for the questions on the use of amphetamines, the text was changed on two of the questionnaire forms for 8th and 10th graders and four of the questionnaire forms for 12th graders. This change also impacted the any illicit drug indices. Data presented
here include only the changed forms beginning in 2013.dIn 2014, the text was changed on one of the questionnaire forms for 8th, 10th, and 12th graders to include "molly" in the description. The remaining forms were changed in 2015. Data for both versions of the question are presented here.
changeProportionalchange (%) a changechange
Absolutechange
Absolute Proportional2014–2015Peak year–2015 change Low year–2015 change
TABLE 15Trends in Annual Prevalence of Use of Various Drugs for Grades 8, 10, and 12 Combined
(Entries are percentages.)

1991 1992 1993 1994 1995 1996 1997 1998 1999 2000 2001 2002 2003 2004 2005 2006 2007 2008 2009 2010 2011 2012 2013 2014 2015
Any Illicit Drugb 10.9 10.5 13.3 16.8 18.6 20.6 20.5 19.5 19.5 19.2 19.4 18.2 17.3 16.2 15.8 14.9 14.8 14.6 15.8 16.7 17.0 16.8 17.3‡ 16.5 15.9 -0.6 -0.6 -3.9 ― ―Any Illicit Drug other than Marijuanab 5.4 5.5 6.5 7.1 8.4 8.4 8.4 8.2 7.9 8.0‡ 8.2 7.7 7.1 7.0 6.7 6.4 6.4 5.9 5.7 5.7 5.7 5.2 5.4‡ 5.4 5.1 -0.3 -0.3 -5.6 ― ―Any Illicit Drug including Inhalantsb 13.0 12.5 15.4 18.9 20.7 22.4 22.2 21.1 21.1 21.0 20.8 19.5 18.6 17.5 17.5 16.5 16.5 16.1 17.3 18.0 18.3 17.6 18.4‡ 17.3 16.8 -0.5 -0.5 -3.1 ― ―Marijuana/Hashish 8.3 7.7 10.2 13.9 15.6 17.7 17.9 16.9 16.9 16.3 16.6 15.3 14.8 13.6 13.4 12.5 12.4 12.5 13.8 14.8 15.2 15.1 15.6 14.4 14.0 -0.4 -3.9 sss -22.0 +1.6 ss +13.0Inhalants 3.2 3.3 3.8 4.0 4.3 3.9 3.7 3.4 3.3 3.2 2.8 2.7 2.7 2.9 2.9 2.7 2.6 2.6 2.5 2.4 2.1 1.7 1.5 1.4 1.3 0.0 -3.0 sss -69.4 ― ―Hallucinogens 1.5 1.6 1.9 2.2 3.1 2.7 3.0 2.8 2.5 2.0‡ 2.3 1.7 1.5 1.5 1.5 1.3 1.4 1.4 1.3 1.4 1.3 1.1 1.1 1.0 1.0 0.0 -1.2 sss -55.4 ― ― LSD 1.3 1.5 1.6 1.9 2.8 2.1 2.4 2.3 2.0 1.4 1.5 0.7 0.6 0.6 0.6 0.6 0.6 0.7 0.5 0.7 0.7 0.5 0.6 0.6 0.7 +0.1 -2.1 sss -75.1 +0.1 +25.6 Hallucinogens other than LSD 0.5 0.5 0.7 1.0 1.0 1.2 1.2 1.2 1.1 1.1‡ 1.4 1.4 1.2 1.3 1.2 1.1 1.1 1.1 1.0 1.2 1.0 0.9 0.8 0.7 0.6 -0.1 -0.8 sss -58.6 ― ― Ecstasy (MDMA)c, original ― ― ― ― ― 1.5 1.3 1.2 1.6 2.4 2.4 1.8 1.0 0.9 0.9 1.0 1.1 1.2 1.2 1.5 1.4 0.8 1.0 0.8 ― ― ― ― ― ― Revised ― ― ― ― ― ― ― ― ― ― ― ― ― ― ― ― ― ― ― ― ― ― ― 1.1 0.8 -0.3 s -0.3 s -23.8 ― ―Cocaine 0.8 0.9 0.9 1.2 1.5 1.7 1.8 1.9 1.9 1.7 1.5 1.6 1.4 1.6 1.6 1.6 1.4 1.3 1.0 0.9 0.8 0.8 0.8 0.7 0.8 +0.1 -1.1 sss -57.8 +0.1 +14.0 Crack 0.4 0.5 0.5 0.7 0.8 0.9 0.8 1.0 0.9 0.9 0.9 1.0 0.8 0.8 0.8 0.7 0.7 0.6 0.5 0.5 0.5 0.4 0.4 0.4 0.4 0.0 -0.6 sss -65.5 ― ― Other cocaine 0.7 0.7 0.8 1.1 1.2 1.3 1.5 1.6 1.7 1.4 1.3 1.3 1.2 1.4 1.3 1.4 1.1 1.1 0.8 0.8 0.7 0.7 0.6 0.6 0.7 +0.1 -0.9 sss -57.2 +0.1 +26.4Heroin 0.2 0.3 0.3 0.4 0.6 0.6 0.6 0.6 0.6 0.6 0.4 0.5 0.4 0.5 0.5 0.4 0.4 0.4 0.4 0.4 0.4 0.3 0.3 0.3 0.2 -0.1 ss -0.3 sss -59.7 ― ― With a needle ― ― ― ― 0.3 0.4 0.3 0.4 0.3 0.3 0.3 0.3 0.3 0.3 0.3 0.3 0.3 0.3 0.2 0.3 0.3 0.2 0.2 0.3 0.1 -0.1 sss -0.2 sss -63.3 ― ― Without a needle ― ― ― ― 0.4 0.4 0.5 0.4 0.4 0.4 0.3 0.4 0.3 0.3 0.3 0.3 0.3 0.2 0.2 0.3 0.3 0.2 0.2 0.2 0.2 -0.1 -0.3 sss -63.2 ― ―Amphetaminesb 3.0 3.3 3.9 4.0 4.5 4.8 4.5 4.3 4.2 4.5 4.7 4.4 3.9 3.6 3.3 3.0 3.2 2.6 2.7 2.7 2.8 2.5 3.2‡ 3.2 2.7 -0.5 ss -0.5 ss -14.4 ― ― Methamphetamine ― ― ― ― ― ― ― ― 1.5 1.5 1.4 1.5 1.4 1.1 0.9 0.7 0.5 0.7 0.5 0.6 0.5 0.5 0.4 0.3 0.3 0.0 -1.2 sss -77.7 ― ―Tranquilizers 1.1 1.1 1.1 1.3 1.6 1.7 1.7 1.9 1.9 2.1 ‡ 2.3 2.4 2.2 2.1 2.1 2.1 2.0 1.9 1.9 1.9 1.7 1.5 1.5 1.5 1.5 0.0 -0.9 sss -37.4 ― ―Alcohol 39.8 38.4‡ 36.3 37.6 37.8 38.8 38.6 37.4 37.2 36.6 35.5 33.3 33.2 32.9 31.4 31.0 30.1 28.1 28.4 26.8 25.5 25.9 24.3 22.6 21.8 -0.8 -17.0 sss -43.8 ― ― Been drunk 19.2 17.8 18.2 19.3 20.3 20.4 21.2 20.4 20.6 20.3 19.7 17.4 17.7 18.1 17.0 17.4 16.5 14.9 15.2 14.6 13.5 14.7 13.5 11.9 11.0 -0.9 -10.2 sss -48.0 ― ― Flavored alcoholic beverages ― ― ― ― ― ― ― ― ― ― ― ― ― 23.0 21.6 21.7 20.4 18.6 17.9 17.0 15.2 14.9 14.0 12.9 12.8 -0.1 -10.2 sss -44.5 ― ―Cigarettes 20.7 21.2 23.4 24.7 26.6 28.3 28.3 27.0 25.2 22.6 20.2 17.7 16.6 16.1 15.3 14.4 13.6 12.6 12.7 12.8 11.7 10.6 9.6 8.0 7.0 -1.0 ss -21.3 sss -75.4 ― ―Smokeless Tobacco ― 9.2 9.1 9.7 9.6 8.5 8.0 7.0 6.3 5.8 6.1 5.2 5.3 5.1 5.3 5.1 5.2 4.9 6.0 6.5 5.9 5.6 5.7 5.4 4.7 -0.7 -5.0 sss -51.7 ― ―E-cigarettes ― ― ― ― ― ― ― ― ― ― ― ― ― ― ― ― ― ― ― ― ― ― ― 13.9 13.2 -0.7 -0.7 -5.1 ― ―Large Cigars ― ― ― ― ― ― ― ― ― ― ― ― ― ― ― ― ― ― ― ― ― ― ― 3.9 4.2 +0.2 ― ― +0.2 +5.7Flavored Little Cigars ― ― ― ― ― ― ― ― ― ― ― ― ― ― ― ― ― ― ― ― ― ― ― 7.4 7.1 -0.4 -0.4 ― ― ―Regular Little Cigars ― ― ― ― ― ― ― ― ― ― ― ― ― ― ― ― ― ― ― ― ― ― ― 4.5 4.9 +0.4 ― ― +0.4 +8.3Steroids 0.6 0.6 0.6 0.7 0.6 0.5 0.7 0.7 0.9 0.9 0.9 1.0 0.9 0.9 0.7 0.7 0.6 0.6 0.6 0.6 0.5 0.5 0.6 0.5 0.5 0.0 -0.5 sss -48.3 ― ―Source. The Monitoring the Future study, the University of Michigan.
Notes. ' – ' indicates data not available. ' ‡ ' indicates a change in the question text. When a question change occurs, peak levels after that change are used to calculate the peak year to current year difference.
Values in bold equal peak levels since 1991. Values in italics equal peak level before wording change. Underlined values equal lowest level since recent peak level.
Level of significance of difference between classes: s = .05, ss = .01, sss = .001.
Any apparent inconsistency between the change estimate and the prevalence estimates for the two most recent years is due to rounding.aThe proportional change is the percent by which the most recent year deviates from the peak year [or the low year] for the drug in question. So, if a drug was at 20% prevalence in the peak year and declined to 10% prevalence in the
most recent year, that would reflect a proportional decline of 50%.bIn 2013, for the questions on the use of amphetamines, the text was changed on two of the questionnaire forms for 8th and 10th graders and four of the questionnaire forms for 12th graders. This change also impacted the any illicit drug indices. Data presented here include only the changed forms beginning in 2013.cIn 2014, the text was changed on one of the questionnaire forms for 8th, 10th, and 12th graders to include "molly" in the description. The remaining forms were changed in 2015. Data for both versions of the question are presented here.
changechangechange change2014–2015 Absolute Proportional
change (%) aAbsolute Proportional
Peak year–2015 change Low year–2015 change
TABLE 16Trends in 30-Day Prevalence of Use of Various Drugs for Grades 8, 10, and 12 Combined
(Entries are percentages.)

1991 1992 1993 1994 1995 1996 1997 1998 1999 2000 2001 2002 2003 2004 2005 2006 2007 2008 2009 2010 2011 2012 2013 2014 2015Marijuana 0.9 0.9 1.2 2.1 2.7 3.2 3.4 3.4 3.5 3.5 3.7 3.5 3.4 3.0 2.9 2.8 2.7 2.8 2.8 3.4 3.6 3.6 3.7 3.3 3.3 0.0 -0.4 s -10.4 +0.6 sss +21.0Alcohol 1.7 1.6‡ 2.0 1.8 1.9 2.0 2.1 2.2 2.0 1.7 2.0 1.9 1.7 1.5 1.5 1.5 1.6 1.4 1.3 1.4 1.0 1.2 1.1 1.0 0.8 -0.1 -1.4 sss -62.3 ― ― 5+ drinks in a row in last 2 weeks 20.0 19.0 19.5 20.3 21.1 21.9 21.9 21.5 21.7 21.2 20.4 18.9 18.6 18.8 17.5 17.4 17.2 15.5 16.1 14.9 13.6 14.3 13.2 11.7 10.7 -0.9 s -11.2 sss -51.0 ― ― Been drunk 0.4 0.4 0.5 0.6 0.7 0.7 0.9 0.8 0.9 0.8 0.7 0.6 0.7 0.7 0.6 0.7 0.6 0.6 0.5 0.6 0.5 0.6 0.5 0.5 0.3 -0.2 ss -0.6 sss -66.5 ― ―Cigarettes 12.4 11.9 13.5 14.0 15.5 16.8 16.9 15.4 15.0 13.4 11.6 10.2 9.3 9.0 8.0 7.6 7.1 6.4 6.4 6.4 5.7 5.2 4.7 3.6 3.2 -0.4 -13.7 sss -81.1 ― ― 1/2 pack+/day 6.5 6.1 6.9 7.2 7.9 8.7 8.6 7.9 7.6 6.4 5.7 4.9 4.5 4.1 3.7 3.4 3.0 2.7 2.6 2.5 2.1 1.9 1.8 1.4 1.1 -0.2 -7.6 sss -86.9 ― ―Smokeless tobacco ― 3.0 2.7 2.9 2.5 2.3 2.5 2.1 1.7 1.9 2.0 1.4 1.6 1.7 1.6 1.5 1.6 1.6 1.8 2.1 1.8 1.9 1.7 1.8 1.7 -0.1 -1.2 ss -41.2 +0.3 +20.1Source. The Monitoring the Future study, the University of Michigan.Notes. ' – ' indicates data not available. ' ‡ ' indicates a change in the question text. When a question change occurs, peak levels after that change are used to calculate the peak year to current year difference.
Values in bold equal peak levels since 1991. Values in italics equal peak level before wording change. Underlined values equal lowest level since recent peak level.
Level of significance of difference between classes: s = .05, ss = .01, sss = .001.
Any apparent inconsistency between the change estimate and the prevalence estimates for the two most recent years is due to rounding.aThe proportional change is the percent by which the most recent year deviates from the peak year [or the low year] for the drug in question. So, if a drug was at 20% prevalence in the peak year and declined to 10% prevalence in the
most recent year, that would reflect a proportional decline of 50%.
2014–2015 Absolute Proportionalchange (%) a
TABLE 17Trends in Daily Prevalence of Use of Selected Drugs for Grades 8, 10, and 12 Combined
(Entries are percentages.)
Absolute ProportionalPeak year–2015 change Low year–2015 change
changechangechange change

FIGURE 1
Trends in Annual Prevalence of an Illicit Drug Use Index*
Grades 8, 10, and 12
Source. The Monitoring the Future study, the University of Michigan.
*In 2013, revised sets of questions on amphetamine use were introduced. Data for
any illicit drug were affected by these changes.
PE
RC
EN
T
0
20
40
60
80
YEAR
'75 '77 '79 '81 '83 '85 '87 '89 '91 '93 '95 '97 '99 '01 '03 '05 '07 '09 '11 '13 '15
8th Grade10th Grade12th Grade

FIGURE 2
Trends in Annual Prevalence of Any Illicit Drug other than Marijuana*
Grades 8, 10, and 12
Source. The Monitoring the Future study, the University of Michigan.
*Revised sets of questions on other hallucinogen and tranquilizer use were in introduced in 2001, and for
amphetamine use in 2013. Data for any illicit drug other than marijuna were affected by these changes.
PE
RC
EN
T
0
20
40
60
80
YEAR
'75 '77 '79 '81 '83 '85 '87 '89 '91 '93 '95 '97 '99 '01 '03 '05 '07 '09 '11 '13 '15
8th Grade10th Grade12th Grade

FIGURE 3
Marijuana: Trends in Annual Use, Risk, Disapproval, and Availability
Grades 8, 10, and 12
Source. The Monitoring the Future study, the University of Michigan.
Use% who used in last 12 months
Risk% seeing "great risk" in using regularly
Disapproval% disapproving of using regularly
Availability% saying "fairly easy" or "very easy" to get
PE
RC
EN
T
0
20
40
60
80
100
YEAR
'75 '77 '79 '81 '83 '85 '87 '89 '91 '93 '95 '97 '99 '01 '03 '05 '07 '09 '11 '13 '15
8th Grade10th Grade12th Grade
PE
RC
EN
T
0
20
40
60
80
100
YEAR
'75 '77 '79 '81 '83 '85 '87 '89 '91 '93 '95 '97 '99 '01 '03 '05 '07 '09 '11 '13 '15
PE
RC
EN
T
0
20
40
60
80
100
YEAR
'75 '77 '79 '81 '83 '85 '87 '89 '91 '93 '95 '97 '99 '01 '03 '05 '07 '09 '11 '13 '15
PE
RC
EN
T
0
20
40
60
80
100
YEAR
'75 '77 '79 '81 '83 '85 '87 '89 '91 '93 '95 '97 '99 '01 '03 '05 '07 '09 '11 '13 '15

FIGURE 4
Marijuana: Trends in Daily Use, Risk, Disapproval, and Availability
Grades 8, 10, and 12
Source. The Monitoring the Future study, the University of Michigan.
Use% who used daily
Risk% seeing "great risk" in using regularly
Disapproval% disapproving of using regularly
Availability% saying "fairly easy" or "very easy" to get
PE
RC
EN
T
0
4
8
12
16
20
YEAR
'75 '77 '79 '81 '83 '85 '87 '89 '91 '93 '95 '97 '99 '01 '03 '05 '07 '09 '11 '13 '15
8th Grade10th Grade12th Grade
PE
RC
EN
T
0
20
40
60
80
100
YEAR
'75 '77 '79 '81 '83 '85 '87 '89 '91 '93 '95 '97 '99 '01 '03 '05 '07 '09 '11 '13 '15
PE
RC
EN
T
0
20
40
60
80
100
YEAR
'75 '77 '79 '81 '83 '85 '87 '89 '91 '93 '95 '97 '99 '01 '03 '05 '07 '09 '11 '13 '15
PE
RC
EN
T
0
20
40
60
80
100
YEAR
'75 '77 '79 '81 '83 '85 '87 '89 '91 '93 '95 '97 '99 '01 '03 '05 '07 '09 '11 '13 '15

FIGURE 5
Synthetic Marijuana: Trends in Annual Use and Risk
Grades 8, 10, and 12
Source. The Monitoring the Future study, the University of Michigan.
Use% who used in last 12 months
Risk% seeing "great risk" in using once or twice
Disapproval% disapproving of using once or twice
Availability% saying "fairly easy" or "very easy" to get
PE
RC
EN
T
0
4
8
12
16
20
YEAR
'75 '77 '79 '81 '83 '85 '87 '89 '91 '93 '95 '97 '99 '01 '03 '05 '07 '09 '11 '13 '15
8th Grade10th Grade12th Grade
PE
RC
EN
T
0
20
40
60
80
100
YEAR
'75 '77 '79 '81 '83 '85 '87 '89 '91 '93 '95 '97 '99 '01 '03 '05 '07 '09 '11 '13 '15
PE
RC
EN
T
0
20
40
60
80
100
YEAR
'75 '77 '79 '81 '83 '85 '87 '89 '91 '93 '95 '97 '99 '01 '03 '05 '07 '09 '11 '13 '15
(no data)
PE
RC
EN
T
0
20
40
60
80
100
YEAR
'75 '77 '79 '81 '83 '85 '87 '89 '91 '93 '95 '97 '99 '01 '03 '05 '07 '09 '11 '13 '15
(no data)
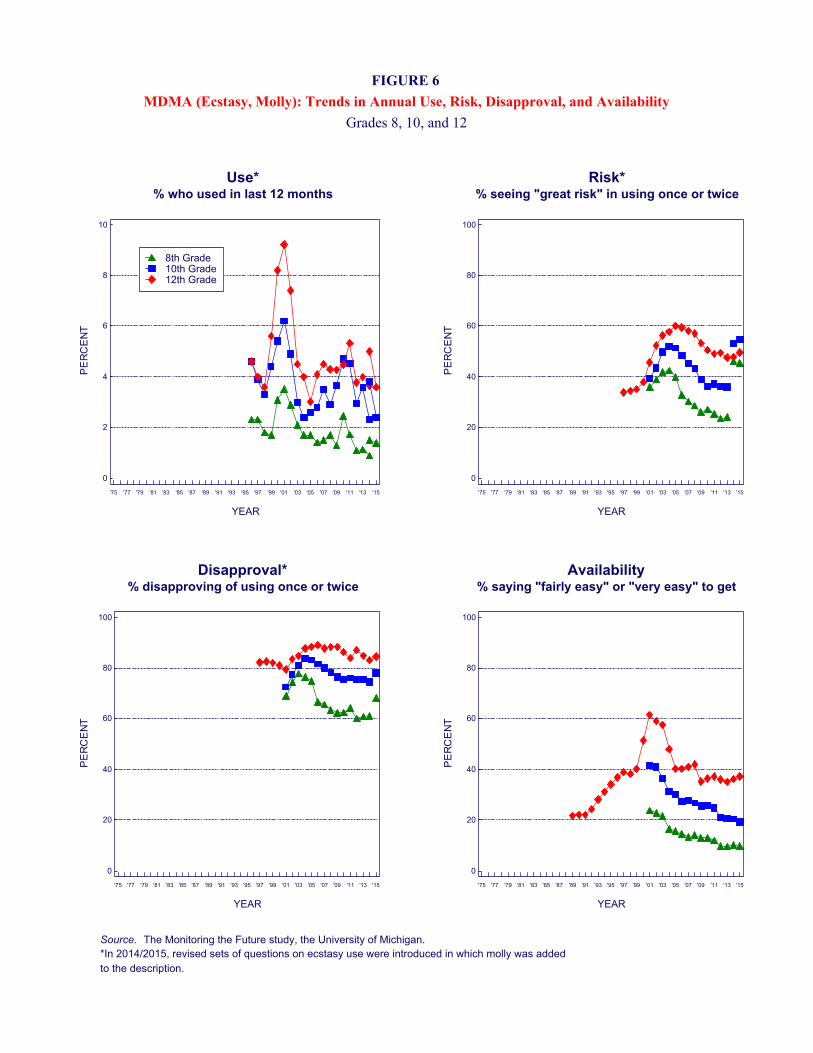
FIGURE 6
MDMA (Ecstasy, Molly): Trends in Annual Use, Risk, Disapproval, and Availability
Grades 8, 10, and 12
Source. The Monitoring the Future study, the University of Michigan.*In 2014/2015, revised sets of questions on ecstasy use were introduced in which molly was addedto the description.
Use*% who used in last 12 months
Risk*% seeing "great risk" in using once or twice
Disapproval*% disapproving of using once or twice
Availability% saying "fairly easy" or "very easy" to get
PE
RC
EN
T
0
2
4
6
8
10
YEAR
'75 '77 '79 '81 '83 '85 '87 '89 '91 '93 '95 '97 '99 '01 '03 '05 '07 '09 '11 '13 '15
8th Grade10th Grade12th Grade
PE
RC
EN
T
0
20
40
60
80
100
YEAR
'75 '77 '79 '81 '83 '85 '87 '89 '91 '93 '95 '97 '99 '01 '03 '05 '07 '09 '11 '13 '15
PE
RC
EN
T
0
20
40
60
80
100
YEAR
'75 '77 '79 '81 '83 '85 '87 '89 '91 '93 '95 '97 '99 '01 '03 '05 '07 '09 '11 '13 '15
PE
RC
EN
T
0
20
40
60
80
100
YEAR
'75 '77 '79 '81 '83 '85 '87 '89 '91 '93 '95 '97 '99 '01 '03 '05 '07 '09 '11 '13 '15

FIGURE 7
Heroin: Trends in Annual Use, Risk, Disapproval, and Availability
Grades 8, 10, and 12
Source. The Monitoring the Future study, the University of Michigan.*Prior to 1995, the questions asked about heroin use in general. Since 1995, the questions have asked about heroin use withouta needle.
Use% who used in last 12 months
Risk*% seeing "great risk" in using once or twice
Disapproval*% disapproving of using once or twice
Availability*% saying "fairly easy" or "very easy" to get
PE
RC
EN
T
0
1
2
3
4
5
YEAR
'75 '77 '79 '81 '83 '85 '87 '89 '91 '93 '95 '97 '99 '01 '03 '05 '07 '09 '11 '13 '15
8th Grade10th Grade12th Grade
PE
RC
EN
T
0
20
40
60
80
100
YEAR
'75 '77 '79 '81 '83 '85 '87 '89 '91 '93 '95 '97 '99 '01 '03 '05 '07 '09 '11 '13 '15
PE
RC
EN
T
0
20
40
60
80
100
YEAR
'75 '77 '79 '81 '83 '85 '87 '89 '91 '93 '95 '97 '99 '01 '03 '05 '07 '09 '11 '13 '15
PE
RC
EN
T
0
20
40
60
80
100
YEAR
'75 '77 '79 '81 '83 '85 '87 '89 '91 '93 '95 '97 '99 '01 '03 '05 '07 '09 '11 '13 '15

FIGURE 8
Narcotics other than Heroin: Trends in Annual Use and Availability
Grades 8, 10, and 12
Source. The Monitoring the Future study, the University of Michigan.*Beginning in 2002, a revised set of questions on other narcotics use was introduced in which Talwin, laudanum, and paregoricwere replaced as examples given with Vicodin, OxyContin, and Percocet.**Beginning in 2010, a revised set of questions on availability of other narcotics was introduced in which methadone and opiumwere replaced as examples given with Vicodin, OxyContin, and Percocet.
Use*% who used in last 12 months
Risk% seeing "great risk" in using once or twice
Disapproval% disapproving of using once or twice
Availability**% saying "fairly easy" or "very easy" to get
PE
RC
EN
T
0
4
8
12
16
20
YEAR
'75 '77 '79 '81 '83 '85 '87 '89 '91 '93 '95 '97 '99 '01 '03 '05 '07 '09 '11 '13 '15
8th Grade10th Grade12th Grade
PE
RC
EN
T
0
20
40
60
80
100
YEAR
'75 '77 '79 '81 '83 '85 '87 '89 '91 '93 '95 '97 '99 '01 '03 '05 '07 '09 '11 '13 '15
(no data)
PE
RC
EN
T
0
20
40
60
80
100
YEAR
'75 '77 '79 '81 '83 '85 '87 '89 '91 '93 '95 '97 '99 '01 '03 '05 '07 '09 '11 '13 '15
(no data)
PE
RC
EN
T
0
20
40
60
80
100
YEAR
'75 '77 '79 '81 '83 '85 '87 '89 '91 '93 '95 '97 '99 '01 '03 '05 '07 '09 '11 '13 '15

FIGURE 9
Amphetamines: Trends in Annual Use, Risk, Disapproval, and Availability
Grades 8, 10, and 12
Source. The Monitoring the Future study, the University of Michigan.*In 2013, for the questions on the use of amphetamines, the text was changed on some of the questionnaire forms for all three grades,with the remaining forms changed in 2014. Data presented here include only the changed forms.**In 2011 the list of examples was changed from uppers, pep pills, bennies, speed to uppers, speed, Adderall, Ritalin, etc.These changes likely explain the discontinuity in the 2011 results.
Use*% who used in last 12 months
Risk**% seeing "great risk" in using once or twice
Disapproval**% disapproving of using once or twice
Availability**% saying "fairly easy" or "very easy" to get
PE
RC
EN
T
0
10
20
30
40
50
YEAR
'75 '77 '79 '81 '83 '85 '87 '89 '91 '93 '95 '97 '99 '01 '03 '05 '07 '09 '11 '13 '15
8th Grade10th Grade12th Grade
PE
RC
EN
T
0
20
40
60
80
100
YEAR
'75 '77 '79 '81 '83 '85 '87 '89 '91 '93 '95 '97 '99 '01 '03 '05 '07 '09 '11 '13 '15
PE
RC
EN
T
0
20
40
60
80
100
YEAR
'75 '77 '79 '81 '83 '85 '87 '89 '91 '93 '95 '97 '99 '01 '03 '05 '07 '09 '11 '13 '15
PE
RC
EN
T
0
20
40
60
80
100
YEAR
'75 '77 '79 '81 '83 '85 '87 '89 '91 '93 '95 '97 '99 '01 '03 '05 '07 '09 '11 '13 '15

FIGURE 10
Alcohol: Trends in 30-Day Use, Risk, Disapproval, and Availability
Grades 8, 10, and 12
Source. The Monitoring the Future study, the University of Michigan.*Beginning in 1993, a revised set of questions on alcohol use was introduced, in which a drink was definedas "more than just a few sips."
Use*% who used in last 30 days
Risk% seeing "great risk" in having 5+ drinks in a
row once or twice each weekend
Disapproval% disapproving of having 5+ drinks in a row
once or twice each weekendAvailability
% saying "fairly easy" or "very easy" to get
PE
RC
EN
T
0
20
40
60
80
100
YEAR
'75 '77 '79 '81 '83 '85 '87 '89 '91 '93 '95 '97 '99 '01 '03 '05 '07 '09 '11 '13 '15
8th Grade10th Grade12th Grade
PE
RC
EN
T
0
20
40
60
80
100
YEAR
'75 '77 '79 '81 '83 '85 '87 '89 '91 '93 '95 '97 '99 '01 '03 '05 '07 '09 '11 '13 '15
PE
RC
EN
T
0
20
40
60
80
100
YEAR
'75 '77 '79 '81 '83 '85 '87 '89 '91 '93 '95 '97 '99 '01 '03 '05 '07 '09 '11 '13 '15
PE
RC
EN
T
0
20
40
60
80
100
YEAR
'75 '77 '79 '81 '83 '85 '87 '89 '91 '93 '95 '97 '99 '01 '03 '05 '07 '09 '11 '13 '15

FIGURE 11
Alcohol: Trends in Binge Drinking, Risk, Disapproval, and Availability
Grades 8, 10, and 12
Source. The Monitoring the Future study, the University of Michigan.
Use% having 5+ drinks in a row in past 2 weeks
Risk% seeing "great risk" in having 5+ drinks in a
row once or twice each weekend
Disapproval% disapproving of having 5+ drinks in a row
once or twice each weekendAvailability
% saying "fairly easy" or "very easy" to get
PE
RC
EN
T
0
20
40
60
80
100
YEAR
'75 '77 '79 '81 '83 '85 '87 '89 '91 '93 '95 '97 '99 '01 '03 '05 '07 '09 '11 '13 '15
8th Grade10th Grade12th Grade
PE
RC
EN
T
0
20
40
60
80
100
YEAR
'75 '77 '79 '81 '83 '85 '87 '89 '91 '93 '95 '97 '99 '01 '03 '05 '07 '09 '11 '13 '15
PE
RC
EN
T
0
20
40
60
80
100
YEAR
'75 '77 '79 '81 '83 '85 '87 '89 '91 '93 '95 '97 '99 '01 '03 '05 '07 '09 '11 '13 '15
PE
RC
EN
T
0
20
40
60
80
100
YEAR
'75 '77 '79 '81 '83 '85 '87 '89 '91 '93 '95 '97 '99 '01 '03 '05 '07 '09 '11 '13 '15