Embed Size (px)
Citation preview

Use of Aircraft Data at the National
Hurricane Center
James L. Franklin
WMO RA-IV Workshop
March 2018
1

Aircraft Observations Flight-level observations, SFMR, dropwindsondes,
and radar
Can be used subjectively by the Hurricane Specialists (HS)
Assist in the analysis and short-term forecasting of location, intensity, size, structure of the cyclone/disturbance.
Provide input to forecast models
Directly (e.g., direct assimilation of dropsondes released outside the core in synoptic surveillance, Doppler radar in HWRF).
Indirectly to both dynamical and statistical models, through HS specification of the storm “compute” parameters (e.g., MSLP, RMW, Vmax, 34/50/64 kt radii)
Best Track analysis

Definition of TC Intensity
(A) The highest 1-min average wind (at an elevation of
10 m with an unobstructed exposure) associated with
the TC at a particular point in time.
(B) The highest 1-min average wind (at an elevation of
10 m with an unobstructed exposure) that exists
anywhere within a TC circulation at a particular point in
time.
(C) The highest 1-min average wind (at an elevation of
10 m with an unobstructed exposure) occurring
anywhere within a TC circulation over the time interval
between advisories (or best-track analysis points).
(D) The minimum central pressure occurring anywhere
within the TC circulation.
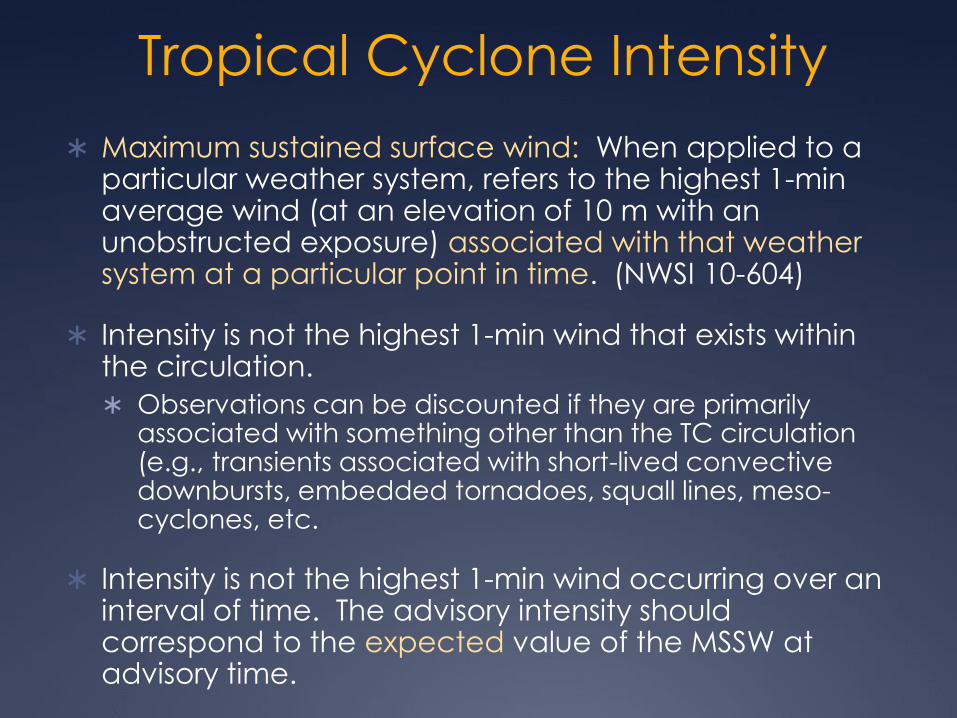
Tropical Cyclone Intensity
Maximum sustained surface wind: When applied to a particular weather system, refers to the highest 1-min average wind (at an elevation of 10 m with an unobstructed exposure) associated with that weather system at a particular point in time. (NWSI 10-604)
Intensity is not the highest 1-min wind that exists within the circulation.
Observations can be discounted if they are primarily associated with something other than the TC circulation (e.g., transients associated with short-lived convective downbursts, embedded tornadoes, squall lines, meso-cyclones, etc.
Intensity is not the highest 1-min wind occurring over an interval of time. The advisory intensity should correspond to the expected value of the MSSW at advisory time.

Representative Intensity
Peak winds in a model TC (blue curve in left diagram) can vary widely over periods of a few hours. Tracking these rapid changes for real storms is neither possible nor desirable. Best Track: Six-hourly representative estimates of the cyclone’s center position, maximum 1-min mean surface (10-m) wind, min sea level pressure, and max extent of 34-, 50-, and 64-kt winds in each of four quadrants around the center. Because features with wavelengths less than 4Δt (24 h) cannot be
accurately depicted, NHC generally does not try to represent these scales in the best track. Best-track and operational intensity estimates attempt to smooth through the short-term fluctuations. NHC Hurricane Specialists have to use their judgment whether any particular observation is representative of the tropical cyclone or some transient feature, and balance representativeness against sampling considerations.

RECON FLIGHT-LEVEL WINDS
HURRICANE GEORGES 9/20/98 20-23Z
105 kt
90 kt
90 kt 95 kt

Sampling Limitations
Courtesy Dave Zelinsky
Peak winds in the hurricane eyewall may occur in a band only a few km
across, and be located anywhere azimuthally in an eyewall that is sampled only at four locations over a period of 1.5 hr. The odds that the peak sustained
winds are observed by aircraft or encountered by coastal surface stations are exceedingly small.

Intensity/Observation Challenges
With very, very few exceptions, direct observations of the
maximum sustained surface wind in a tropical cyclone are
not available.
Aircraft flight-level winds
Require vertical adjustment to the surface
Sampling limitations
Representativeness issues
SFMR winds
Sampling limitations
Representativeness issues
Rain/wind separation
Dropsondes
Temporal interpretation/representativeness
Point observations with severe sampling considerations
As a result, NHC intensity estimates good to +/- 10%.
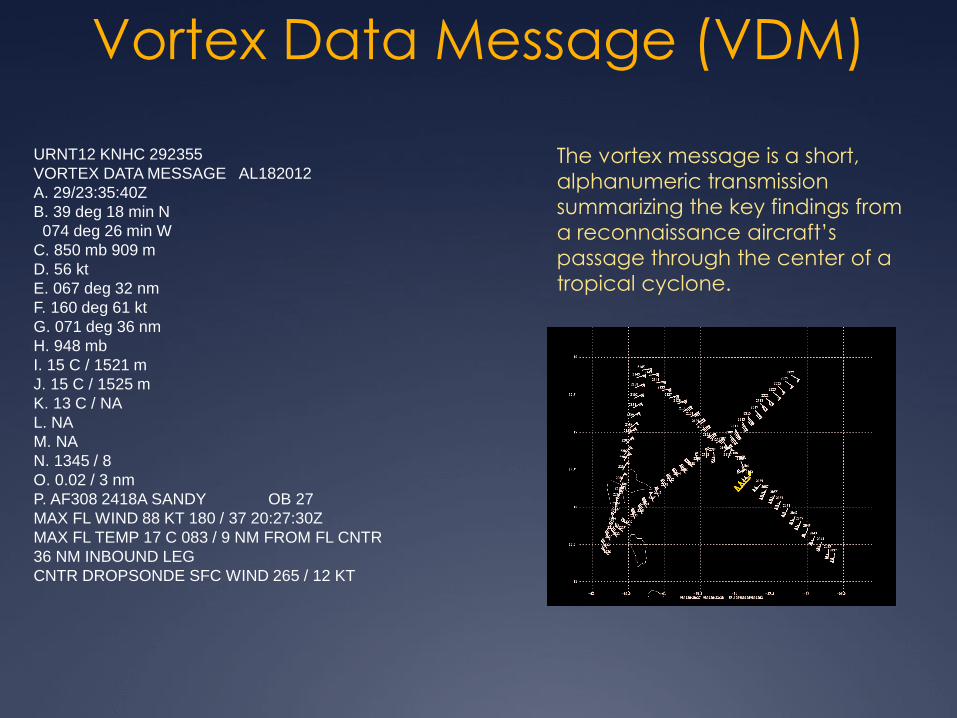
Vortex Data Message (VDM)
The vortex message is a short,
alphanumeric transmission
summarizing the key findings from
a reconnaissance aircraft’s
passage through the center of a
tropical cyclone.
URNT12 KNHC 292355
VORTEX DATA MESSAGE AL182012
A. 29/23:35:40Z
B. 39 deg 18 min N
074 deg 26 min W
C. 850 mb 909 m
D. 56 kt
E. 067 deg 32 nm
F. 160 deg 61 kt
G. 071 deg 36 nm
H. 948 mb
I. 15 C / 1521 m
J. 15 C / 1525 m
K. 13 C / NA
L. NA
M. NA
N. 1345 / 8
O. 0.02 / 3 nm
P. AF308 2418A SANDY OB 27
MAX FL WIND 88 KT 180 / 37 20:27:30Z
MAX FL TEMP 17 C 083 / 9 NM FROM FL CNTR
36 NM INBOUND LEG
CNTR DROPSONDE SFC WIND 265 / 12 KT

VDM Format Changing for 2018
URNT12 KNHC 241133
VORTEX DATA MESSAGE AL162016
A. 24/11:12:50Z
B. 10 deg 58 min N
082 deg 46 min W
C. 700 mb 2927 m
D. 90 kt
E. 144 deg 5 nm
F. 253 deg 78 kt
G. 158 deg 8 nm
H. 977 mb
I. 10 C / 3042 m
J. 18 C / 3045 m
K. NA / NA
L. CLOSED
M. C20
N. 12345 / 7
O. 0.02 / 1 nm
P. AF301 0616A OTTO OB 13
MAX OUTBOUND AND MAX FL WIND 108 KT 349 / 14 NM
11:17:00Z
CNTR DROPSONDE SFC WIND 210 / 11 KT
URNT12 KNHC 241133
VORTEX DATA MESSAGE AL162016
A. 24/11:12:50Z
B. 10.97 deg N 082.77 deg W
C. 700 mb 2927 m
D. 977 mb
E. 210 deg 11 kt
F. CLOSED
G. C20
H. 90 kt
I. 144 deg 5 nm 11:07:00Z
J. 253 deg 78 kt
K. 158 deg 8 nm 11:07:30Z
L. 95 kt
M. 314 deg 5 nm 11:17:00Z
N. 033 deg 108 kt
O. 349 deg 14 nm 11:17:30Z
P. 10 C / 3042 m
Q. 18 C / 3045 m
R. NA / NA
S. 12345 / 7
T. 0.02 / 1 nm
U. AF301 0616A OTTO OB 13
MAX FL WIND 108 KT 349 / 14 NM 11:17:00Z
OLD NEW

VDM Changes for 2018
URNT12 KNHC 241133
VORTEX DATA MESSAGE AL162016
A. 24/11:12:50Z
B. 10.97 deg N 082.77 deg W
C. 700 mb 2927 m
D. 977 mb
E. 210 deg 11 kt
F. CLOSED
G. C20
H. 90 kt
I. 144 deg 5 nm 11:07:00Z
J. 253 deg 78 kt
K. 158 deg 8 nm 11:07:30Z
L. 95 kt
M. 314 deg 5 nm 11:17:00Z
N. 033 deg 108 kt
O. 349 deg 14 nm 11:17:30Z
P. 10 C / 3042 m
Q. 18 C / 3045 m
R. NA / NA
S. 12345 / 7
T. 0.02 / 1 nm
U. AF301 0616A OTTO OB 13
MAX FL WIND 108 KT 349 / 14 NM 11:17:00Z
Major changes to the VDM:
1. New message includes formal
entry for outbound wind
maxima.
2. Latitude and longitude now
given in decimal degrees.
3. New data block for TC center
attributes.
4. Includes observation times for
max wind data.
5. Related items grouped
together.

VDM Changes for 2018
URNT12 KNHC 241133
VORTEX DATA MESSAGE AL162016
A. 24/11:12:50Z A. Date and time of fix
B. 10.97 deg N 082.77 deg W B. Lat/Lon of center position
C. 700 mb 2927 m C. Minimum height at standard pressure level
D. 977 mb D. Minimum sea-level pressure
E. 210 deg 11 kt E. Surface wind from center dropwindsonde
F. CLOSED F. Eye characteristic
G. C20 G. Eye shape/orientation/diameter
H. 90 kt H. Maximum inbound observed surface wind
I. 144 deg 5 nm 11:07:00Z I. Bearing, range, and time of (H).
J. 253 deg 78 kt J. Maximum inbound observed FL wind
K. 158 deg 8 nm 11:07:30Z K. Bearing, range, and time of (J).
L. 95 kt L. Maximum outbound observed surface wind
M. 314 deg 5 nm 11:17:00Z M. Bearing, range, and time of (L).
N. 033 deg 108 kt N. Maximum outbound observed FL wind.
O. 349 deg 14 nm 11:17:30Z O. Bearing, range, and time of (N).
P. 10 C / 3042 m P. Max FL T/PA observed outside of eye.
Q. 18 C / 3045 m Q. Max FL T/PA observed inside the eye.
R. NA / NA R. TD/SST observed inside the eye.
S. 12345 / 7 S. Fix determined by…
T. 0.02 / 1 nm T. Fix accuracy (navigational, meteorological)
U. AF301 0616A OTTO OB 13 U. AC ID, mission ID, storm name, ob number
MAX FL WIND 108 KT 349 / 14 NM 11:17:00Z Remarks, incl max FL wind during

Center (eye) drops are
released at the flight-level wind
minimum, but may drift away
from surface minimum.
Rule of thumb for estimating
cyclone MSLP is to subtract 1
mb from the sonde splash
pressure for each full 10 kt of
surface wind reported by the
sonde.
Splash pressure 1004 mb.
Surface wind: 24 kt.
Estimated MSLP = 1002 mb.

Representativeness of Dropsondes
AIRCRAFT TRACK
DROPSONDE
TRAJECTORY 100 90 80 70 10000 ft
~1-2 miles

Location, Location, Location
Three dropsondes
released in different
portions of the hurricane
eyewall recorded
surface winds differing
by ~45 kt!

Small-scale Variability in a Tropical Cyclone
Three dropsondes
released over a span of
40 seconds. These
closely spaced
soundings quickly
diverge in the turbulent
and chaotic hurricane
environment, especially
in the boundary layer.
Individual GPS
dropsonde winds
represent a sampling
period of < 1 second.

WL150
MBL
Spot winds at the surface are
generally not representative of a 1-
min wind in turbulent environments.
Look at profile shape for clues.
Use layer mean winds (MBL and
WL150) to estimate representative
surface winds. MBL is most
conservative but treats all boundary
layers the same.

Mean Hurricane Wind Profiles
Franklin et al., 2003: GPS
dropwindsonde wind profiles
in hurricanes and their
operational implications.,
Wea. Forecasting, 18, 32-44.
Mean hurricane profiles can
be used to adjust winds from
one level/layer to the surface.

UZNT13 KWBC 220345 XXAA 72037 99253 70951 08255 99959 25401 ///// 00867 ///// /////
92322 23204 08646 85060 20408 11120 70/// ///// 15091 88999 77999
61616 AF963 0202A BRET OB 10
62626 EYEWALL 045 SPL 2532N09528W WL150 07136 121 DLM WND 11615 6
96955 MBL WND 08141 LST WND 046=
XXBB 72038 99253 70951 08255 00959 25401 11947 24600 22713 14816
33710 148//
21212 00959 ///// 11955 07142 22953 07133 33951 07130 44948 07133
55945 07649 66941 07135 77940 07633 88937 08142 99931 08653 11926
08647 22921 08650 33912 09139 44910 09141 55907 09655 66904 09655
77898 09635 88891 10142 99885 10637 11881 10624 22874 11135 33868
11123 44753 13619 55696 15087
31313 09608 80328
61616 AF963 0202A BRET OB 10
62626 EYEWALL 045 SPL 2532N09528W WL150 07136 121 DLM WND 11615 6
96955 MBL WND 08141 LST WND 046=
TEMP-DROP message
and EYEWALL WINDS

Ignore the Skinny Black Line
Spot surface wind was 64 kt
MBL wind of 73 kt adjusts to 58
kt sfc-equivalent.
WL150 wind of 67 kt at 75 m
adjusts to 56 kt sfc-equivalent.
Upward kink of WS at surface
strongly argues that the 64 kt sfc wind represented a gust.


URNT15 KNHC 281426
AF302 1712A KATRINA HDOB 41 20050928
142030 2608N 08756W 7093 03047 9333 +192 +134 133083 089 080 999 00
142100 2609N 08755W 7091 03054 9330 +166 +146 133106 115 103 999 00
142130 2610N 08754W 7058 03040 9295 +134 +134 135121 124 111 999 00
142200 2611N 08753W 7037 03060 9291 +124 +124 138129 136 122 999 00
.
.
.
142230 2612N 08752W 7010 03057 9282 +102 +102 141153 166 148 999 00
142300 2612N 08751W 7042 03010 9293 +088 +083 133159 164 147 999 00
142330 2613N 08750W 6999 03064 9279 +088 +088 138158 161 144 999 00
142400 2614N 08749W 7005 03046 9281 +080 +080 138155 158 142 999 00
142430 2614N 08748W 6998 03048 9278 +078 +078 138151 153 137 999 00
142500 2615N 08747W 7002 03048 9279 +084 +084 140146 148 133 999 00
$$
HDOBS Message Format
Data flags
SFMR rain
rate
Wind block: direction, flt-
level wind, MAX flt-level
wind (10 second) and SFMR
sfc wind (10 second)
Thermodynamic block:
Temp and dwpt
Pressure >= 550 mb: extrapolated
surface pressure (tenths of mb)
Pressure < 550 mb: D-value (m)
Geopotential
height (m)
Static pressure
at flight level
ddd.d
Lat & Lon
Time (UTC)
Date of first HDOB
in this report
i.e. OB 01
Time and positioning parameters
are instantaneous values
Meteorological parameters are
30 s averages except as noted.
10-s averages
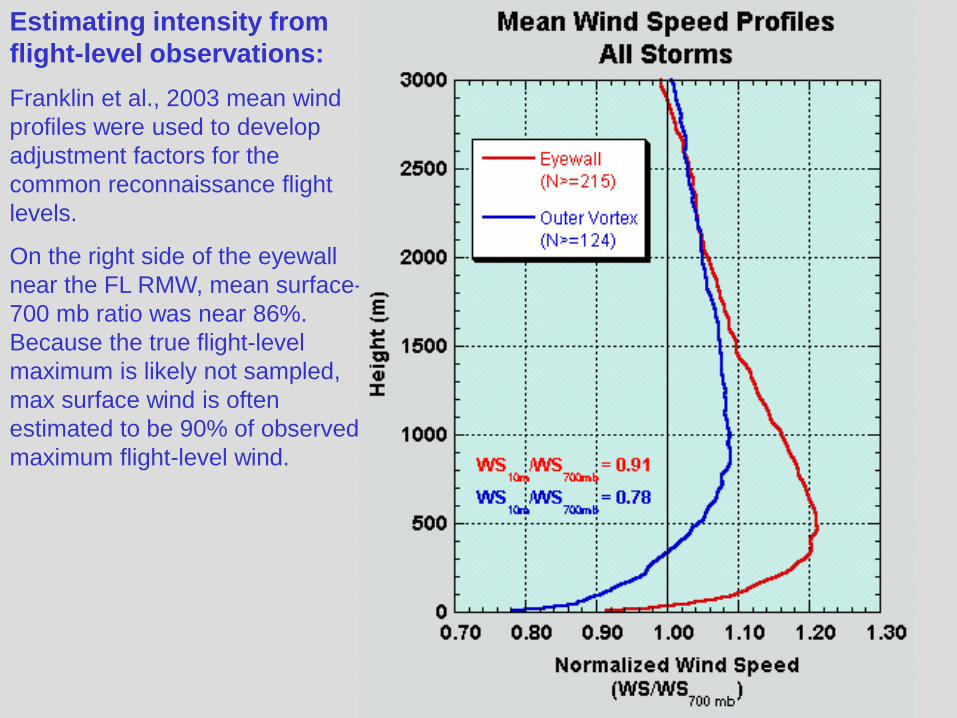
Estimating intensity from
flight-level observations:
Franklin et al., 2003 mean wind
profiles were used to develop
adjustment factors for the
common reconnaissance flight
levels.
On the right side of the eyewall
near the FL RMW, mean surface-
700 mb ratio was near 86%.
Because the true flight-level
maximum is likely not sampled,
max surface wind is often
estimated to be 90% of observed
maximum flight-level wind.

Estimating Intensity From Flight-Level Wind
Reference Level Adjustment Factor
700 mb 90%
850 mb 80%
925 mb 75%
1000 ft 80%

Intensity Adjustment Factors and Radii
Thresholds – 700 mb
Sample Adjust (%) FLW64 (kt) FLW50 (kt) FLW34 (kt)
Eyewall 0.90 70 55 -
Outer vortex 0.85 75 60 40
Outer vortex
/ Right quad 0.75 85 65 45
Outer vortex
/ Left quad 0.90 70 55 40

Variability of Standard Adjustment
SFC:700 mb wind ratios vary from storm to storm, and can range from ~70% to >100%. But departures from standard adjustment cannot be determined from just a few sondes. Convective vigor
Eyewall structure, cycle, RMW
Low-level stability/cooler waters
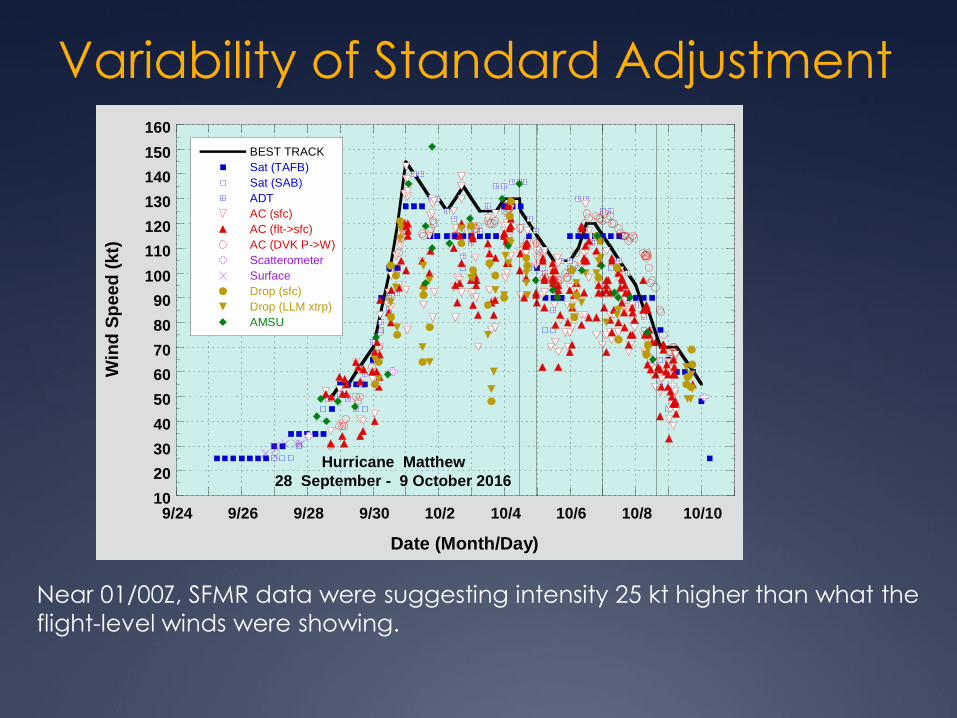
Variability of Standard Adjustment
Near 01/00Z, SFMR data were suggesting intensity 25 kt higher than what the
flight-level winds were showing.
10
20
30
40
50
60
70
80
90
100
110
120
130
140
150
160
9/24 9/26 9/28 9/30 10/2 10/4 10/6 10/8 10/10
BEST TRACK
Sat (TAFB)
Sat (SAB)
ADT
AC (sfc)
AC (flt->sfc)
AC (DVK P->W)
Scatterometer
Surface
Drop (sfc)
Drop (LLM xtrp)
AMSU
Win
d S
peed
(kt)
Date (Month/Day)
Hurricane Matthew
28 September - 9 October 2016

SFMR measures C-band
microwave emission from foam
(air bubbles in the ocean). The
measured microwave emission
is a function of (among other
things) the surface wind speed
and the rain rate.

SFMR issues
Shoaling – breaking waves in areas of shallow
water can artificially increase the SFMR
retrieved wind and invalidate the observations.
Interaction of wind and wave field can introduce
azimuthally-dependent errors (~ 5 kt).
Rain impacts not always properly accounted for
(mainly < 50 kt).
Calibration has historically been an ongoing
(and frustrating) process, but the calibration of
the SFMR is finally stable.

Rain-Wind Error Couplets Can Occur at TD/TS
Wind Speeds
Rain increases,
algorithm erroneously
attributes too much of
the signal to rain and
retrieved winds
decrease.
Rain decreases,
algorithm erroneously
attributes too much
signal to rain and
retrieved winds increase.

Effect Greatly Reduced in Current Algorithm

Closing Thoughts
All reconnaissance observations have limitations that
complicate interpretation. Specialist attempts to blend
data in an intelligent manner that recognizes the
strengths and weaknesses of each data source.
For example, we still use flight-level winds even though we
have the SFMR.
NHC’s analyses of TC intensity and size have
considerable error.
Intensity only good to within ~10% (e.g., 100 kt +/- 10 kt)
TS wind radii to about ~25% (e.g., 120 nm +/- 30 nm).
HU wind radii to about ~40% (e.g., 25 nm +/- 10 nm).


![unisys.co.jpunisys.co.jp/tec_info/tr00-49/36.pdf · VDM (479) 17 VDM-SL VDM E Z RAISE VDM-SL D, VDM [1] D. Andrews, Report on the Standardization of VDM-SL 04/08/92 Ref. N-242. C](https://img.dokumen.tips/doc/110x75/5b06b0ce7f8b9ac33f8d29a7/479-17-vdm-sl-vdm-e-z-raise-vdm-sl-d-vdm-1-d-andrews-report-on-the-standardization.jpg)