Embed Size (px)
Citation preview
B. A. Thorp, Inc.
2006 Forum on Energy: Immediate Solutions,
Emerging TechnologiesMay 15-17
Appleton, WI
Use Best Practices to Drive Energy Out
Presented by: B. A. [email protected]
Excerpts from: Pulp And Paper Energy Best Practice Guidebook
“Research without
deployment is a waste”

Are You A World Class Energy Consumer?
World class energy users have:Benchmarked energy consumption in their mill Defined a quantifiable, affordable energy reduction goalEstablished a multi-year plan to meet their energy reduction goalsAssigned a cross-functional team to implement the planReporting, feedback, and renewal processFirm commitments from mill manager for mill-wide improvements in energy efficiency and demand reduction

Benchmarking
Benchmarking is the process of determining:who is the very bestwho sets the standardwhat that standard is
Benchmarking allows you to:compare your mill to those with top energy performancedetermine the gap between their mill and yourshelp you set targets and model results for best practice implementation
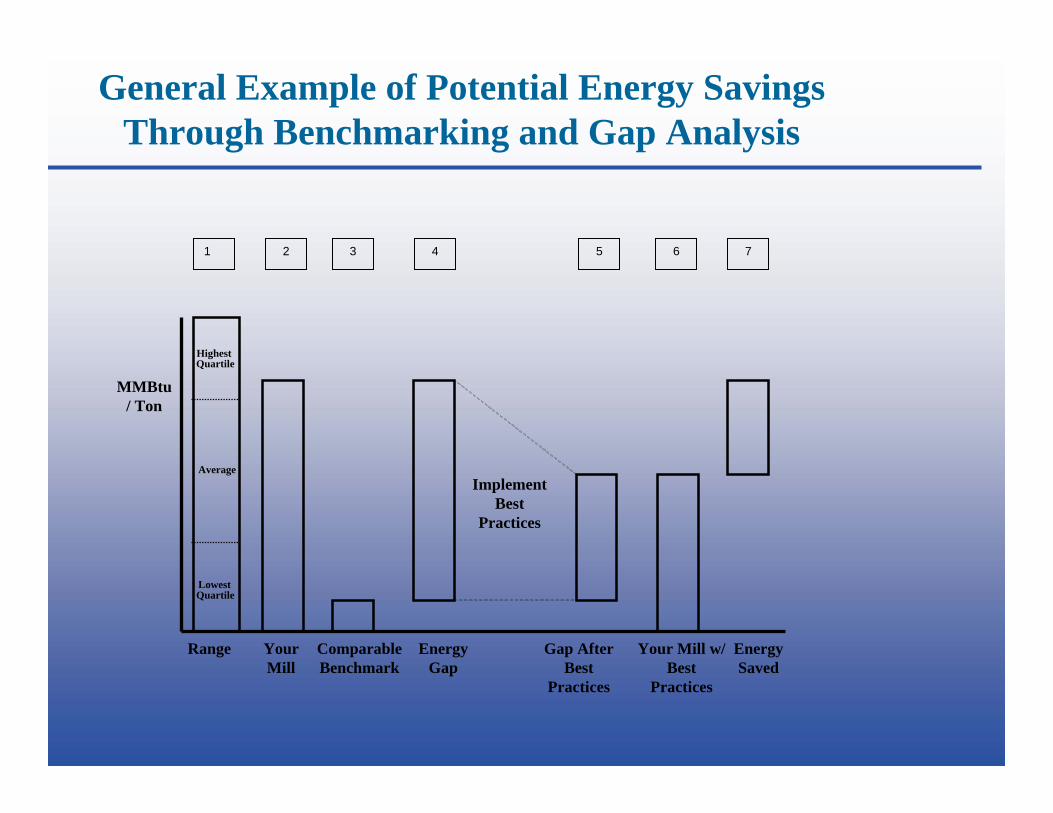
General Example of Potential Energy SavingsThrough Benchmarking and Gap Analysis
Lowest Quartile
HighestQuartile
Average
Range Your Mill
Comparable Benchmark
Energy Gap
Gap After Best
Practices
Your Mill w/Best
Practices
Energy Saved
Implement Best
Practices
MMBtu/ Ton
1 2 3 4 5 6 7

Energy Benchmarks - Gross Thermal/Power Consumption per Ton of Salable Paper
9618.91,2606.77205.45304.84505.157911.6Total
----------461.0Kiln & Recausticizing
300.6300.4300.3300.3300.31382.0Utilities (includeswastewater)
----------272.7Black LiquorEvaporation
5816.06004.75904.54103.93104.0--Paper Making
----------1282.0Pulp Making
500.5100.1------912.0Bleaching
----------680.4OxygenDelignification
--5751.3--------Mechanical Pulping
3001.8300.21000.6900.61100.8631.5Pulping, Repulping or Recycling
--150------180Wood/Chip Conveying
kWhMMBtukWhMMBtukWhMMBtukWhMMBtukWhMMBtukWhMMBtuUnits
RecycledTissue
Coated 4-5(purchased Kraftand self-produced
Groundwood)
Coated 1-3 (purchased Kraft)
Fine Paper(purchased Kraft)
RecycledLinerboard
MarketPulp Mill

Example of Potential Energy Savings for a Mill Making #4 Coated Paper
LowestQuartile
HighestQuartile
Average
Range Your Mill
ComparableBenchmark
Energy Gap
Gap WithoutMajor Capital
Your Mill w/Best Practices
EnergySaved
ImplementBest
Practices
MMBtu/ Ton
10.3
9.3
6.3
8.3
9.5
7.3
6.5
3.0
1.4
1.6
1 2 3 4 5 6 7
7.9

Best Practice Energy Studies
The purpose of this section is to provide mill management with the essential ingredients of a best practice energy study that would be conducted by an outside energy consulting firm.
The difference in the quality of the 50+ studies reviewed was primarily due to the study scope definition. A Best Practice study will define both the breadth and the depth of the scope.
The goal is to get a long term energy reduction plan that will be cost effective. The price of the study is a secondary issue compared to the potential savings.
The 80/20 Rule
During this or any other study, it will become apparent that ~20% of the equipment, processes or systems will consume ~80% of the energy.
It is a best practice to quantify energy use and numerically determine the high energy users.
Pre-Study Work
Ideally, pre-study work should be defined in the contract and a sample form attached by the outside firm.
The outside team of energy study providers will have limited time in the mill and a good cost effective practice is to make sure they use the limited time on important issues.
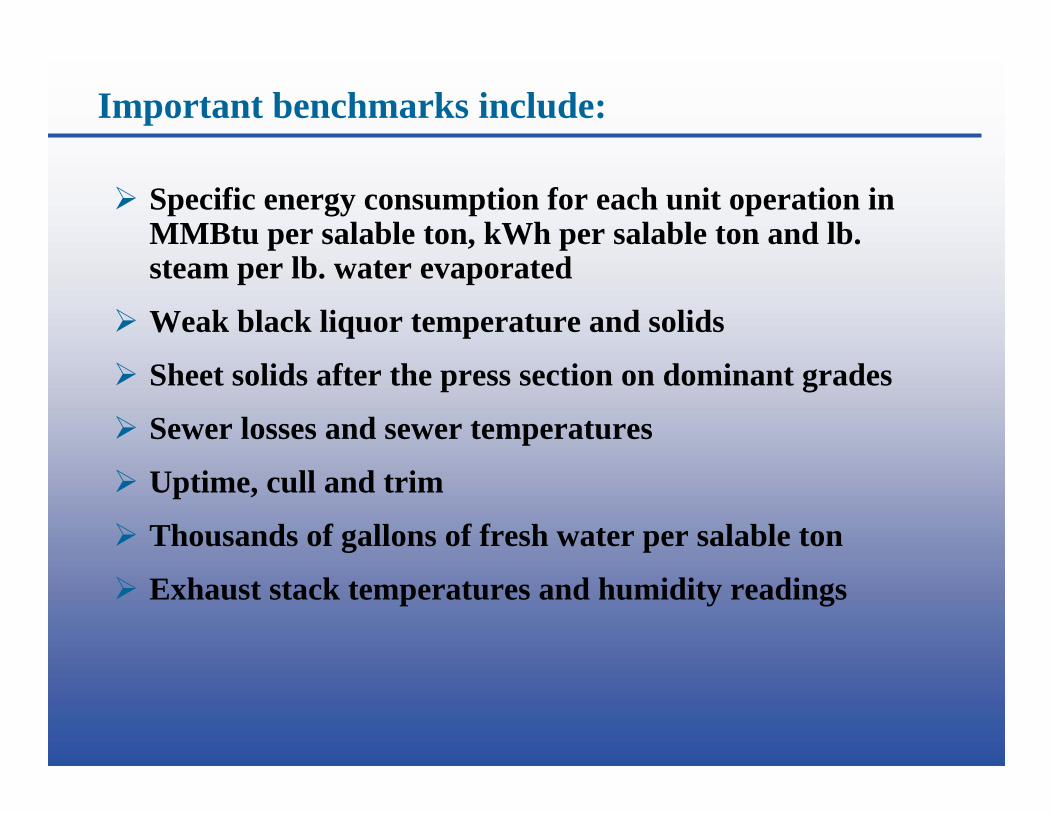
Important benchmarks include:
Specific energy consumption for each unit operation in MMBtu per salable ton, kWh per salable ton and lb. steam per lb. water evaporated
Weak black liquor temperature and solids
Sheet solids after the press section on dominant grades
Sewer losses and sewer temperatures
Uptime, cull and trim
Thousands of gallons of fresh water per salable ton
Exhaust stack temperatures and humidity readings

Key areas that need to be monitored for each unit process include:
Steam flows from each header
Energy consumption – electricity, natural gas and/or biomass
Fresh water use
Sewer flows and temperatures
Condensate return

“Must Have” Components
One critical component of a best practice energy study is to determine the “health” of mill energy monitoring systems.
It is also critical to understand the process and the interactions between energy, quality, productivity, maintenance and safety. The most energy efficient way of operating may not be the best way in all cases.

Energy Inputs, Outputs and Energy/Mass Balances
An energy balance diagrammatically documents energy inputs and outputs, the energy flow and the transformation of energy within an area.
Mass balance determines yield, loss of product or chemical and “deadload” all of which can affect energy reduction.

Example of an Overall Mill Balance –Energy Input Equals Energy Output
The left side shows INPUTS, which are well-understood by many operators and engineers.
The right side shows OUTPUTS, which are typically not well documented or understood.
(needs to be expanded to illustrate a comprehensive energy balance)

Best Practice Prefix Description
Wood YardWY
Utility PlantUTL
Thermal-mechanical (groundwood) Pulp MillTMP
Secondary Fiber PlantSFP
Paper Machine PM
Mill WideMW
Chemical Pulp MillCPM
DescriptionPrefix

Pulp and Paper Energy Best Practices
Efficient Bleaching Chemical Mixing in the Pulp Mill10CPMReline Lime Kiln Using High Performance Refractory9CPMSolid Fueled Lime Kiln8CPMHigh Pressure Shower for Lime-Mud Pre-coat Filter7CPMReplace Wet Scrubbers with Electrostatic Precipitators6CPMTertiary and Quaternary Combustion Air5CPMUse of Pulping Aids to Improve Yields 4CPMDigester Blow Heat Recovery System3CPMCarbon Dioxide Washing Aid 2CPMLime Kiln Oxygen Enrichment 1CPM
Title#Area

Title#Area
Capture Whitewater Waste Heat to Pre-Heat Mill Water11MWOptimizing Pump Efficiency 10MWInstall Secondary and Tertiary Heat Recovery Systems9MWReduce Fresh Water Consumption 8MWInstall and Use Real Time Energy Monitoring Systems7MWMinimize Pressure Drops 6MWIdle Equipment 5MWUse High Efficiency Motors 4MWUse Variable Frequency Drives on Motors with Variable Loads3MWCollect and Reuse Mill Hot Water 2MWStop Compressed Air, Water and Steam System Leaks 1MW
Pulp and Paper Energy Best Practices (cont)

Paper Machine Hood Heat Recovery12PMUse Low Pressure Steam in Paper Machine Dryer Section13PMUse Air Impingement Dryers for Coater In Place of Infra-Red Dryers14PM
High Performance Coater Air Dryer Nozzles11PM
Title#Area
Use Clarified Water as Vacuum Pump Seal Water10PMDryer Section Performance Monitoring 9PMHeat Felt Water 8PMVariable Speed Thick Stock Basis Weight Control 7PMWet-Dry End Broke Surge Tanks6PMUse a Shoe Press in the Press Section5PMOperate Pocket Ventilation Between 180-195°F4PMUse a Dryer Management System 3PMKeep Dryer Section Exhaust Humidity at Optimal Levels2PMUse Dryer Bars and Stationary Siphons in “Rimming” Dryers1PM
Pulp and Paper Energy Best Practices (cont)
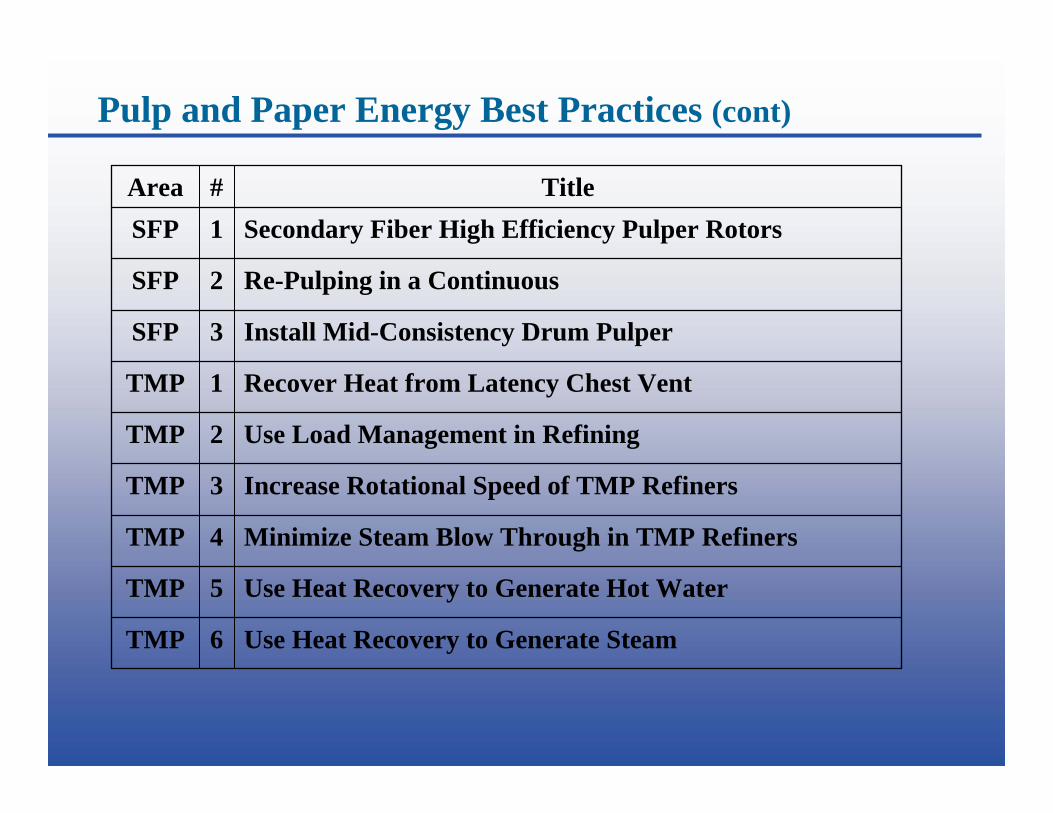
Title#Area
Use Heat Recovery to Generate Steam6TMP
Use Heat Recovery to Generate Hot Water5TMP
Minimize Steam Blow Through in TMP Refiners4TMP
Increase Rotational Speed of TMP Refiners3TMP
Use Load Management in Refining2TMP
Recover Heat from Latency Chest Vent1TMP
Install Mid-Consistency Drum Pulper 3SFP
Re-Pulping in a Continuous2SFP
Secondary Fiber High Efficiency Pulper Rotors 1SFP
Pulp and Paper Energy Best Practices (cont)
Title#Area
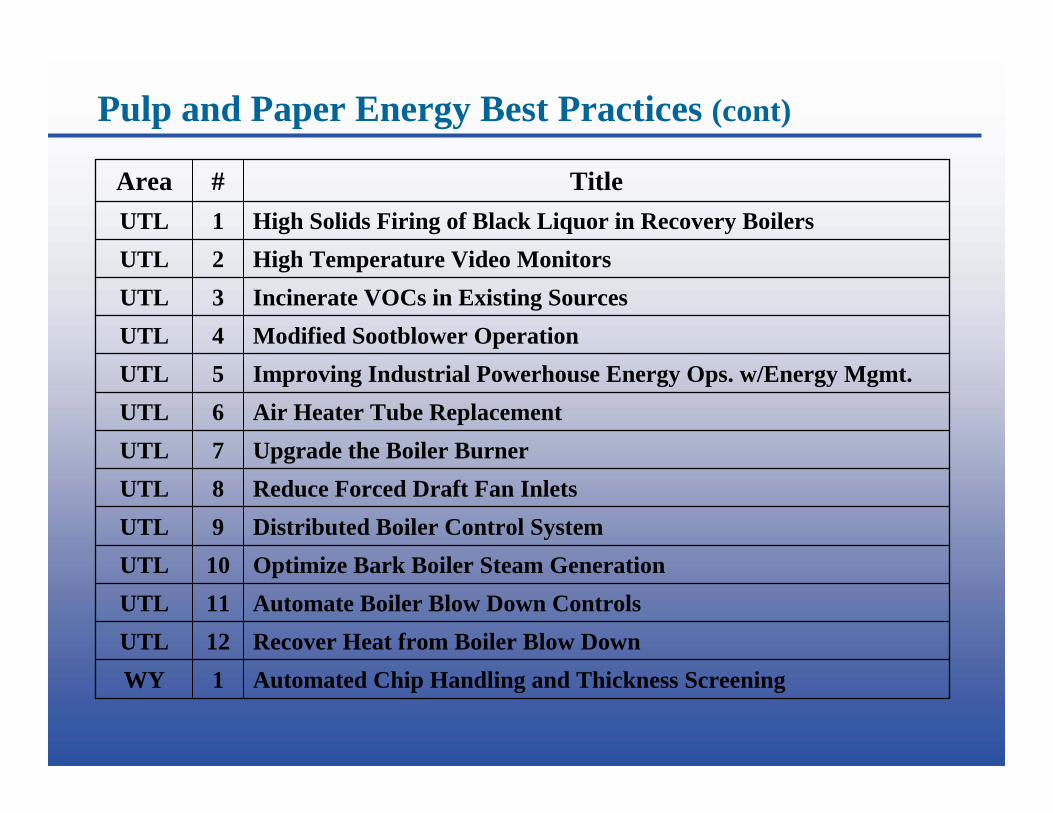
Automated Chip Handling and Thickness Screening1WYRecover Heat from Boiler Blow Down12UTLAutomate Boiler Blow Down Controls11UTLOptimize Bark Boiler Steam Generation10UTLDistributed Boiler Control System9UTLReduce Forced Draft Fan Inlets8UTLUpgrade the Boiler Burner7UTLAir Heater Tube Replacement6UTLImproving Industrial Powerhouse Energy Ops. w/Energy Mgmt. 5UTLModified Sootblower Operation 4UTLIncinerate VOCs in Existing Sources3UTLHigh Temperature Video Monitors2UTLHigh Solids Firing of Black Liquor in Recovery Boilers1UTL
Pulp and Paper Energy Best Practices (cont)

MW 3 - Use Variable Frequency Drives on Motors with Variable Loads (also see Environmental Impact Statement immediately following)
This technology offers the opportunity to more closely integrate variable processes throughout the mill. The enhanced integration can lead to improvements in uptime and productivity.
Typical Productivity Impact
The primary environmental benefit stems from the decreased consumption of electricity. Typical Environmental Benefits
Most drive manufacturers offer some version of the variable-speed drive. For more energy related information see the US Department of Energy’s Web site: www.oit.doe.govThere are a number of commercial resources for this technology. Please contact one of the Wisconsin Focus on Energy representatives listed in Appendix C if you need additional information.
Resources
The primary limitation is not the technology, but rather the time required to identify, engineer and install the drives.
Specific Applications & Limitations
Variable-speed technology has become affordable; in the optimal cases, ROI can range from 25% to 70%.Return on Investment
There are many applications where energy is wasted by employing a fixed-speed drive to accomplish a variable output. In mill studies, over 20% of all rotating equipment could employ variable-speed technology.
Typical Energy Savings
This technology can be used on rotating equipment throughout the mill. Agitators, pumps, fans and blowers are good candidates for variable speed drive implementation.Primary Area/Process
Variable frequency drives (VFD) alter motor output speeds to match the application requirement. They can be used to replace recirculation or throttling valves on water or condensate lines and to replace inlet or outlet vane dampers on fans.
Best Practice Description

Environmental Impact StatementMW 3 – Use Variable Frequency Drives on Motors with Variable Loads
Description: Many mills have the opportunity to install variable frequency drives for applications with variable loads. They can be used to replace recirculation or throttling valves on water or condensate lines and to replace inlet or outlet vane dampers on fans. Variable-speed technology has become affordable; in optimal cases, ROI can range from 25% to 70%. Other benefits include less stress on equipment, increased life and reduced maintenance.
Environmental Considerations: The effect of reduced energy usage on the emissions from an electrical generating facility is difficult to characterize due to the broad range of configurations of power plant and emission equipment. However one can expect that a reduced electrical loading in the field would result in proportional reductions in emissions at the point of generation. The table below illustrates possible emission savings from an electrical generating facility from the application of variable frequency drives that saves a nominal 100 hp-day. Variable frequency drives should not adversely impact product quality or overall productivity. Environmental regulatory permitting must be considered on an individual basis for each project. A Major-Source review for environmental impact is typically required where productivity is impacted. In Wisconsin, the DNR has indicated that cooperative agreements may be considered for those companies that demonstrate “beyond-compliance performance” under the Green Tier Program. In addition, such ideas as bubble permits may be considered for those companies with multiple business units.

Environmental Impact StatementMW 3 – Use Variable Frequency Drives on Motors with Variable Loads
Type Pounds/DayNOx 10SOx 22CO2 3968
Table Assumptions: 1) No productivity change from best practice implementation 2) Assumes 100 hp-day 3) all purchased power 4) CO emission factor not available
Reductions from Implementing this Best Practice
Resources“Estimating Seasonal and Peak Environmental Emissions Factors – Final Report”, May 21, 2004, State of Wisconsin Department of Administration Division of Energy

MW 5 - Idle Equipment(also see Environmental Impact Statement immediately following)
This action lowers the environmental impact of the electrical generating facility in direct proportion to the energy saved.
Typical Environmental Benefits
This best practice was documented from personal interviews and unpublishedenergy studies for major US paper companies. Resources
Not applicable to some “single line” operations which have no installed spares or where recirculation is required for mixing or control.
Specific Applications & Limitations
Typically the investment is minimal, sometimes monitoring and control equipment with a typical cost in the tens of thousands. ROI ranges from 100% to 500%.
Return on Investment
Typical savings ~2,500 hp at $275 per hp-year, annual savings are approximately $688,000. Payback is huge even if the savings are small. Savings are greater if this lowers peak consumption due to utility pricing structure.
Typical Energy Savings
Areas where this action can be applied include:-spare refiners-second agitator in tanks and under-machine-pulpers-aerators in lagoons-recirculation loops-AC/heat in offices at night or weekends
Primary Area/Process
Idle non essential equipment when not in use. Best PracticeDescription

Environmental Impact StatementMW 5 – Idle EquipmentDescription: Many mills have the opportunity to idle non essential equipment when not in use. Typical energy savings of 2,500 hp at $275 per hp-yr equates to $688,000 per year. Savings may be greater if this lowers peak consumption due to utility pricing structure. Typical investments are minimal, sometimes including monitoring and control equipment. Other benefits include increased life and reduced maintenance.
Environmental Considerations: The effect of reduced energy usage on the emissions from an electrical generating facility is difficult to characterize due to the broad range of configurations of power plant and emission equipment. However one can expect that a reduced electrical loading in the field would result in proportional reductions in emissions at the point of generation.The table below illustrates possible emission savings from an electrical generating facility from the 2,500 hp reduction example.Idling non essential equipment should not adversely impact product quality or overall productivity. Environmental regulatory permitting must be considered on an individual basis for each project. A Major-Source review for environmental impact is typically required where productivity is impacted.In Wisconsin, the DNR has indicated that cooperative agreements may be considered for those companies that demonstrate “beyond-compliance performance” under the Green Tier Program. In addition, such ideas as bubble permits may be considered for those companies with multiple business units.
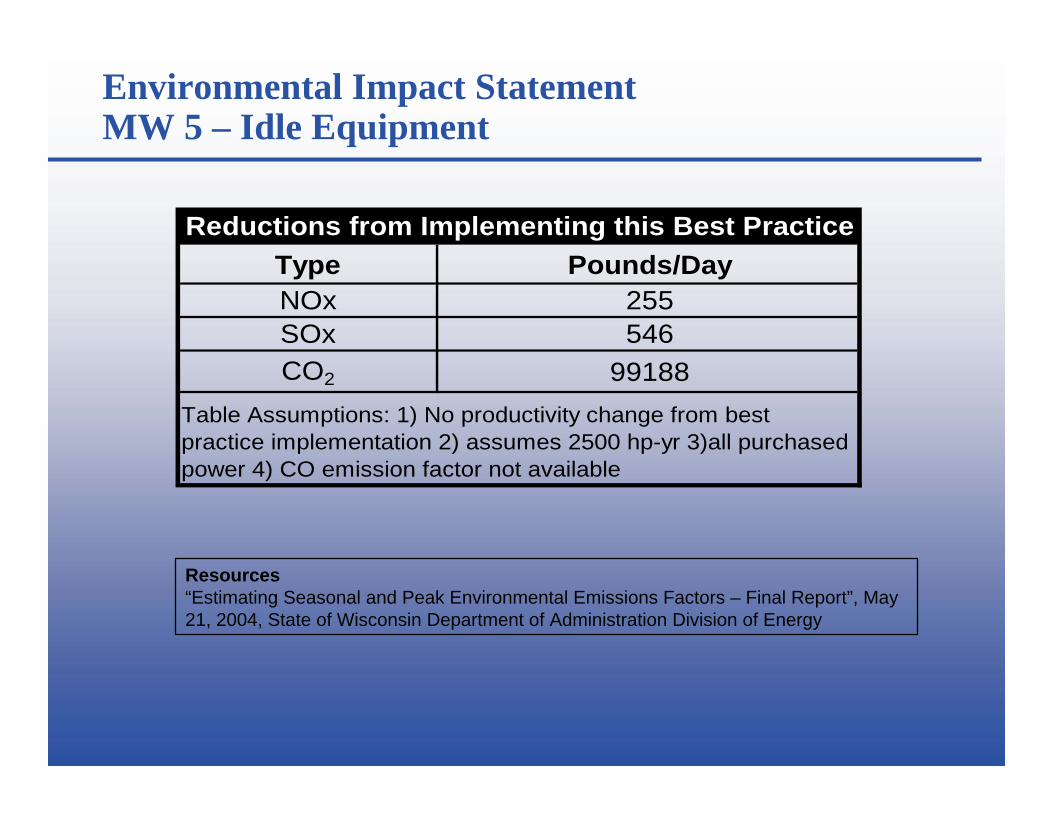
Environmental Impact StatementMW 5 – Idle Equipment
Type Pounds/DayNOx 255SOx 546CO2 99188
Table Assumptions: 1) No productivity change from best practice implementation 2) assumes 2500 hp-yr 3)all purchased power 4) CO emission factor not available
Reductions from Implementing this Best Practice
Resources“Estimating Seasonal and Peak Environmental Emissions Factors – Final Report”, May 21, 2004, State of Wisconsin Department of Administration Division of Energy

MW 9 - Install Secondary and Tertiary Heat Recovery Systems
None, unless the mill is steam or steam-permit limited.Typical Productivity Impact
There is the potential to reduce emissions from steam generating sources by 12%.Typical Environmental Benefits
For one example See: “Energy Reduction at a Kraft Pulp Mill…” by Michael Towers on page 15 of the March 2003 TAPPI Journal. Also see two case histories in the article “Energy Conservation in Kraft Pulp Mills” by Borg and Chandra in the January 1987 issue of PIMAMagazine. Another reference is: “Conserving Energy in the Pulp Mill: A Review of Practical Experiences” by Borg in Pulp and Paper magazine, March, 1986.
Resources
Recovery is most applicable in areas of the mill that have hot exhausts or high heat sources. Specific Applications & Limitations
Selected heat recovery projects typically have a 25% to 200% ROI.Return on Investment
Typical thermal use for a US integrated mill is 25 MMBtu per ton. A 12% savings is 3 MMBtu per ton. At $5.00 per MMBtu that is $15 per foot. For a 1,000 ton per day (tpd) mill this is $15,000 per day or a savings of $5.4 million per year. Published pinch studies show 12% thermal energy savings.
Typical Energy Savings
Typical examples include:-heat from machine hoods-heat from thermo-mechanical pulping (TMP) refiners-heat from boiler exhaust-heat from turbine exhaust
Primary Area/Process
Install a heat exchanger to recover energy from hot sources and exhausts. Use this energy toheat make up air, make up water and process water. Best Practice Description

Environmental Impact StatementMW 9 – Heat Recovery Systems
Description: The installation of a heat recovery system to recover energy from hot sources and exhausts may be used to heat make-up air, make up water and process water streams. Typical energy savings associated with this technology is 12%, or about 3 MMBtu per ton. This equates to a savings of $15,000 per day for a 1,000 ton per day mill. Typical ROI is in the 25% to 200% range.
Environmental Considerations: Steam consumption and overall energy requirements of the paper mill will be reduced in line with the heat recovery system that is installed. As an example, a 12% energy savings at a 1000 ton per day mill would save 3000 MMBtu’s/day.The effects of reduced steam loading on the emissions from a power plant boiler are difficult to characterize due to the broad range of configurations of boilers, turbines and emission equipment. However one can expect that a reduced loading on the boilers would result in proportional reductions in emissions. If the above example were a non-integrated mill the table below demonstrates possible emissions reductions.Reductions would be proportionately about half as much in an integrated pulp and paper/board mill.Though this technology is expected to reduce emissions with no productivity increase, environmental regulatory permitting must be considered on an individual basis. In Wisconsin, the DNR has indicated that cooperative agreements may be considered for those companies that demonstrate “beyond-compliance performance” under the Green Tier Program. In addition, such ideas as bubble permits may be considered for those companies with multiple business units.

Environmental Impact StatementMW 9 – Heat Recovery Systems
Resources“Emission Factor Documentation for AP-42 Section 1.1, Bituminous and Subbituminous Coal Combustion” and Section 1.4 “Natural Gas Combustion”, Office of Air Quality Planning and Standards, U.S.E.P.A, www.epa.govEIA – 1605 Voluntary Emission Reduction of Green House Gases
Item If mill burns100% Coal
If mill burns 100%Natural Gas
Thermal (MMBTU's/day) 3000 3000NOx (#/day) 1602 411SO2 (#/day) 7200 1.8CO (#/day) 27 246CO2 (#/day) 615 351
Reductions from Implementing this Best Practice
Table Assumptions: 1) 1000 ton per day mill 2) no productivity changefrom best practice implementation 3) effects to secondary energy sources are not included.

PM 3 - Use a Dryer Management System(also see Environmental Impact Statement immediately following)
Implementing this technology can result in better quality paper and improved productivity.Typical Productivity Impact
This technology minimizes steam consumed to dry paper thereby decreasing the consumption of fuels.
Typical EnvironmentalBenefits
For more technical information contact Wisconsin Focus on Energy for a copy of their case study: http://www. focusonenergy.comPhone: 800-762-7077There are a number of commercial resources for this technology. Please contact one of the Wisconsin Focus on Energy representatives listed in Appendix C if you need additional information.
Resources
This technology is limited to machines with “can” type dryers and can be expanded to include/integrate dryer section air and heat recovery systems.
Specific Applications & Limitations
Depending on machine size and speed and the package that is purchased, the ROI can range from 40% to 100%.Return on Investment
Conservative estimates in a world class machine have pegged the steam savings at 2,000 to 3,000 lbs per hour. Using a steam generation cost of $5 per 1,000 lbs this equates to financial savings of $70,000 to $100,000 per year.
Typical Energy Savings
This technology is applicable to the dryer section of the paper machine. Primary Area/Process
DMS™ control software is an advanced control system for the dryer section of a paper machine. Supervisory control of all system set points is used to optimize system operation and provide easeof use for the operators.
Best Practice Description

PM 5 - Use a Shoe Press in the Press Section(also see Environmental Impact Statement immediately following)
The reduced amount of steam required translates into less combustion of fuel. Typical Environmental Benefits
For additional information see:“Johnsonburg Mill Installs Single Nip Shoe Press,”Glen Ostle, Paper Age February 2001.There are a number of commercial resources for this technology. Please contact one of theWisconsin Focus on Energy representatives listed in Appendix C if you need additional information.
Resources
The application of shoe presses is limited to new machine installations or major rebuilds of the press section.
Specific Applications & Limitations
The cost of incorporating a shoe press installation during a machine rebuild can be$1,000,000 or higher depending on machine width. Mills that install shoe presses are typically more interested in enhanced sheet properties and productivity than in their potential to save energy. A typical ROI including these factors is in the 20% to 40% range.
Return on Investment
Typical sheet moisture is reduced 2% to 5 % at the exit of the press section, which reduces the steam requirement of the dryer section. Annual financial savings are a function of the type and amount of paper/board being manufactured. Typical annual savings range from $250,000 to more than $1,000,000.
Typical Energy Savings
This technology is applicable to the paper machine.Primary Area/Process
The shoe press is a device that improves the mechanical dewatering of paper or board byextending the dwell time during the pressing operation in the paper machine.
Best Practice Description

Environmental Impact StatementPM 5 – Use a Shoe Press in the Press Section
Description: The shoe press is a device that improves the mechanical dewatering of paper or board by extending the dwell time during the pressing operation in the paper/board machine. Typical moisture levels are reduced 2% to 5% at the exit point, which reduces the steam required in the dryer section. Typical annual savings range from $250,000 to more than $1,000,000 and ROI is in the 20% to 50% range. Sheet properties and overall machine productivity are positively influenced as is energy efficiency.
Environmental Considerations: Steam consumption and overall energy requirements will be reduced in line with the 2 to 5% reduction due to the enhanced efficiency of water removal from the paper/board web by mechanical means in the press section, rather than by evaporation in the dryer section. As an example, an 800 ton per day machine has a typical drying rate of 4.5 MMBTU/ton. Therefore, a 2% moisture reduction from the press section translates to 288 MMBTU/day, and 5% moisture reduction from the press section translates to 684 MMBTU/day.The effects of reduced steam loading on the emissions from a power plant boiler are difficult to characterize due to the broad range of configurations of boilers, turbines and emission equipment. However one can expect that a reduced loading on the boilers would result in proportional reductions in emissions. If the above example were a non-integrated mill the table below demonstrates possible environmental savings. Reductions would be proportionately about half as much in an integrated pulp and paper/board mill.A shoe press offers significant opportunity for productivity improvements on machines that are limited by dryer capacity, which many paper machines are. Higher productivity rates at the paper machine also may require increased capacity of the related support equipment in stock preparation, steam and power generation, and other associated areas. While the increase in productivity made possible by the shoe press may increase the steam loads on the rest of the system, the shoe press savings still offer a net savings in steam on a per ton basis.While this technology is expected to reduce emissions even when no productivity increase will be obtained, environmental regulatory permitting must be considered on an individual basis. In Wisconsin, the DNR has indicated that cooperative agreements may be considered for those companies that demonstrate “beyond-compliance performance” under the Green Tier Program. In addition, such ideas as bubble permits may be considered for those companies with multiple business units.

Environmental Impact StatementPM 5 – Use a Shoe Press in the Press Section
Resources“Johnsonburg Mill Installs Single Nip Shoe Press”, Glen Ostle, Paper Age, February, 2001“New Press Technology for Copy Paper Machine”, Reinhard Leigraf, African Pulp and Paper World, archive 2004“Shoe Presses – The Breakthrough for Board from Recycled Furnish”, Alexander Wasserman and Rudolf Estermann, tappsa.co.za/archive/Journal“Emission Factor Documentation for AP-42 Section 1.1, Bituminous and Subbituminous Coal Combustion”, Office of Air Quality Planning and Standards, U.S.E.P.A, www.epa.gov.EIA – 1605 Voluntary Emission Reduction of Green House Gases
Item If mill burns100% Coal
If mill burns 100%Natural Gas
Thermal (MMBTU's/day) 288 - 684 288 - 684NOx (#/day) 154 - 365 39 -94SO2 (#/day) 691 - 1642 0.17 - 0.41CO (#/day) 2.6 - 6.2 23.6 - 56.1CO2 (#/day) 59.0 - 140.2 33.7 - 80.0
Reductions from Implementing this Best Practice
Table Assumptions: 1) 800 ton per day mill 2) no productivity changefrom best practice implementation 3) effects to secondary energy sources are not included.

SFP 1 - Secondary Fiber High Efficiency Pulper Rotors(also see Environmental Impact Statement immediately following)
Changing the pulper rotor should not impact productivity in either direction.Typical Productivity Impact
Environmental benefits result from less consumption of energy.Typical Environmental Benefits
For information regarding this technology see:“Redesigned Pulper Rotor Offers Energy Savings at Equal Recycled Stock Quality,” John Egan, “Pulp and Paper,” April, 2004.“CFD Builds a More Efficient Pulp Chopper,” Machine Design, 2004.There are a number of commercial resources for this technology. Please contact one of the Wisconsin Focus on Energy representatives listed in Appendix C if you need additional information.
Resources
NoneSpecific Applications & Limitations
This is not a capital-intensive project. Given the fact that rotors are a long-term consumable in the paper mill, the new rotor design can be substituted for conventional design when change outis required. The additional cost is minimal. Estimated ROI >100%.
Return on Investment
Energy savings range from 10% to 30%. If the traditional pulper applies 1 hp/tpd the savingsrange from $6,000 to $18,000 per year.
Typical EnergySavings
This technology can be incorporated in both the secondary fiber processing area as well as on the paper machine.
Primary Area/Process
The application of this technology, metallurgy and machining techniques have resulted in amore energy efficient rotor for pulper applications.
Best PracticeDescription

Environmental Impact StatementSFP 1 – Secondary Fiber High Efficiency Pulper RotorsDescription: Advances in technology, metallurgy and machining techniques have resulted in a more energy efficient rotor for pulper applications. Typical energy savings range from 10 to 30%, and equate to $6,000 to $18,000 per year. Savings may be greater if this lowers peak consumption due to utility pricing structure. This is not a capital-intensive project. The new rotor design can be substituted for the conventional design when a rotor change out is required.
Environmental Considerations: The effect of reduced energy usage on the emissions from an electrical generating facility is difficult to characterize due to the broad range of configurations of power plant and emission equipment. However one can expect that a reduced electrical loading in the field would result in proportional reductions in emissions at the point of generation.The table below illustrates possible emission savings of a pulper producing 800 tpd at 1 hp-d/ton with a savings of 10 and 30 percent.The new pulper rotor design should not adversely impact product quality or overall productivity.Environmental regulatory permitting must be considered on an individual basis for each project. A Major-Source review for environmental impact is typically required where productivity is impacted.In Wisconsin, the DNR has indicated that cooperative agreements may be considered for those companies that demonstrate “beyond-compliance performance” under the Green Tier Program. In addition, such ideas as bubble permits may be considered for those companies with multiple business units.

Environmental Impact StatementSFP 1 – Secondary Fiber High Efficiency Pulper Rotors
Type Pounds/DayNOx 8.1 - 24.5SOx 17.5 - 52.4CO2 3174 - 9522
Table Assumptions: 1) 800 ton per day 2) No productivity change from best practice implementation 3) all purchased power 4)CO emission factor not available
Reductions from Implementing this Best Practice
Resources“Estimating Seasonal and Peak Environmental Emissions Factors – Final Report”, May 21, 2004, State of Wisconsin Department of Administration Division of Energy EIA – 1605 Voluntary Emission Reduction of Green House Gases

Summary
Develop reliable benchmarksPerform one or more gap analysisDevelop mill and departmental goalsIdentify relevant best practicesDevelop a mill wide planImplement plan from the Mill Manager levelRoutinely monitor progress

Pulp & Paper Best Practices Team Member Contact Information
John NicolIndustrial Program ManagerWisconsin Focus on EnergySAIC5609 Medical Circle, Suite 201Madison, WI [email protected]
Brent EnglishDirector - Commercialization and GrantsCenter for Technology Transfer8309 Greenway Blvd.Suite 220Madison, WI [email protected]
David BorowskiPresidentD&S Design and Engineering Po Box 12773Green Bay, WI [email protected]
Benjamin ThorpPresidentBenjamin A. Thorp Inc.3800 Cogbill RoadRichmond, VA [email protected]
Jerry AueForest Products Energy EngineerWisconsin Focus on EnergyAue Energy Consulting314 White Oak AvenuePlover, WI [email protected]
Craig ScheppEnergy AdvisorWisconsin Focus on EnergySAIC5609 Medical Circle, Suite 201Madison, WI [email protected]
Masood AkhtarPresidentCenter for Technology Transfer8309 Greenway Blvd.Suite 220Madison, WI [email protected]