Embed Size (px)
Citation preview

Usabilidad y Experiencia de Usuario
151

Potential Individual Differences Regarding Automation
Effects in Automated Driving Moritz Körber
Institute of Ergonomics, TU München Boltzmannstraße 15
87547 Garching +49 89 289 15376
Klaus Bengler Institute of Ergonomics, TU München
Boltzmannstraße 15 87547 Garching
+49 89 289 15400
ABSTRACT
Currently, the legal, technical and psychological regulatory
framework of automated driving is being discussed by car
manufacturers and researchers to guarantee its safe and smooth
introduction into the traffic system. This discussion is
accompanied by plenty of studies that seek to study the human
side of the interaction with automation and to expose potential
problems and hazards. Past research from other domains has
shown that the studies’ subjects differ considerably, for example
in their abilities (e.g. ability to monitor) or in their attitudes (e.g.
trust in automation). In this work we discuss potential individual
differences – classified into dispositions, stable traits, operator
state, attitudes and demographics – that could influence the
human performance in interactions with automation. Where they
exist, valid methods of measurement are referenced. The review
closes with a deduction of potential risk groups that were inferred
based on the reviewed literature.
Categories and Subject Descriptors
H.1.2 [Information Systems]: User/Machine Systems – Human
factors.
General Terms
Performance, Experimentation, Human Factors.
Keywords
Individual differences, automation, human performance.
1. INTRODUCTION Technological progress in advanced driving assistance systems
(ADAS; [15]) nowadays provides the ability to let the
longitudinal control (e.g. Adaptive Cruise Control; ACC) as well
as the lateral control (e.g. Lane Keeping Assistant) be carried out
by these systems [20]. Currently, advances in sensory technology
and data processing make it possible to remove the driver
completely from the driving task in such a way that, contrary to
manual driving, a vehicle automation system fully operates the
vehicle. In case of partial automation, the driver still has to
monitor the automation throughout all the time. In case of highly
automated driving, the driver only has to pay attention and take
back control if it is requested by the automation (a so-called take
over request; TOR), caused for example by a system failure [17].
The goals of introducing automation are to reduce the driver’s
workload [72], and to increase traffic safety [36, 56] and comfort
[73]. Automation has already been an energetically discussed
topic in other domains like aviation [47, 84], and multiple authors
have highlighted the potential risks that accompany the benefits
[3]. In order to minimize these risks, many researchers are
currently conducting studies to analyze human performance in
handling a vehicle automation system, and to expose potentially
dangerous situations [16, 21]. If a study is to produce valid
representative results, a representative sample must be used.
Conclusions from current studies on vehicle automation are
therefore limited, firstly, because they in many cases use a specific
group participants (e.g. employees, test drivers, students) and
secondly, because they concentrate on means and the average
population. It is crucial to also consider the distribution
boundaries in order to guarantee safe use for the whole
population. For example, instead of the mean reaction time, Sohn
and Stepleman [71] recommend using 85th or 99th percentile data
in order to give a suggestion for a safe headway distance. This
paper lists individual differences that could potentially influence
human performance in interactions with vehicle automation and
therefore should be considered in the process of choosing
participants, inferring results and discussing limitations.
2. POTENTIAL INDIVIDUAL
DIFFERENCES The following section is structured according to dispositional
factors, stable personality traits and behavior patterns, current
operator state, attitudes and demographic factors. Thereby, we
take into consideration the current situation and condition of a
participant (states, attitudes) as well as stable factors that are
distinctive for the participant and do not change or vary much.
There are further relevant influence factors, e.g. the participant’s
instruction to an experiment, that do not directly trace back to
individual differences and therefore are not being discussed in this
paper, but still remain important.
2.1 Dispositional Factors A disposition refers to a person’s innate natural abilities that are
seen as more or less unaffected by learning. One of the most
crucial dispositions in traffic safety is the individual reaction time
to events. Even if the driving task is carried out by a vehicle
automation system, reaction times still remain important: If the
automation reaches a system limit or fails, the driver is required to
quickly take back control as a response to a take over request
(TOR; e.g. an earcon) by the vehicle. Manual driving requires the
driver’s attention constantly on the road, but automated driving
makes it possible for the driver to engage himself in other
activities like reading the newspaper or playing a video game and
Permission to make digital or hard copies of all or part of this work for
personal or classroom use is granted without fee provided that copies are
not made or distributed for profit or commercial advantage and that
copies bear this notice and the full citation on the first page. To copy
otherwise, or republish, to post on servers or to redistribute to lists
requires prior specific permission and/or a fee.
Conference’10, Month 1–2, 2010, City, State, Country.
Copyright 2010 ACM 1-58113-000-0/00/0010 …$15.00.
152

this opportunity is used increasingly with increasing level of
automation [6]. Hence, if a TOR is signaled, the driver’s attention
is probably focused on a non-driving activity, and because of that
an individual’s ability to detect the TOR signal outside of his
attentional focus (i.e. spotlight of attention) and then to react
adequately and quick is crucial for a fast takeover. The
combination of those two abilities is called peripheral detection.
Its operationalization, the peripheral detection task [23], could be
used to assess how fast an individual can naturally react to a TOR
signal independent of the experimental setup.
When the driver reacts to the TOR signal, he then quickly has to
refocus on the traffic situation, scan the vehicle’s environment
and comprehend what is going on – i.e. gain situation awareness
[11]. This process is determined by the individual’s perceptual
speed [34] and the speed of information processing [13]. In
addition, there is evidence of differences in the ability to switch
between tasks [44] which could be an important determinant of
takeover quality too. Tests for these constructs [13, 34, 83] could
be used to remove bias in the data.
In the case of partial automation, the driver still has to keep the
automation under surveillance and takes the passive role of a
system monitor. Individual differences in a person’s ability to
monitor and sustain attention to rare and randomly appearing
stimuli, also known as vigilance, have been the focus of research
for a long time [35]. A decrement in signal detection can be found
from a 30-min watch, a time frame that is also relevant for
automated highway drives. Variability in monitoring ability
becomes apparent in the sensitivity to target stimuli, in the
reaction times to them, in the number of false alarms and in the
decrement of these indicators over time. Monitoring is perceived
as stressful and hard work [81] because one has to use attentional
resources to remain focused despite a low stimulus rate: The task
is monotonous and not demanding, effort has to be spent to stay
alert and on-task, also known as state-related effort [9]. Therefore,
if a driver uses partial automation for a longer period of time, his
attentional resources could more or less slowly diminish, and
eventually his reaction times could increase and sensitivity could
decrease. Temple and colleagues [75] introduced a 12-minute
short vigilance test (SVT) that can induce the vigilance decrement
within a very short time. Test performance could be a relevant
predictor of a person’s ability to stay attentive in partially
automated driving.
2.2 Traits Stable personality traits determine behavior patterns and explain
individual differences in responses to a certain situation, condition
or task characteristic as a moderator variable. As already
mentioned, in the case of partial automation , the driver takes on a
passive monitor role confronted with low event frequency and
almost no novel stimulation, which leads to states of monotony
and boredom [74]. Mindlessness theory [58] proposes that in such
states, the mind starts to wander and thoughts and inner
monologues occur that are unrelated to the task [18, 24]. The
occupation with thoughts leads to more variability in response
times [64] and to longer response times to events [86]. The
subject is lost in thought and takes longer to detect critical
situations, to respond to events and to regain situation awareness.
Individuals differ in their ability to concentrate, to sustain their
attention and to stay on task [65]. For example, people with a high
propensity to daydream [2] perform worse in vigilance tasks.
Scores of the correspondent questionnaire developed by Singer
and Antrobus [66] could therefore be a promising covariate for
studies with monotonous conditions. Mrazek and colleagues [45]
recently published and validated a trait-level questionnaire on
mind wandering, the Mind-Wandering Questionnaire (MWQ). 5
items measure the extent to which a person is prone to the
interruption of task focus by task-unrelated thought (TUT; [70]),
which is seen to be responsible for attentional lapses in response
times during driving [86]. Broadbent and Colleagues [4] have
developed a related questionnaire, the Cognitive Failures
Questionnaire (CFQ), a self-report inventory that focuses instead
on lapses of attention and slips of action [14]. Since monitoring
the system requires a person to stay attentive for considerable
uninterrupted periods of time, this could be a promising branch
for research.
Research on vigilance tasks also shows that these tasks are
perceived as mentally straining and distressing [81]. Therefore it
is important to have a look at how individuals deal with the
imposed workload and stress. The Coping Inventories for Task
Stress (CITS; [38]) distinguishes between three coping strategies:
task-focused coping, emotion-focused coping and avoidance.
Task-focus coping represents the strategy of creating a plan to
solve the task in the best way and finding a way of coping within
the task. Emotion-focused coping tries to reduce the task-induced
stress via positive emotions and positive thinking. Avoidance
represents the strategy of negating the importance of the task and
distracting oneself from the task. Research has shown [65] that
individuals who rely on task-focus coping perform better in
vigilance tasks, and individuals with avoidance coping perform
worse. This relationship could also transfer to automated driving.
Monitoring tasks are generally seen as boring [62], and boredom
leads to less engagement with the task and increased engagement
with other activities or mind wandering [24]. Farmer and
Sundberg [12] pointed out that there are individual differences in
how fast individuals become bored. They introduce the Boredom
Proneness Scale, a questionnaire that measures how much
stimulation is enough to keep a person from becoming bored. In
their model of fatigue, May and Baldwin [41] remark that the
causes of negative effects of fatigue can be categorized in active
task-related fatigue, passive task-related fatigue and sleep-related
fatigue. They state that monotonous driving, underload conditions
and automated driving promote passive task-related fatigue.
Matthews and colleagues [40] published the Driver Stress
Inventory (DSI), a questionnaire that measures – in addition to
aggression, dislike of driving, hazard monitoring, and thrill-
seeking – a subject’s proneness to fatigue. The items include
ratings about changes in boredom, attention and vision that appear
due to a long drive. If a study includes a long or very monotonous
drive and possibly even a high level of automation, it could be
useful to use this questionnaire as a covariate. Less automation-
specific, but still potentially relevant is the personality trait of
preserving task motivation and energetic arousal even during
boring tasks, which can be controlled by use of the Dundee Stress
State Questionnaire (DSSQ, [39]). This questionnaire contains a
factor called task engagement that quantifies a person’s ability to
stay motivated, energetically aroused and concentrated, which is
positively correlated to vigilance performance [65].
Currently, to our knowledge, there is no naturalistic driving study
published about how much individuals can really free themselves
from monitoring the automation even in a highly automated drive.
It is possible that the driver, especially in the beginning, still
monitors the automation the whole drive because of a lack of trust
153

or experience. Therefore, these results could be important not only
for partial automation but also for high automation.
2.3 Driver State Studies on automated driving often use reaction times to the TOR
and visual attention as dependent variables in their experimental
design (e.g. [20]). Goel and colleagues [19] have shown that
many factors relevant to driving performance, such as reaction
times and attention, are affected by sleep deprivation and
resulting sleepiness, which can also be seen in real accident data
[7]. Evidence like the post-lunch dip in performance caused by
circadian rhythm [57] suggests that sleepiness may also play a
role in studies that do not especially focus on it. The Karolinska
Sleepiness Scale [1] is a one-item questionnaire that validly
measures current sleepiness and is sensitive to deterioration in
driving performance due to sleepiness [52]. A related state
questionnaire is the Epworth Sleepiness Scale [29] which is a
measure of general propensity toward daytime sleepiness. The
passive role in an automated drive and the seated body position
represent a situation that could induce daytime sleepiness. Indeed,
people with a high propensity show more micro-sleeps in a
driving simulator [43], and the questionnaire scores are positively
correlated to reported nodding off in real traffic [78].
2.4 Attitudes One of the best-known problems in interacting with automation is
complacency, a strategy of allocating attention away from an
automated task to another concurrent task [50]. In situations of
high workload and concurrent tasks, the operator relies on the
automation, shifts his attention away, and failures in these
functions are then not detected. The tendency to complacency is
influenced by automation reliability [48], but also by the operator
himself, for example his expertise with the system [67],
propensity to attentional lapses [53] and individual complacency
potential [69]. An individual’s vulnerability can be assessed by
the Complacency-Potential Rating Scale [68]. In addition to that,
individual trust in automation provides a potential for
complacency, but complacency is not a direct consequence of it.
Trust in automation represents the personal attitude of how much
one relies on the automation and of how much one thinks that the
automation is beneficial [33]. This attitude determines the
operator’s reliance on automation and his attentional strategy, e.g.
how much he gets involved in non-driving activities. Merritt and
Ilgen [42] reported that besides actual objective automated
machine characteristics (e.g. reliability), the perception of an
automated machine has a significant impact on the trust in an
automated machine. Furthermore, the subjective perception is in
turn influenced by the operator’s personality and propensity to
trust. The negative effect of automation failures on trust in
automation were also dependent on the subjects’ general
propensity to trust, another indicator of the importance of
personality in human-automation interaction. In another study,
Parasuraman and colleagues [48] show that constant reliability of
an automation leads to lower failure detection rates, and this
lowered rate is probably caused by over-reliance, i.e. too much
trust in automation. Detection of hazardous situations can also
suffer if the driver over-trusts the automation, i.e. if he relies on
the automation beyond the automation’s abilities and does not
maintain an appropriate situation awareness to respond adequately
and in time. For example, Damböck [8] found that with an
increasing level of automation, visual attention is increasingly
relocated away from the driving scene to a secondary task.
Beyond that, performance measures also exist: overreliance leads
to later braking with ACC, [54] and trust calibrated to the
system’s abilities leads to better takeover reactions in automated
driving [25]. To sum up, trust in automation and complacency
determine attention allocation and thereby the maintenance of
situation awareness, which is crucial for being ready to take over
vehicle control and to detect system failures.
2.5 Demographics and Other Factors The impairments that come with increasing age have been noted
in various articles and are relevant for traffic safety: the
perception of hazards is slowed down [27], reaction times to
hazards are longer [82], the information processing speed is
slower [79], the visual search is altered [37], older drivers make
more mistakes in estimating the speed of other vehicles [63], they
take longer to switch tasks [32], and they have problems in novel
situations and with fast decisions [22]. In addition, their
monitoring ability is lowered: They detect fewer signals and
produce more false alarms in a vigilance test [10], and their
vigilance decrement is greater [49]. Furthermore, their interaction
with automation is different because they perceive automation
reliability differently and therefore differ in how much they trust
in automation [61]. It is therefore very likely that the ability to
monitor an automated vehicle and the ability to take over and
respond appropriately within seconds is impaired for older people.
Petermann-Stock and colleagues [51] found no significant
difference in the reaction time to a TOR signal between younger
(25–35 years) and older (50–70 years) drivers although the
difference was up to 1s in the high workload condition. The
degree of the impairments caused by aging is highly variable [28]
and accordingly the standard deviation in the study’s sample was
very high for the older driver group, which could be the reason for
the non-significant results. Also, no immediate reaction by the
participants was necessary, because the take over situation was
rather uncritical. It is possible that the drivers took their time to
comfortably take over and this could have ruled out any
differences in reaction times. Thus it is not certain whether
situations that can be solved by young drivers can also be solved
by older drivers.
Although it is common practice to collect information about the
subject’s driving experience – e.g. to exclude novice drivers from
the sample – little attention is paid to expertise with ADAS and
automation. As already mentioned, expertise with a system
promotes the tendency toward complacent behavior [67]; it also
influences risk perception [26, 55] and influences trust in a system
[60]. For this reason, not only driving experience, but also
experience with ADAS and automation should be collected by
means of a questionnaire.
A disease that is relevant to monitoring automation is attention
deficit hyperactivity disorder (ADHD) since patients with that
disorder are greatly vulnerable to distraction, tend to wander with
their thoughts and have trouble remaining calmly in a single
position. Accordingly, they perform worse in vigilance tasks [85].
The inattentiveness may be caused by deficits in central executive
processing [31], particularly deficits in working memory that have
already been associated with impairment in vigilance performance
[5]. Symptoms of ADHD can still be prevalent in personality
traits in adulthood without reaching a pathological level [46]. This
can be seen in studies that found a relationship between
personality traits like extraversion or impulsivity and impairment
in vigilance performance [30, 59, 76]. In addition, monotonous,
154

long-distance driving leads to a greater decrease in vigilance and
increase in fatigue for individuals who score high on extraversion
and sensation-seeking [77, 80]. Neuropsychological tests that are
sensitive for ADHD, for example for subtests for working memory
[83], could therefore exhibit predictive validity.
Table 1. Overview of the mentioned potential individual
differences.
Category Relevant Constructs
Dispositional Factors
Individual reaction time;
peripheral detection;
perceptual speed; speed of
information processing; ability
to switch between tasks;
vigilance performance.
Traits
Propensity to daydream/mind
wandering/attentional lapses;
coping strategy; boredom
proneness; task engagement.
Driver State
Prior night sleep/sleep
deprivation; current sleepiness;
circadian rhythm; daytime
sleepiness.
Attitudes Complacency-potential, trust
in automation.
Demographics and Other
Factors
Age; expertise with ADAS and
automation; ADHD; working
memory capacity.
3. CONCLUSION In this article, we reviewed literature on potential individual
differences in interaction with vehicle automation. It became
evident that the participant’s age, because of its multiple and well-
studied accompanied impairments, is a major influence factor:
slower reaction times and slower information processing lead to a
deteriorated ability to respond to critical traffic situations and
TORs. Another relevant group is formed by individuals who get
bored easily, need a lot of stimulation to stay on task and tend to
solve this boredom or monotony with mind wandering and
distractive thoughts or activities. Beyond that, individual
strategies of attention allocation, and the degree of trust in
automation determine how drivers interact with the automation.
Future studies could, first of all, empirically estimate effect sizes
of the mentioned constructs in the interaction with automation. In
addition, it is necessary to examine the relationships between the
mentioned factors and quantitatively compare their effects on
operating a vehicle automation. Besides that, this article is
exclusively focused on individual differences. There are other
factors outside of this focus, e.g. the effects of instruction or of
training that are also relevant for the interaction with automation
and should for sure also be considered for discussion and further
empirical research. Ultimately, more naturalistic driving studies
have to be conducted in order to determine the actual
interrelationship of automated driving on participant’s subjective
state.
4. References [1] Åkerstedt, T. and Gillberg, M. 1990. Subjective and
Objective Sleepiness in the Active Individual. Int J
Neurosci 52, 1-2, 29–37.
[2] Antrobus, J. S., Coleman, R., and Singer, J. L. 1967.
Signal-Detection Performance by Subjects Differing in
Predisposition to Daydreaming. Journal of Consulting
Psychology 31, 5, 487–491.
[3] Bainbridge, L. 1983. Ironies of automation. Automatica 19,
6, 775–779.
[4] Broadbent, D. E., Cooper, P. F., FitzGerald, P., and Parkes,
K. R. 1982. The Cognitive Failures Questionnaire (CFQ)
and its correlates. Br J Clin Psychol 21 (Pt 1), 1–16.
[5] Caggiano, D. M. and Parasuraman, R. 2004. The role of
memory representation in the vigilance decrement.
Psychonomic Bulletin & Review 11, 5, 932–937.
[6] Carsten, O., Lai, F. C. H., Barnard, Y., Jamson, A. H., and
Merat, N. 2012. Control Task Substitution in
Semiautomated Driving: Does It Matter What Aspects Are
Automated? Human Factors: The Journal of the Human
Factors and Ergonomics Society 54, 5, 747–761.
[7] Connor, J., Whitlock, G., Norton, R., and Jackson, R. 2001.
The role of driver sleepiness in car crashes: a systematic
review of epidemiological studies. Accident Analysis &
Prevention 33, 1, 31–41.
[8] Damböck, D. 2013. Automationseffekte im Fahrzeug – von
der Reaktion zur Übernahme. Dissertation, Technische
Universität München.
[9] De Waard, D. 1996. The Measurement of Drivers’ Mental
Workload. Doctoral, University of Groningen.
[10] Deaton, J. E. and Parasuraman, R. 1993. Sensory and
Cognitive Vigilance: Effects of Age on Performance and
Subjective Workload. Human Performance 6, 1, 71–97.
[11] Endsley, M. R. 1995. Measurement of Situation Awareness
in Dynamic Systems. hum factors 37, 1, 65–84.
[12] Farmer, R. and Sundberg, N. D. 1986. Boredom Proneness
-The Development and Correlates of a New Scale. Journal
of Personality Assessment 50, 1, 4–17.
[13] Finkel, D., Reynolds, C. A., McArdle, J. J., and Pedersen,
N. L. 2007. Age changes in processing speed as a leading
indicator of cognitive aging. Psychology and Aging 22, 3,
558–568.
[14] Finomore, V. S., Matthews, G., Shaw, T. H., and Warm, J.
S. 2009. Predicting vigilance: A fresh look at an old
problem. TERG 52, 7, 791–808.
[15] Flemisch, F. O., Bengler, K., Bubb, H., Winner, H., and
Bruder, R. 2014. Towards cooperative guidance and control
of highly automated vehicles: H-Mode and Conduct-by-
Wire. Ergonomics 57, 3, 343–360.
[16] Funke, G., Matthews, G., Warm, J. S., and Emo, A. K.
2007. Vehicle automation: a remedy for driver stress?
Ergonomics 50, 8, 1302–1323.
[17] Gasser, T. M. 2012. Rechtsfolgen zunehmender
Fahrzeugautomatisierung. Gemeinsamer Schlussbericht
der Projektgruppe F 83.
[18] Giambra, L. M. 1989. Task-unrelated thought frequency as
a function of age: A laboratory study. Psychology and
Aging 4, 2, 136–143.
[19] Goel, N., Rao, H., Durmer, J., and Dinges, D. 2009.
Neurocognitive Consequences of Sleep Deprivation. Semin
Neurol 29, 04, 320–339.
155

[20] Gold, C., Damböck, D., Lorenz, L., and Bengler, K. 2013.
"Take over!" How long does it take to get the driver back
into the loop? Proceedings of the Human Factors and
Ergonomics Society Annual Meeting 57, 1, 1938–1942.
[21] Gold, C., Lorenz, L., Damböck, D., and Bengler, K. 2013.
Partially Automated Driving as a Fallback Level of High
Automation. 6. Tagung Fahrerassistenzsysteme. Der Weg
zum automatischen Fahren.
[22] Guerrier, J. H., Manivannan, P., and Nair, S. N. 1999. The
role of working memory, field dependence, visual search,
and reaction time in the left turn performance of older
female drivers. Applied Ergonomics 30, 2, 109–119.
[23] Harms, L. and Patten, C. 2003. Peripheral detection as a
measure of driver distraction. A study of memory-based
versus system-based navigation in a built-up area.
Transportation Research Part F: Traffic Psychology and
Behaviour 6, 1, 23–36.
[24] He, J., Becic, E., Lee, Y.-C., and McCarley, J. S. 2011.
Mind Wandering Behind the Wheel: Performance and
Oculomotor Correlates. Human Factors: The Journal of the
Human Factors and Ergonomics Society 53, 1, 13–21.
[25] Helldin, T., Falkman, G., Riveiro, M., and Davidsson, S.
2013. Presenting system uncertainty in automotive UIs for
supporting trust calibration in autonomous driving. In
Proceedings of the 5th International Conference on
Automotive User Interfaces and Interactive Vehicular
Applications. ACM, New York, NY, 210–217.
[26] Hoedemaeker, M. and Brookhuis, K. A. 1998. Behavioural
adaptation to driving with an adaptive cruise control
(ACC). Transportation Research Part F: Traffic
Psychology and Behaviour 1, 2, 95–106.
[27] Horswill, M. S., Marrington, S. A., McCullough, C. M.,
Wood, J., Pachana, N. A., McWilliam, J., and Raikos, M.
K. 2008. The hazard perception ability of older drivers. J
Gerontol B Psychol Sci Soc Sci 63, 4, P212-P218.
[28] Hultsch, D. F., MacDonald, S. W. S., and Dixon, R. A.
2002. Variability in Reaction Time Performance of
Younger and Older Adults. The Journals of Gerontology
Series B: Psychological Sciences and Social Sciences 57, 2,
P101.
[29] Johns, M. W. 1991. A new method for measuring daytime
sleepiness: the Epworth sleepiness scale. Sleep 14, 6, 540–
545.
[30] Koelega, H. S. 1992. Extraversion and vigilance
performance: 30 years of inconsistencies. Psychol Bull 112,
2, 239–258.
[31] Kofler, M. J., Rapport, M. D., Bolden, J., Sarver, D. E., and
Raiker, J. S. 2010. ADHD and Working Memory: The
Impact of Central Executive Deficits and Exceeding
Storage/Rehearsal Capacity on Observed Inattentive
Behavior. J Abnorm Child Psychol 38, 2, 149–161.
[32] Kray, J. and Lindenberger, U. 2000. Adult age differences
in task switching. Psychology and Aging 15, 1, 126–147.
[33] Lee, J. D. and See, K. A. 2004. Trust in Automation:
Designing for Appropriate Reliance. Human Factors: The
Journal of the Human Factors and Ergonomics Society 46,
1, 50–80.
[34] Lövdén, M., Ghisletta, P., and Lindenberger, U. 2005.
Social Participation Attenuates Decline in Perceptual Speed
in Old and Very Old Age. Psychology and Aging 20, 3,
423–434.
[35] Mackworth, N. H. 1948. The breakdown of vigilance
durning prolonged visual search. Quarterly Journal of
Experimental Psychology 1, 1, 6–21.
[36] Makishita, H. and Matsunaga, K. 2008. Differences of
drivers’ reaction times according to age and mental
workload. Accident Analysis & Prevention 40, 2, 567–575.
[37] Maltz, M. and Shinar, D. 1999. Eye movements of younger
and older drivers. Hum Factors 41, 1, 15–25.
[38] Matthews, G. and Campbell, S. E. 1998. Task-Induced
Stress and Individual Differences in Coping. Proceedings
of the Human Factors and Ergonomics Society Annual
Meeting 42, 11, 821–825.
[39] Matthews, G. and Desmond, P. A. 2002. Task-induced
fatigue states and simulated driving performance. Q J Exp
Psychol A 55, 2, 659–686.
[40] Matthews, G., Desmond, P. A., Joyner, L. A., Carcary, B.,
and Gilliland, K. 1997. A comprehensive questionnaire
measure of driver stress and affect. In Traffic and transport
psychology. Theory and application, T. Rothengatter and
V. Carbonell, Eds. Pergamon, Amsterdam [u.a.], 317–324.
[41] May, J. F. and Baldwin, C. L. 2009. Driver fatigue: The
importance of identifying causal factors of fatigue when
considering detection and countermeasure technologies.
Transportation Research Part F: Traffic Psychology and
Behaviour 12, 3, 218–224.
[42] Merritt, S. M. and Ilgen, D. R. 2008. Not All Trust Is
Created Equal: Dispositional and History-Based Trust in
Human-Automation Interactions. hum factors 50, 2, 194–
210.
[43] Moller, H. J., Kayumov, L., Bulmash, E. L., Shapiro, C. M.,
and Kennedy, S. H. 2005. Simulator Performance Vs.
Neurophysiologic Monitoring: Which Is More Relevant To
Assess Driving Impairment? In Proceedings of the 3rd
International Driving Symposium on Human Factors in
Driver Assessment, Training, and Vehicle Design. Driving
assessment 2005 : Samoset Resort on the Ocean, Rockport,
Maine, USA, June 27-30, 2005. University of Iowa, Public
Policy Center, Iowa City, Iowa, 210–217.
[44] Monsell, S. 2003. Task switching. Trends in Cognitive
Sciences 7, 3, 134–140.
[45] Mrazek, M. D., Phillips, D. T., Franklin, M. S., Broadway,
J. M., and Schooler, J. W. 2013. Young and restless:
validation of the Mind-Wandering Questionnaire (MWQ)
reveals disruptive impact of mind-wandering for youth.
Front. Psychol. 4.
[46] Nigg, J. T., John, O. P., Blaskey, L. G., Huang-Pollock, C.
L., Willcutt, E. G., Hinshaw, S. P., and Pennington, B.
2002. Big five dimensions and ADHD symptoms: links
between personality traits and clinical symptoms. J Pers
Soc Psychol 83, 2, 451–469.
[47] Norman, D. A. 1990. The 'problem' with automation:
inappropriate feedback and interaction, not 'over-
automation'. Philos. Trans. R. Soc. Lond., B, Biol. Sci. 327,
1241, 585–593.
[48] Parasuraman, R., Molloy, R., and Singh, I. L. 1993.
Performance Consequences of Automation-Induced
'Complacency'. The International Journal of Aviation
Psychology 3, 1, 1–23.
[49] Parasuraman, R., Nestor, P. G., and Greenwood, P. 1989.
Sustained-attention capacity in young and older adults.
Psychology and Aging 4, 3, 339–345.
[50] Parasuraman, R., Sheridan, T. B., and Wickens, C. 2008.
Situation Awareness, Mental Workload, and Trust in
156

Automation: Viable, Empirically Supported Cognitive
Engineering Constructs. J Cogn Engng Dec Making 2, 2,
140–160.
[51] Petermann-Stock, I., Hackenberg, L., Muhr, T., and Mergl,
C. 2013. Wie lange braucht der Fahrer – eine Analyse zu
Übernahmezeiten aus verschiedenen Nebentätigkeiten
während einer hochautomatisierten Staufahrt. In 6. Tagung
Fahrerassistenzsysteme. Der Weg zum automatischen
Fahren. TÜV SÜD Akademie GmbH.
[52] Philip, P., Sagaspe, P., Taillard, J., Valtat, C., Moore, N.,
Åkerstedt, T., Charles, A., and Bioulac, B. 2005. Fatigue,
sleepiness, and performance in simulated versus real driving
conditions. Sleep 28, 12, 1511–1516.
[53] Prinzel, Lawrence J., III, DeVries, H., Freeman, F. G., and
Mikulka, P. 2001. Examination of Automation-Induced
Complacency and Individual Difference Variates. NASA
Langley Research Center, Hampton, VA.
[54] Rajaonah, B., Anceaux, F., and Vienne, F. 2006. Trust and
the use of adaptive cruise control: a study of a cut-in
situation. Cognition,Technology & Work 8, 2, 146–155.
[55] Rajaonah, B., Tricot, N., Anceaux, F., and Millot, P. 2008.
The role of intervening variables in driver–ACC
cooperation. International Journal of Human-Computer
Studies 66, 3, 185–197.
[56] Recarte, M. A. and Nunes, L. M. 2003. Mental workload
while driving: Effects on visual search, discrimination, and
decision making. Journal of Experimental Psychology:
Applied 9, 2, 119–137.
[57] Reyner, L. A., Wells, S. J., Mortlock, V., and Horne, J. A.
2012. ‘Post-lunch’ sleepiness during prolonged,
monotonous driving — Effects of meal size. Physiology &
Behavior 105, 4, 1088–1091.
[58] Robertson, I. H., Manly, T., Andrade, J., Baddeley, B. T.,
and Yiend, J. 1997. `Oops!': Performance correlates of
everyday attentional failures in traumatic brain injured and
normal subjects. Neuropsychologia 35, 6, 747–758.
[59] Rose, C. L., Murphy, L. B., Byard, L., and Nikzad, K.
2002. The role of the Big Five personality factors in
vigilance performance and workload. Eur. J. Pers. 16, 3,
185–200.
[60] Rudin-Brown, C. M. and Parker, H. A. 2004. Behavioural
adaptation to adaptive cruise control (ACC): implications
for preventive strategies. Transportation Research Part F:
Traffic Psychology and Behaviour 7, 2, 59–76.
[61] Sanchez, J., Fisk, A. D., and Rogers, W. A. 2004.
Reliability and Age-Related Effects on Trust and Reliance
of a Decision Support Aid. Proceedings of the Human
Factors and Ergonomics Society Annual Meeting 48, 3,
586–589.
[62] Scerbo, M. W. 1998. What's so boring about vigilance? In
Viewing psychology as a whole: The integrative science of
William N. Dember, R. R. Hoffman, M. F. Sherrick and J.
S. Warm, Eds. American Psychological Association,
Washington, 145–166.
[63] Scialfa, C. T., Guzy, L. T., Leibowitz, H. W., Garvey, P.
M., and Tyrrell, R. A. 1991. Age differences in estimating
vehicle velocity. Psychology and Aging 6, 1, 60–66.
[64] Seli, P., Cheyne, J. A., and Smilek, D. 2013. Wandering
minds and wavering rhythms: Linking mind wandering and
behavioral variability. Journal of Experimental Psychology:
Human Perception and Performance 39, 1, 1–5.
[65] Shaw, T. H., Matthews, G., Warm, J. S., Finomore, V. S.,
Silverman, L., and Costa, P. T. 2010. Individual differences
in vigilance: Personality, ability and states of stress. Journal
of Research in Personality 44, 3, 297–308.
[66] Singer, J. and Antrobus, J. S. 1972. Daydreaming, imaginal
processes, and personality: A normative study. In The
function and nature of imagery, P. W. Sheehan and J. S.
Antrobus, Eds. Academic Press, New York.
[67] Singh, I. L., Molloy, R., Mouloua, M., Deaton, J., and
Parasuraman, R. 1998. Cognitive ergonomics of cockpit
automation. In Human cognition. A multidisciplinary
perspective, I. Singh and R. Parasuraman, Eds. Sage
Publications, New Delhi, Thousand Oaks, Calif, 242–253.
[68] Singh, I. L., Molloy, R., and Parasuraman, R. 1993.
Automation- Induced "Complacency": Development of the
Complacency-Potential Rating Scale. The International
Journal of Aviation Psychology 3, 2, 111–122.
[69] Singh, I. L., Molloy, R., and Parasuraman, R. 1993.
Individual Differences in Monitoring Failures of
Automation. The Journal of General Psychology 120, 3,
357–373.
[70] Smallwood, J. and Schooler, J. W. 2006. The restless mind.
Psychological Bulletin 132, 6, 946–958.
[71] Sohn, S. Y. and Stepleman, R. 1998. Meta-analysis on total
braking time. Ergonomics 41, 8, 1129–1140.
[72] Stanton, N. A. and Young, M. S. 1998. Vehicle automation
and driving performance. Ergonomics 41, 7, 1014–1028.
[73] Stanton, N. A. and Young, M. S. 2005. Driver behaviour
with adaptive cruise control. Ergonomics 48, 10, 1294–
1313.
[74] Straussberger, S. Monotony In Air Traffic Control -
Contributing Factors And Mitigation Strategies.
Dissertation, Karl-Franzens-University Graz.
[75] Temple, J. G., Warm, J. S., Dember, W. N., Jones, K. S.,
LaGrange, C. M., and Matthews, G. 2000. The Effects of
Signal Salience and Caffeine on Performance, Workload,
and Stress in an Abbreviated Vigilance Task. hum factors
42, 2, 183–194.
[76] Thackray, R. I., Jones, K. N., and Touchstone, R. M. 1974.
Personality And Physiological Correlates Of Performance
Decrement On A Monotonous Task Requiring Sustained
Attention. British Journal of Psychology 65, 3, 351–358.
[77] Thiffault, P. and Bergeron, J. 2003. Fatigue and individual
differences in monotonous simulated driving. Personality
and Individual Differences 34, 1, 159–176.
[78] Turkington, P. M. 2001. Relationship between obstructive
sleep apnoea, driving simulator performance, and risk of
road traffic accidents. Thorax 56, 10, 800–805.
[79] Verhaeghen, P. and Salthouse, T. A. 1997. Meta-analyses
of age-cognition relations in adulthood: Estimates of linear
and nonlinear age effects and structural models.
Psychological Bulletin 122, 3, 231–249.
[80] Verwey, W. B. and Zaidel, D. M. 2000. Predicting
drowsiness accidents from personal attributes, eye blinks
and ongoing driving behaviour. Personality and Individual
Differences 28, 1, 123–142.
[81] Warm, J. S., Parasuraman, R., and Matthews, G. 2008.
Vigilance Requires Hard Mental Work and Is Stressful.
Human Factors: The Journal of the Human Factors and
Ergonomics Society 50, 3, 433–441.
[82] Warshawsky-Livne, L. and Shinar, D. 2002. Effects of
uncertainty, transmission type, driver age and gender on
brake reaction and movement time. J Safety Res 33, 1, 117–
128.
157

[83] Wechsler, D. 2008. Wechsler Adult Intelligence Scale–
Fourth Edition (WAIS–IV). NCS Pearson, San Antonio,
TX.
[84] Wiener, E. L. and Curry, R. E. 1980. Flight-deck
automation: promises and problems. Ergonomics 23, 10,
995–1011.
[85] Willcutt, E. G., Doyle, A. E., Nigg, J. T., Faraone, S. V.,
and Pennington, B. F. 2005. Validity of the Executive
Function Theory of Attention-Deficit/Hyperactivity
Disorder: A Meta-Analytic Review. Biological Psychiatry
57, 11, 1336–1346.
[86] Yanko, M. R., Spalek, T. M., Yanko, M. R., and Spalek, T.
M. 2013. Driving With the Wandering Mind: The Effect
That Mind-Wandering Has on Driving Performance.
Human Factors: The Journal of the Human Factors and
Ergonomics Society 56, 2, 260–269.
158
Evaluación de estándares HMI:
Aplicación de la guía GEDIS a los Sistemas SCADA del
NAP (Network Access Point) de Canarias
Said Filali
1, Carina González
1, Carlos Lecuona
2
1Departmento de Ingeniería Informática y de Sistema. Universidad de La Laguna (ULL).
Email: {saidfilali88;carina211}@gmail.com
2Departmento de Ingeniería. Instituto de Tecnlogías y Energías Renovables (ITER).
Email: [email protected]
ABSTRACT
En este trabajo se presenta la evaluación de las interfaces de la
sala del Centro de Operaciones NOC (Network Operations
Center) del NAP (Network Access Point de Canarias) siguiendo
estándares y normativas relacionadas a HMI, así como la guía
ergonómica de supervisión GEDIS. En base a los resultados
obtenidos, se presenta un prototipo de mejora de la interfaz actual
utilizada por los operarios del sistema de supervisión.
Categories and Subject Descriptors
H.5.2. [User Interfaces]
General Terms
Design, Security, Human Factors.
Keywords
Ergonomía, HMI, SCADA, Factores Humans, Estándards
1. INTRODUCCIÓN
En tareas de supervisión humana de salas de control industrial
están implicadas de forma genérica disciplinas como la seguridad
y la ergonomía física, así como la ingeniería de la usabilidad y la
ergonomía cognitiva, ya que aportan pautas para realizar y
mejorar el diseño de salas de control centradas en el usuario[1].
Para realizar el proceso de supervisión y control en este tipo de
salas, habitualmente se utilizan sistemas del tipo SCADA
(Supervisión, Control y Adquisición de Datos) [2]. Un sistema
SCADA es un software que permite controlar y supervisar
procesos industriales a distancia y que facilita retroalimentación
en tiempo real con los dispositivos de campo (sensores y
actuadores).
La tarea de mantener informado al operador de lo que está
sucediendo en alguna parte del proceso productivo la realiza la
Interfaz Humano-Máquina (HMI), la importancia de que exista
una buena comunicación entre estos, como parte de un sistema de
control de procesos automatizados, radica en que sólo así se
podrán analizar las diferentes anomalías que puedan suceder
además de ajustar los diversos parámetros relacionados al proceso
de control. La labor de supervisar representa una tarea delicada y
esencial desde el punto de vista normativo y operativo, de ésta
acción depende en gran medida garantizar la calidad y eficiencia
del proceso que se desarrolla. En la supervisión descansa la
responsabilidad de orientar o corregir las acciones que se llevan a
cabo. Por lo que se tiene una toma de decisiones sobre las
acciones de control por parte del supervisor, que muchas veces,
como en nuestro caso, recaen sobre el operario.
Por ello, una HMI debe contener tanto componentes gráficos
como componentes numéricos, además debe utilizar terminología
estandarizada y clara para el usuario final. Además, se recomienda
que las variables de proceso y variable de control sean lo más
claras posibles para el usuario, asimismo, se debe mantener un
registro histórico de las variaciones ocurridas, esto con el fin de
estudiar su comportamiento y poder realizar las predicciones
respectivas.
Este trabajo tiene el objetivo de aplicar y analizar bajo las
diferentes técnicas y estándares de usabilidad, accesibilidad y
experiencia de usuario los sistemas HMI/SCADA del NAP
(Network Access Point) de Canarias, identificando los principales
problemas y dando las recomendaciones de mejora en base a los
resultados obtenidos. Específicamente, se pretende aplicar una
guía ergonómica de diseño (GEDIS)[3], así como diversos
estándares y normativas, para la mejora del sistema actual de la
sala de control del NAP: el Sistema de Gestión de Edificación,
BMS (Building Management System) del edificio D-ALIX. En
base a los resultados obtenidos se presenta un prototipo de mejora
de la interfaz actual utilizada por los operarios del Centro de
Operaciones, NOC (Network Operations Center).
2. SISTEMA ACTUAL: BMS
El Centro de Operaciones NOC del Instituto Tecnológico y de
Energías Renovables (ITER) se encarga de monitorizar las
diversas infraestructuras del Data Center como son la
climatización, suministro eléctrico, protección contra incendios,
seguridad, centros técnicos, parques eólicos, plantas fotovoltaicas,
así como las distintas infraestructuras desplegadas alrededor del
cable submarino perteneciente al consorcio de Cana-Link (el
cable que une la Península y Canarias, el anillo terrestre y la Red
IRIS). Para unificar algunos de estos Sistemas y facilitar la tarea
diaria al personal del NOC, el ITER utiliza como software
159

SCADA el sistema BMS, que es un software especializado en la
gestión de edificios.
El principio de funcionamiento de este tipo de softwares es
similar a todas las tecnologías que se especializan en
automatización industrial, es decir, posee un entorno gráfico que
permite la programación de los controladores, además de la
instrumentación típica para estos tipos de proyectos.
La aplicación está dividida en cinco módulos: a) Módulo de
lectura de la red, b) Módulo de análisis de datos y
almacenamiento, c) Módulo de datos, d) Módulo de Informes y e)
Módulo de Interfaz de Usuario. Tres de éstos módulos (Módulo
de análisis de datos y almacenamiento, Módulo de datos y
Módulo de Informes) tienen una interfaz Web Services (WS). El
Módulo de lectura de la red se encarga de la toma de datos de los
dispositivos de la red ALiX [4], de forma periódica interroga la
red obteniendo estados, alarmas y variables, esta información se
envía al Módulo de análisis de datos y almacenamiento para su
procesamiento, a partir del análisis de las variables se generan
nuevas alarmas que se suman a las ya existentes y se les asigna
una importancia (peso). Por último toda esta información junto
con algunas variables se almacena en el Módulo de Datos.
El Módulo de análisis y almacenamiento de datos también se
encarga de guardar los datos en bruto de la última lectura de cada
uno de los dispositivos de la red, sólo se almacena la última
lectura de cada dispositivo eliminando la anterior, con esta
información se puede obtener una imagen en tiempo real de lo que
está sucediendo en la red.
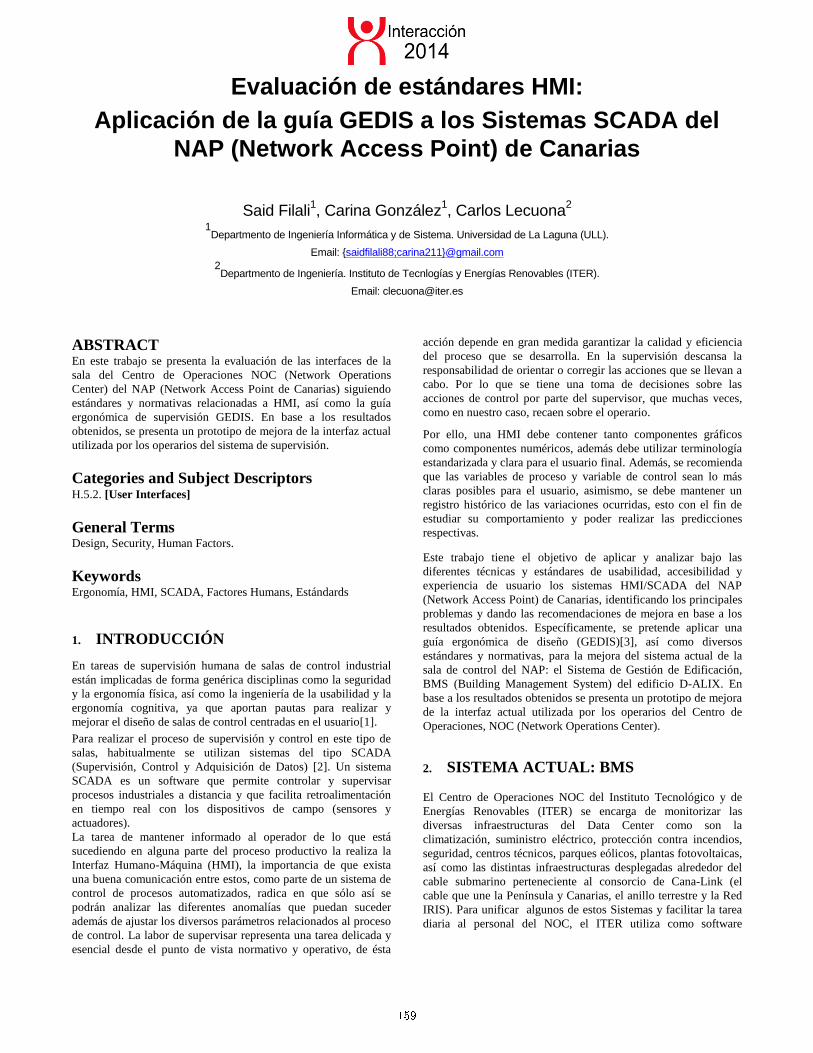
Figura 1. Estructura del BMS ALIX 2.0
MLR: Módulo de
lectura de la red
MDD: Módulo
de datos (L/E)
MDI: Módulo
de Informes
MWU: Módulo de
interfaz de usuario
MAA: Módulo de análisis de
datos y almacenamiento
A continuación se reflejan las relaciones existentes entre los
módulos de la Figura 1, así como los protocolos que emplean:
A) MLR => Red ALiX: Interroga HTTP, Modbus y
SNMP
B) MLR => MAA: Envío HTTP-XML mensaje WS
C) MAA => BD TReal: Consulta SQL ADODB
D) MAA => BD: Consulta SQL ADODB
E) MAA <=> MDD: Bidireccional envío HTTP-XML
mensaje WS
F) MDD <=> MDI: Bidireccional envío HTTP-XML
mensaje WS
El Módulo de Datos (L/E), a partir de la información almacenada,
suministra todos los métodos para la obtención de información
útil para el usuario (últimas alarmas, alarmas reconocidas,
histórico de eventos, etc.) el módulo de interfaz de usuario y el de
informes hacen uso de esta información para su funcionamiento.
Aparte de los métodos para obtener información de la red el
Módulo de Datos también dispone de métodos para interactuar
con los dispositivos de la red (apagado/encendido de grupos,
modificar consignas, etc.) y a través de la interfaz WS para tres de
los módulos se permite que aplicaciones externas puedan
suministrar y obtener datos de la aplicación.
3. EVALUACIÓN: APLICACIÓN DE
LA GUÍA GEDIS AL BMS Y SISTEMAS
SCADA DEL NAP
La guía GEDIS ha sido confeccionada cruzando información del
diseño de sistemas interactivos centrados en el usuario (Granollers
et. al., 2005) junto a trabajos centrados en la formalización de
criterios ergonómicos (Bach y Scapin, 2003), (Bastien et.
al.,1996) y las directrices heurísticas de Nielsen (Nielsen, 1994).
Una de las diferencias respecto a las metodologías previamente
desarrolladas radica en que la guía GEDIS, además de ofrecer
directrices genéricas sobre criterios ergonómicos en el diseño,
aporta de forma original un método de evaluación numérica que
permite la valoración de la calidad de la interfaz (Ponsa y Díaz,
2007).
La guía se estructura en 2 partes. En la primera parte de la guía se
detalla un conjunto de indicadores seleccionados de las pautas de
diseño de interfaces multimedia que utilizan los ingenieros
informáticos y los expertos en interacción persona ordenador
(Shneiderman y Plaisant, 2006), (AIPO, 2007), (Gra-nollers et.
al., 2005). Por otra parte, la segunda parte de GEDIS muestra
cómo pueden hallarse medidas cuantitativas de evaluación de los
indicadores para la obtener de un valor numérico final que
permita al diseñador/usuario valorar las posibles mejoras de la
interfaz de supervisión. A su vez, este valor permite la
comparación con otras interfaces.
La evaluación expresada en forma numérica cuantitativa o bien en
formato cualitativo pretende promover la reflexión del usuario
que rellena la guía GEDIS a modo de cuestionario, de manera que
recoja la experiencia de uso que en muchas ocasiones no llega a
verbalizarse.
Las ecuaciones para la medida de los indicadores son las
siguientes:
160

Con la primera ecuación, podemos determinar el valor de cada
indicador mediante la suma total de los respectivos
subindicadores partido por el nº de subindicadores que tiene cada
indicador. En la segunda ecuación, se determina el total de la
evaluación global, como el resultado de la suma de los
indicadores, dividido por el nº de indicadores que evaluamos en la
aplicación.
Ambas ecuaciones incluyen pesos idénticos a los indicadores y
subindicadores, que pretenden cubrir los aspectos del diseño de la
interfaz.
A continuación en la Tabla 1 se detallan la evaluación obtenida
del BMS actual, teniendo en cuenta los indicadores de la guía
GEDIS, siendo a=apropiado, m=medio y na = no apropiado.
Tabla 1. Evaluación GEDIS del BMS actual.
Nombre_indicador Rango numérico/cualitativo del BMS
Estructura 4,3
Existencia de mapa [SI, NO] [5,0] 5
Número de niveles le [le<4, le>4] [5,0] 5
División: planta, área [a, m, na] [5, 3, 0] 3
Distribución 4
Comparación con modelo [a, m, na][5,3,0] 4
Flujo del proceso [claro, medio, no claro] [5,3,0] 4
Densidad [a, m, na] [5,3,0] 4
Navegación 5
Relación con [a, m, na] [5,3,0] 5
Estructura 5
Navegación entre pantallas [a, m, na] [5,3,0] 5
Color 4,2
Ausencia de combinaciones no
apropiadas
[Si, No][5,0] 5
Número de colores c [4<c<7, c>7][5,0] 5
Ausencia de intermitencia
(caso sin alarma)
[Si, No][5,0] 5
Contraste entre fondo pantalla
y los objetos gráficos
[a, m, na] [5,3,0] 3
Relación con Texto [a, m, na] [5, 3, 0] 3
Texto 3,25
Número de fuentes f [f<4, f>4][5, 0] 5
Ausencia de fuentes pequeñas
(mínima fuente 8)
[Si, No][5, 0] 0
Ausencia de combinaciones no
apropiadas
[Si, No] 5
Uso de abreviaciones [a, m, na][5,3,0] 3
Estado de los dispositivos 2,5
Símbolos e iconos uniformes [a, m, na][5, 3, 0] 5
Representación del estado del
equipo
[Si, No][5,0] 0
Valores de Proceso 4
Visibilidad [a, m, na][5, 3, 0] 5
Localización [a, m, na][5, 3, 0] 3
Gráficos y Tablas 4
Formato [a, m, na][5, 3, 0] 5
Visibilidad [a, m, na][5, 3, 0] 3
Localización [a, m, na][5, 3, 0] 3
Agrupamiento [a, m, na][5, 3, 0] 5
Comandos de entrada de
datos
5
Visibilidad [a, m, na][5, 3, 0] 5
Uso [a, m, na][5, 3, 0] 5
Realimentación [a, m, na][5, 3, 0] 5
Alarmas 5
Visibilidad pantalla de alarmas [a, m, na][5, 3, 0] 5
Localización [a, m, na][5, 3, 0] 5
Conocimiento de la situación [Si, No] [5, 0] 5
Agrupamiento de alarmas [a, m, na][5, 3, 0] 5
Información al operario [a, m, na][5, 3, 0] 5
La evaluación obtenida en la tabla 1, se ha realizado junto al
supervisor del BMS, a 6 operarios del NOC y al diseñador del
Sistema, aplicando los criterios que marca la guía GEDIS, así
como las normativas aplicadas.
Los resultados obtenidos con esta evaluación cuantitativa se
puede decir que es muy satisfactoria a un nivel general, dentro de
los indicadores evaluados se ha detectado mejoras, para el
indicador Texto y Estado de los dispositivos.
Los cambios de mejora introducidos en los indicadores anteriores
se detallan a continuación, en cuanto a texto, la pantalla de
incidencias se ha incrementado el tamaño de letra, para los
eventos de alarma, warning y sin comunicación. Respecto al
indicador del estado de los dispositivos, se ha optimizado el uso
de los recursos del Servidor del BMS, anteriormente la pantalla
del SCADA de Unifilar del D-ALiX, para la interrogación del
estado de los dispositivos, esta pantalla trabajaba a muy bajo nivel
estableciendo las comunicaciones con los dispositivos a nivel de
pasarelas Modbus, se ha cambiado la lógica de trabajo para
realizar la consulta del estado de los dispositivos a nivel de
consultas SQL, a la Base de Datos, con esta mejora el trabajo se
ha extendido hacia la usabilidad. Por lo tanto se ha procedido a la
incorporación de esta pantalla para ser utilizada por los operarios
del NOC.
Figura 2: SCADA de Unifilar del D-ALiX
161
Asimismo, además de la aplicación de la guía GEDIS, se han
tenido en cuenta estándares internacionales como son la ISO
11064 [5], que establece principios, recomendaciones y
requerimientos para ser aplicados en el diseño de centros de
control y la EEMUA 191.
Con la norma EEMUA 191 [6], que es un conjunto de directrices
para la gestión de alarmas, se ha evaluado el Sistema de Alarmas y
eventos del D-ALiX para la medición de los ratios marcados por
esta norma, como son el promedio de alarmas por hora, el número
máximo de alarmas por hora, tiempo de respuesta del operador,
etc.
En la evaluación del rendimiento de los Sistemas de Alarmas del
BMS, se han obtenido resultados positivos, entre ellos, el número
de alarmas que se puedan dar en 10 minutos es menor a 2, por lo
tanto el Sistema es manejable, para los operarios. El número de
alarmas que se pueden dar durante los 10 primeros minutos
después de haberse producido la primera alarma crítica, este dato
es muy relativo, ya que es dependiente del equipo que falle el
número de alarmas que se podrían disparar se ha llegado a contar
7 alarmas. Por lo tanto es un valor inferior al que marca la norma
EEMUA 191, que son de 10 alarmas como máximo, para que el
sistema de gestión sea predecible.
Una vez evaluado la interfaz del BMS, se han propuesto diversas
mejoras para el rediseño de la interfaz de varias pantallas, así
como la reubicación de estas. En la figura 3, podemos ver un
ejemplo de pantalla antigua del Sistema SCADA utilizado en el
NOC para la monitorización de las plantas fotovoltaicas y en la
Figura 4, una mejora de está pantalla así como la posterior
integración en el BMS. Por lo tanto de esta manera se ha puede
eliminar el uso del Sistema SCADA Wonderware.
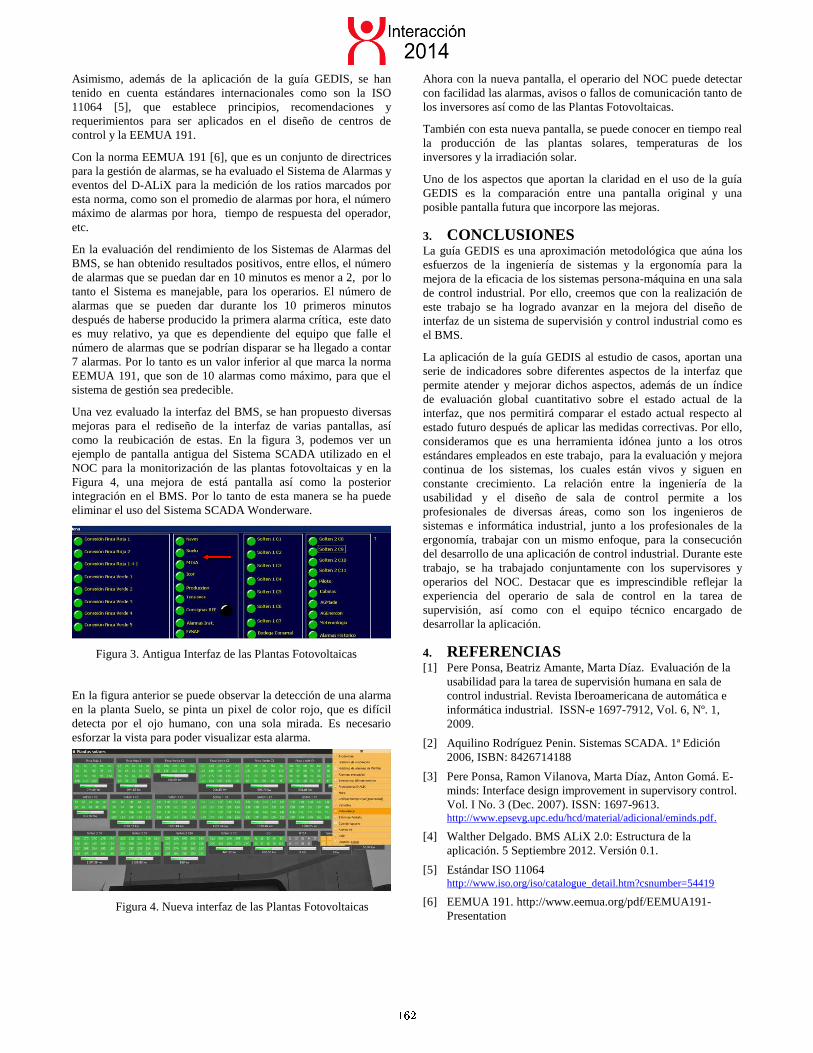
Figura 3. Antigua Interfaz de las Plantas Fotovoltaicas
En la figura anterior se puede observar la detección de una alarma
en la planta Suelo, se pinta un pixel de color rojo, que es difícil
detecta por el ojo humano, con una sola mirada. Es necesario
esforzar la vista para poder visualizar esta alarma.
Figura 4. Nueva interfaz de las Plantas Fotovoltaicas
Ahora con la nueva pantalla, el operario del NOC puede detectar
con facilidad las alarmas, avisos o fallos de comunicación tanto de
los inversores así como de las Plantas Fotovoltaicas.
También con esta nueva pantalla, se puede conocer en tiempo real
la producción de las plantas solares, temperaturas de los
inversores y la irradiación solar.
Uno de los aspectos que aportan la claridad en el uso de la guía
GEDIS es la comparación entre una pantalla original y una
posible pantalla futura que incorpore las mejoras.
3. CONCLUSIONES La guía GEDIS es una aproximación metodológica que aúna los
esfuerzos de la ingeniería de sistemas y la ergonomía para la
mejora de la eficacia de los sistemas persona-máquina en una sala
de control industrial. Por ello, creemos que con la realización de
este trabajo se ha logrado avanzar en la mejora del diseño de
interfaz de un sistema de supervisión y control industrial como es
el BMS.
La aplicación de la guía GEDIS al estudio de casos, aportan una
serie de indicadores sobre diferentes aspectos de la interfaz que
permite atender y mejorar dichos aspectos, además de un índice
de evaluación global cuantitativo sobre el estado actual de la
interfaz, que nos permitirá comparar el estado actual respecto al
estado futuro después de aplicar las medidas correctivas. Por ello,
consideramos que es una herramienta idónea junto a los otros
estándares empleados en este trabajo, para la evaluación y mejora
continua de los sistemas, los cuales están vivos y siguen en
constante crecimiento. La relación entre la ingeniería de la
usabilidad y el diseño de sala de control permite a los
profesionales de diversas áreas, como son los ingenieros de
sistemas e informática industrial, junto a los profesionales de la
ergonomía, trabajar con un mismo enfoque, para la consecución
del desarrollo de una aplicación de control industrial. Durante este
trabajo, se ha trabajado conjuntamente con los supervisores y
operarios del NOC. Destacar que es imprescindible reflejar la
experiencia del operario de sala de control en la tarea de
supervisión, así como con el equipo técnico encargado de
desarrollar la aplicación.
4. REFERENCIAS [1] Pere Ponsa, Beatriz Amante, Marta Díaz. Evaluación de la
usabilidad para la tarea de supervisión humana en sala de
control industrial. Revista Iberoamericana de automática e
informática industrial. ISSN-e 1697-7912, Vol. 6, Nº. 1,
2009.
[2] Aquilino Rodríguez Penin. Sistemas SCADA. 1ª Edición
2006, ISBN: 8426714188
[3] Pere Ponsa, Ramon Vilanova, Marta Díaz, Anton Gomá. E-
minds: Interface design improvement in supervisory control.
Vol. I No. 3 (Dec. 2007). ISSN: 1697-9613. http://www.epsevg.upc.edu/hcd/material/adicional/eminds.pdf.
[4] Walther Delgado. BMS ALiX 2.0: Estructura de la
aplicación. 5 Septiembre 2012. Versión 0.1.
[5] Estándar ISO 11064 http://www.iso.org/iso/catalogue_detail.htm?csnumber=54419
[6] EEMUA 191. http://www.eemua.org/pdf/EEMUA191-
Presentation
162

Integrating Field Studies in Agile Development to Evaluate Usability on Context Dependant Mobile Applications Juan-Miguel López-Gil
Universidad del País Vasco (UPV/EHU) C/Nieves Cano 12
01006 Vitoria-Gasteiz +34 945014057
Maite Urretavizcaya, Begoña Losada, Isabel Fernández-Castro Universidad del País Vasco (UPV/EHU)
Paseo Manuel de Lardizabal 1 20018 Donostia-San Sebastián
+34 943 018054 {juanmiguel.lopez, maite.urretavizcaya, b.losada, isabel.fernandez}@ehu.es
ABSTRACT Agile development is a current trend in Software Engineering which is encouraged by the special needs of interactive systems that require incorporating usability engineering in their development processes. In this regard, how usability assessment of mobile interactive applications should be conducted in the frame of agile methodologies is an open question. On the one hand, usability evaluation consumes time and resources, which can make agile methodologies lose their agile essence. On the other hand, there is a considerable debate about whether user interactions with mobile systems should be investigated in the field or in more traditional laboratory environments.
This paper presents the results of a field study conducted in an interactive context-dependant mobile application. This study allowed detecting different interaction patterns and contextual factors that are difficult or impossible to simulate in laboratory. The way and timing in which evaluations were performed were carefully considered to optimize the cost in time and resources. The integration of field evaluations in agile processes, as the one here presented, is consistent with the objective of improving product quality through incremental assessments.
Categories and Subject Descriptors D.2.10 [Software Engineering]: Design – Methodologies
H.1.2 [User / Machine Systems]: Human information processing
H.3.4 [Systems and Software]: Performance evaluation (efficiency and effectiveness)
General Terms Design
Keywords Agile development methodologies, usability evaluation, mobile application development, context, field studies
1. INTRODUCTION Agile methodologies are trendy interactive software development strategies. These methodologies apply: time-boxed iterative and evolutionary software developments, adaptive planning, evolutionary delivery, and rapid and flexible response to change.
The “big design up front” approaches to software development, particularly those following the waterfall lifecycle, do not easily support change or feedback [2]. To avoid these problems, the Agile Alliance focuses on people-oriented issues and apply development techniques that really support change [1]. One of the values promoted by the Agile Alliance is the higher importance of customer collaboration over contract negotiation [17]. Therefore, these methodologies are based on involving customers in assessments to progressively and incrementally reflect their performance tests throughout the development. As [2] states, “Only your customers can tell you what they want”.
Due to the requirements of interactive systems, usability issues must be incorporated in the development processes. The concept of usability is defined as the degree to which a product is tailored to its users’ needs, so it can be used to achieve specific goals in a use context with effectiveness, efficiency and satisfaction [8]. As software with poor usability can reduce its productivity and acceptance [20], the construction of interactive systems must take usability assessment into account. So, user interactions must be observed and evaluated to determine how to make systems more usable [5], as well as the systems must be evaluated by using appropriate usability techniques that can be applied from early stages of the development process [18].
The evolution of hardware on mobile devices has influenced in the software development and has been remarkable in recent years. Besides, the current focus on agile development has changed the way and timing of the evaluation of interactive applications, and this focus has been also included in mobile applications. Noticeably, the incremental assessment and usability evaluation should also be considered in this agile framework. Nowadays, an extensive typology of applications exist that take mobile features into account. Among these applications, context dependants ones are mainly devoted to mobile devices. There has been considerable debate over whether user interactions with interactive mobile systems should be evaluated in field studies or in more traditional laboratory environments. Traditional usability evaluation methods are more suited to controlled laboratory environments but fail to capture the complexity and richness of the real world in which applications are located [23].
This article shows the results of evaluating usability on a context dependant mobile application, which was developed using an agile methodology [15]. The goal of the assessment processes undertaken in this phase of the project was to evaluate the fulfilment of the usability objectives with a summative approach [25]. With this aim, two types of evaluations were performed that used the same techniques and metrics but with different characteristics. The first one (A) was developed in a fixed place and independent from the context (laboratory setting); the second
Permission to make digital or hard copies of all or part of this work for personal or classroom use is granted without fee provided that copies are not made or distributed for profit or commercial advantage and that copies bear this notice and the full citation on the first page. To copy otherwise, or republish, to post on servers or to redistribute to lists, requires prior specific permission and/or a fee. Interaccion’14, September 10–12, 2014, Tenerife, Spain. Copyright 2010 ACM 1-58113-000-0/00/0010 …$15.00.
163

one (B) was carried out in the moving real scenario, in which it is intended to be used (field study).
The contributions here presented just derive from the analysis of the field study results (B). This analysis detected different interaction patterns compared to the ones found in a laboratory setting (A). Conducting evaluations in the real context scenario also allows detecting context-related problems that are difficult or impossible to detect or simulate in laboratory. These kinds of evaluations have been found very convenient for agile methodologies that seek to improve product quality through incremental assessments. Moreover, the evolutionary and repetitive evaluations required in agile developments favour the detection of problems in context dependant field evaluations. Anyway, the time and the resources spent to perform the field study must be carefully considered when integrating field studies in agile methodologies.
The rest of the paper is structured as follows. Next section summarizes related research work. Section 3 explains how the study was performed and shows the results. In section 4, a discussion about the obtained results is presented. Finally, section 5 outlines the conclusions and future work.
2. RELATED WORK Agile methods are empirical in the sense they only depend upon experience or observation, without due regard to science and theory. Thus, control and prediction are purely based on observation of a pattern [3]. Schwaber and Highsmith state all empirical processes are “chaordic”, in the sense there is no point in planning software development or even trying to predict it [6]. Rather, the only possible course of action is to observe it and report the results [3].
Agile architects ensure their technical conception actually work by writing a small version of the application. The goal is to write just enough code as to verify that what is thought to work will really work [2]. So, after a functional version of a prototype is built, it must be evaluated by project stakeholders to verify it meets their needs. Ambler also suggests some tips while prototyping: work with real users, get stakeholders to work with the prototype, base the prototype in the application requirements, prototype features that can be actually build and enlist a user interface expert to help designing it.
Generally speaking, agile methods promote empirical processes in unstable domains. In these domains, the frequent measurement and dynamic response to variable events give rise to large changes [11]. Furthermore, the agile methods that integrate usability engineering techniques define a relevant research line in current agile methodological proposals [7][19][15].
Regarding usability testing in mobile environments, Zhang exposes the challenges to be addressed: mobile context, multimodality, connectivity, small screen size, different display resolutions, limited power and processing capability, and restrictive data entry methods [27]. On the other hand, Dey defines mobile context as any information system that characterizes a situation by considering the interaction between users, applications and the surrounding environment [4].
Several authors have compared field study and laboratory usability evaluations, and obtained different conclusions. Some of them highlight the advantages of field evaluation when the use-context plays a main role. Field studies provide insight into those aspects of the current usage that are crucial for successful design
but hard to create in laboratory, such as interruptions, complex patterns of cooperation or physical environment [20] [24]. In this regard, some comparisons made for mobile systems concluded it is definitely worth conducting usability evaluations in the field [21]. However, other studies showed that the added value when conducting usability evaluations in the field is very small, and that recreating central aspects of the use context in a laboratory setting enables to identify the same usability problem list [10]. These contradictory conclusions have been criticized on the basis of different experimental procedures and data collection facilities [21]. Besides, other authors state that it is different to test a consumer application compared to applications designed for professionals, in which their tasks are clearly displayed [9]. Otherwise, some authors recommend laboratory experiments when the testing focus is centred on both the user interface and the device-oriented usability issues. However, they recommend field studies for investigating a wider range of factors affecting the overall acceptance of mobile services, which included system functions and impact of usage contexts [26].
3. FIELD STUDY This section details how the field study was performed. After the study background, their objectives, participants, usability evaluation techniques, materials (questionnaires, templates and scenarios) and instruments (mobile phone and user logging module) are described. The procedure used to perform the field study is explained next. Finally, the obtained results are expressed by means of the usability measures captured in the study.
3.1 Background The FindMyPlace mobile application, here presented, is devoted to helping users to find physical locations inside the Computer Science Faculty of Donostia/San Sebastián. The application uses the building plans of the faculty and helps its users to reach locations inside the building and to obtain information about its staff. The application is based on a server client model, in which users handle an Android application installed on their phone. By means of a data connection to a mobile or WiFi network it accesses to the server where information is stored. The application has been developed by using InterMod agile software development methodology [15]. InterMod controls software development by means of User Objectives (UO), i.e. user desires that can be met by one or more functional and/or non-functional requirements. Every UO is a complete logical unit as well as a part of the final result. Besides, each UO is carried out by means of several models developed by work teams throughout several activities performed in different iterations.
During the development process, FindMyPlace was incrementally evaluated by means of usability evaluation techniques conducted in laboratory [16]. The way and timing in which these evaluations were performed were carefully considered to optimize their time and resources cost. Even though these usability techniques were suitably integrated in the agile developments process, the application still needed to be tested in its real use context. In that moment, the application developed was so robust as to allow being evaluated by means of a realistic field study. We sought to improve product quality through this incremental assessment including a field study.
3.2 Objectives The study pursued three main objectives:
1. To ensure the application met user’s needs regarding physical space and staff location in the faculty.
164

2. To check the kind, extent and value of the information that the field study could provide compared to some laboratory based evaluations of the tool (actual and previous laboratory-based evaluations of the same software). In this regard, it also aimed to determine whether the field study could reveal problems in the application that could hardly be detected in laboratory evaluations.
3. To integrate and demonstrate the usefulness of field studies in the context of agile methodologies. This was aimed to check their usefulness to complement laboratory-based studies.
3.3 Participants A total of 13 freshmen college students participated in the study. None of them had participated in any previous evaluation related to FindMyPlace, so the application was new to all of them. 85% of them had a mobile phone with the Android platform, and also 85% of them routinely or occasionally used maps on their mobile phones. Three usability experts took part in the study as evaluators.
3.4 Techniques To perform the FindMyPlace analysis, several usability evaluation techniques were used in order to gather users’ efficacy, efficiency, and satisfaction measures. The field study was performed with users while they tested the tool in a real use context. In the experiment, the experts used observational methods and took notes [22]. Thinking aloud [12] and interviews [14] techniques were also used. Besides, user logs were analyzed to gather data about how the participants solved proposed activities .
3.5 Material and Instruments First, a demographic questionnaire was used to collect some end users features. Then, participants carried out a set of eleven objective-oriented tasks. Every evaluation task was related to a concrete UO that emerged during the application development [16]. These tasks were presented as a series of User Objective Scenarios (UOS henceforth). The UOS concept derives from the Task Scenarios concept [18] when this is applied to UO. An UOS is a hypothetical story designed by the tester to help the end user to evaluate a UO through a given situation.
Three UO were involved in this evaluation:
• UO2-Showing distribution of spaces in the building plan at different levels of detail: The user wants the application to show all the floors of the building and their distributions with zoom possibilities.
• UO8-Showing a location in the building plan: The user wants to indicate a location name (through a checkbox, search, etc.) in order to visualize it conveniently marked on a building plan. This UO is a fusion of other three UO: UO3-Showing a teacher’s office in the building plan, UO4-Showing a laboratory in the building plan and UO5-Showing a special location in the building plan.
• UO12-Find out information about the people that work in the Computer Science Faculty. The user wants to indicate a person's name or select it from a people list, to view his/her information.
Table 1 describes the eleven UOS and associates them with the involved UO and their corresponding descriptions. For simplicity, UOS in this table are referred to as ‘S’ plus a number.
Table 1. User Objectives Scenarios
UO UOS Description
S1 2 I want to see the space distribution of all Faculty floors. Besides, I want to see the third floor with
different levels of detail.
S2 8 I want to locate office A in the building plan,
with enough level of detail (centred on the screen with enough size to be clearly visible)
S3 8 I want to locate laboratory B in the building plan, with enough level of detail (centred on the screen
with enough size to be clearly visible)
S4 8
I want to locate the final-year-project room in the building plan, with enough level of detail (centred
on the screen with enough size to be clearly visible),
S5 8 I want to locate classroom C in the building plan, with enough level of detail (centred on the screen
with enough size to be clearly visible)
S6 12 I want to visualise the staff list and check the
information about D
S7 8 I want to physically go to the assembly hall
S8 8 I want to physically go to the secretary’s office
S9 8 I want to physically go to classroom E
S10 8, 12
I want to physically go to teacher F’s office to tell her a message. When I reach the office, I realize she is not there, so I have to search her email.
S11 8, 12
As I think my next lecture with teacher F is at laboratory G, I go to there, but I find it is closed. Then, I go to her office, but as she is not there I call professor H, who is the other lecturer of the
subject
The UOS were divided into two different sets. The first six UOS were designed for users to find information exclusively in the application, so they were designed as simple static scenarios with no need of moving to concrete locations (henceforth, static UOS). On the other hand, the final five UOS required users to discovery location information in the provided building plans, and also to go to the searched places (henceforth, dynamic UOS). These dynamic UOS were, in turn, subdivided. The first three dynamic UOS were simple and equivalent to the previous six ones, except they required users to move physically to the intended locations. The last two dynamic UOS were complex and combined some aspects of some simple UOS to provide more realistic situations.
So, there were similarity relationships between some static and some dynamics scenarios regarding the activities that participants had to carry them out. Concretely, S4 is related to S7 and S8 (searching a special location) and S5 is related to S9 (searching a classroom). Finally S10 is a complex UOS that combines two simple UOS (S2 and S6), and S11 combines three simple UOS (S2, S3 and S6).
The users utilized FindMyPlace, installed on Samsung Galaxy S mobile phones with active WiFi connections, to perform the evaluation. Besides, the application included an embedded module to gather user activity logs.
The evaluators recorded several data related to the tasks performed during the evaluation session on paper sheets. Some of these aspects are: initial and ending time, WiFi connectivity breaks, application crashes, participants’ comments, upwards and
165

downwards stairs used, wrong routes, whether the user thinks he/she has achieved the goal, whether the user has really achieved it, and other remarkable incidences.
In order to measure satisfaction, an online version of the After-Scenario Questionnaire (ASQ) [13] was used.
3.6 Procedure First and previous to the evaluation session, participants filled in an online demographic questionnaire to check they fitted the user model of the developed application. Then, after the users adequacy was confirmed, the evaluation sessions were conducted. Users were divided into two equally balanced groups that comprised seven and six participants respectively; besides, a within-subjects factorial design was used to cancel out learning effect. The first group started with the static UOS, while the second one started with the dynamic UOS. After finishing the first UOS assignment set (static or dynamic), participants switched to the remaining UOS. For each participant, the order in which to perform the UOS was selected randomly to avoid any bias. In the end, all participants performed the whole eleven UOS.
The evaluators presented every participant an ordered sequence of UOS to perform; then, they used the application in a mobile phone to carry them out with no time limit. During the experience, participants were asked to think aloud to verbalize their sights, thoughts, actions and feelings. At the same time, the evaluators used their paper sheets to annotate relevant aspects.
Finally, participants filled in the satisfaction questionnaire (ASQ), and were interviewed so they could express their opinion about the application. The whole session lasted for approximately 60 minutes per user.
3.7 Results The usability attributes defined in ISO-9241-11 [8], i.e. effectiveness, efficiency and satisfaction, were evaluated in the field study. The specific measures used to assess each attribute are presented below.
3.7.1 Effectiveness Three percentage aspects were considered to measure effectiveness: successfully completed UOS, application crashes, and WiFi connection breaks.
To calculate the percentage of successfully completed UOS two conditions, from different data sources, were verified. On the one hand, the evaluator sheet was checked to confirm whether both participant and evaluator stated the UOS was correctly completed. On the other hand, the user log was also analysed to check whether the participant accessed all the information required to complete the UOS. When any of these conditions was not fulfilled, the UOS was considered not complete and so was labelled as unfinished. Regarding the percentage of successfully completed UOS, the overall UOS completion rate was 95.80%. Five UOS (S1, S6, S7, S8 and S9) obtained a 100% completion rate (all participants completed the UOS), while the other six obtained a 92.30% completion rate (12 participants out of 13 completed these UOS).
Concerning the number of times the application crashed during the participants’ experience, the application was always appropriately working in static UOS, but problems arose with dynamic UOS. The application crashed while performing 4 out of the 5 dynamic UOS (all except S8). Anyway, the incidence of the error was low, as the application crashed for just 2 out 13
participants in S7, 3 out of 13 in S9, 2 out of 13 in S10 and 1 out of 13 in S11.
Finally, WiFi connection breaks only occurred with dynamic UOS. Concretely, 2 out of 13 participants experienced WiFi problems for S7, while 6 out of 13 participants suffered WiFi problems for UOS from S8 to S11.
3.7.2 Efficiency Regarding efficiency, six different measures were used. It must be noted that, in this evaluation, efficiency measures were related to both the application usage and participants’ indoor movement while performing the UOS. The efficiency results were obtained by means of application logs and were summarised in box plots graphics with 4 values represented (maximum, q3-percentile 75%, q1-percentile 25%, and minimum). Used efficiency measures are shown below.
3.7.2.1 Time spent Figure1 shows the time spent by participants (minutes and seconds) to complete the assigned UOS. The information is presented by means of central tendency and dispersion statistics. The difference in mean time between static and dynamic UOS is noteworthy, but this can be justified by the different nature of corresponding UOS, i.e. dynamic ones require participants to move inside the building, while the static ones do not. Regarding data dispersion, dynamic UOS data are wider scattered than the static ones, what indicates very different participants’ performances and behaviour implications due to Wifi connections breaks.
Figure 1. Amount of time spent for each UOS
3.7.2.2 Searches performed
In this context, a search is understood as each letters and/or numbers introduced or deleted in a search box to obtain some desired information.
the process in which users
Figure 2. Number of searches performed by participants for each UOS
static UOS dynamic UOS
UO8 special location
UO8 classroom
166

Figure 2 presents the number of searches performed by the participants for each UO Scenario. The sequence of scenarios in Figure 2 has been rearranged to group similar scenarios to better show the obtained results. The two first grouped scenarios, S4-S7-S8 and S5-S9, requires each one its proper sequences of interactions for their resolution. Besides, the third group includes the dynamic and more complex S10 and S11 that are displayed as a combination of also included simpler UOS S2, S3 and S6 (S10=S2+S6 and S11=S2+S3+S6). S1 is the only UOS that requires no searches. The comparison among similar scenarios shows noticeable differences. In this sense, S4 (static) and S7 (dynamic) and S5 and S9, clearly show different behaviours. Additionally, the number of steps performed in the search process is increased by WiFi connection breaks. While participants are moving and WiFi is lost the application does not able to show a location list when searching, and participants introduce or delete more letters or numbers. Finally, the search number for the dynamic UOS S10 and S11 was bigger than the direct addition of the search numbers of the simple UOS involved.
3.7.2.3 Interactions performed An interaction is whatever action performed by a user on an interface button or the selection of an element on the screen. In this sense, the keyboard activity while typing information in search processes is not an interaction; likewise, inspecting a building plan by moving, enlarging or reducing it with finger
movements on the screen are not considered interactions either.
Figure 3. Number of interactions performed by the participants for each UOS
Figure 3 displays the number of interactions performed to solve the UOS; and the scenario sequence has been rearranged to group scenarios that evaluate same UO. The differences between the interaction number in static and dynamic UOS are considerable. It is particularly noteworthy that even the static and dynamic UOS that should require similar interactions show remarkable differences. For instance, S4 (static) and S7 or S8 (dynamic) require a minimum of 3 interactions, while gathered results show the interaction number was bigger and more dispersed in S7 and S8 than in S4. The difference is even more noticeable if the interactions of S2+S6 (static) are compared to the ones of S10 (dynamic): the number of interactions performed in S10 is much bigger than the addition of the corresponding S2 and S6 interactions.
3.7.2.4 Touch scrolls A touch scroll includes whatever different positions of fingers on the screen with the aim of moving and zooming (in or out) building plans. Data for this efficiency measure are gathered by the activity logging module embedded in the application. Touch
scrolls include: (1) placing and moving one finger (it will move the map sideways), (2) placing a second finger and separating or approaching them (zooms in or out the plane), and (3) removing fingers.
Figure 4. Number of touch scrolls performed by the participants for each UOS
Figure 4 exhibits the number of touch scrolls performed by the participants for each UO Scenario. Like in Figure 2, the UOS are rearranged to put together UOS that require similar performance. There is only one scenario (S1) in which observing the building plans with different detail levels is required, and so, this is the kind of activity that requires participants to touch scroll more times. In all other cases, except S5 and S9, not big differences were observed. Although S9 (dynamic) has a similarity relationship with S5 (static) regarding the kind of activity that users had to perform, differences can be noted between them, as the q1 percentile of S9 is practically equivalent to the q3 percentile of S5. This figure has also rearranged the sequence of UOS to consider their similarity in order to better examine results.
3.7.2.5 Mobile phone orientation changes A change in the orientation of the mobile phone happens when the screen adjusts to landscape or normal mode depending on the position of the mobile phone. Such orientation changes can happen intentionally or not. User activity logging has allowed gathering data about this efficiency measure.
In this case, the information about orientation changes was not relevant. In fact, it has been confirmed that orientation changes occur more frequently when participants are in motion, which mainly happened in dynamic UOS. However, it is not possible to determine from just user activity logs whether orientation changes happened unwittingly or not. Gathered logs state the orientation changes mean was 0.51 for static UOS, while it rose up to 2.37 for dynamic UOS.
3.7.2.6 Displacements inside the building Other efficiency measures related to participants’ performance while moving through the building were the number of times they went up and down stairs (displacements between different floors of the building) and the number of deviations from the optimal path to reach the destination inside each floor. It should be noted that these measures were gathered only for dynamic UOS, as they were the ones in which participants had to move to reach destinations inside the building.
Regarding upstairs displacements, results show that 100% of the participants in S8, S9 and S10 went upstairs by the optimal available stairs to reach each UOS’ final destination. The percentage descended to 85% in S7 and S11, as one participant in
Static
UOS
Dynamic UOS
UO2 UO8
UO12 UO8 +
UO12
UO8 special location
UO8 classroom
167

each UOS went upstairs more times than necessary. Downstairs displacement shows similar results, as 100% was achieved in S8, S9 and S10, while 90% and 88% were obtained in S7 and S11 respectively.
Concerning displacements inside each floor, the amount of people that wandered without managing to find the correct route to their destination at the first opportunity was a 15%, 7%, 7%, 7% and 15% for S7, S8, S9, S10 and S11 respectively.
3.7.3 Satisfaction In order to obtain a global satisfaction score, the mean of the three items of the online ASQ questionnaire [13] were calculated. These items are related to the easiness, time spent, and supporting information (online help, messages, documentation) used to complete the UOS.
The questionnaire used a 7-point Likert scale, ranging from 1 (strongly disagree) to 7 (strongly agree). The means for the three ASQ items were 6.69, 6.23 and 5.38 (out of 7) respectively. Therefore, the easiness to complete UOS was the most valued aspect, while the support information provided by the application was the item participants ranked lower.
4. DISCUSSION The FindMyPlace application, whose field evaluation has been presented in this paper, was previously evaluated by means of usability evaluation techniques conducted incrementally in laboratory environments [16]. These laboratory evaluations were suitably integrated in the agile development process, but the application still needed to be tested in its real use context. Finally, this field study has made possible to figure out the usability level of the application in terms of its effectiveness, efficiency and satisfaction.
The effectiveness results have been particularly encouraging, because they indicate that previous usability evaluations guided the application development in the right direction. Thus, while effectiveness reached for UO8 was 94.44% in the past [16], the overall scenarios for UO8 completion rate has been 95.60% in this evaluation. Besides, as the previous usability evaluations were performed over first prototypes, the application was far to reach the current development refinement. Furthermore, one specific aspect must be mentioned. Two participants thought they had completed a scenario, but the evaluator noted that it was not the case. That happened once for a participant in S11, and four times for another participant in UOS from S2 to S5. In the second case, the after-evaluation interview allowed to identify the reason: he did not understand that he “had to zoom in the building plans”, because he assumed the default display of the plans had enough level of detail. Therefore, although these UOS were labelled as unfinished, it was determined that the cause was a participant misconception regarding the UOS, and not an error of the application design. Thus, the effectiveness results would have risen to 98.60% regarding UOS completion without considering this aspect.
Another effectiveness related remarkable issue is that application occasionally crashed due to WiFi connectivity breaks. Using a 3G connection in the field study would have solved most or all of connection breaks and, as a consequence, the related application crashes. The evaluators decided to perform evaluations just using WiFi connections, as the user model indicated students mainly used WiFi instead of 3G connections. The evaluators checked all the proper 3G coverage for all the building provided by two major mobile Internet connection vendors.
The main problem regarding WiFi connection breaks was found in the UOS involving people information search (UO12), and not in the ones related to building plans (UO2 and UO8). Previous usability evaluations identified the need of labelling the plans and colouring its different locations depending on their type (classrooms, laboratories, teachers’ offices, seminar rooms, etc.). Having this information in the mobile application allowed to locate spaces in the building plans with no Internet connection. That is to say, the functionalities to visualize all building plans in UO2 make it possible to meet the needs of locating a space in the building plans. Although the space location needs are more quickly met by the functionalities designed in UO8, in the cases of WiFi breaks this problem was partially solved. On the other hand, as the information about the faculty staff is only available in the server (due to security concerns), WiFi breaks affected users’ performance in those dynamic UOS in which people information access was required (S6, S10 and S11).
The occasional WiFi connection breaks while performing dynamic UOS has allowed uncovering an error that otherwise would have been impossible to detect. When the application is showing some information of a person and WiFi connectivity breaks, the application shows a screen in which it substitutes the person’s data by two constant wrong texts, “Medium Text” and “TextView”. Figure 5 shows both the correct screen (left side) and the erroneous screen shown when WiFi connection is lost (right side). Generally, the participants were able to overcome the problem simply by moving to an area with WiFi coverage. Changing the phone orientation also proved to be helpful for the application to recover automatically. Finding this problem was only possible by performing the field study with dynamic UOS, as defining a proper evaluation protocol for simulating it in a laboratory setting would have been complicated.
Figure 5. Person information screen (left image) and the same screen when WiFi connection is lost (right image)
Regarding the six efficiency measures collected, we have covered a wide range of circumstances (see section 3). The possibility of gathering information related to orientation change by logging user activity seemed to be promising. However, the lack of a proper way to determine which orientation changes occurred voluntary (participants changed mobile phone screen on purpose) and which not (the orientation changed automatically while the participant was moving without noticing) undermines the feedback this measure could provide. Determining voluntariness is not possible just from user logs but it also requires completing this information with the evaluators’ comments and observations registered during the field study.
168

The displacements by non-optimal routes performed by participants are directly related to the lack of proper labelling at the faculty. For instance, in S7 participants had to locate a space that required opening a door that was in the path to destination. Figure 6 shows the building plan with the first door (Figure 6, right side) and the door corresponding to the desired locations (Figure 6, left side). Both doors were marked with arrows on the building plans (Figure 6, centre). In some cases, this first door was opened but it was closed in others; or the location door was not properly labelled (Figure 6, left side). Therefore, some participants found that, although they were convinced they had achieved the door that would lead them to the destination, they were not able to confirm it. All these problems derived in more time spent in S7, more interactions performed on the application and more search activities processed, compared with its equivalent S4 static UOS. Therefore, one of the outcomes of this field study is that contextual elements of the physical location have influenced participants’ performance.
Figure 6. Solving S7: destination door (left), previous door (right) and 1st floor building plan (centre)
User logs allow detecting the number of interactions and time spent to really reach a user desire (UO). That is especially important in applications when those aspects are critical. In the field study we have shown how during search and physical location, the time and number of interactions have increased significantly in comparison with equivalent static UOS. Increasing the spent time is foreseeable, as dynamic UOS require physical displacement between different floors of the building. However, the gathered usage information indicates the usage pattern varies for similar activities; that is, participants use the application in different ways for activities that would require the same use of the application. For instance, S5 and S9 show remarkably different behaviours in terms of Touch Scroll (means: S5=17.85, S9=48.15), performed searches (means: S5=1.62, S9=7.23) and interactions (means: S5=2.08, S9=3.85).
Numerical results obtained from the ASQ satisfaction questionnaire surpassed previous results obtained from CSUQ questionnaire [13] in a laboratory setting. After normalizing the latter results, ASQ items obtained a score of 8.5 points out 10, while CSUQ questionnaires obtained a score of 8.09 out of 10. Although the results of both questionnaires are not directly comparable, as both questionnaires are different and were performed on different versions of the application, we found users’ satisfaction has increased slightly. ASQ was used in the field study instead of the previously used CSUQ because it allows a quicker gathering of users’ satisfaction information. Besides, as in the field study participants had to move and would be more tired than in a laboratory evaluation, it was decided that making them fulfil a shorter questionnaire was more appropriate.
5. CONCLUSIONS AND FUTURE WORK In this paper we have presented the results of a field study performed in a mobile context dependant application developed using agile methodologies. A total of eleven User Objective Scenarios (UOS) were designed and thirteen end users participated in the evaluation session. The UOS designed were divided into two sets, for static UOS and dynamic UOS. These scenarios have allowed us performing comparative studies within the field study and also with previous evaluations. The usability evaluation techniques used were identical in all scenarios. The relevant aspects of user satisfaction were captured during the evaluation session by means of users’ comments and by an after questionnaire interview. Generally speaking, simplicity, use easiness and quick response of the application have been positively valued aspects.
Thanks to field study we have detected:
1. Participants use the application in a different way for activities that would require the same kind of use. The usage information gathered from performing static and dynamic UOS clearly indicates the usage pattern varies for similar activities.
2. The contextual parameters have influenced the participants’ performance. These parameters are: displacement paths inside the building, spatial points where the WiFi connection is lost, doors closed or without appropriate labelling, and not updated building plans labelling.
3. The filed study has allowed uncovering errors that otherwise would have been more difficult or impossible to detect in laboratory settings.
4. Some specific features of mobile devices, such as the shift of mobile orientation can be better controlled in lab, as the physical movement of the user has an impact on the number of reversals. The voluntary changes from the user can be easily collected in laboratory.
We have to remark that usability evaluations have been integrated satisfactorily with agile methodologies in a consistent manner; as well as, the field study fits the incremental needs of the agile developments. Lessons learned by performing the current field study have implications regarding its integration in agile software development methodologies:
1. A field study should be performed just when the application state has reached an adequate progress in order to design realistic scenarios according to the final use.
2. Designed scenarios must include user activities that allow discovering contextual parameters that affect the application use. In this regard, designing dynamic and complex scenarios is a good premise.
3. Field studies must be conducted at different times with different participants. This way, it is more likely to discover contextual parameters related to unexpected contextual changes.
4. Unnecessary slowdowns in the application development should be avoided. First, experts’ evaluations and laboratory experiments should be considered because they faster allow detecting many usability problems. Then, field studies should group different evaluations at the same time to benefit from the effort required.
The work here described is still in progress. The statistical analysis of the obtained data is intended to be helpful to estimate
169

the optimal number of users required for field studies in the development process iterations. On the other hand, the user activity log analysis performed in this study will help refining log filtering processes. In fact, some aspects such as the loss of connectivity and application crashes have already been detected from log information. In addition, the inclusion of other advanced efficiency measures, such as the looseness, is being studied. Besides, the use of mobile usability questionnaires in the frame of agile development iterations is being considered. Limitations of currently available mobile questionnaires regarding touchscreens and contextual factors related issues are aspects that need further research. Finally, there is a work in progress in which the same agile methodology is being applied to develop a web version of proposed application. In this work, it is foreseen to extend the system to different buildings in the university by integrating their building plans. The integration is expected to be fast, as the core of the system infrastructure is basically the same. Additionally, as many UO are reused, the authors believe that a comparison with the mobile application will provide interesting new data regarding UO reusability among different projects.
6. REFERENCES [1] Agile Alliance:: Home: http://www.agilealliance.org/.
Accessed: 2014-04-14.
[2] Ambler, S.W. 2004. The object primer: agile modeling-driven development with UML 2.0. Cambridge University Press.
[3] Anderson, D.J. 2004. Agile management for software engineering: applying the theory of constraints for business results. Prentice Hall Professional Technical Reference.
[4] Dey, A.K., Abowd, G.D. and Salber, D. 2001. A Conceptual Framework and a Toolkit for Supporting the Rapid Prototyping of Context-aware Applications. Hum.-Comput. Interact. 16, 2 (Dec. 2001), 97–166.
[5] Dix, A. 2003. Human-computer interaction. Pearson/Prentice-Hall.
[6] Highsmith, J.A. 2002. Agile Software Development Ecosystems. Addison-Wesley Professional.
[7] Hussain, Z., Slany, W. and Holzinger, A. 2009. Current State of Agile User-Centered Design: A Survey. HCI and Usability for e-Inclusion. A. Holzinger and K. Miesenberger, eds. Springer Berlin Heidelberg. 416–427.
[8] ISO 9241-11:1998 - Ergonomic requirements for office work with visual display terminals (VDTs) -- Part 11: Guidance on usability: http://www.iso.org/iso/catalogue_detail.htm?csnumber=16883. Accessed: 2014-04-15.
[9] Kaikkonen, A., Kallio, T., Kankainen, A. and Cankar, M. 2005. Usability testing of mobile applications: A comparison between laboratory and field testing. Journal of Usability Studies.
[10] Kjeldskov, J., Skov, M.B., Als, B.S. and Høegh, R.T. 2004. Is It Worth the Hassle? Exploring the Added Value of Evaluating the Usability of Context-Aware Mobile Systems in the Field. Mobile Human-Computer Interaction - MobileHCI 2004. S. Brewster and M. Dunlop, eds. Springer Berlin Heidelberg. 61–73.
[11] Larman, C. 2004. Agile and iterative development: a manager’s guide. Addison-Wesley.
[12] Lewis, C. Using the “thinking Aloud” Method in Cognitive Interface Design. IBM T.J. Watson Research Center.
[13] Lewis, J.R. 1995. IBM Computer Usability Satisfaction Questionnaires: Psychometric Evaluation and Instructions for Use. Int. J. Hum.-Comput. Interact. 7, 1 (Jan. 1995), 57–78.
[14] Lindgaard, G. 1994. Usability Testing and System Evaluation: A Guide for Designing Useful Computing Systems. Nelson Thornes.
[15] Losada, B., Urretavizcaya, M., Fernández-Castro, I. A guide to agile development of interactive software with a “User Objectives”-driven methodology”. Science of Computer Programming, 78(11) (November 2013), 2268-2281.
[16] Losada, B., Urretavizcaya, M., López-Gil, J.M., Fernández-Castro, I. Applying Usability Engineering in InterMod Agile Development Methodology. A Case Study in a Mobile Application. Journal of Universal Computer Science, 19(8) (2013), 1046-1065
[17] Manifesto for Agile Software Development: http://www.agilemanifesto.org/. Accessed: 2014-03-18.
[18] Mayhew, D.J. 1999. The usability engineering lifecycle: a practioner’s handbook for user interface design. Morgan Kaufmann Publishers.
[19] Memmel, T., Gundelsweiler, F. and Reiterer, H. 2007. Agile Human-centered Software Engineering. Proceedings of the 21st British HCI Group Annual Conference on People and Computers: HCI...But Not As We Know It - Volume 1 (Swinton, UK, UK, 2007), 167–175.
[20] Nielsen, C. 1998. Testing in the Field.
[21] Nielsen, C.M., Overgaard, M., Pedersen, M.B., Stage, J. and Stenild, S. 2006. It’s worth the hassle!: the added value of evaluating the usability of mobile systems in the field. (2006), 272–280.
[22] Preece, J., Rogers, Y., Sharp, H., Benyon, D., Holland, S. and Carey, T. 1994. Human Computer Interaction. Addison Wesley.
[23] Rogers, Y., Connelly, K., Tedesco, L., Hazlewood, W., Kurtz, A., Hall, R.E., Hursey, J. and Toscos, T. 2007. Why It’s Worth the Hassle: The Value of In-situ Studies when Designing Ubicomp. Proceedings of the 9th International Conference on Ubiquitous Computing (Berlin, Heidelberg, 2007), 336–353.
[24] Tamminen, S., Oulasvirta, A., Toiskallio, K. and Kankainen, A. 2004. Understanding Mobile Contexts. Personal Ubiquitous Comput. 8, 2 (May 2004), 135–143.
[25] Tullis, T. and Albert, W. 2013. Measuring the user experience collecting, analyzing, and presenting usability metrics. Morgan Kauffmann/Elsevier.
[26] Xu Sun and Andrew May 2013. A Comparison of Field-Based and Lab-Based Experiments to Evaluate User Experience of Personalised Mobile Devices. Advances in Human-Computer Interaction.
[27] Zhang, D. and Adipat, B. 2005. Challenges, Methodologies, and Issues in the Usability Testing of Mobile Applications. International Journal of Human-Computer Interaction. 18, 3 (2005), 293–308.
170

How to classify to experts in usability evaluation Federico Botella
Center of Operations Research University Institute
Miguel Hernandez University of Elche Elche, Spain
Eloy Alarcon Statistics, Mathematics and
Informatics Department Miguel Hernandez University of Elche
Elche, Spain [email protected]
Antonio Peñalver Center of Operations Research
University Institute Miguel Hernandez University of Elche
Elche, Spain [email protected]
ABSTRACT Usability inspections are a set of methods for evaluating one interactive system by experts. They try to find possible usability problems and determining the level of usability of the system without involving real users. One of these methods is heuristic evaluation, where several experts inspect one system or its interface for searching usability issues. Some authors maintain that evaluation by experts in usability discovers more usability issues than evaluation conducted by non-experts. But the question is how to determine the degree of expertise of an evaluator.
In this paper we will propose a classification of evaluators based on the university degree obtained or the number of hours of practice gathered in this field. One user could be classified as expert depending on his/her professional career and not only by university degrees. This is why it is important to collect other attributes of each user like domains, skills or projects to determine their expertise. We finally present how to validate these attributes by other users of the proposed repository.
Categories and Subject Descriptors H. 5.2 [Information Interfaces and Presentation]: User interfaces - Evaluation /methodology
General Terms Measurement, Human Factors.
Keywords Usability evaluation, usability expert, become expert.
1. Introduction The concept of usability has been broadly studied in the field of human computer interaction. One of the first authors who defined the concept of usability was Shackel [17]. In 1981 he defined usability as the ability of one system to be used easily and effectively by certain users to accomplish concrete tasks in a concrete environmental scenario. This definition has been widely used later and several authors have also improved it.
Nielsen considered usability as a feature that has influence in the product acceptance [14]. He defined usability based on five attributes: learnability (the system is easy to learn), efficiency (the system is efficient to use), memorability (the system is easy to
remember), low error rate (the system permits user to make few errors during the use) and satisfaction (the system is pleasurable to use). The standards organization ISO introduced in Part 11 of the international standard ISO 9241 (Ergonomic Requirements for Office Work with Visual Display Terminals) [12] some guidelines on usability, introducing requirements and recommendations to be used during design and evaluation of a system. Recently the ISO/IEC 25010:2011 defines usability as one of the eight characteristics of a system/software product quality [13], which is subdivided into the following subcharacteristics: appropriateness recognisability, learnability, operability, user error, user interface aesthetics and accessibility.
Several authors have contributed to improve the concept of usability reformulating their methods both product design and software development: Schaffer wrote a complete guide to making usability a routine within an enterprise, be it commercial or government [16]. Constantine & Lockwood proposed several models and methods focused on software development, keeping usability as key factor inside the UCD methodology [2]. Beyer & Holtzblatt defined a new approach to UCD but focused on business client [1].
Many universities offer degrees, masters and doctoral programs about HCI for a long time, whereas many companies are hiring professionals on usability for many years. We can find professional associations in the field of HCI worldwide, like the Professional Association of the Usability (UXPA) [21] or the Spanish Association of Interacción Persona-Ordenador (AIPO) [20] that are promoting the usability in the fields of business environments and education, whether through the publication of a digital magazine dedicated to promote and enhance the practice, research and education of user experience design and evaluation, or through teaching materials and a digital book about HCI.
We can say that usability is established in our society but we are not sure when you can assert that one professional can be considered an expert in the field of usability. Can we consider that one person with a master or undergraduate degree in the field of HCI is an expert in usability evaluation? What abilities and skills are needed to become an expert in usability evaluation? In this work we will try to define these skills and we will propose a classification of experts in usability evaluation so that one novice user can know the way to reach the expert level.
The rest of the article is organized as follows: Section 2 presents related works about the concept of expert from other fields; Section 3 collects the characteristics an expert should have in usability evaluation according to our understanding; Section 4 presents our proposal of classification of experts in usability
Permission to make digital or hard copies of all or part of this work for personal or classroom use is granted without fee provided that copies are not made or distributed for profit or commercial advantage and that copies bear this notice and the full citation on the first page. To copy otherwise, or republish, to post on servers or to redistribute to lists, requires prior specific permission and/or a fee. Conference'10, month 1-2, 2010, City, State, country. Copyright 2010 ACM 1-58113 -000-0/00/0010 … $15.00.
171

evaluation. Section 5 concludes the paper and describes the future work.
2. BACKGROUND. RELATED WORK Merriam Webster dictionary defines expert as “a person who has special skill or knowledge relating to a particular subject” while Wikipedia defines “an expert as someone widely recognized as a reliable source of technique or skill whose faculty for judging or deciding rightly, justly, or wisely is accorded authority and status by their peers or the public in a specific well-distinguished domain”.
But how one person can get that skill or knowledge? Simon and Gilmartin proposed a learning model for chess players called MAPP (Memory-aided Pattern Perceiver), which simulates the behavior of ClassA chess players (good amateurs) in the recall task by first recognizing chunks on the board through a discrimination net [19]. According to Simon and Gilmartin, 50,000 chunks are required to reach the level of expertise.
In the absence or difficulty to find a criterion to identify an expert, Shanteau and Weiss proposed the method CWS (Cochran-Weiss -Shanteau) which provides a high degree of predictive accuracy in the identification of expert performance [18]. CWS has been successful in a variety of contexts, including research of experts in auditing or high and low-fidelity simulations of air traffic control.
“How do I get a user experience career?” is the key question for the study of Farrell and Nielsen about how to become a UX pro and how to hire one [6]. They surveyed more than one thousand respondents, 90% of them had obtained a university degree. They divided their respondents between people in the beginning of their career (6 or fewer years in a UX-related job) and more experienced staff (7+ years as a UX pro). The majority of UX professionals hold degrees from an immense range of other disciplines, from history to chemistry, most of which don’t have a direct bearing on UX work. The most common educational level was a master’s degree (52%) while only 6% of respondents were PhDs. Most of the remaining respondents with university diplomas held bachelor's degrees and 1% had associate’s degrees.
Ericsson wrote many works about the acquisition of expert performance. In [5] he presented how the principles of deliberated practice established in other domains, such as chess, music, typing, and sports can provide insight into developing expert performance in medicine. In this work we can see how traditional concept of professional expertise based on length of experience, reputation, and perceived mastery of knowledge and skill, only has a weak relationship between these indicators of expertise and actual, observed performance. He demonstrated that expert performance could be traced to active engagement in deliberate practice, where training (often designed and arranged by their teachers and coaches) is focused on improving particular tasks.
We can find in many studies the “rule of 10 years or the 10,000 hours of deliberate practice” that refers to the time required of intensive training and independent study to achieve a level of expert performance. Gladwell defined this rule, based on the studies of Ericsson, as one of the keys to success in many fields as sports, science or fine arts [7]. Through several real-life study cases he showed that innate talent is not is not enough to become an expert and that we can find a correlation between the degree of expert in any discipline and the hours of effort and dedication to that discipline. For example, what Bill Gates, the Beatles and Mozart had in common? Along with talent and ambition, each
enjoyed an unusual opportunity to intensively cultivate a skill that allowed them to rise above their peers.
3. DEFINING EXPERTS What should be the main skills or knowledge necessary to became an expert in usability evaluation? In [9] Gulliksen et al. revealed the relations between the individual usability professional and her background and experiences, the organization in which she operates, the development process and the attitudes and basic values held by the people involved. They concluded that usability professionals must design, i.e. build solutions of interaction design in terms of concepts, structures, content and navigation; must be involved in the system development projects and must be on a strategic level within the organization.
Usability professionals or experts should have a common academic background, and we consider they should acquire the following abilities:
• A deep knowledge in the field of HCI, including human factors and their skills from a psychological and social point of view, user interface design, evaluation and user centered design (following the university curricula proposed by the CS Curricula ACM 2013 [3]).
• Knowledge of the Software Engineering and the system development life cycle process in large-scale projects. And of course, they should be able to communicate and collaborate with other team members.
• Knowledge and skills in the use of methods, techniques and analysis of interviews, surveys and observations with users. They should be skillful in designing test plans and writing good reports.
• They should have capacities in a wide range of disciplines, such as business, computing, design or psychology.
• Knowledge and practice in the filed of design, both user interfaces and visual design guides.
In this paper we propose a new classification of experts in usability evaluation. We consider that one person who wants to become expert in usability evaluation should hold at least a master’s degree, although not necessarily directly related to computer science, information technologies or human-computer interaction. Or s/he should have built up expertise by means of hours of practice in the field of usability evaluation.
In Figure 1 we can see how we can define the different levels one person could reach to become an expert in usability evaluation. The two main parameters to define each level are hours of deliberate practice and university degree reached by the candidate, which are described as follows:
• Hours of deliberate practice: defined as specific work in the field of specialization with the aim of improving the knowledge and practice already acquired. One expert spends a huge amount of hours to improve his/her practice and performance. Deliberate practice is based on:
o Motivation and discipline to perform one task. Sometimes it is not funny to spend many hours of deliberate practice. Psychological and physical efforts are needed to achieve of targets in a medium-long term for improving the performance of the candidate.
172

o Tasks design should be performed taking into account pre-existing knowledge. In this manner tasks can be understood properly after a brief period of instruction.
o Feedback about tasks performed in terms of performance and effort should be provided. Effective learning is difficult to reach without adequate information about performance during practice.
o The same or similar tasks should be performed repeatedly. These occurrences will last for 5 days a week and an average of 6 hours per day.
• University Degrees: There is a wide range of university degrees we can give consideration to define the level of expert in usability: from bachelor’s degree to master’s degree or even doctorate degree. But also many training courses in HCI/UX should be taken into account at the first stages of persons involved with usability evaluation. Today we can find many courses on HCI in the web, some of them free like the course of Alan Dix [10] or the mooc at Coursera of Scott Klemmer [11], but also we can find several portals where one we can find many degrees or certifications in HCI like the website of Human Factors International [8], where you can find a vast list of programs in HCI both degrees and certification programs, or the website of the Online User eXperience Institute, founded by D.J. Mayhew, where you can find a wide list of free and paying courses [15].
Figure 1. Levels of experts in usability evaluation.
We can define the following levels of expert in usability evaluation at our proposed classification based on the concept of expert of Ericson assuming the “rule of 10 years or the 10,000 hours of deliberate practice”:
• Novice: person without a university degree but with at least one training course on HCI and few hours of practice in usability evaluation.
• Beginner: professionals without university degree but with several training courses in HCI or with less than 2,500 hours of practice in usability evaluation.
• Intermediate: professionals with a bachelor’s degree or lees than 5,000 hours of practice in usability evaluation.
• Senior: professionals with master's degree or less than 7,500 hours of practice in usability evaluation.
• Expert: professionals with master's degree, and optionally a doctorate, and with more than 10,000 hours of professional practice deliberate (10 years) in the field of usability evaluation.
4. USING EXPERTS IN USABILITY EVALUATION In this classification of experts in usability evaluation we have defined the steps one person should cover to reach the level of expert as evaluator in the field of usability. On the one hand, we have defined one route following the path of university degrees. As you reach a higher degree (bachelor, master or doctorate) it is clear that many hours of practice have been gained and the candidate could be classified at a higher level in our schema. When you reach the doctoral degree it seems clear that the doctorate could be considered as expert in usability evaluation, undoubtedly if his/her work was related with this subject. But other degrees or doctorates could be considered for classifying one candidate as expert even if the topic of the thesis it was not directly related to HCI/UX, but it was related with near fields as human factors or psychology. On the other hand, the road to the level of expert could be reached from the professional career and one person could reach that level by means of training courses and hours of deliberate practice. There are many professionals, without a university degree, who have become experts in a specific field accumulating hours of practice and expertise in their fields. So this double-way must be taken in account to define this schema.
But we can ask: “Why we need to classify experts in usability evaluation?” One of the primary targets for this classification will be the need to have one repository of evaluators with different levels of expertise. We are working towards a framework where we can quantify the selection of one heuristic or sub-heuristics in a heuristic evaluation by the level of expertise of the evaluator. If we know the level of each evaluator we will be able to compare different usability evaluations of the same interactive system and we could offer to novices a set of the best heuristics or sub-heuristics to conduct his/her next usability evaluation in a concrete context.
We can see in Figure 2 the proposed repository for classifying experts in usability evaluation. In this repository we will introduce the basic data of the candidate regarding to university degree and hours of practice. But we need other aspects like the working domains, skills or reports/projects where the user has acquired certain level of expertise.
When you want to evaluate a concrete interactive system in a concrete complex domain not all evaluators will be able to accomplish this task successfully. The expertise of each evaluator in concrete domains could be a key factor to select one or other evaluator to conduct a usability evaluation with a similar completeness to one evaluation performed by one usability expert.
For those professionals who are starting in the field of usability evaluation (like undergraduate students or master students) could be useful to collect the different skills the user is gathering during his/her training career (both at university or at industry environment). The users could be able to declare his/her skills
173

when s/he registers in the repository, but also s/he will be able to place a badge for validating each one of the skills of others users. In this manner, each candidate could be reinforced by the accreditation of other users on their skills.
Figure 2. Repository of experts and their attributes
Moreover each user will be able to introduce in the repository all the projects as well as all the technical reports (or usability reports) where s/he has participated. Thus we capture valuable information to facilitate the path to those users who want to reach the level of expert along to the professional career.
5. CONCLUSION The definition of expert in one field is a difficult task depending on the area of specialization. The rule of 10 years or the 10,000 hours of deliberate practice has been accepted by many authors in different domains and can be used also to define experts in usability/ux.
In this paper we propose a new classification of experts in usability evaluation based on both the professional career of the candidate and the university degree. Not always its necessary to obtain a degree for entering the profession in some countries. We have also introduced a repository where collect all the information about the experts and candidates as well as the basic attributes for helping novices to climb up to the level of expert.
This classification will be the foundation of the new framework we are developing for aiding novice evaluators in their first heuristics evaluations, since they can consult the better sub-heuristics un different domains used by senior or expert evaluators previously.
6. REFERENCES [1] Beyer, H., Holtzblatt, K., 1998. Contextual Design-Defining
Customer-Centered Systems. Morgan Kaufmann, San Francisco.
[2] Constantine, L. L., Lockwood, L. A. 1999. Software for Use-A Practical Guide to the models and methods of Usage-Centered Design. Addison-Wesley Professional.
[3] Computer Science Curricula 2013 http://www.acm.org/education/CS2013-final-report.pdf
[4] Dreyfus, H. & Dreyfus, S. 2005. Peripheral vision expertise in real world contexts. Organization studies, 26, 5, 779-792.
[5] Ericsson, K. A. 2008. Deliberate practice and acquisition of expert performance: a general overview. Academic Emergency Medicine : Official Journal of the Society for Academic Emergency Medicine, 15,11, 988–94.
[6] Farrel, S., Nielsen, J. 2013. Users experience Careers, How to Become a UX Pro, and How to hire one, Nielsen Norman Group http://www nngroup.com/reports/user-experience-careers/.
[7] Gladwell, M. 2008. Outliers: The Story of Success. Little, Brown and Company. New York.
[8] Graduate Degrees in Software Ergonomics at Human Factors International https://www humanfactors.com/downloads/degrees.asp
[9] Gulliksen,J., Boivie, I. and Göransson, B. 2006. Usability professionals-current practices and future development. Interacting with Computers. 18, 4 (July 2006), 568-600. DOI=10.1016/j.intcom.2005.10.005
[10] Human Computer Interaction Beta. http://hcicourse.com
[11] Human-Computer Interaction Standford Online. http://online.stanford.edu/course/hci
[12] ISO 9241-11. 1998. Ergonomic requirements for office work with visual display terminals (VDTs) Part 11: Guidance on Usability. ISO
[13] ISO/IEC 25010:2011. 2011. System and Software Engineering - Systems and Software Quality Requirements and Evaluation (SQuaRE) - System and Software Quality Models
[14] Nielsen, J. 1993. What is usability? In: What is Usability Engineering. Cambridge MA: Academic Press.
[15] Online User eXperience Institute. http://www.ouxinstitute.com/Curriculum/CourseList/index.php
[16] Schaffer, E. 2004. Institutionalization of usability: a step-by-step guide. Addison-Wesley Professional.
[17] Shackel, B., 1981. The concept of usability. Proceedings of IBM software and information usability symposium, Poughkeepsie, NY, 15-18 September, 1-30
[18] Shanteau, J., Weiss, D. J., Thomas, R. P., & Pounds, J. C. 2002. Performance-based assessment of expertise: How to decide if someone is an expert or not. European Journal of Operational Research, 136, 2, 253-263.
[19] Simon, H. A., & Gilmartin, K. 1973. A simulation of memory for chess positions. Cognitive psychology, 5, 1, 29-46.
[20] Spanish Association Interacción-Persona Ordenador. http://www.aipo.es
[21] User Experience Professionals Association. https://uxpa.org
174

A Usability Study Case of a Vision-Based Gesture Interface
Pere Ponsa, Carlos Urbina Automatic Control Department
Universitat Politècnica Catalunya, Av. Víctor Balaguer, 1
08800, Vilanova i la Geltrú Spain (+34) 938967231 {pedro.ponsa,
carlos.urbina}upc.edu
Cristina Manresa-Yee Computer Graphics, Computer
Vision and AI Group University of Balearic Islands,
Crta. Valldemossa km 7.5, 07122, Palma, Spain
(+34) 971259721
Ramon Vilanova Engineering Systems and
Telecommunications Department School of Engineering
Universitat Autònoma Barcelona 08193, Bellaterra, Spain
(+34) 935812197 [email protected]
ABSTRACT Gestural interaction uses human gestures to interact with an interactive system. Many efforts have been done to define gestures and facilitate a comfortable and natural way to interact. In this paper an experimental session in laboratory conditions is presented aiming at analyzing the usability factors of a vision-based gestural interface. Based on the results, recommendations are given to modify the configuration of some parameters between the human, the Kinect sensor, Kinect Mouse and the virtual visit of a museum with the final aim to improve the overall interaction.
Categories and Subject Descriptors H.5.2. Information interfaces and presentation: User Interfaces – Interaction styles, evaluation/methodology, user-centered design
General Terms Measurement, Design, Experimentation, Human Factors.
Keywords Vision-based interfaces, usability, gestures, evaluation
1. INTRODUCTION There is interesting research in the topic of gesture user interface and the use of the Kinect sensor. For instance, Pino et al. proof the performance evaluation using Kinect for 2D and 3D pointing tasks [1]. This work is based on the ISO 9241-9 standard methodology (Fitts law, Multi dimensional tapping task) and show that the Throughput for 3D tasks using Kinect is better than the use of mouse. In this paper the user experience is related for seven participants (measure of movement time), nevertheless usability is not measured. Parra researcher had developed a comparison study between non-conventional input devices (for instance Kinect sensor) in virtual environments [2]. This work is based in ISO 9241-9 standard methodology again. In addition to Fitts Law and Throughput, this author adds qualitative information of physical fatigue of hand and finger from the
questionnaire of overall usability ISO 9241-9 (Annex C).
Bailly et al. show a new perspective on hand gestures and wearable applications [3]. This work is based on the ISO 9241-9 standard methodology (Fitts Law, Multi dimensional tapping task). To measure physical demand, these authors used the Annex C of the ISO 9241-9. A user/usability study is presented taking into account that mental demand is measured with the NASA TLX questionnaire and social acceptability is measured using questionnaire. Schwaller et al. measuring the effect of selection strategies on free-hand pointing performance and effort [4]. This work is based in ISO 9241-9 standard methodology. In addition to Fitts Law, Multi directional tapping test and Throughput, these authors add an usability study with twelve participants obtaining statistical information of overall performance from the ISO 9241-0 Annex C questionnaire. On a previous work, Manresa-Yee et al. compiled usability factors and metrics for vision-based interfaces and classified them using the three attributes included in the ISO 9241-11, the international standard on Ergonomic Requirements for Office Work with Visual Display Terminals (VDTs), Part 11: “Guidance on usability”: efficiency, effectiveness and satisfaction [5], [6].
The structure of the paper is as follows. The second section explains materials and methods and includes details of the experimental session in laboratory conditions. The fourth section describes the results taking into account usability factors considered when evaluating vision-based gesture recognition and the metrics used to measure those factors. Furthermore, these factors are classified using the ISO 9241-11 attributes: efficiency, effectiveness and satisfaction. The final section summarizes the key findings and concludes the paper.
2. MATERIALS AND METHODS The interactive system and the experimental session created in this paper are presented in the next subsections.
2.1 Interactive system The system is composed by the Kinect sensor, the Kinect Mouse and a wall screen application (virtual visit of the Catalonia Railway Museum) [7]. The virtual visit is composed by a set of five wagons, each wagon has four windows. Each window’s wagon is a new screen. The user can navigate into screens and understand the indoor and outdoor parts of the Museum. Each screen has additional information, for instance, historic details about Spanish trains, the relationship between other similar European Museums and how the Railway evolution has influenced the changes in our society.
Permission to make digital or hard copies of all or part of this work for personal or classroom use is granted without fee provided that copies are not made or distributed for profit or commercial advantage and that copies bear this notice and the full citation on the first page. To copy otherwise, or republish, to post on servers or to redistribute to lists, requires prior specific permission and/or a fee. INTERACCIÓN’ 2014 Conference, Sep 10–12, 2014, Puerto de la Cruz, Tenerife, Spain. Copyright 2014 ACM ISBN 978-1-4503-2880-7 $15.00.
175

The Kinect sensor for PC used in this interactive system is composed by the sensor and the Kinect for Windows SDK 1.8 and the related tool Microsoft Visual Studio Express 2012 [8].The Kinect Mouse Cursor by CodePlex is a demo application that uses the Kinect for Windows SDK and its skeletal tracking features enables users to use their hands to control the Windows mouse cursor [9]. The user could use the two arms as mouse functions. Rising and lowering the left arm is the left click mouse. Moving to the right or to the left the right arm moves to the right or to the left the pointer on the screen. The screen is projected on the wall. In the Railway virtual visit: the user can move the point of view and can choose a wagon train to explore it. Each wagon is a button and the user which offers access to another screen.
2.2 Experimental session The experimental session to evaluate the system was performed in a laboratory at the beginning of this year. The users were a set of 9 international students (four males, five females), aged between 21 and 24 years old.
2.2.1 Procedure A development team member is the facilitator, who conducts the evaluation session with each user. At the beginning of the session, the facilitator explains the use of the system and places the user correctly, that is, three meters in front of the Kinect sensor. Then, the facilitator demonstrates how to use the system and allows the user to train for a moment with the system. Next the facilitator explains the instruction which comprises two main tasks:
Task 1 (estimated time: 120 seconds):
- Press the Green light and select the train wagon number 5.
- Please choose one window wagon. You can move around this new screen.
- Press again the Green button and select wagon number 1.
- Please choose second window wagon. You can move around this new screen.
Task 2 (estimated time: 120 seconds): Please, feel free to move inside the entire virtual visit.
At the end of the session, the facilitator concludes the experimental session and the user answers the System Usability Scale (SUS) questionnaire [10] a ten-item attitude Likert scale which gives a global view of the user’s subjective assessments of usability and the ISO 9241-9 questionnaire related to operation, fatigue, comfort and overall usability [11].
3. RESULTS A brief definition of efficiency, effectiveness and satisfaction:
Effectiveness refers to task performance; how accurately and completely did the user achieve the goals?
Efficiency is the amount of effort that is required to achieve the level of effectiveness when achieving the goals. Efficiency is the relationship between effectiveness level and resource consumption.
Satisfaction refers to how comfortable the user feels while using the system.
3.1 Effectiveness Effectiveness in vision based interfaces evaluation is assessed mostly by measuring the accuracy and the error rate of the interfaces, which are quantitative measurements.
3.1.1 Accuracy and Error rate Accuracy is the correctness in recognizing the gestures performed by the user. This factor is related with the robustness and precision of the computer vision techniques. This factor is frequently tested and is an indicator of the gesture uniqueness [12], that is, if a gesture is similar to another one, the system can misinterpret it and trigger a wrong action.
Errors are related with the accuracy and we can distinguish two kinds of errors:
Misinterpreted gestures within the set of possible gestures, which would be related with the uniqueness.
Gestures that are not understood, which could be related with the robustness of the computer vision techniques.
A gesture that is not recognized requires repetition, but a gesture which is misrecognized needs to be corrected. In this case, both parameters could be evaluated individually.
A metric frequently used to evaluate accuracy is to control the number of correct recognized gestures regarding the total number of performed gestures [13]. In this paper, a new metric is presented. In this case this metric is not related with the robustness of the computer vision techniques and is related with the point of view of the facilitator when is watching the user doing an action. During the experimental sessions we took photos and record a short video of the user’s session. Using Kinect Mouse there are gestures to recognize: right arm moving to the left or to the right allows the user to move the pointer on the screen along the same horizontal axis, and raising and lowering the left arm allow us to develop the click mouse (left button). The combination of two gestures (for instance left arm up and move the right arm to the right) allows the user to move the panoramic view along the right direction. The accuracy for the correct gestures was measured using eq. 1.
(Eq.1)
Where is the number of gestures recognized by Kinect Mouse: four. And is the total number of gestures developed by the user. We’re not calculating the frecuency: number of times that the user is doing a gesture. For instance for users three and seven the accuracy is one: these users don’t do incorrect gestures. For users eight and nine, the accuracy is 0,57: these users besides doing the correct gestures they do three bad gestures that Kinect Mouse don’t recognize and the virtual visit is waiting a correct gesture again.
Task effectiveness is related with the success rate. In this context, task effectiveness is high (equal 1) if task 1 and task 2 are correct, there aren’t gestures to avoid (a=1) and the user doesn’t need help
Task effectiveness is medium when one task is wrong, some gestures must avoid (a<1) and user needs help.
Task effectiveness is low when the two tasks are incorrect, some gestures must be avoided (a<1) and user needs help (poor understanding of the instruction, poor arm movement related to the Kinect Mouse actions).
176

Table 1. Task Effectiveness, Where a correct task is ok, an incorrect task is x, a<1 means that some gestures must be
avoided, help means that the user needs the help of the facilitator during the experimental session and Effe is task
effectiveness
User T1 T2 a<1 Help Effe U1 x ok Yes
(0,67) No Medium
U2 ok ok Yes (0,80)
Yes Medium
U3 ok ok No (1)
No High
U4 x x Yes (0,67)
Yes Low
U5 x ok Yes (0,67)
No Medium
U6 ok ok Yes (0,67)
No Medium
U7 ok ok No (1)
No High
U8 x ok Yes (0,57)
Yes Low
U9 x ok Yes (0,57)
Yes Low
3.2 Efficiency When assessing efficiency, different measurements are used such as the user’s physical and mental effort, duration of the gesture or memorability/learnability.
3.2.1 Physical fatigue When interacting with body movements, fatigue or tiredness can appear, especially if the gesture is physically demanding. Gestural commands must be concise, fast and avoid gestures that require a high precision over a long period of time in order to minimize effort [14].
Fatigue is a difficult attribute to measure because is user-dependent. The metrics that have been used are usually questionnaires using Likert-scales. The annex C included in ISO 9241-9 which recommends a comfort questionnaire that comprises thirteen 5-point interval Likert scale questions about the levels of comfort and effort that are involved in the system's operation such as finger, wrist, arm, shoulder or neck fatigue. In the experimental task presented in this paper there is no evidence about physical effort in fingers, wrist or neck, however, the arm fatigue is clear in some users: for five out of nine users the arm fatigue is high or very high.
The Fig 1 shows the user2 in action. The effectiveness is medium because tasks are carried out successfully and the user doesn’t need help. However, the efficiency due to the fatigue factor is low: the input command gesture must be redesigned because the arm is not in a comfortable position. The user2 could perform the test in a more relaxing arm position. Talking with the user at the end of the session, she explained that the left arm and shoulder fatigue is too high. The Kinect Mouse can be configured to be adapted to left or right handed users, for this reason it’s necessary to ask this question to the user in the preliminary steps of the experimental session
Other way to mesure efficiency is taking into account the duration time of the task. In the experimental session explained in this paper, the duration time is fixed: the facilitators give four minutes (total time) to develop two tasks (two minutes per task).
Regarding the cognitive load, that is, the mental effort required to develop this experimental task is low (only one user out of nine users thinks that the mental effort is high) taking into account the answers from the comfort questionnaire in ISO 9241-9. For this reason in this work the NASA –TLX methodology is not applied.
From the point of view of Learnability, or time to learn, the system is easy to learn. The instruction is easy to understand and the use of the two arms (as click mouse and pointer movement) is clear. Most users could control the system with a correct level of performance. Only three users (user4, user8, user9) had more problems to execute correct gestures and control the system: however, they could stop the gesture, listen to the facilitator and begin again without difficulty.
In this experimental task it’s not necessary a big effort in Memorability. There are only four gestures to memorize. There is a main screen, the user listen to the facilitator and he can move through the application (the application has two deep levels and the navigation between screens is easy).
3.3 Satisfaction Most of the factors classified under the satisfaction attribute are evaluated by using user questionnaires to capture the subjective users’ feelings towards the interface. In this work, comfort, easy of use and system usability scale are measured. Comfort is defined as a pleasant feeling of being relaxed and free from pain. For four out of nine users the system is uncomfortable. An further analysis is necessary to define a comfort zone taking into account the user comfort arm angles.
Ease of use, easy-to-use or easiness, means that the user needs little effort to operate with the system. Based on the ISO 9241-9 and the answers given to the question if the input device is easy to user, six out of nine users find the system easy to use.
Other way to obtain the perception of comfort, ease of use and satisfaction is the use of the System Usability Scale (score from 0 to 100). At the end of the experimental session the average SUS score is 60,5 and average standard deviation is 11,4.
4. CONCLUSIONS In this work a usability study case of a vision based gesture interface is presented to navigate in a virtual visit of a Railway
Figure. 1. User2, Wrong gesture of right arm. The left arm is located in a fatigued position.
177

museum. Analyzing these previous results, we could review the materials and methods section: change environment parameters (physical distance to Kinect sensor), change parameters and constants in Kinect Mouse, with the purpose to improve comfort aspects when users perform the tasks. In relation with the subsection 2.1 Interactive system: there are no lighting sources above the Kinect sensor (no other source of light except for the wall screen brightness). The height of users ranged from 1.60 meters to 1.93 and the Kinect sensor works properly when the distance between the sensor and the user is 290 +/- 10 centimeters far. At this distance the user is correctly detected and can perform the task. The floor distance of the Kinect sensor is 100 centimeters. The wall distance to the Kinect sensor is 122 centimeters. At the beginning of the session, the facilitators should ask the user if he is left or right handed to configure the Kinect Mouse. In future museum scenarios, is mandatory to develop an automatic algorithm that configures this feature (left or right handed).
At the end of the experimental session explained in the 2.2 subsection, we have a set of recommendations. Kinect Mouse has a set of constants and parameters that could be modified to achieve a more natural interaction. For instance, ClickThreshold has been reduced by 28% his initial value in the experimental session. The user can perform the mouse click making less left arm angular displacement (the maximum angle of the arm is now 130 in relation to the maximum initial angle of 180). It can also be applied a scaling factor on the window that captures the human skeleton, SkeletonMaxX and SkeletonMaxY so the x axis can be reduced 40% of its initial value, and the y axis can be reduced by 20 %: the user could arrive to the all corners of the virtual visit application with less effort.
The ISO-9241-9 questionnaire gives us additional information related to smoothness and accuracy of the input device.
Regarding smoothness, the questionnaire answer indicates that the smoothness is rough (three out of nine users) and very rough (one out of nine users). To change this perception the smoothing parameter has changed (a 69% reduction of the initial value). This smoothness reduction does not affect latency (the user could develop the experimental session without a noticeable delay between arm movement and effective action on the screen) [15].
Regarding the input device accuracy, the questionnaire answer shows that the accuracy pointing was difficult (four out of nine users) or very difficult (two out of nine users). With the aim to improve this factor, we had decided increase the pointer size (mouse properties). The user could reach a target with less effort and less duration time.
With the laboratory study finished, future work will be to improve the set of metrics used taking into account the standard ISO/IEC 25010 [16] with the purpose to create a quality in use model and analyze this vision-based gesture interface in the Catalonia Railway Museum and with real visitors. In this field study it is necessary to design new virtual applications and take into account other important aspects such as the users’ emotional interaction.
ACKNOWLEDGMENTS This work was supported by Ajudes grup competitiu UGIVIA 28/2011 granted by the Govern de les Illes Balears, and TIN12-35427 granted by the Gobierno de España.
REFERENCES [1] Pino, A. , Tzemis, E., Ioannou, N. and Kouroupetroglou G.
2013. Using Kinect for 2D and 3D pointing tasks:
performance evaluation. In M. Kurosu (Ed.): Human-Computer Interaction, Part IV, HCII 2013, LNCS 8007, 358–367.
[2] Parra, M.A. 2012. Comparación de dispositivos de entrada no convencionales en entornos virtuales. Universidad . Tesis de grado. Universidad Nacional de Colombia.
[3] Bailly, G., Müller, J., Rohs, M., Wigdor, D. and Kratz, S. ShoeSense: A New Perspective on Hand Gestures and Wearable Applications. In Proceedings of CHI’12, May 5–10, 2012, Austin, Texas, USA.
[4] Schwaller, M. and Lalanne. D. 2013. Pointing in the air: Measuring the effect of hand selection strategies on performance and effort. In Proceedings of International Conference on Human Factors in Computing & Informatics, SouthCHI, Maribor, Slovenia.
[5] Manresa-Yee, C., Amengual, E and Ponsa, P. 2013. Usability of visión based interfaces. In Proceedings of CEDI 2013, Interaccion 2013 International Conference, Madrid.
[6] ISO. 1998. ISO 9241-11:1998 Ergonomic requirements for office work with visual display terminals (vdts) – part 11: guidance on usability.
[7] Grande, A. 2014. A museum showing off 160 years of railway history. Catalonia Railway Museum. URL: http://www.museudelferrocarril.es/en/english-version, last visited 4 th April 2014.
[8] Microsoft. Kinect for Windows. Developer center. http://www.microsoft.com/en-us/kinectforwindowsdev/Downloads.aspx
[9] CodePlex. KinectMouse. http://kinectmouse.codeplex.com/
[10] Brooke, J. 1996. SUS: a "quick and dirty" usability scale. In P. W. Jordan, B. Thomas, B. A. Weerdmeester, & A. L. McClelland. Usability Evaluation in Industry. London: Taylor and Francis.
[11] ISO. 1998. ISO 9241-9:2000 Ergonomic requirements for office work with visual display terminals (vdts) – part 9: Requirements for non-keyboard input devices.
[12] Barclay, K., Wei, D., Lutteroth, C. and Sheehan, R. 2011. A quantitative quality model for gesture based user interfaces. In Proceedings of the 23rd Australian Computer-Human Interaction Conference, 31-39
[13] Waldherr, S., Romero, R. and Thrun, S. 2000. A gesture-based interface for human–robot interaction. Autonomous Robots 9
[14] Baudel T. and Beaudouin-Lafon, M. 1993. Charade: remote control of objects using free-hand gestures. Commun. ACM 36, 7, 28-35.
[15] ISO 2011. Systems and software engineering -- Systems and software Quality Requirements and Evaluation (SQuaRE) -- System and software quality models ISO/IEC 25010:2011. At URL: , last visited 27 th May 2014
[16] Azimi, M. 2014. Skeletal Joint Smoothing White Paper. Microsoft Developer Network. At URL: http://msdn.microsoft.com/en-us/library/jj131429.aspx last visited, 11 th April 2014
178

A Case Study on Cross-Platform Development Frameworks for Mobile Applications and UX
Esteban Angulo
DLSIIS - ETSI Informáticos Universidad Politécnica de Madrid
Campus de Montegancedo s/n E-28660 - Boadilla del Monte (Madrid)
Xavier Ferre
DLSIIS - ETSI Informáticos Universidad Politécnica de Madrid
Campus de Montegancedo s/n E-28660 - Boadilla del Monte (Madrid)
ABSTRACT Cross-platform development frameworks for mobile applications promise important advantages in cost cuttings and easy maintenance, posing as a very good option for organizations interested in the design of mobile applications for several platforms. Given that platform conventions are especially important for the User eXperience (UX) of mobile applications, the usage of a framework where the same code defines the behavior of the app in different platforms could have a negative impact in the UX. This paper describes a study where two independent teams have designed two different versions of a mobile application, one using a framework that generates Android and iOS versions automatically, and another team using native tools. The alternative versions for each platform have been evaluated with 37 users with a combination of a laboratory usability test and a longitudinal study. The results show that differences are minimal in the Android platform, but in iOS, even if a reasonably good UX can be obtained with the usage of this framework by an UX-conscious design team, a higher level of UX can be obtained directly developing with a native tool.
Categories and Subject Descriptors D.2.6 [Software Engineering]: Integrated environments. H.5.2 [Information Interfaces & Presentation]: User-centered design.
General Terms Design, Experimentation, Human Factors.
Keywords Mobile user experience, cross-platform development, interaction design, mobile applications.
1. INTRODUCTION In recent years, the growth and usage of smartphones and mobile devices has changed the communication habits of the population and the development of mobile applications is supporting their daily life activities. There are over a million apps (for mobile applications) available to download in the Apple's App Store for iOS devices alone [2], so competition is fierce to get users’ interest and loyalty in the app market. In this scenario, UX is the
key differentiator [13].
The market offers a great variation of mobile devices and platforms, and the challenge for development teams is being able to create mobile applications that can be used and run seamlessly on different devices and platforms. In order to cover all these potential markets, specific versions of the application need to be developed for each target platform.
Cross-platform development frameworks offer a way of saving resources in the aim of covering different platforms. Madaudo et al. highlight that these tools provide developers the flexibility to create an app than runs across several mobile platforms based on the ideal principle of “write-once-run-everywhere” [15]. According to Humayoun et al., plenty of frameworks for mobile cross-platform development have been released in the last few years to deliver overall cost-effective and better solutions [12]. The advantages of these tools for software development organizations include the potential to: reuse developer skills; share codebases; synchronize releases; and reduce support costs.
As stated in the IDC market forecast, Android and iOS together cover the 92.2% of the 2013 smartphone market share [14]. Therefore, for an organization choosing to develop only for two platforms, Android and iOS would be the best choice in order to aim for the biggest user base. We have chosen these two platforms for this study.
Each mobile platform has its own style for how the interaction between the user and the application happens, defined in its specific UI (User Interface) design guidelines [10] [3], and through informal platform conventions. Thus, the user experience for Android and iOS devices is different [9]. App designers need to take into account the particular flavor or interaction for iOS or Android in order to design the app consistent with standard/typical interaction strategies in each platform. This is emphasized by design recommendations for app designers to follow platform consistency [7], valid also for any kind of handheld devices expressed as "conform to platform conventions" [11]. When an app is designed following platform standards and usual interaction strategies, users will be able to build on their previous app usage experience, therefore improving their learning curve and their overall satisfaction.
Given this state of affairs, what happens when using a cross-platform development framework with the differences in terms of interaction design between platforms? From a UX point of view, we would expect that these frameworks would take this into account, but to which extent? Our hypothesis is that a design team opting for the usage of a framework will obtain an impoverished UX in the final product, even if they have an appropriate HCI background and there is a focus on UX in the interaction design efforts. The objective of this work is to explore this hypothesis
179

and surrounding questions, by studying how the usage of a cross-platform development framework affects the UX in terms of consistency with platform-specific standards and conventions.
The rest of this paper is structured as follows: next section explores UX considerations for cross-platform development and the usage of cross-platform development frameworks. Section 3 is dedicated to the selection of one of these frameworks. Section 4 describes the methodological approach for the study carried out, and section 5 details the results. These results are discussed in section 6, and, finally, conclusions are gathered in section 7.
2. CROSS-PLATFORM DEVELOPMENT, UX AND DEVELOPMENT FRAMEWORKS According to David [8], the mobile user experience is totally different from the one in traditional desktop applications, due to the differences in screen size, portrait/landscape and input devices, among others. This is also true when considering the design of a mobile app to be developed for multiple platforms, since UIs must look and behave like other apps in the same platform [11]. While for desktop applications the issue of respecting platform conventions in cross-platform development is of lesser importance, in mobile app development it is a key aspect.
Having a look to how Facebook, Twitter and WhatsApp, companies with millions of users for their apps, have taken into account the interaction design of their Android vs. iOS 2013 versions, we see three different strategies [5]: Facebook has chosen to develop the same interaction design over the two platforms, disregarding some platform conventions; WhatsApp has chosen to elaborate a different design for each platform, highly compliant with platform standards; and Twitter has taken a middle road considering an adapted cross-platform design, where the two versions share the same basic design and a compromise has been made by considering only common characteristics in both platforms, while maintaining a high consistency with platform conventions.
In the first approach (cross-platform same design) using a cross-platform development framework delivers very good results in terms of savings of development resources, since it automatically delivers the same UI for both platforms; nevertheless, there is a high risk of providing a UX that will depart from user expectations.
In the second approach (different design for each platform), the UX is maximized, but the development effort is directed to the development of separated native versions. In this case, opting for a cross-platform framework would require a lot of tweaking in order to cater for all the differences between platforms, reducing the advantages that these tools provide.
In the case of opting for an adapted cross-platform design, the ideal from a UI designer point of view would be that cross-platform development tools took care of the main differences in platform conventions and standards, to require only minimal tweaking to obtain a high level UX.
The decision to use a cross-platform development framework or developing native code directly is not an easy one. Madaudo et al. [15] compare both approaches, stating that native apps provide better UX, by means of more fluid and responsive UIs, because cross-platform frameworks may not offer access to the full device APIs (Application Programming Interfaces). Their work is just a position paper based on the experience of the authors, without experimental validation.
Humayoun et al. [12] evaluate three cross-platform frameworks with the development of three apps where the interaction is based in touch events (including gestures) and they access the device hardware (such as the accelerometer or the camera). Not all three apps were developed with the three frameworks. From an interaction point of view, the three apps are quite basic in terms of navigation, since they just have one or two screens, despite being navigation one of the main differences in interaction style between platforms. The authors also performed a user evaluation study in a controlled environment with 9 users, of which 3 were Android expert users, and 3 were iOS expert users. Test participants were asked to evaluate app response time and to grade their satisfaction in a 1-5 scale; and the results show a higher user preference for the native versions, but in two of the three scenarios with little difference. The results of this work are interesting as a first approximation to the problem at hand, but they are difficult to extrapolate to more complex applications, because the case studies considered are very basic applications, and the number of participants in the study who are platform experts is reduced (just 6).
3. FRAMEWORK SELECTION Our starting point for studying the possible limitations of cross-platform development frameworks in terms of UX of the developed apps was to select the best one from a mobile UX point of view.
At the beginning we found 19 options of cross-platform framework. We have discarded frameworks for specialized domains, like gaming, and we have considered the following available cross-platform development frameworks, organized according to Banerjee's classification of cross-platform frameworks [4]:
• Mobile Web (combination of HTML5, JavaScript and CSS): jQuery Mobile, Sencha Touch.
• App Generator (specific language to code but the deployment is done as native applications of the different platforms): Titanium Appcelerator, RhoMobile, Xamarin-Mono, MoSync.
• Hybrid App (platform-specific shell application that renders prepackaged HTML pages extending them through APIs to access non-HTML features): PhoneGap, Intel XDK.
We studied the information available for each framework, considering the following criteria:
• To offer support for Android and iOS native app development, to be able to compete with directly-developed native apps.
• To be based in a well-known programming language, to ease adoption by developers.
• Free availability. • To include its own IDE (Integrated Development
Environment) or to be compatible with widespread IDEs, to ease development.
• To offer access to device APIs, to be able to offer the same level of functionality than native code.
• To have a high use rate among developers.
After analyzing the characteristics and properties of the eight candidates, only the following three tools complied with all the requirements: Titanium Appcelerator, PhoneGap and Intel XDK. These three tools were evaluated with a case study, consisting on an app to show the bus timetable for a campus, in order to base
180

the evaluation in hands-on experience with each framework. The test app interaction design included several screens, so that to be able to evaluate how each framework deals with navigation issues. While developing the test app with each one of the three frameworks, we evaluated both the tool advantages for the developer and how well it produced an interaction design in concordance with Android and iOS conventions.
The three tools offered a good perspective of usage for developers, excelling Titanium Appcelerator and Phonegap in this respect. Titanium Appcelerator (referred as Titanium in the rest of the paper) was finally chosen because it adapts the UI for the generated apps to some differences between Android and iOS UI guidelines. Titanium offers this differentiated behavior in the code generated for each platform automatically. For example, the tab bar: On iOS the tab bar always appears at the bottom edge of the screen [3]; alternatively, tabs on Android are placed on a Top Bar, just below the Action Bar in the top part of the screen [10]. We consider Titanium the best choice between freely available cross-platform development frameworks for the development of mobile apps, in the case where attaining a good UX is a relevant project objective. All the details of the framework selection study are in [1].
4. EVALUATION METHODOLOGY The study designed for evaluating the impact of using a framework into the UX was based in having two design teams working independently: one team designing the Titanium version, and the other one working on the two native versions. One graduate student developed the Titanium version, and three undergraduate students developed the native Android and iOS versions. Members of the two teams had followed a course on HCI (Human-Computer Interaction), usability and UX in their respective degrees, and each team had a responsible of the usability of the developed apps who had excelled in the grading of the HCI course. The design efforts of both teams are based on a common user and task analysis, part of the UCD (User-Centered Design) process followed. Usability testing with 14 representative users was carried out with a first prototype for each one of the three versions, and the apps were redesigned according to the test results. This UCD approach, along with the HCI expertise in both teams, ensures that the app versions used for this study had a good usability level.
4.1 Prototype description The application used as a case study is a real app under development. It is meant for students to access to university information that is needed on the fly, including professors' contact data, information about subjects, and bus timetables. In the above mentioned usability test carried out with the first prototype of the app, we obtained that the app was already useful at such stage, given the feedback provided through satisfaction questionnaires.
The second prototype (the one used for this research study) has more than 15 different screens in every one of the three versions (Titanium, native Android, and native iOS). The information displayed is obtained via web services offered by university servers, and it includes accessing device location services, thus consisting on a full-scale app.
The app includes a bulleting board for news and events in the school; information about transport in Campus, a directory of personnel, and information about degrees and courses.
Regarding performance, the Titanium versions generated for Android and iOS worked smoothly on both platforms, with similar performance to the native versions in terms of response times. In the usage of Titanium, however, it was necessary to make some adaptations for certain behaviors to be adapted to both platforms. That is, platform-specific code was included to use certain properties and events that were not present in both platforms.
Table 1 and Table 2 show the screenshots of the home screen for the two different versions of each prototype (iOS and Android), where it can be appreciated that design differs between versions, as for example in the location of the directory of personnel: as part of the toolbar in the Titanium version, and as an additional icon in the native versions.
Table 1. Screenshots of the two iOS prototype versions
Titanium iOS version Native iOS version
Table 2. Screenshots of the two Android prototype versions
Titanium Android version Native Android version
4.2 Study design A call for participants was made between students of the School of Computer Science at UPM. From the 68 respondents 38 were selected because they were experienced users of either iOS or Android devices (they had more than 6 months experience), and they had not participated in the usability tests of the first prototype
181

(so they had not previous knowledge of the logic of the applications). Of these 38, one of them did not finish with all the required participation, so the study was completed with 37 participants: 14 expert iOS users and 23 expert Android users. Participants did not know that they were participating in a study to compare an app developed with cross-platform framework with a native one, they only knew they were participating in a usability study to test two different versions of an app for the university. Participants were given a small present (a tee-shirt or a cap) to motivate them in the realization of the study.
The study consisted in the combination of 2 different usability evaluations for each version of the prototype:
• Laboratory study: To evaluate users’ first impression when they have not interacted with the prototype before. In this usability test, participants were asked to perform five specific tasks that covered all the functionalities in the app. After each laboratory test, participants were asked to evaluate the prototype.
• Longitudinal study: Participants had five days to use the app freely under real circumstances. After finishing each 5-day period, users were asked to evaluate their satisfaction with the version of the app they had been using. Longitudinal studies are especially important in the testing of mobile applications, since the different contexts where mobile devices are typically used are difficult to reproduce in a controlled environment.
To avoid adaptation times, the participants used their own smartphones where the app was installed. Half of the participants in each subgroup (Android vs. iOS users) tested first the Titanium version and then the native one, and the other half just the contrary, to compensate the effect of the order of evaluation of each version. Each participant did a laboratory test with the first version assigned, then he/she was asked to use it freely for five days, then a second laboratory test was carried out with the other version of the app, and there was an additional period of five days to use freely this other version of the app. At the end of the study, when they had used both versions, they were asked to fill in a final comparison questionnaire.
The questionnaires used for gathering participants' impressions about each version are the System Usability Scale (SUS) [6] [17]; a customized and reduced version of the User Experience Questionnaire (UEQ) [16], to focus on the only aspects that were applicable to the app context of use; and an ad-hoc questionnaire where participants were asked to compare the version of the app tested with the look and behavior of a typical app in their platform (Figures 1 to 8 in the results section are the answers to this ad-hoc questionnaire).
5. RESULTS The study was conducted in the two first weeks of April 2014. From the 37 participants, 86.5% were male and 13.5% were female, with an age average of 23 years old. The majority of the participants were undergraduate students (81%) and the rest were Master students (19%). 62% of the participants were Android users and 38% were iOS users. These values are representative to the reality of our university [5] and also to worldwide tendency of mobile platform usage [14].
5.1 Laboratory Study (First Impression) 5.1.1 Performance Measurement Based on the global times obtained by the participants we could observe that there were not significant differences between
Android and iOS prototypes. Comparing Titanium and native versions there were some differences (see Table 3): two tasks were faster done in the Titanium versions and three in the native versions comparing participants that used each version in the first laboratory test, so we can conclude that in the first time each version was used (with no previous usage of the alternative version), results are comparable. In the usage of each version as the second one used, native versions obtain slightly better results, and global results are better than in the first laboratory test, as expected. Table 3. Global average times for laboratory tests in seconds
Task Titanium version Native version
Lab. Test 1
Lab. Test 2
Lab. Test 1
Lab. Test 2
Task 1 25.11 20.15 32.69 22.22
Task 2 20.22 14.94 17.4 9.95
Task 3 38.61 28.84 36.31 18
Task 4 24.94 14.05 28.52 14
Task 5 42.22 38.26 37.31 34.66
5.1.2 UX Measurement via Questionnaires Titanium version: The majority of participants identify this version as behaving like a native app, in general terms. 91% of the Android participants and 79% of the iOS participants agree or totally agree with the fact that in general, the application looks and behaves as typical iOS or Android apps. Figures 1 and 2 illustrate the results obtained in the ad-hoc questionnaire for iOS and for Android, respectively.
When asked about specific issues, the generic approval rates lower in iOS, in particular about the controls and their position on screen, and also about the way of presenting information, since 71% of the iOS participants believe that this version looks as any other application on their platforms with respect to these two concerns.
Figure 1. iOS Lab. Test Titanium version. .
Figure 2. Android Lab. Test Titanium version.
182

It is noteworthy that for all the iOS participants (100%) who tested this prototype first, they agree or totally agree that the application looks and behaves as a normal iOS app. However, when the participants used this prototype after using the native one first, only 57% of the participants agree or totally agree with the statement of typical look and behavior in general lines. On the other hand, on Android the difference between the 1st and the 2nd test is about 2% – 3 %, which is not relevant.
The satisfaction of the users was measured using the System Usability Scale (SUS), on which this prototype obtained an overall value of 82.7. This value represents that usability of the prototype in general is very good. The evaluated dimensions for the UEQ are shown in Table 4.
Table 4. UEQ Global Results for Titanium versions
Dimensions Mean Comparison
to benchmark
Interpretation
Attractiveness 1.59 Good 10% of results better, 75% of results worse
Perspicuity 2.176 Excellent In the range of the 10% best results
Efficiency 1.432 Good 10% of results better, 75% of results worse
Dependability 1.486 Good 10% of results better, 75% of results worse
Novelty 0.311 Below average
50% of results better, 25% of results worse
The results show that the Titanium version is clear and easy to understand; meanwhile its attractiveness, dependability and efficiency are good. Moreover, the novelty dimension has the worst results, being below average. Native version: Based on the results, 100% of the iOS participants and 91.30% of the Android participants agree or totally agree that on general terms the application looks and behaves as a typical iOS or Android app. Figures 3 and 4 show the results obtained with the native version for iOS and for Android, respectively.
The results show a very small difference between the 1st and 2nd laboratory tests.
The evaluation of user satisfaction performed with the System Usability Scale (SUS) overall resulted on a coefficient of 86.82 which means that the prototype has a very high degree of usability, in the top 10% of scores.
Table 5 contains the summary of the results of the UEQ questionnaire and the dimensions measured for the native prototype. The results show that the native prototype of the application succeeds in all UX categories considered except in Novelty, where users’ score places it as just above average.
Table 5. UEQ Global Results for Native versions
Dimensions Mean Comparison to benchmark Interpretation
Attractiveness 2.234 Excellent In the range of the 10% best results
Perspicuity 2.351 Excellent In the range of the 10% best results
Efficiency 1.797 Excellent In the range of the 10% best results
Dependability 1.743 Excellent In the range of the 10% best results
Novelty 0.824 Above average 25% of results better, 25% of results worse
5.2 Longitudinal Study The participants completed the longitudinal study surveys after having the application on their own smartphones and testing it on their own for 5 days. The same process was followed with both the Titanium and the native versions.
Titanium version: The perception of 71% of the participants in the iOS group, after testing and exploring the app on their own for 5 days, is that it looks and behaves in general lines as a typical iOS app; meanwhile, 91% of the Android participants agree or totally agree with the same statement for their platform. Figures 5 and 6 show the results for the iOS and Android versions of the Titanium prototypes after the 5 days testing period.
The results on both platforms show that there is a significant variation between the values obtained on the first impression (laboratory) test and after 5 days. The results are much lower on iOS when participants are asked about how controls and their
Figure 3. iOS Lab. Test Native version. .
Figure 4. Android Lab. Test Native version. .
Figure 5. iOS Longitudinal Test Titanium version. .
183

position on screen are the typical ones for an iOS app (57% agree), and about the way of presenting information (43% agree).
For the Android prototype, 91% of participants agree or totally agree that the prototype behaves as a typical Android application. Meanwhile, the percentages of participants who agree or totally agree that this prototype’s controls are they typical in an Android app is 74%; about the navigation, the result is 65% and according to the way of presenting information is 78%. As it happens with the iOS version, the values are reduced on 20% to 30% compared to the values obtained in the first impression (laboratory) test.
The evaluation of user satisfaction performed with the System Usability Scale (SUS) overall resulted on a coefficient of 82.70, the same result obtained in the laboratory test.
In this case, there is not a big difference between the results from participants who tested this version as the first one or as the second one.
Table 6 shows the summary of the results of the UEQ questionnaire and the dimensions measured after five days of use.
Table 6. UEQ Global Results of Titanium version after five days of use
Dimensions Mean Comparison to benchmark Interpretation
Attractiveness 1.450 Above average 25% of results better, 50% of results worse
Perspicuity 2.081 Excellent In the range of the 10% best results
Efficiency 1.243 Above average 25% of results better, 50% of results worse
Dependability 1.486 Good 10% of results better, 75% of results worse
Novelty 0.162 Bad In the range of the 25% worst results
The results obtained show that most of the dimensions have lower qualifications after using the application 5 days. The efficiency and attractiveness on the first impression were Good and after using the app for 5 days, the benchmark is above average. The perspicuity, dependability and novelty have the same values in both cases. Moreover, the novelty dimension still has the worst results on the test (Bad).
Native version: The results of the test show that 100% of the iOS participants and 91% of the Android participants agree or totally agree that this prototype behaves as a typical application of each
platform. Figures 7 and 8 show the results for the iOS version and the Android version of the native prototype after the 5 days testing period, respectively.
When asked about specific issues, the results on iOS are 8% lower than the ones obtained in the first impression (laboratory) test. For Android, the results from the laboratory test and after the 5 days are the same. In terms of usability, the evaluation of this prototype on the System Usability Scale (SUS) resulted on a coefficient of 89,12. This very good result is slightly higher that value obtained in the first impression evaluation (86.82). From these results it can be inferred that the satisfaction of the users increased when they could explore the application by themselves.
Table 7 contains the summary of the results of the UEQ questionnaire and the dimensions measured for the native version.
Table 7. UEQ Global Results of Native Prototype after 5 days of use
Dimensions Mean Comparison to benchmark Interpretation
Attractiveness 2.148 Excellent In the range of the 10% best results
Perspicuity 3.236 Excellent In the range of the 10% best results
Efficiency 1.513 Good 10% of results better, 75% of results worse
Dependability 1.783 Excellent In the range of the 10% best results
Novelty 0.891 Above average 25% of results better, 50% of results worse
Figure 6. Android Longitudinal Test Titanium version. .
Figure 7. iOS Longitudinal Test Native Prototype. .
Figure 8. Android Longitudinal Test Native. Prototype. .
184

The results obtained on the attractiveness, perspicuity, dependability and novelty have the same benchmark value as the first impression of the participants. In the case of perspicuity the numeric value is better after using the application for 5 days. However, in the case of efficiency, the values are lower than the first impression tests. The results can be based on the fact that the users have more time to explore all the functionalities of the application on a real environment and maybe find some flaws. The novelty dimension has the same result as the first impression tests.
5.3 Final comparison questionnaire After using and testing every version of the app for five days, participants were asked to compare both applications and choose which option suits better to their idea of an iOS or Android app. Figure 9 and Figure 10 illustrate the answers and the preferences for iOS and Android participants, respectively.
While iOS users clearly prefer the native version to the Titanium one as typical iOS app (79%+7% preferring native version vs. 7% preferring Titanium version), in Android the difference is smaller (35%+17% preferring native version vs. 13%+26% preferring Titanium version). Considering the global results, 51% of participants think that the native version suits better than the Titanium version to their idea of a typical app for their platform, plus 14% who think that it suits somehow better, as opposed to 27% who think the contrary, and 8% who think both versions fit into their idea of a typical app in their platform.
6. DISCUSSION The results show that there is not an extreme difference in terms of usability and UX between the versions generated by a cross-platform framework and the native ones, even if the latter have obtained better results in this respect than the former.
The differences between the results of the laboratory tests on iOS with both prototypes (see Figure 1 and Figure 3) are probably caused by the known fact of iOS platform having higher homogeneity between apps thank Android.
On Android, the results of the laboratory tests are almost the same or have a small variation (see Figure 2 and Figure 4). The perception of participants is that the native version and the cross-platform one behave as natural as any other Android application and the user experience generated is very good.
The longitudinal study results show a stronger preference for the native version, which is again higher between iOS users than between Android users
About the UX measured with the UEQ questionnaire, native versions obtain better scores than the framework-generated ones. Results for the longitudinal study are in both cases lower than the ones obtained in the first impression laboratory test. This may be caused because during the 5 days testing period, the users were able to explore the different options of the application on their own and also use it under real circumstances, which can cause a change in their perception as they found it difficult to use or not so much attractive any more.
Regarding the usability of the application measured with the SUS questionnaire, the tendency is the same (native better than cross-platform) but the difference is not too big. Most of the results (laboratory and longitudinal studies) are on the 10% top scores of the SUS scale. In this case, the tendency is that results after the 5 days testing period are better than the ones from the first approach. This result may mean that the application is useful for the participants and has helped them to solve specific problems or have been integrated seamlessly in the student daily life.
The main indication about the adherence to platform conventions, as perceived by the user, comes from the final comparison questionnaire. Participants have been asked to choose the version that better suits their idea of an iOS or Android app, and the results show that there are important differences between iOS and Android users (see Figure 9 and Figure 10): While iOS users clearly prefer the native version to the Titanium one as typical iOS app (86% vs. 7%), in Android the difference is much smaller (52% vs. 39%). Given that some participants commented they preferred how some functionality was designed in the Titanium version, this big difference between platforms could be affected by this bias.
As a threat to the validity of the results, there is the issue of design decisions affecting the UX. We tried in our study to balance usability expertise between the two independent development teams, but there can always be individual differences that affect the quality of each design solution. This problem is intrinsic to experimentation with design processes, and very difficult to tackle. Given that users scored highly both versions of the app in terms of usability, we expect to have been successful in limiting the impact of this question into validity.
The previous training in HCI by members of the design teams in our study does not correspond to the standard developers population. For teams with no UX expertise, a hypothetic framework that provides automatically differences in control
Figure 9. iOS user prototype preferences. .
Figure 10. Android user prototype preferences. .
185

positions and similar issues (like Titanium does on a very basic level), could provide a better UX than the one obtained developing a native app, but we expect that the lack of a UCD process would have a much bigger negative effect on the overall UX.
The observations in our study go in the same line as the results obtained in [12], even if such work presents a more limited evaluation and the applications consisted on touch-events and accessing to hardware resources as camera, accelerometer, etc. In terms of performance and response time, [12] mentions that the native versions presented better response times than the cross-platform ones; in our case, the results show that there are not representative differences in terms of performance of the UI. It is remarkable too that our application is more data focused that the ones in [12], which were focused on the usage of hardware resources of the mobile devices.
We can say that there appears to be some evidence that the usage of a cross-platform development framework, even when considering the one available that provides a better support in terms of particularizing for the specific UX of each platform, affects negatively to the UX of the resulting app in the case of the iOS platform. For the Android platform this effect also appears but with a minimal impact. The exact quantification of this negative effect would require further experimentation.
7. CONCLUSIONS A case study has been presented for evaluating how the decision to develop a mobile app using use a cross-platform framework impacts the UX of the resulting app, against developing with native code for each platform considered.
The advantages of this kind of frameworks from a development point of view are well known, but for the first time it has been evaluated in terms of the UX of the produced app with a longitudinal study, with an app with enough functionality to be considered a full-scale app, and with a number of test participants to provide a minimum coverage of the two main mobile platforms: Android and iOS. The results show that a good level of UX can be obtained if the cross-platform development framework is chosen carefully in terms of providing adapted interaction styles for each platform, and the development team has UX expertise. But there are more possibilities of getting a better UX by maintaining the control over interaction issues that provides the development of an app with native code. These results are stronger for the iOS platform than for the Android one, where users may be accustomed to a higher diversity of interaction styles.
Further research is needed to tackle the specific interaction design issues that will be difficult to cover in framework-generated apps, in order to help the design teams using them, and to establish a framing theory that offers software engineers a way of balancing the advantages that using these tools offers from a development point of view, with the loss in overall product quality that a lesser UX implies.
Further experimentation with apps in different domains will be needed to refine the results of the study.
8. ACKNOWLEDGMENTS The authors would like to thank Google and the direction of the School of Computer Science at the Universidad Politécnica de Madrid for their support to this research project.
9. REFERENCES [1] Angulo, E., Ferre, X., Alonso, J. UX & Cross-Platform
Mobile Application Development Frameworks. 2014. DOI = http://raptor.ls.fi.upm.es/techreports/studyCPFrameworks.pdf
[2] Apple. 2014. App Store Sales Top 10$ Billion in 2013. Apple Press Release. DOI= http://www.apple.com/pr/library/2014/01/07App-Store-Sales-Top-10-Billion-in-2013.html
[3] Apple. 2014. iOS Human Interface Guidelines. DOI = https://developer.apple.com/library/ios/documentation/UserExperience/Conceptual/MobileHIG/MobileHIG.pdf
[4] Banerjee, U. A Tool Comparison, Technology Trend Analysis. 2012. DOI= http://setandbma.wordpress.com/2012/ 02/20/mobile-hybrid-tool-comparison/
[5] Barea, A., Ferre, X., and Villaroel, L. 2013. Android vs. iOS Interaction Design Study for a Student Multiplatform App. HCI International 2013 - Posters' Extended Abstracts Communications in Computer and Information Science, Volume 374, 2013, pp 8-12.
[6] Brooke, J. 1996. SUS - A quick and dirty usability scale. In P. W. Jordan, B. Thomas, B. A. Weerdmeester, & A. L. McClelland. Usability Evaluation in Industry. pp. 189--194. Taylor & Francis, London, UK, 1996.
[7] Clifton, I. G. 2013. Android User Interface Design: Turning Ideas and Sketches into Beautifully Designed Apps. Addison-Wesley Professional, Upper Saddle River, NJ, USA, 2013.
[8] David, M. 2011. Building Websites with HTML5 to Work with Mobile Phones. Focal Press, Oxford, UK.
[9] Fling, B. 2009. Mobile Design and Development. O'Reilly Media, Inc., Sebastopol, CA, USA.
[10] Google Inc. and the Open Handset Alliance. 2014. Android User Interface Guidelines. DOI = http://developer.android.com/design/
[11] Hartson, R., and Pyla, P. S. The UX Book. Morgan Kaufmann, Amsterdam, The Netherlands, 2012.
[12] Humayoun, S. R., Ehrhart, S. and Ebert, A. 2013. Developing Mobile Apps Using Cross-Platform Frameworks: A Case Study. University of Kaiserslautern.
[13] IBM Corporation. 2012. Creating a Compelling Mobile User Experience. IBM Global Business Services White Paper. http://www-935.ibm.com/services/uk/cio/pdf/Mobile_UX _Whitepaper_02May12_VK.pdf
[14] IDC.2013. Worldwide Mobile Phone Market Forecast to Grow 7.3% in 2013 Driven by 1 Billion Smartphone Shipments. DOI= http://www.idc.com/getdoc.jsp?containerId=prUS24302813
[15] Madaudo, R., and Scandurra, P. 2013. Native versus Cross-platform frameworks for mobile application development. In: VIII Workshop of the Italian Eclipse Community (September, 2013). DOI= http://2013.eclipse-it.org/proceedings/6_Madaudo-Scandurra.pdf
[16] UEQ-Online. The User Experience Questionnaire (UEQ). Accessed January 2014. DOI = http://www.ueq-online.org/
[17] Usability.gov. 2014. System Usability Scale (SUS). Accessed January 2014. DOI = http://www.usability.gov/how-to-and-tools/resources/templates/system-usability-scale-sus.html
186

Propuesta para evaluar la satisfacción de uso en Entornos Virtuales de Aprendizaje
Andrés F. Aguirre Grupo TIC-Unicomfacauca
Corporación Universitaria Comfacauca Calle 4 N° 8-30 Popayán, Colombia
(+57) 28220517 Ext. 130 [email protected].
co
César A. Collazos Grupo de Investigación y Desarrollo en
Ingeniería de Software Universidad del Cauca
Cra 2 N° 4N-103 Popayán, Colombia (+57) 28209800 Ext. 2133
Ángela Villareal F. Grupo TIC-Unicomfacauca
Corporación Universitaria Comfacauca Calle 4 N° 8-30 Popayán, Colombia
(+57) 28220517 Ext. 130 [email protected].
co
Rosa Gil Grupo de Investigación en Interacción Persona Ordenador e Integración de
Datos Universidad de Lleida
Jaume II 69, E-25001 Lleida, Spain (+34) 973 702 742 [email protected]
ABSTRACT Cada vez hay un mayor interés en medir y evaluar la experiencia de usuario de manera más objetiva y precisa con respecto a las necesidades reales de los usuarios. Sin embargo, la evolución de la tecnología ha implicado diversos retos que involucran lograr un acercamiento y comprensión de los elementos implícitos en la interacción de un usuario y un sistema interactivo. En el caso de entornos virtuales de aprendizaje, el desafío es mayor, ya que hay aspectos propios del contexto, que los métodos tradicionales son insuficientes de proporcionar una forma adecuada de evaluar la satisfacción de uso en este tipo de entornos. En el presente artículo se presenta una propuesta que pretende incluir dentro de la evaluación de la satisfacción de uso, elementos cruciales que caracterizan a los sistemas software dedicados al aprendizaje, y a su vez se propone la manera de evaluarlos desde un enfoque emocional.
Keywords Satisfacción de uso, entornos virtuales de aprendizaje, experiencia de usuario, diseño instruccional.
1. INTRODUCCIÓN Los enfoques actuales de satisfacción evalúan principalmente la percepción de los usuarios desde dos perspectivas: la eficacia y la
eficiencia; de manera que si el producto es considerado como eficaz y eficiente, se asume que los usuarios están satisfechos [1]. No obstante, hay aspectos de la experiencia de usuario (UX, por sus siglas en inglés User eXperience), como la diversión o el entretenimiento, que afectan de manera directa y significativa en la satisfacción general de los usuarios hacia un producto [2]. Dichas características están relacionadas a la calidad hedónica de un producto, la cual se centra en la dimensión subjetiva, es decir en los aspectos afectivos y demás características subyacentes detrás del comportamiento de las personas [3] [4]. Por otro lado, la calidad pragmática se encuentra relacionada con la necesidad que tienen de los usuarios de lograr sus objetivos de manera eficaz y eficiente.
Evidentemente la relación de usuario-producto evoluciona con el tiempo, los aspectos hedónicos de la UX finalmente parecen ganar la relevancia que únicamente se les atribuía a los aspectos pragmáticos [5]. Por lo tanto, surgen nuevos desafíos en la evaluación de la UX, que incluyen la necesidad de comprender mejor las cualidades afectivas que intervienen en la experiencia en el uso de aplicaciones educativas. De esta manera se logra un acercamiento al lado emocional del individuo y una conexión a sus impresiones, sentimientos subjetivos dentro de la evaluación de UX, que permitan establecer una articulación entre distintos componentes inherentes a la satisfacción del usuario.
En el caso de los Entornos Virtuales de Aprendizaje (EVA), la UX es uno de los elementos más importantes en el aprendizaje [6]. Este aspecto resalta la necesidad de enriquecer la evaluación de UX, en especial, desde un enfoque emocional, dada su importancia y la escasez de instrumentos que permiten su medición [7]. Por otro lado, diversos estudios han demostrado que el aprendizaje también está fuertemente influenciado por las emociones, de hecho, las emociones son componentes inseparables de la cognición [8], intervienen profundamente en procesos mentales como la memoria, el raciocinio, la atención y otros dominios de la cognición, fundamentales en el aprendizaje
Permission to make digital or hard copies of all or part of this work for personal or classroom use is granted without fee provided that copies are not made or distributed for profit or commercial advantage and that copies bear this notice and the full citation on the first page. To copy otherwise, or republish, to post on servers or to redistribute to lists, requires prior specific permission and/or a fee. INTERACCIÓN 2014, September 10-12, 2014, Puerto de la Cruz, Tenerife, Spain. Copyright 2014 ACM 978-1-4503-2880-7 …$15.00.
187

[9]. Del mismo modo, en el aprendizaje asistido por computador, las emociones afectan el rendimiento y nivel de los usuarios [10] [11], influyendo en su juicio y en la toma de decisiones [10]. Sin embargo, pese a la importancia que tienen las emociones en la UX de un EVA, su inclusión dentro de instrumentos para medir la satisfacción, aún es incipiente. Esta investigación propone un instrumento para la evaluación de aspectos relacionados a la satisfacción de UX en EVA, con el propósito de lograr una aproximación a la comprensión de la experiencia del estudiante, de su interacción con herramientas informáticas educativas, de su empatía o apatía al uso de las mismas y demás aspectos que subyacen a la modulación emocional del estudiante en la UX en EVA.
2. CONTEXTO DEL PROBLEMA La evaluación de la UX de las aplicaciones dedicadas al aprendizaje es una actividad compleja. Dicha situación se debe en gran parte al incremento de las tendencias en los estilos de aprendizaje, la diversidad de alumnos y los avances tecnológicos [12]. Estas características se convierten en importantes desafíos para la definición de métodos que permitan evaluar los diseños de EVA, de manera que permitan identificar si dichos sistemas responden a la voz de los usuarios.
La tarea principal para un usuario frente a un EVA es aprender, lo cual es un proceso bastante abstracto. Por este motivo, los profesionales en evaluación de UX, deben incrementar sus esfuerzos significativamente al momento de tratar con dichos entornos. Autores como Squires ponen de manifiesto la necesidad de incorporar la facilidad de uso dentro del aprendizaje en herramientas informáticas, y señalan también la falta de reciprocidad entre las áreas de la Interacción Humano Computador (HCI, por sus siglas en inglés Human-Computer Interaction) y la computación educativa [13]. Una aplicación educativa puede ser útil, pero no en el sentido pedagógico y viceversa [14] [15] [16]. Esto se debe a que los estudios de usuario tradicionales relacionados a la evaluación de interfaces de sistemas interactivos, se encuentra en el análisis del comportamiento de los usuarios, ya que se suelen centrar en el comportamiento racional del usuario, dejando de lado su comportamiento emocional [17].
Por consiguiente, la evaluación de UX debe incorporar estudios sobre pruebas en contextos educativos en donde se considere tanto la parte cognitiva de los usuarios como la afectiva, ya que esta última influye directamente en la motivación de un estudiante en su proceso de aprendizaje. No obstante, la presente investigación no apunta a identificar qué emociones son elicitadas, pues ello no sería suficiente para evaluar y redefinir intervenciones y propuestas de diseño. Esta investigación se centra en conocer cómo son esas reacciones y cómo afectan y se ven afectadas por la interacción entre los usuarios y las interfaces de los EVA.
3. SATISFACCIÓN DE USO 3.1 Satisfacción en la UX Debido al auge actual que tienen el uso de las tecnologías en la sociedad, es lógico que la satisfacción del usuario final se convierta en el primer condicionante del éxito o fracaso de cualquier sistema interactivo. En el caso de que el usuario no consiga sus objetivos o el software no satisfaga sus necesidades, sencillamente lo abandonará en busca de otra alternativa, o de la
competencia [18]. La satisfacción del usuario es un concepto complejo y difícil de delimitar, pero es de suma importancia ya que modelará la UX, posibilitándole o impidiéndole la consecución de sus objetivos [19]. Frente a este aspecto, se han generado diversos esfuerzos por parte de la comunidad de HCI, para establecer los factores que influyen en la satisfacción, y así gestionarlos adecuadamente en el diseño de interfaces [20]. Uno de los conceptos ampliamente extendidos que se suman a este propósito, es el de la usabilidad, que pretende además brindar elementos para medir el grado de satisfacción, así como también el de eficacia, y eficiencia con el que usuarios específicos pueden lograr objetivos específicos, en contextos de uso específicos [21] [22]. Algunos autores extienden este concepto y establecen dos dimensiones de usabilidad: usabilidad objetiva o inherente, y usabilidad subjetiva o aparente ([23] [24] [19] citados en [18]). La primera se refiere a la parte funcional o dinámica de la interfaz, y se enfoca en cómo hacer que el producto sea fácil de entender y de aprender (eficacia y eficiencia) [18] [25]. La usabilidad subjetiva, en cambio está más relacionada con la impresión visual de la interfaz, con lo que el usuario percibe a través del diseño, la estética y de las interacciones con la interfaz (satisfacción de uso) [18] [25] [24].
No obstante, recientes investigaciones han indicado que la usabilidad de un producto puede no ser el único, ni siquiera el principal, factor determinante en la satisfacción de los usuarios [26] [27], esto debido a que en los últimos años ha habido una evolución en las interacciones entre el usuario y los distintos sistemas interactivos, en donde se ha pasado de una interacción netamente funcional, determinada por la eficiencia y eficacia del uso del producto, hacia una visión sensorial proyectada a través del placer, la naturaleza subjetiva de la experiencia, la percepción de un producto y las respuestas emocionales [26] [27] [28]. De manera que la satisfacción de uso no puede ser analizada como un atributo de la usabilidad sino que, por el contrario, la usabilidad debe ser entendida como un factor dentro de la consolidación de elementos que propendan por la satisfacción del usuario [18]. La UX se convierte entonces en una mirada holística de la interacción con un producto [28], ya que comprende el conjunto completo de los efectos provocados por el uso de un producto que incluye la experiencia estética, la experiencia de sentido, la experiencia emocional y demás aspectos que involucran la satisfacción del usuario [27].
3.2 Satisfacción en el aprendizaje electrónico Esta evolución en el concepto de la satisfacción del usuario y en la comprensión hacia la UX, se extiende también a sistemas de enseñanza y aprendizaje. Sin embargo, aunque la educación virtual se está convirtiendo en uno de los enfoques más representativos de la Internet [29], la mayoría de estudios que se han realizado en torno a evaluaciones de EVA, han proporcionado una participación mínima en aspectos de UX [30], lo cual se ve reflejado en aplicaciones educativas que presentan mayores tasas de deserción escolar, en comparación con los cursos tradicionales dirigidos por un instructor. Hay muchas razones que pueden explicar las altas tasas de deserción, como la relevancia de los contenidos, el nivel de confort con la tecnología, la disponibilidad de apoyo técnico, etc., pero un factor importante es la carencia de características cognitivas y emocionales como directrices en el desarrollo de espacios de aprendizaje con diseños válidos [12] [31]. En consecuencia, los estudios de evaluación de UX en EVA son escasos [31]. Este aspecto es uno de los temas principales que conforman el enfoque del presente estudio.
188

Dentro de este ámbito, la UX se constituye como un elemento esencial en la habilidad del estudiante a la hora de adquirir conocimientos y competencias de manera satisfactoria. De esta forma, la evaluación de UX se convierte también en un medio de apoyo para que los procesos de aprendizaje y enseñanza sean productivos, ya que se busca diseñar sistemas que sean intuitivos a partir de los cuales los usuarios puedan interaccionar fácilmente con los EVA y puedan concentrase en adquirir los conocimientos y competencias previstos en su formación [32]. Cuanto menos esfuerzo se dedique a entender y aprender la funcionalidad del sistema, mayor esfuerzo podrá dedicar el estudiante al aprendizaje [33]. Cabe resaltar también que uno de los aspectos relevantes que se consideran en la UX y que en el caso particular de los EVA, tienen un papel sustancial, son las emociones [34]. En diversas investigaciones señalan que las emociones influyen de manera determinante en la motivación de los estudiantes, en su atención y en su desempeño [6] [35] [36]. De manera que en la evaluación de la satisfacción de uso de EVA, es importante considerar las cualidades afectivas que intervienen como un componente inherente de la UX, ya que estas comprometen los atributos funcionales y no funcionales de un sistema, entendiéndose como funcionales, aquellos relacionados con la usabilidad, utilidad y accesibilidad; y en el caso de los no funcionales, hacen referencia a cualidades estéticas, simbólicas, motivacionales, entre otras [6].
4. PROPUESTA PARA EVALUAR LA SATISFACCIÓN DE USO Pese a que existen estudios relacionados con la evaluación de UX en EVA, muy pocos han sido reportados en la literatura [25] [37] y la mayor parte de la investigación relevante sigue siendo anecdótica [31]. En este sentido, para el desarrollo de la presente propuesta se definen los siguientes dos planteamientos:
4.1 Qué evaluar Los métodos y técnicas relacionadas con la evaluación de UX, describen lo que se espera obtener, más no se especifica la manera de alcanzar resultados. Este hecho hace que la persona que esté a cargo de la evaluación, realice su respectivo proceso de acuerdo a su propio criterio, lo cual, para el caso de los EVA, hay particularidades que serían tratadas de una manera subjetiva.
En respuesta a esta problemática, surge la necesidad de definir los parámetros que se deben considerar para evaluar la satisfacción de uso de un EVA. Para este propósito, se realiza una contextualización de la satisfacción en EVA, de manera que se convierte en el insumo principal para identificar las características propias del diseño centrado en el Usuario (DCU) y aquellas características relacionadas al Diseño Instruccional (DI).
4.1.1 La satisfacción en EVA Para realizar una contextualización de la satisfacción en EVA, es necesario utilizar un modelo consistente a los nuevos desafíos que implican la evaluación de la UX, en este sentido se ha encontrado que la ISO/IEC 25010 proporciona una definición que contempla distintos matices de la experiencia general del usuario. Razón por la cual, este concepto fue el punto de partida para el desarrollo de la presente propuesta.
En esta norma, la satisfacción se encuentra dividida en cuatro sub-características destinadas a identificar las necesidades del usuario cuando utiliza un sistema en un contexto de uso específico [38]: la utilidad, la confianza, el placer y la confort.
No obstante, es importante hacer un mayor enfoque en el conjunto de factores que condicionan la naturaleza de un EVA, dado que un producto que sea satisfactorio en un contexto de uso dado puede no serlo en otro, con diferentes usuarios, tareas o entornos [1]. Para ello, se ha realizado el siguiente tratamiento a cada una de las sub-características de la satisfacción:
4.1.1.1 Utilidad Corresponde al grado en el que un usuario está satisfecho con el logro percibido de objetivos pragmáticos, incluyendo los resultados del uso y las consecuencias de su uso [38].
De acuerdo a este concepto, se requiere establecer aquello que será considerado como objetivos pragmáticos. Según Hassenzahl [28], un producto es percibido como pragmático si proporciona un medio eficiente y eficaz para el logro de objetivos. En este sentido, un estudiante podría tener un amplio número de objetivos cuando interactúa con un EVA. Sin embargo, en términos generales su objetivo principal es aprender [39], en consecuencia, se considera que los objetivos pragmáticos del estudiante estarán dirigidos a favorecer el proceso de aprendizaje de tal manera que este se logre de forma sencilla, rápida y utilizando la menor cantidad de recursos posible.
Para encontrar una correspondencia con lo planteado, se referencian estudios a partir de los cuales se puedan obtener los objetivos pragmáticos del estudiante y así determinar la utilidad al interactuar con un EVA. Uno de los trabajos que se ajustan a este propósito, es el Modelo TAM [40], en donde se destaca la utilidad percibida, concepto que ha sido adaptado por diversos autores y llevado al contexto de entornos de aprendizaje en línea [41] [42] [43] [44]. De estos estudios se logran abstraer objetivos pragmáticos como: Realizar las tareas de aprendizaje fácil y rápidamente, Facilitar el aprendizaje del contenido del curso, Mejorar el rendimiento del aprendizaje, entre otros no menos importantes.
4.1.1.2 Confianza Se entiende como el grado en el cual un usuario tiene confianza de que un producto o sistema según lo previsto. No obstante, dado que la confianza forma parte de la satisfacción de uso, la cual compromete un concepto más generalizado que está sujeto al contexto específico de uso [38], se reconoce la necesidad de considerar elementos de dicho contexto (en este caso EVA) que definan un constructo que soporte la confianza. Por consiguiente, los componentes que entrarían a formar parte para dicho propósito, se obtienen del DI, particularmente del trabajo de Jhon Keller [45], quien ha realizado diversos aportes al mismo y es considerado uno de los autores más representativos dentro de este ámbito [46]. Keller plantea un modelo de cuatro categorías que conforman la motivación de un estudiante, que corresponden a: Atención, Relevancia, Confianza y Satisfacción (ARCS) [45]. En este modelo la confianza se define como estrategias que ayudan a desarrollar expectativas positivas para el logro de las metas del estudiante en un EVA. De tal manera que los aprendices experimenten sus éxitos a sus esfuerzos y no a factores externos como la suerte o la dificultad de la tarea [45].
Por otro lado, desde del panorama de la interacción entre un usuario y un sistema software, la confianza se ve afectada positivamente por la facilidad de navegación en el entorno [47] [48] y el buen uso de elementos de diseño visual [40]. El modelo de confianza tratado en [49], plantea que cuando una interfaz es consistente en cuanto a apariencia visual, elementos de
189

interacción (botones, menús, etc.) navegación y terminología, incrementa la confianza de los usuarios. De igual manera, se ha identificado que aspectos como la falta de control por parte del usuario [49] y los mensajes de error descortés y no constructivos ([50] citado en [49]) tienen un impacto negativo en la confianza del usuario.
4.1.1.3 Placer Grado en el cual un usuario obtiene placer de cumplir sus necesidades personales [38]. Dichas necesidades pueden incluir necesidades para adquirir nuevos conocimientos y habilidades, para comunicar identidad personal y provocar recuerdos agradables [38].
Hassenzahl, uno de los investigadores más influyentes en el área de la UX, recopila una lista de las 8 necesidades psicológicas de los seres humanos, basadas en las necesidades propuestas por Sheldon et al. [3]. Además existen estudios ampliamente reconocidos, planteados por fuera de la psicología que las apoyan: [51] [52] [53] [54]. Estas necesidades involucran la dimensión del placer como la confirmación de las posibilidades de un evento deseable [3].
De acuerdo a los estudios de Hassenzahl, la estimulación, la identificación y la evocación, son consideradas necesidades importantes en el contexto de las tecnologías interactivas, y a su vez corresponden a los atributos hedónicos que fundamentan el placer [28]: Influencia – popularidad, Placer – estimulación, Sentido - Auto realización.
4.1.1.4 Confort Está relacionado con el grado en el que el usuario está satisfecho con el confort físico [38]. Jordan [55] y Tiger [53] establecen que el confort físico está determinado por los placeres derivados directamente de los sentidos como el tacto, el gusto y el olfato. En efecto, esta sub-característica de la satisfacción, no se tendrá en cuenta debido a su aparente débil conexión con los estilos de interacción convencionales en EVA y a su incapacidad para emerger como una clara necesidad para el presente estudio.
En virtud de lo descrito, el planteamiento sugerido permite conformar una combinación entre el diseño de interfaces, el constructo de la motivación en el aprendizaje y la experiencia de usuario. De manera que al incluir estas estructuras dentro del proceso de evaluación de UX de EVA, se obtiene una aproximación más objetiva y precisa tanto de los objetivos pragmáticos como hedónicos implícitos en la satisfacción de un estudiante.
4.2 Cómo evaluar: Una vez definidas las variables que se deben considerar al evaluar la satisfacción de uso, es necesario establecer la forma en cómo será evaluada. Aunque existen instrumentos que establecen cómo evaluar la dimensión emocional, hay carencia de técnicas que permitan la identificación y el correcto procesamiento de la información de las emociones que afectan la satisfacción del usuario cuando interactúa con un EVA.
Para establecer la manera en cómo se evaluará la satisfacción del estudiante, se hace necesario definir las emociones y cómo medirlas, de manera que pueda conocer más acerca de los componentes afectivo-emocionales de los usuarios y a su vez proporcionar una estructura de apoyo que permita la
identificación y cuantificación de variables y especificaciones en el diseño de EVA desde un enfoque emocional.
Dado que en la presente propuesta se pretenden evaluar la satisfacción de los estudiantes a través de la dimensión emocional, se han considerado estudios que recopilan emociones que se generan en contextos de entornos interactivos, como se propone en [56], así como también aquellos estudios enfocados al análisis de las emociones evocadas en sistemas de aprendizaje electrónico [57] [58] [59], que se encuentran apoyados en varias teorías sobre emociones en el aprendizaje. Para el caso de los instrumentos que permitirán la evaluación de las emociones, se consideran aquellos que permitan indagar las emociones del usuario, teniendo en cuenta la intensidad y combinación de emociones frente a una misma situación.
A través de estas perspectivas derivadas del DI y diseño de interfaces, se establecen los parámetros a partir de los cuales estará sustentada la evaluación de la experiencia de los usuarios en EVA, dichos criterios de evaluación están relacionados con el diseño visual de la interfaz, la facilidad de aprendizaje, la interactividad, la retroalimentación, el contenido, recursos y la utilización de los mismos, entre otros. Además de estos componentes se suma el grado de implicación y motivación de un estudiante frente al uso de un EVA que serán tratados a través de los mecanismos establecidos para la captura de respuestas emocionales de los estudiantes.
De acuerdo a lo mencionado, los distintos elementos que conforman esta investigación, permiten obtener información más precisa sobre el comportamiento de los usuarios y la manera en cómo utilizan los entornos de aprendizaje, teniendo en cuenta los objetivos instruccionales y educativos que caracterizan dichos sistemas. Comprender las impresiones y sensaciones que los usuarios tienen frente al uso de aplicaciones educativas, proporciona criterios para determinar si un EVA se ha diseñado bien y saber si se han alcanzado las necesidades funcionales y subjetivas de los usuarios. Este aspecto brinda a los evaluadores de interfaces, mecanismos más sólidos para fortalecer las herramientas de las que disponen para el proceso de evaluación [60].
5. CONCLUSIONES PRELIMINARES Actualmente se observa un incremento exponencial en el desarrollo de sistemas interactivos que apoyan el proceso de aprendizaje, lo cual pone de manifiesto la necesidad de redefinir los procesos relacionados con la evaluación de la satisfacción en la UX de sistemas interactivos, en particular de los EVA. Esta situación se presenta debido a que los estudios de usuarios tradicionales, se centran en los parámetros objetivos, asociados a aspectos mensurables y verificables en un producto interactivo; descuidando componentes hedónicos que hacen parte de la satisfacción del usuario y que se encuentran directamente relacionados con el grado de implicación y motivación que presenta una persona frente al uso de un EVA. Generalmente los estudios relacionados con la evaluación de UX, están orientados a considerar la satisfacción de manera subjetiva. Dentro del presente estudio se integran dos estructuras que se complementan entre sí, a fin de hacer frente a las particularidades implícitas en el diseño de EVA: diseño centrado en el aprendiz y DI. Este aspecto permite contar con un medio para garantizar que los procesos de aprendizaje y enseñanza sean productivos, ya que busca diseñar sistemas que sean intuitivos a partir de los cuales
190

los usuarios puedan interaccionar fácilmente con los EVA y puedan concentrase en adquirir los conocimientos y competencias previstos en su formación. La práctica actual en la evaluación de la UX, sugiere que la elección de instrumentos de medición de UX es difícil y que las conclusiones de algunos estudios de usabilidad se ven debilitados por los elementos que evalúan y por la forma en cómo utilizan medidas de evaluación de la UX para brindar un soporte a la calidad en uso de productos software. Las sugerencias de cómo responder a los desafíos identificados, pueden brindar la posibilidad de contar con herramientas que faciliten la evaluación de UX desde un enfoque emocional, y a su vez, establecer medidas de UX más válidas y completas respecto a la percepción de un estudiante frente al uso de un EVA.
6. REFERENCIAS [1] N. Bevan, “Los nuevos modelos de ISO para la calidad y la
calidad en uso del software,” in Calidad del producto y proceso software, Editorial Ra-Ma, 2010, pp. 55–75.
[2] G. Cockton, “Putting Value into E-valu-ation,” in Maturing Usability, 2008, pp. 287–317.
[3] M. Hassenzahl, S. Diefenbach, and A. Göritz, “Needs, affect, and interactive products – Facets of user experience,” Interact. Comput., vol. 22, no. 5, pp. 353–362, Sep. 2010.
[4] N. Bevan, “Classifying and selecting UX and usability measures,” Int. Work. Meaningful Meas. Valid Useful User Exp. Meas., vol. 11, pp. 13–18, 2008.
[5] S. Kujala, V. Roto, K. Väänänen-vainio-mattila, and A. Sinnelä, “Identifying hedonic factors in long-term user experience,” Proc. 2011 Conf. Des. Pleasurable Prod. Interfaces. ACM, no. c, pp. 0–7, 2011.
[6] F. Redzuan, A. M. Lokman, and Z. A. Othman, “Kansei Design Model for Engagement in Online Learning: A Proposed Model,” Informatics Eng. Inf. Sci., pp. 64–78, 2011.
[7] K. Capota, M. Van Hout, and T. Van Der Geest, “Measuring the emotional impact of websites: a study on combining a dimensional and discrete emotion approach in measuring visual appeal of university websites,” in Proceedings of the 2007 conference on Designing pleasurable products and interfaces, 2007, no. August, pp. 22–25.
[8] D. A. Norman, Emotional design: Why we love (or hate) everyday things. Basic Books, 2007, p. 272.
[9] R. J. Dolan, “Emotion, cognition and behavior,” Science, vol. 298, no. 5596, pp. 1191–4, Nov. 2002.
[10] H. Järvenoja and S. Järvelä, “How students describe the sources of their emotional and motivational experiences during the learning process: A qualitative approach,” Learn. Instr., vol. 15, no. 5, pp. 465–480, Oct. 2005.
[11] M. Nummenmaa and L. Nummenmaa, “University students’ emotions, interest and activities in a web-based learning environment.,” Br. J. Educ. Psychol., vol. 78, no. Pt 1, pp. 163–78, Mar. 2008.
[12] P. Zaharias and A. Poulymenakou, “Implementing learner-centred design: The interplay between usability and instructional design practices,” Interact. Technol. Smart Educ., vol. 3, no. 2, pp. 87–100, 2006.
[13] D. Squires, “Usability and Educational Software Design: Special Issue of Interacting with Computers,” Interact. Comput., vol. 11, no. 5, pp. 463–466, May 1999.
[14] C. Quinn, “Pragmatic evaluation: lessons from usability,” in 13th Annual Conference of the Australasian Society for Computers in Learning in Tertiary Education, 1996.
[15] P. R. Albion, “Heuristic evaluation of educational multimedia: from theory to practice,” in Proceedings ASCILITE 1999: 16th Annual Conference of the Australasian Society for Computers in Learning in Tertiary Education: Responding to Diversity, 1999, pp. 9–15.
[16] D. Squires and J. Preece, “Predicting quality in educational software: Evaluating for learning, usability and the synergy between them,” Interact. Comput., vol. 11, no. 5, pp. 467–483, 1999.
[17] Y. Hassan Montero and F. J. Martín Fernández, “Más allá de la usabilidad: interfaces ‘afectivas,’” No Solo Usabilidad, no. 2, 2003.
[18] Y. Hassan Montero, “Factores del diseño web orientado a la satisfacción y no-frustración de uso,” Rev. española Doc. científica, vol. 29, no. 2, pp. 239–257, 2006.
[19] K. Hornbæk, “Current practice in measuring usability: Challenges to usability studies and research,” Int. J. Hum. Comput. Stud., vol. 64, no. 2, pp. 79–102, Feb. 2006.
[20] Y. Rogers, H. Sharp, and J. Preece, Interaction Design: Beyond Human-Computer Interaction, 3rd ed. John Wiley & Sons, 2011, p. 602.
[21] I. O. for Standardisation, ISO 9241: Software Ergonomics Requirements for office work with visual display terminal (VDT). Geneva, Switzerland, 1998.
[22] Y. Hassan Montero, F. J. M. Fernández, and G. Iazza, “Diseño Web Centrado en el Usuario : Usabilidad y Arquitectura de la Información,” Hipertext. net, no. 2, 2004.
[23] M. Kurosu and K. Kashimura, “Determinants of the apparent usability [user interfaces],” in Systems, Man and Cybernetics, 1995. Intelligent Systems for the 21st Century., IEEE International Conference on, 1995, vol. 2, pp. 1509–1514 vol.2.
[24] L. Fu and G. Salvendy, “The contribution of apparent and inherent usability to a user’s satisfaction in a searching and browsing task on the Web.,” Ergonomics, vol. 45, no. 6, pp. 415–24, May 2002.
[25] A. Madan and S. K. Dubey, “Usability Evaluation Methods: A Literature Review,” Int. J. Eng. Sci. Technol., vol. 4, no. 02, pp. 590–599, 2012.
[26] A. De Angeli, A. Sutcliffe, and J. Hartmann, “Interaction, usability and aesthetics: what Influences Users’ Preferences?,” Proc. 6th Conf. Des. Interact. Syst., pp. 271–280, 2006.
[27] A. Sonderegger and J. Sauer, “The influence of design aesthetics in usability testing: Effects on user performance and perceived usability,” Appl. Ergon., vol. 41, no. 3, pp. 403–10, May 2010.
[28] M. Hassenzahl, “The thing and I: understanding the relationship between user and product,” in Funology, vol. 3, M. Blythe, K. Overbeeke, A. Monk, and P. Wright, Eds. Springer Netherlands, 2005, pp. 31–42.
191

[29] M. H. Harun, “Integrating e-learning into the workplace,” Internet High. Educ., vol. 4, no. 3, pp. 301–310, 2001.
[30] K.-M. Chuah, C.-J. Chen, and C.-S. Teh, “Designing a desktop virtual reality-based learning environment with emotional consideration,” Res. Pract. Technol. Enhanc. Learn., vol. 6, no. 1, pp. 25–42, 2011.
[31] P. Zaharias, M. Belk, P. Germanakos, and G. Samaras, “User Experience in Educational Virtual Worlds,” in CHI 2011, 2011.
[32] A. Ferreira Szpiniak and C. V Sanz, “Un modelo de evaluación de entornos virtuales de enseñanza y aprendizaje basado en la usabilidad,” IV Congr. Tecnol. en Educ. y Educ. en Tecnol., pp. 382–392, 2012.
[33] D. H. Jonassen, J. Howland, J. Moore, and R. M. Marra, “Learning to solve problems with technology: A constructivist perspective,” 2002.
[34] K. B. Rager, “I Feel, Therefore, I Learn: The Role of Emotion in Self‐Directed Learning,” New Horizons Adult Educ. Hum. Resour. Dev., vol. 23, no. 2, pp. 22–33, 2009.
[35] R. J. MacFadden, “Souls on Ice: Incorporating Emotion in Web-Based Education,” J. Technol. Hum. Serv., vol. 23, no. 1–2, pp. 79–98, Aug. 2005.
[36] C. Wang, S. Ke, H. Chuang, H. Tseng, and G. Chen, “E-learning system design with humor and empathy interaction by virtual human to improve students’ learning,” in Proceedings of the 18th International Conference on Computers in Education. Putrajaya, Malaysia: Asia-Pacific Society for Computers in Education, 2010, pp. 615–622.
[37] S. Minocha and A. Reeves, “Interaction Design and Usability of Learning Spaces in 3D Multi-user Virtual Worlds,” in Human Work Interaction Design: Usability in Social, Cultural and Organizational Contexts, D. Katre, R. Orngreen, P. Yammiyavar, and T. Clemmensen, Eds. Springer Berlin Heidelberg, 2010, pp. 157–167.
[38] I. S. O. ISO, “IEC 25010: 2011: Systems and software engineering--Systems and software Quality Requirements and Evaluation (SQuaRE)--System and software quality models,” Int. Organ. Stand., 2011.
[39] P. Zaharias and A. Poylymenakou, “Developing a Usability Evaluation Method for e-Learning Applications: Beyond Functional Usability,” Int. J. Hum. Comput. Interact., vol. 25, no. 1, pp. 75–98, 2009.
[40] F. D. Davis, “Perceived usefulness, perceived ease of use, and user acceptance of information technology,” MIS Q., vol. 13, no. 3, pp. 319–340, 1989.
[41] P.-C. Sun, R. J. Tsai, G. Finger, Y.-Y. Chen, and D. Yeh, “What drives a successful e-Learning? An empirical investigation of the critical factors influencing learner satisfaction,” Comput. Educ., vol. 50, no. 4, pp. 1183–1202, May 2008.
[42] K. A. Pituch and Y. Lee, “The influence of system characteristics on e-learning use,” Comput. Educ., vol. 47, no. 2, pp. 222–244, 2006.
[43] R. Saadé and B. Bahli, “The impact of cognitive absorption on perceived usefulness and perceived ease of use in on-line learning: an extension of the technology acceptance model,” Inf. Manag., vol. 42, no. 2, pp. 317–327, 2005.
[44] E. W. T. Ngai, J. K. L. Poon, and Y. H. C. Chan, “Empirical examination of the adoption of WebCT using {TAM},” Comput. Educ., vol. 48, no. 2, pp. 250–267, 2007.
[45] J. M. Keller, “First principles of motivation to learn and e-learning,” Distance Educ., vol. 29, no. 2, pp. 175–185, Aug. 2008.
[46] J. Ouimette, D. W. Surry, A. Grubb, and D. A. Hall, “Essential books in the field of instructional design and technology,” Australas. J. Educ. Technol., vol. 25, no. 5, pp. 731–747, 2009.
[47] J. Xu, K. Le, A. Deitermann, and E. Montague, “How different types of users develop trust in technology: A qualitative analysis of the antecedents of active and passive user trust in a shared technology,” Appl. Ergon., no. 0, p. -, 2014.
[48] G. L. Urban, C. Amyx, and A. Lorenzon, “Online Trust: State of the Art, New Frontiers, and Research Potential,” J. Interact. Mark., vol. 23, no. 2, pp. 179–190, 2009.
[49] C. L. Corritore, B. Kracher, and S. Wiedenbeck, “On-line trust: concepts, evolving themes, a model,” Int. J. Hum. Comput. Stud., vol. 58, no. 6, pp. 737–758, 2003.
[50] J. Nilsen, R. Molich, C. Snyder, and S. Farrell, “E-Commerce User Experience: Trust,” Nielsen Norman Group, Fremont, CA, 2000. [Online]. Available: http://www.nngroup.com/reports/ecommerce-user-experience/. [Accessed: 03-Feb-2001].
[51] A. H. Maslow, R. Frager, and J. Fadiman, Motivation and personality, vol. 2. Harper & Row New York, 1970.
[52] P. Jordan, Designing pleasurable products: An introduction to the new human factors. CRC Press, 2000.
[53] L. Tiger, The Pursuit of Pleasure. New Brunswick, New Jersey: Transaction Publishers, 2000, p. 330.
[54] B. Gaver and H. Martin, “Alternatives: Exploring Information Appliances through Conceptual Design Proposals,” in Proceedings of the SIGCHI conference on Human factors in computing systems, 2000, vol. 2, no. 1, pp. 209–216.
[55] P. W. Jordan, “Pleasure With Products: Human Factors for Body, Mind and Soul,” in Human Factors in Product Design: Current Practice and Future Trends, W. Green and P. W. Jordan, Eds. CRC Press, 1999, pp. 206–217.
[56] P. M. A. Desmet, “Measuring emotion: Development and application of an instrument to measure emotional responses to products,” in Funology, Springer, 2005, pp. 111–123.
[57] L. Shen, M. Wang, and R. Shen, “Affective e-Learning : Using ‘Emotional’ Data to Improve Learning in Pervasive Learning Environment,” J. Educ. Technol. Soc., vol. 12, pp. 176–189, 2009.
[58] K. O’Regan, “EMOTION AND E-LEARNING,” J. Asynchronous Learn. networks, vol. 7, no. 3, pp. 78–92, 2003.
[59] B. Kort, R. Reilly, and R. Picard, “An affective model of interplay between emotions and learning: Reengineering educational pedagogy-building a learning companion,” in Advanced Learning Technologies, IEEE International Conference on, pp. 1–4.
192

[60] A. F. Aguirre, Á. P. Villareal, C. A. Collazos, Y. Méndez, I. Kafure, and R. Gil, “La Importancia del Factor Emocional en el Proceso de Evaluación de Usabilidad de Sistemas
Interactivos,” in LatinAmerican Conference on Networked and Electronic Media - LACNEM, 2010.
193

Evaluation of Disambiguation Mechanisms of
Object-Based Selection in Virtual Environment:
Which Performances and Features to Support “Pick Out”? Zouhair Serrar
1,2
Cadi Ayyad Univeristy
Nabil Elmarzouqi1,2
Cadi Ayyad University
Zahi Jarir2
Cadi Ayyad University
Jean-Christophe Lapayre3
Franche-Comté University
ABSTRACT
A 3D object selection technique is an essential building part of
interactive virtual environment system. This ability to choose
which object is the target for subsequent actions precedes any
further behavior. Selection mechanism as part of manipulation
process in a virtual environment is performed using different
techniques. Furthermore, many problems make selection a
difficult task and contribute to target ambiguity that leads users to
select wrong objects by mistake. Therefore, disambiguation
mechanisms have been proposed in the literature to solve target
ambiguity. In this paper, we present an evaluation study of
selection techniques that support disambiguation mechanisms.
We performed a comparative study of 4 selection techniques
including disambiguation mechanisms: Ray-Casting, Depth Ray,
SQUAD and Shadow Cone. We developed an automated test
environment where we varied scene density and measured the
performance of each selection technique. Our goal was to measure
the velocity of each technique, its sensitivity to occlusion, how
much navigation it required and how far it could select targets.
We found that discrete progressive refinement used in SQUAD
was the fastest solution when user acts in a scene containing few
objects to select. We also found that techniques that augment the
pointing metaphor by using a 3D cursor, such as Depth Ray and
SQUAD, performed better than ray casting itself or cone casting.
Categories and Subject Descriptors
H.5.2 [User Interfaces]: Evaluation/methodology, Interaction
styles, Theory and methods.
General Terms
Disambiguation mechanism, Virtual Environment, Measurement,
Performance, Experimentation
Keywords
Object Selection, Disambiguation Mechanism, 3D Virtual
Environment, Human-Computer Interaction.
1. INTRODUCTION In a virtual environment, users interact with virtual objects for all
intents and purposes to perform work related tasks and to
communicate with each other along with to entertain themselves.
In order to manipulate objects, users first need to choose the
accurate object using a selection technique. When selecting an
object, users inform the virtual environment that this object is
target of subsequent actions, including position, orientation and
information related to the object's properties. Because selection is
the first step in interaction with virtual worlds, any problem
during selection has direct drawbacks on interaction overall.
Nevertheless, in a genuine situation users face many issues when
attempting to select an object. These issues usually make the
selection more difficult, and often lead to a target ambiguity.
Therefore, the user selects the wrong object by mistake instead of
an agreed one. Some of these issues are due to the organization of
the virtual world. For example, ambiguity is more likely to happen
in dense environments where objects are numerous and close to
each other. Other issues are due to the limitation of the selection
technique in use.
Target ambiguity results in frustration for users because they have
to perform selection steps all over again to successfully select the
right object. A subset of selection techniques in the literature
proposes disambiguation mechanisms in an attempt to reduce or
completely remove ambiguity. Performances of these mechanisms
often depend on the situation presented to the user, and each
technique has its advantages and limitations. In this paper, we
present our comparative study of 4 selection techniques with
different disambiguation mechanisms: Ray-Casting [11], SQUAD
[9], Shadow Cone [14] and Depth Ray [7]. The objective of our
study is to evaluate the velocity of each technique, its ability to
select hidden and far-away targets and the distance covered
throughout the navigation to successfully select targets.
In the next section, we present with more details the problem of
ambiguity and we summarize the different solutions proposed in
the literature. Section 3 presents our experiment and the virtual
world we created to evaluate the different techniques. Section 4
presents our results. Finally, Section 5 and 6 presents a discussion
about our findings, thoughts of potential improvements and
perspectives of our future work.
1 National School of Applied Sciences of Marrakech, ENSA Marrakech, Cadi Ayyad
University. Avenue Abdelkarim Khattabi, BP 575, Guéliz, Marrakech, Morocco
2 LISI Laboratory, Computer Science Department, Faculty of Sciences, Cadi Ayyad
University, BP 2390, Marrakech, Morocco
3 FEMTO-ST/DISC UMR CNRS 6174, Computer Science for Complex Systems
Dept. Franche-Comté University, 16 route de Gray, 25030 Besançon Cedex, France
Permission to make digital or hard copies of all or part of this work for
personal or classroom use is granted without fee provided that copies are
not made or distributed for profit or commercial advantage and that
copies bear this notice and the full citation on the first page. To copy
otherwise, or republish, to post on servers or to redistribute to lists,
requires prior specific permission and/or a fee.
INTERACCIÓN’14, September 10–12, 2014, Puerto de la Cruz.
Tenerife. Spain
Copyright 2010 ACM 1-58113-000-0/00/0010 …$15.00.
194

2. Related Work When the target is ambiguous in a virtual environment, a user will
likely fail to capture it, and will capture another object instead by
mistake. An ideal scenario would be for the user to directly select
the object he has in mind, but that is not usually the case in virtual
worlds. Ambiguity is caused mainly by both the organization of
the scene’s objects and the mechanism of the selection technique.
To solve this problem, some techniques act on the layout of
objects and other parts of the running environment, while others
work on the intrinsic aspects of the technique itself.
2.1 Ambiguity caused by environment In a dense environment several objects share the same scene and
they are smoothly close to each other, so they are more likely to
be confused. The size of objects in a customary scene and their
geometry are also contributing factors to ambiguity. Therefore,
small objects require a more precise selection, while very big
objects are usually easier to select.
Some selection techniques change the location, scale or display of
objects to make selection easier. However, they apply these
adaptations in a different context because selection is not
supposed to change the issue of a virtual environment.
Changing the context is usually completed by reorganizing objects
in menus or lists. According to this technique, Flower Ray [7]
creates a marking menu of all objects crossed by a ray instrument,
SQUAD [9] recursively divides captured objects in a quad-menu,
Transparent Cylinder and Transparent Sphere [2] create a list
where each object is presented by its name. As for
Disambiguation Canvas [3], it uses a mobile display with touch
screen to display captured objects and disambiguate the target.
Changing the context may not work all the time, especially when
visually similar objects are captured at once, as noted by the
authors of SQUAD [9], or when names are not very relevant when
using a drop down list of object names.
2.2 Ambiguity caused by selection technique Selection techniques make use of geometric shapes called
“selection tools” to capture objects through intersection tests [1].
The most used selection tools are: 3D lines, cones, spheres, and
cubes. Each selection tool presents different challenges for
disambiguation because it can capture many objects at once.
Some techniques reduce ambiguity by giving users the ability to
manually change the selection tool's shape to adapt it to different
situations. By applying this technique commonly used by actors,
Aperture [5] lets the user changes the cone's base radius, a wider
cone is more tolerant to input instability but a narrower cone is
more precise and can select smaller objects more easily. Flexible
Pointer [4] goes forward this technique and casts a curved ray,
giving the user the ability to control the tangents of its Bezier
curve to get around obstacles.
Other techniques change the selection tool's shape for other
purposes: (a) to capture more objects in long range, (b) to
compensate for the lack of visibility and the inconvenience of
lower input device stability [9], (c) to get around obstacles and
reach hidden spots [4], or (d) to reduce the required precision of
performing a perfect hit on the target [6; 16]. The SQUAD [9]
makes the selection sphere bigger when its center is farther from
the user to capture more objects in long range, this helps reduce
the effect of instability and loss of precision of ray-casting at a far
distance. Bubble Cursor [6] changes the radius of its cursor to
contain one object at a time, it is the object that belongs to the
Voronoi cell where the cursor is located. Sticky Ray [16]
improves traditional ray-casting by removing the need to perform
an exact hit on the target and casts therefore a ray that bends
toward the closest selectable object.
Degrees-of-freedom (DoFs) provided by the technique to control
selection tools are, furthermore, a contributing factor to
ambiguity. The number of DoFs elucidates preeminent factors
related to complexity of a selection technique besides. If a user
controls multiple DoFs simultaneously, he is able to operate more
controls over the selection tool afterward. The troubles related to
the use of selection tool through 3D interaction disturb
nevertheless the accomplishment of a task. Therefore, tasks
become challenging and demand slightly more efficiency and
expertness. Pointing techniques generally use 5 DoFs, 3 for
moving the user's virtual hand, and 2 for orienting the virtual
pointer. Techniques that use a hand metaphor use 3 DoFs for
moving the cursor. Table 1 summarizes the number of DoFs
required by selection techniques in the literature. Some techniques
use more than one selection tools, iSith uses 2 rays in each hand,
giving the user 10 DoFs in total [18]. In Depth Ray and Lock Ray
techniques [7], a cursor is constrained to a virtual ray, the user
only needs one DoF to control the cursor, while still needing 5
DoFs to point the ray.
2.3 Disambiguation mechanisms The main occupation of a selection technique's disambiguation
mechanism is to choose the right object from a set of captured
objects in a virtual scene. This choice can be done manually by
the user, or by using a heuristic to rank objects, or by
continuously sensing the user's behavior and ranking objects
accordingly [1] as well.
Heuristic mechanisms operate in one step: when the user confirms
selection, the disambiguation mechanism immediately facilitates
the choice of an object. Many techniques use a closest-distance
heuristic. Ray-Casting [11] chooses the first object that intersects
the ray, it is the closest object to the ray's starting position.
Flashlight [10] chooses the closest object to the cone's apex and
central axis. Probabilistic Pointing mechanism [13] projects the
scene on a selection frustum, it uses a pixel count heuristic, where
the selected object is chosen according to the amount of pixels it
projects on the selection frustum.
In manual mechanisms, the user manually sorts objects
throughout the set of captured object. Some techniques present
the whole set of captured objects to the user in a menu or list (e.g.
Flower Ray [7], Transparent Cylinder/Sphere [2]). Improved
Virtual Pointer [15] uses an heuristic to create a list of closest
selectable objects. This mechanism gives users the ability to
navigate through a list of objects by choosing the next/previous
target.
Other manual mechanism use progressive refinement [9],
breaking selection down into many steps where the set of captured
objects is reduced, thus reducing the required precision of
pointing. SQUAD [9] uses discrete refinement, it breaks the
captured set down in 4 parts recursively, in each step, the user is
asked to choose one of the four quadrants of the quad-menu
where the target and eventually other objects are located. Shadow
Cone mechanism [14] uses continuous refinement, every object
that intersects the cone for the first time is captured, but once it
195

leaves the cone, it cannot be captured again until the end of the
selection process. When comparing Ray-Casting with SQUAD
[9], it was proven that SQUAD was more accurate and more
effective for selecting small targets, but it was slower in higher
scene densities due to the increasing number of selection steps.
Other disambiguation mechanisms are based on persistence of
pointing and score accumulation. These mechanisms maintain a
history of objects that are captured with the selection tool and
keep statistical data on each of them. This data describes the user's
behavior and is used to rank objects before selection confirmation.
Much like heuristic mechanisms, a behavioral mechanism selects
the highest ranked object upon selection confirmation. In Sense
Shapes [12], the algorithm of disambiguation records the time an
object spends in the selection tool's volume, the number of times
an object has entered or exited that volume, and how much of the
object's volume was contained in the selection tool. Smart Ray
mechanism [7] keeps a score for each object over time, increasing
it when the object crosses the selection ray, and decreasing it
when the object does not cross the ray.
In Table 1, we summarize the current state of the art of
disambiguation mechanisms used in selection techniques.
Table 1. Summary of disambiguation mechanisms in the literature
Type Technique Disambiguation
Context DoFs Selection tool Tool shape behavior
Manual
Shadow Cone [14] World 5 Cone Static
iSith [18] World 10
(5 for each hand) 2 Rays Static
SQUAD [9] Quad Menu 5 for pointing
2 for disambiguation Ray + Sphere Dynamic
Depth Ray [7] World
6
(5 for pointing + 1 for
moving depth marker)
Ray + Sphere Cursor Static
Lock Ray [7] World 5 for pointing
1 for disambiguation Ray + Sphere Cursor Static
Flower Ray [7] Marking Menu 5 for pointing
2 for disambiguation Ray Static
Starfish [17] World 3 3D cursor constrained to a
starfish shape
Static cursor +
Dynamic Starfish
Shape
Transparent
Cylinder [2] List
5 for pointing
2 for disambiguation Cylinder Static
Transparent
Sphere [2] List
3 for moving cursor
2 for disambiguation Sphere Static
Disambiguation
Canvas [3] Mobile Display 5
Volume Casting (Sphere and
Cone) Static
Flexible Pointer
[4] World
6
(5 for pointing + 1 for
bending ray)
Bendable Ray Dynamic
Improved Virtual
Pointer [15] World
6
(5 for pointing + 1 for
browsing)
Ray +
Bendable Ray for feedback Dynamic
Heuristic
Bubble Cursor [6] World 2
(Operates in 2D) 2D circle cursor Dynamic
Sticky Ray [16] World 5 Bendable Ray Dynamic
Probabilistic
Pointing [13] World 5 Cone Static
Flashlight [10] World 5 Cone Static
Aperture [5] World
6 (5 for pointing + 1
for changing the cone's
base radius)
Cone Dynamic
Ray-casting [11] World 5 Ray Static
Behavioral
Intent Select [8] World 5 Cone + Bendable Ray for
feedback Static
Sense Shapes [12] World 5
Volumetric Primitives
(spheres, cubes, cylinders
and cones)
Static
Smart Ray [7] World 5 Ray Static
196

3. Experiment
We created an evaluation environment to compare the
performances of four mechanisms: Ray-Casting [11], Depth Ray
[7], SQUAD [9] and Shadow Cone [14]. The objective of our
study is to find which technique is the fastest, and evaluate the
ability of each technique to select hidden targets and targets
placed at different distances from the user's viewpoint. For each
technique, we measured: (a) completion time, (b) number of
hidden targets selected, (c) total navigation distance required to
select target and (d) the distance to target upon selection
confirmation. We created a simulator that runs each technique
through the same selection scenario in 3 world configurations:
high-density, medium-density and low-density. We have collected
afterward performance data using each technique.
Figure 1 shows the layout of our virtual world. We organize
objects in a circular fashion; each object is a sphere with a radius
of 5 units. We have then 4 objects (in black) as distractors; their
purpose is to hide other objects, to increase ambiguity and to
make selection more difficult as well. The other 12 objects are
potential targets for selection. Only one of these is selectable at a
time, which makes the other 11 objects as temporary distractors.
There are 4 potential targets that are easily reachable from outside
the circle (in blue), 4 objects are partially hidden (in yellow) and 4
are rather well hidden (in green). The same spacing distance is
used between objects. Users could navigate left or right (blue
arrows) in a circle around objects.
Figure 1. World layout and navigation model.
We created 3 levels of density for selection scenario (see Figure
2). Many factors define world density: (a) distance of objects to
each other, (b) number of objects in the world and (c) differences
between objects sizes and shapes. For our study, we change our
world's density by changing the spacing distance between objects.
In a high-density environment, objects are very close to each
other, while in a low-density environment, objects are far away
from each other. In this study, we consider a spacing of 1 unit for
high density, 5 units for medium density and 10 units for low
density.
We include navigation to let the environment change the user's
point of view during selection. We take advantage of the circular
layout of the evaluation environment to constrain navigation to a
circle. A user could only navigate left or right, like a train would
move on railroads, thus only he needs one additional DoF to
navigate. Figure 1 shows the circular navigation track, which is,
located 10 units away from objects.
Figure 2. World densities we used.
(left to right) a) high-density b) medium-density, c) low-density
Figure 3 A user (blue cone) trying to select a target (in pink)
using Ray-Casting
3.1 Simulation We created an automated test environment to reproduce the use of
selection techniques (Figure 4). Our simulator starts by
positioning the user's viewpoint at a starting position of 0° on the
navigation circle, then uses a selection technique to select targets.
When the simulator could not select a target from its current
position on the navigation circle, it navigates with a step of 10°
and performs another attempt from there. We evaluated all four-
selection techniques using the same scenario. The application
chooses one target at a time from the 12 potential targets. Each
time a new target is chosen, the simulator attempts to select it. The
application chooses the next target once the simulator has
successfully performed selection, or made a complete exploration
around the world’s objects without succeeding.
A common property of selection techniques we evaluated is that
they are all pointing techniques. Our simulator sweeps out the
area in front of the user's viewpoint, starting from a relative angle
of 30° to an angle of 150° in the user's local space, with a step of
10°.
When running Ray-Casting, the simulator casts a ray from the
position of the user toward the pointing direction. It performs a
hit-test to capture the first object that the ray goes through, and
compares this object with the target. For Depth Ray, every time
the simulator points at a new direction, it moves a depth marker, a
sphere of 0.5 units of radius, along the ray with a step of 5 units
until it hits the end of the ray, while performing hit-tests along the
way.
However, when running SQUAD mechanism, the simulator casts
a ray and places a selection sphere at the intersection of the ray
and the stand surface on which all objects were placed. The
simulator sweeps out the environment with a step of 10 units. The
sphere becomes bigger when the intersection point gets farther
from the user's position to capture more objects, and gets smaller
197

when the intersection point is closer to the user's position, with a
minimum radius of 10 units and a maximum radius of 30 units.
Finally, when running Shadow Cone mechanism, the simulator
casts a cone with a base radius of 5 units. The simulator keeps a
list of captured objects, and a blacklist of objects to not pick them
out again. It starts pointing from the minimum to the maximum
pointing angle until the target is inside the cone. Then it points
further while checking if the target will still be inside the cone in
the next step. If the target is about to get out of the cone, the
simulator sweeps in the opposite direction until the target is about
to be lost again. While pointing, each lost object is added to the
blacklist, and each captured object that does not exist in the
blacklist is added to the capture list. At the end of selection, only
the target must remain in the list of captured objects.
3.2 Automated simulator versus real user In a virtual environment that implicitly allows interactivity and
where objects can be selected, many factors affect the
performance of selection mechanisms and must be quietly
included in the design of the virtual environment. We can classify
these factors in two main categories: human factors and machine
factors.
Performance of a human user can vary with the kind of provided
interface. An interface that require more efforts can lead to
powerlessness or tiredness, thus causing the user to make more
mistakes and take more time to complete tasks. Moreover, such
interfaces can be perceived by users as being tedious and
unpleasant. Another example is the perception of depth in the 3D
world; some users are more familiar with perspective projection
and depth in 3D scenes than others.
In our study, we did not focus on human aspects of interaction.
We evaluated the performance of disambiguation mechanisms
from the point of view of selection algorithms used and the
intrinsic aspects of each technique. For this purpose, we created
automated agents that use each selection technique in an attempt
to select targets. Our automated simulator behaves as closely as
possible to a real user in the way that every action is continuous
and has a cost. Continuity of actions means that the simulator
cannot "teleport" to a given location, instead, it moves with a
predefined step. Also, the simulator could only perceive through
the viewpoint of its virtual avatar represented by a cone (see
Figure 3).
Our simulator may mimic the behavior of a "perfect" human user,
however, this has no incidence in our study because we are more
interested by the difference of performance between
disambiguation mechanisms, rather than the absolute performance
of each mechanism taken individually.
3.3 Implementation We created a 3D virtual environment prototype that we used to
create selection scenarios and evaluate performances of
disambiguation mechanisms. The experimental software was
written in C++ using OpenGL (http://www.opengl.org/) for 3D
rendering and Bullet Physics (http://bulletphysics.org/) for
collision detection. It ran under Microsoft Windows 8.1 64 bits on
a personal computer with an Intel Core i5-3317U CPU at
1.70GHz and 4 Go of RAM. The frame rate was fixed at 60
frames per second.
3.4 Measurements
3.4.1 Completion time
We calculated the velocity of each selection technique by
measuring the necessary time for the simulator to acquire targets.
We assigned points for each user action during selection and
navigation (see Table 2) and we measured the overall completion
time using these points.
Table 2. Time cost for each user action
Action Time Cost (points)
Pointing 20
Navigation 10
Depth Marker Movement 5
SQUAD Menu Selection 10
3.4.2 Distance traveled
Sometimes navigation is necessary to get a better angle at the
target. Selection techniques that are sensitive to occlusion require
navigation more than others. The best techniques are those that do
not require navigation at all. The simulator navigates to a new
position whenever it fails in selecting a target. We measured the
traveled distance from the starting position (0° on the navigation
circle) to the position where eventually the target was selected.
3.4.3 Distance to target
We evaluated the ability of each selection technique to select far-
away targets by measuring the distance between the user's
viewpoint and a target whenever the simulator acquired one.
We configured all selection tools so that they have equal chances
to select targets at the other end of the environment: rays used by
Ray-Casting, Depth Ray and SQUAD, and the cone used by
Shadow Cone have a length equal to twice the radius of the
navigation circle.
Figure 4. Selection tools of Ray-Casting, Depth Ray,
Shadow Cone and SQUAD
198

3.4.4 Hidden targets selected
We evaluated the sensitivity of each technique to occlusion by
measuring the number of targets that were hidden from the user's
viewpoint when they were selected.
4. Results
In this section, we present results of the simulation scenarios
using selection mechanisms. We use the following abbreviations
in figures: High Density (HD), Medium Density (MD) and Low
Density (LD).
In this study, four performance factors are studied: velocity,
distance traveled, distance to target and hidden target selected.
Moreover, we focus on three density levels: high, medium and
low, which present three genuine situations in a virtual
environment. A repeated measures within-participant design was
used.
We will report whether or not mechanisms are so fast to reach the
target and therefore the acquired velocity within the completion
time. We will also report the distance traveled and the distance to
target, as metrics to evaluate which mechanism requires
navigation more than others especially to select far-away objects.
Furthermore, we will report how the studied mechanisms manage
the occlusion problem by involving objects that are hardly
discernible in appearance.
We will detail the performance factors and environment features
in the discussion section.
4.1 Completion time Average completion times of evaluated techniques are shown in
Figure 5. SQUAD was the fastest technique (p<.0001), with an
average cost of 128 points in heavy-density, 202 points in
medium-density and 276 points in low-density.
Shadow Cone was the slowest technique, with a cost of 7538
points in heavy-density, approximately 58 times more than
SQUAD (p<.001). However, Shadow Cone performed ~31%
better than Depth Ray on average in low-density.
Shadow Cone was the only technique that took significantly
longer in heavy density compared to itself in other densities
(p<.01), with ~26.9% more time than in medium density, and
~53.15% more time than in low density. Ray Casting followed the
same trend, with the exception that it was on average ~3.81%
faster in high-density compared to medium-density.
Other techniques, on the contrary, performed better in heavy
density when compared to medium or low density. Depth Ray was
~27.19% faster in heavy density compared to medium density,
and ~45.56% faster in heavy density compared to low density.
SQUAD followed the same trend, being ~53.62% faster in high
density compared to low density, and ~36.63% faster in high
density compared to medium density.
Figure 5. Average completion times in different densities
4.2 Distance traveled We measured the distance that each algorithm traveled to
successfully acquire targets. Figure 6 shows average distance
traveled using each technique in different world densities. Depth
Ray and SQUAD did not require navigation, with 0 distance
traveled in all three-world densities.
Shadow Cone and Ray-Casting did require navigation. Shadow
Cone performed worse than Ray-Casting (p<.0001), by an average
of ~81.23% more distance in heavy-density, ~74.33% more
distance in medium-density, and ~79.66% more distance in low-
density.
Shadow Cone performed significantly better in lower densities
compared to itself (p<.03), with a 47.56% difference on average
between heavy and low density. Ray Casting performed 4.61%
better on average in heavy density compared to itself in medium
density, and it traveled almost half the distance in low density.
Figure 6. Average distance traveled in different densities
199

4.3 Distance to target We measured the distance between the user and the target
whenever a target was selected (Figure 8). SQUAD and Depth
Ray performed similarly, with an average distance to target of ~27
units in heavy density, ~36 units in medium density and ~47.36
units in low density.
Ray Casting performed slightly worse than SQUAD and Depth
Ray on average with ~7.34% less distance in low density,
~20.17% less distance in medium density, and 15.17% less
distance in heavy density.
Of all techniques, Shadow Cone performed the worst (p<.0001),
with a distance to target of ~8.44 units in heavy density, ~10.56
units in medium density, and 20.75 units in low density. The
closest Shadow Cone could get to other techniques is in low
density when compared to Ray-Casting in heavy density, where
Ray-Casting performed ~9.25% better than Shadow Cone.
Figure 8. Average distances to target in different densities
4.4 Hidden targets selected
Figure 7 shows how many of the 12 potential targets our
simulator successfully selected without a clear line of sight
between the target and the user's viewpoint.
Depth Ray and SQUAD selected 7 hidden targets (58.33% of
selectable objects) in all densities, Ray-Casting selected none, and
Shadow Cone selected 1 target both in medium and low density,
but none in heavy density.
5. Discussion
We compared the disambiguation mechanisms of Depth Ray, Ray-
Casting, SQUAD and Shadow Cone. This study is part of an
evaluation of disambiguation mechanisms for object selection; the
main objective of the current evaluation is to find which
techniques perform better in different situations. We varied the
closeness of objects to each other, and the selection technique,
while keeping the same world configuration, and the same
selection scenario.
Our results show that SQUAD, a discrete progressive refinement
technique, is the fastest. This result is partially due to the number
of objects in our environment. In the worst case scenario, SQUAD
would capture all 16 objects, including distractors, and the
required number of steps in the quad-menu would be log4(16) = 2.
This is a rather small number, and we expect SQUAD to be
slower with more objects. The velocity of the technique is also
due to sphere casting performed on the plane supporting objects;
it allowed the simulator to capture hidden targets without
additional navigation. Moreover, the fact that the sphere got
bigger at longer ranges helped capturing more objects.
Shadow Cone is also a progressive refinement technique, but it
performed worse than the other techniques. It was the slowest due
to the heavy amount of pointing it required, and because it
required more navigation than the other techniques. The technique
also required the user to be closer to the target. The refinement of
Shadow Cone could be more effective with a shorter cone.
Additionally, we believe that navigation could be advantageous
during the selection process, not as an alternative solution when
the selection fails.
Ray Casting was faster than Depth Ray and Shadow Cone, due to
the fact that it uses a one-step selection relying on a closest
distance heuristic. Ray-Casting's completion time was mainly
spent navigating around the world to get a better angle at the
target. This is due to the fact that Ray-Casting is very sensitive to
occlusion and cannot select hidden targets.
Depth Ray was not as fast as SQUAD. Both techniques did not
require navigation; Depth Ray's longer completion time was due
to the movement of the depth marker. SQUAD's sphere casting
was faster. The instant projection of the sphere was the reason
why SQUAD was faster than Depth Ray. In our implementation
of Depth Ray, the depth marker moves with a constant velocity. A
direct mapping between the user's input device and the position of
the depth marker could make the technique of Depth Ray faster.
However, SQUAD's assumption is that objects are placed on a
platform, like shelves in a grocery store, this is not usually the
case of virtual objects in general as they can be floating in the air
or placed randomly around the world. Even though Depth Ray
and SQUAD had different completion time, both techniques were
faster when the objects in the world got closer to each other.
Depth Ray and SQUAD augment traditional ray casting by adding
a 3D cursor to the pointing metaphor, they performed better than
cone casting or traditional ray casting itself. The 3D cursor in
Depth Ray is a depth marker constrained to the length of the ray,
while for SQUAD it is a sphere centered at the intersection of the
ray with a horizontal surface. Depth Ray and SQUAD had the best
overall performances in our study. Table 1 shows that both
techniques require at least 5 DoFs, and have different
disambiguation contexts: Depth Ray works in the virtual world
while SQUAD creates a different context represented by a quad
menu. Also, Depth Ray keeps a static selection tool shape while
Figure 7. Total hidden targets selected in different densities
200
SQUAD dynamically changes it. Our findings prove that the
performance of a selection technique does not depend on
disambiguation context nor on the behavior of the selection tool's
shape.
6. Conclusion
We performed an automated evaluation of four disambiguation
mechanisms used in Ray-Casting, SQUAD, Depth Ray and Shadow
Cone using scene simulation within different levels of object’s
densities. The techniques proposed in the literature have different
performances according to the situation presented to users; each
disambiguation mechanism has its advantages and limitations.
Instead of looking for the perfect mechanism, we could create a
smart selection technique that would adapt its disambiguation
mechanism to the situation presented to the user, maximizing
effectiveness, ease of use, and efficiency of disambiguation.
In our study, we focused mainly on manual disambiguation; we
plan to evaluate more disambiguation mechanisms in the future
from manual, heuristic and behavioral approaches. Disambiguation
is one of several aspects of selection technique; other aspects like
user interface and control-display ratio are also important and can
affect performances. We plan to perform a user study to explore
further aspects of selection such as display of objects and user
interface as well as their influence on velocity and occlusion
management.
7. REFERENCES [1] ARGELAGUET, F. and ANDUJAR, C., 2013. A survey
of 3D object selection techniques for virtual environments.
Computers & Graphics 37, 3 (5//), 121-136. DOI=
http://dx.doi.org/http://dx.doi.org/10.1016/j.cag.2012.12.003.
[2] DANG, N.T., HONG-HA, L., and TAVANTI, M., 2003.
Visualization and interaction on flight trajectory in a 3D
stereoscopic environment. In Digital Avionics Systems Conference,
2003. DASC '03. The 22nd, 9.A.5-91-10 vol.92. DOI=
http://dx.doi.org/10.1109/DASC.2003.1245905.
[3] DEBARBA, H., GRANDI, J., MACIEL, A., NEDEL, L.,
and BOULIC, R., 2013. Disambiguation Canvas: A Precise
Selection Technique for Virtual Environments. In Human-
Computer Interaction – INTERACT 2013, P. KOTZÉ, G.
MARSDEN, G. LINDGAARD, J. WESSON and M. WINCKLER
Eds. Springer Berlin Heidelberg, 388-405. DOI=
http://dx.doi.org/10.1007/978-3-642-40477-1_24.
[4] FEINER, A.O.S., 2003. The flexible pointer: An
interaction technique for selection in augmented and virtual reality.
In Conference supplement of ACM symposium on user interface
software and technology, 81-82.
[5] FORSBERG, A., HERNDON, K., and ZELEZNIK, R.,
1996. Aperture based selection for immersive virtual environments.
In Proceedings of the Proceedings of the 9th annual ACM
symposium on User interface software and technology (Seattle,
Washington, USA1996), ACM, 237105, 95-96. DOI=
http://dx.doi.org/10.1145/237091.237105.
[6] GROSSMAN, T. and BALAKRISHNAN, R., 2005. The
bubble cursor: enhancing target acquisition by dynamic resizing of
the cursor's activation area. In Proceedings of the Proceedings of
the SIGCHI Conference on Human Factors in Computing Systems
(Portland, Oregon, USA2005), ACM, 1055012, 281-290. DOI=
http://dx.doi.org/10.1145/1054972.1055012.
[7] GROSSMAN, T. and BALAKRISHNAN, R., 2006. The
design and evaluation of selection techniques for 3D volumetric
displays. In Proceedings of the Proceedings of the 19th annual
ACM symposium on User interface software and technology
(Montreux, Switzerland2006), ACM, 1166257, 3-12. DOI=
http://dx.doi.org/10.1145/1166253.1166257.
[8] HAAN, G.D., KOUTEK, M., and POST, F.H., 2005.
IntenSelect: using dynamic object rating for assisting 3D object
selection. In Proceedings of the Proceedings of the 11th
Eurographics conference on Virtual Environments (Aalborg,
Denmark2005), Eurographics Association, 2386013, 201-209.
DOI= http://dx.doi.org/10.2312/egve/ipt_egve2005/201-209.
[9] KOPPER, R., BACIM, F., and BOWMAN, D.A., 2011.
Rapid and accurate 3D selection by progressive refinement. In 3D
User Interfaces (3DUI), 2011 IEEE Symposium on IEEE, 67-74.
[10] LIANG, J. and GREEN, M., 1994. JDCAD: A highly
interactive 3D modeling system. Computers & Graphics 18, 4,
499-506.
[11] MINE, M., 1995. Virtual environments interaction
techniques. Technical Report TR94-018. University of North
Carolina at Chapel Hill.
[12] OLWAL, A., BENKO, H., and FEINER, S., 2003.
SenseShapes: Using Statistical Geometry for Object Selection in a
Multimodal Augmented Reality System. In Proceedings of the
Proceedings of the 2nd IEEE/ACM International Symposium on
Mixed and Augmented Reality (2003), IEEE Computer Society,
946836, 300.
[13] SCHMIDT, G., BAILLOT, Y., BROWN, D.G.,
TOMLIN, E.B., and SWAN, J.E.I., 2006. Toward Disambiguating
Multiple Selections for Frustum-Based Pointing. In Proceedings of
the Proceedings of the IEEE conference on Virtual Reality (2006),
IEEE Computer Society, 1130537, 129. DOI=
http://dx.doi.org/10.1109/vr.2006.133.
[14] STEED, A. and PARKER, C., 2004. 3d selection
strategies for head tracked and non-head tracked operation of
spatially immersive displays. In 8th International Immersive
Projection Technology Workshop, 163-170.
[15] STEINICKE, F., ROPINSKI, T., and HINRICHS, K.,
2005. Multimodal Interaction Metaphors for Manipulation of
Distant Objects in Immersive Virtual Environments. In WSCG
(Short Papers), 45-48.
[16] STEINICKE, F., ROPINSKI, T., and HINRICHS, K.,
2006. Object selection in virtual environments using an improved
virtual pointer metaphor. In Computer Vision and Graphics
Springer, 320-326.
[17] WONNER, J., GROSJEAN, J., CAPOBIANCO, A., and
BECHMANN, D., 2012. Starfish: a selection technique for dense
virtual environments. In Proceedings of the Proceedings of the
18th ACM symposium on Virtual reality software and technology
(Toronto, Ontario, Canada2012), ACM, 2407356, 101-104. DOI=
http://dx.doi.org/10.1145/2407336.2407356.
[18] WYSS, H.P., BLACH, R., and BUES, M., 2006. iSith -
Intersection-based Spatial Interaction for Two Hands. In
Proceedings of the Proceedings of the IEEE conference on Virtual
Reality (2006), IEEE Computer Society, 1130531, 123. DOI=
http://dx.doi.org/10.1109/vr.2006.93.
201